Article

Research on Load Disturbance Based Variable Speed PID Control and a Novel Denoising Method Based Effect Evaluation of HST for Agricultural Machinery

1
Department of Vehicle Engineering, Nanjing Forestry University, Nanjing 210037, China
2
College of Engineering, Nanjing Agricultural University, Nanjing 210031, China
*
Author to whom correspondence should be addressed.
Agriculture 2021, 11(10), 960; https://doi.org/10.3390/agriculture11100960
Submission received: 24 August 2021 / Revised: 25 September 2021 / Accepted: 29 September 2021 / Published: 2 October 2021

Abstract

:
This paper aims to realize and improve the constant speed control performance of tractors with HST (Hydrostatic Transmission) variable speed units. To achieve this, based on the HST test bench of the tractor, we perform a verification test of the adjustable speed characteristics, a denoising filter test of the response signal, a test on the influence of the load disturbance on the adjustable speed characteristics and a PID-based constant speed performance detection test. The results of the verification test of the adjustable speed characteristics show that the theoretical value and actual value of the adjustable speed transmission characteristics of the HST used are essentially consistent with each other. The results of the test of the load disturbance’s influence on the adjustable speed characteristics show that the increase in load torque inhibits the HST output response. Therefore, the paper proposes and designs a PID-based closed-loop constant speed control system. The paper uses a step response test and a load disturbance test to research the control result of the constant speed system. Collecting and analyzing all test results, we find that the constant speed control based on PID has a very good result. The average error between the average HST output speed and the target speed set was 0.37%, and the average standard deviation of output speed was 1.18 rpm. In addition, the paper proposes a denoising method combing the empirical mode decomposition method and the Gaussian distribution determination. The method shows that the first two orders of the components of the HST response signal should be removed as noise. The paper uses the denoised signal and the partial least squares method to analyze the influencing factors of the constant speed control result. The analysis results show that the rate of change of load torque has the biggest influence on the stability of HST output speed, followed by the target value.

1. Introduction

With the continuous development of agricultural modernization and intelligence levels, studies on the techniques of agricultural machinery, such as tractors, are increasingly improved [1,2,3,4,5,6]. Tractors generally work in the conditions of severe environment and variable load. Working steadily, as well as adapting to load changes and a wide variation range of speeds, compose the technical requirements for tractors to work in various working conditions, and meet the technical requirements of modernized precision agriculture on tractors’ operating speed and power output. The application of the HST (Hydrostatic Transmission) can meet the abovementioned technical requirements of tractors [7].
The HST can realize the free changes of output speed in the working range through a pump-motor system and is a continuously variable speed transmission unit [8]. The HST has the advantages of the hydraulic transmission system (compact structure, smooth transmission, strong carrying capacity and so on) [9] and reduces the driver’s intensity of work through the electronic control technology (the tractor has a great number of gear states, and the traditional mechanical transmission has an impact during gear shifts [10,11]).
Currently, most studies on tractors’ continuously variable speed transmission focus on the HMCVT (Hydromechanical Continuously Variable Transmission) [12,13,14,15]. However, the HMCVT generally has a large volume compared with the HST, so the HST can better meet the lightweight requirement. Moreover, the HMCVT has a complicated transmission structure, while the HST can realize a large range of continuously variable speeds through the combination of itself and the mechanical transmission box. To date, there have been few studies on the HST of tractors. Ren et al. [16], Jiang et al. [7], Liu et al. [17], Zhao et al. [18] and Kim et al. [19] researched the efficiency characteristics, fuel economy, dynamic system’s design, and matching and constant speed cruise control of the HST for tractors, respectively. However, the studies focused less on the open/closed-loop variable speed control of the tractor HST in the high-load working range. The tractor has different working loads in the field operation and transportation operation, and the constant-speed running is a key index representing the performance of the tractor. In addition, the working load of the tractor influences the adjustable speed transmission characteristics of the HST in the open-loop control mode. In this case, the HST’s output adjustable speed characteristics are not unique if there is no HST closed-loop feedback control system.
The signals measured and collected with the sensor have varying degrees of noise. To make the measured signals applicable to engineering technologies more accurately (for instance, the evaluation of the control system effect applied in the research), it is necessary to filter the measured signals obtained. The classical denoising methods (such as the wavelet denoising, which has been widely applied [20,21,22]) can achieve a good denoising result in certain conditions. However, the methods primarily depend on the setting of the empirical parameters. If the parameters set in advance are not reasonable, then the signals may still have a lot of noise after denoising or the useful signals may be mistakenly removed. The empirical mode decomposition method (EMD) [23,24,25] does not require a choice of primary function and is an adaptive signal decomposition method. However, when using the EMD, there will be a series of intrinsic mode functions obtained, of which some should be removed (i.e., the noise signals) and some should be reserved (i.e., the real signals). Therefore, how to choose and reserve reasonable intrinsic mode functions is the key scientific problem in the research.
Therefore, the paper researches the variable speed control of the HST of tractors with different loads, and analyzes and evaluates the variable speed control effect. Specifically, the paper first performs the open-loop control test with different loads using the HST test bench of the tractor built, and compares the test results with the theoretical results. Next, the paper performs the PID control test of the tractor HST in different loading conditions. In addition, the paper proposes a denoising method combined the EMD (Empirical Mode Decomposition), the Gaussian distribution probability density function fitting (GD-PDF-F) and the skewness-kurtosis test. Finally, according to the measured results of the tests and based on the PLS (Partial Least Squares), the paper evaluates and analyzes the PID control results in different working load ranges. The paper aims to offer a valuable reference for future studies on the control system design, strategy development, unmanned work and precision agriculture of the continuously variable transmission unit of the tractor.

2. Materials and Methods

2.1. Working Principle of HST Used

Tractors with HST are generally composed of a diesel engine (a battery powered tractor’s power source is the motor), a hydrostatic continuously variable transmission, a mechanical transmission box and a driving wheel (Figure 1).
The researched HST is composed of a variable-pump constant-motor system; gear pairs i1, i2 and i3; and a clutch C0. When the tractor works, the engine’s overall power is input into the variable pump through gear pairs i1 and i2 and then output through the constant motor. When clutch C0 connects the parts, the output power of constant motor is transmitted to the next transmission part (the mechanical transmission) through gear pair i3.
In the paper, the researched HST uses a swash-plate axial plunger pump. The mechanism adjusts the angle of swash plate of plunger pump through the variable control mechanism to change the displacement of the pump [26,27]. The motor is a constant plunger motor. Therefore, when the input speed of pump is constant (i.e., the output speed of tractor’s engine is constant), the motor speed changes through the adjustment of displacement. Figure 2 shows a feasible operating principle of the angle variation of the swash plate of the variable pump.
The system uses the PWM (Pulse Width Modulation) to control the electronic proportional pressure relief valve and then affect the oil pressure in the left and right oil chambers of variable plunger. Meanwhile, the variable plunger may spontaneously move to the left or the right until the oil pressure in the chamber is balanced with the load spring force. In the process, the angle of the swash plate of the variable pump is driven and then changed. When ignoring the leakage of hydraulic system, the constant motor’s speed is:
ω M = D P ω P D M ,
in which ω M is the speed of constant motor, D P is the displacement of variable pump with a certain angle of swash plate, D M is the displacement of constant motor and ω P is the operating speed of variable pump.
Theoretically, according to Equation (1), the constant motor’s output speed is jointly decided by the variable pump’s working speed and displacement. When the working speed of the variable pump is constant, the output speed of the constant motor is directly proportional to the displacement of the variable pump with a certain angle of the swash plate. Define the pump-motor displacement ratio ε = D P / D M , and then Equation (1) can be transformed to:
ω M = ε ω P ,
According to the transmission route of the output power of the engine through the HST in Figure 1, with Equation (2), derive the theoretical adjustable speed transmission characteristics (the change relational expression of pump-motor system displacement and HST transmission ratio) of the type of HST as follows:
i H S T = i 1 i 2 i 3 ε ,

2.2. Build the HST Variable Speed Control Test Bench of the Tractor

Figure 3 shows the HST variable speed control test bench built of the tractor.
The test bench uses the speed torque sensors of the ZJ-2000A model and ZJ-5000A model of Lanling Jiangsu (the company: Jiangsu Lanmec Electromechanical Technology Co., Ltd., the city: Hai’an, the country: China). Table 1 provides the ranges of speed and torque.
The test bench uses the variable displacement plunger pump of the HPV-02 model of Linde with the displacement of 55 cm3/rev, and the constant motor of the HMF-02 model of Linde with the displacement of 55 cm3/rev. Table 2 and Table 3 provide the main technical parameters of the variable pump and constant motor.
Using the PID control to realize the closed-loop adjustment of the speed ratio of the variable-pump constant-motor system, we can improve the system’s response rate, reduce the overshoot that may exist in the system, overcome the system’s response oscillation and eliminate certain static errors [28,29]. As one of the most widely used control technologies, the PID control, can realize the closed-loop control with an ideal result to a large extent, if it obtains good parameter values after the matching and adjustment.
Figure 4 shows the schematic diagram of the output speed closed-loop PID control of the variable-pump constant-motor system.
The PID controller’s input is the difference between the output speed and target speed of the continuously variable speed system. The controller’s output acts on the electrical signal of the electronic proportional valve. The control electrical signal can adjust the angle of the swash plate of the variable pump, change the overall output speed of the variable speed system through the change of constant motor end speed, and further reduce and eliminate the system error. Figure 5 shows the control principle of the bench test (the interface design for the PID controller uses the software LabVIEW, version: 2018, the company: National Instruments, the country: Austin, TX, USA).

2.3. Tractor HST Variable Speed Control Test

2.3.1. Comparative Verification of the Tractor HST Adjustable Speed Transmission Characteristics

For a power variable transmission unit, the adjustable speed transmission characteristic is important to the core performance [30,31,32]. To compare and verify the consistency between the theoretical and actual adjustable speed transmission characteristics of the researched and designed HST system, the paper uses the HST variable speed control test bench of the tractor to measure the actual adjustable speed transmission characteristics. According to Equation (3), suppose i 1 i 2 i 3 form a whole, and then the HST adjustable speed transmission characteristics have a single-parameter model. To cover the overall change range of the displacement ratio of the variable-pump constant-motor system, we chose 0.2, 0.25, 0.3, 0.375, 0.5, 0.625, 0.75 and 1 as the values of the displacement ratio ε , respectively (totaling 8 groups of tests). Each test considers the average HST transmission ratio as the statistical result. In the experiment, we took any fixed working speed of engine and verified whether the velocity situation of engine speed was reasonable. Meanwhile, the test aims to research the consistency between the theoretical and actual adjustable speed characteristics in the open-loop control. However, the working condition with load can affect the system’s output response (see Section 2.3.3 and Section 3.3.2 for details). Therefore, the test does not add an additional load to the system.

2.3.2. PID-Based HST Constant Speed Control Step Response Test of the Tractor

The paper analyzes the HST constant speed control result of the tractor through the HST step response test of the tractor [33]. The constant speed cruise control system for agricultural machinery generally controls the signal system input. For tractors with HST, using the accelerator to change the transmission ratio is a common way to adjust the speed [18]. Tractors mainly work in low-speed driving conditions, and there is a need to consider the starting speed requirement of the tractor. In the test, we set the target output speed of continuously variable speed system as 25.75 rpm, 51.50 rpm, 77.25 rpm and 103.00 rpm, respectively (consider 25.75 rpm as the arithmetic sequence of tolerance). In the test, we took any fixed working speed of engine and verified whether the volatility of engine speed was reasonable.
See the previous research [34] for the form and experimental verification of the transfer function of the HST system used in the research and the design process of the PID controller. The system’s transfer function is in a 4-order-denominator, 1-order-numerator form. The verification result of the test based on the area method and the I-SA shows [34] that the transfer function in the 4-order-denominator and 1-order-numerator form is highly consistent with the actual measurement system. The coefficients of determination of five groups of tests are generally higher than 0.99.

2.3.3. PID-Based HST Constant Speed Control Test with Load Disturbance of the Tractor

In the work of the tractor, the load changes continuously, i.e., the load is not constant. According to the values of the continuous torque and maximum output torque of the constant motor in Table 3, we set the change range of load torque of the HST output end as 0–300 N•m. In the test, we set the target output speed of continuously variable speed system as 25.75 rpm, 51.50 rpm, 77.25 rpm and 103.00 rpm, respectively (the arithmetic sequence with the tolerance of 25.75 rpm). The test aimed to prove that the HST adjustable speed characteristics change as the load changes in the state of open-loop control, and to further confirm the closed-loop PID control’s load adaptive effect and its importance for tractors’ constant-speed cruise control. We added a group to the open-loop control test (the HST’s output speed was 25.75 rpm, and the load torque’s change range was 0–300 N•m).

2.4. The Comparative Analysis Method for the HST Adjustable Speed Transmission Characteristics

The paper uses the coefficient of determination R 2 and the mean absolute percentage error MAPE for the analysis and evaluation. The following is the calculation formula of coefficient of determination R 2 .
R 2 = 1 i = 1 n [ y m e a s u r e d y i d e a l ] 2 i = 1 n [ y i d e a l ( i = 1 n y i d e a l ) / n ] 2 ,
in which y i d e a l is the theoretical value of HST system output of tractor, y m e a s u r e d is the measured value of bench test and n is the total number of tests with different values of displacement ratio ε .
The following is the calculation formula of the mean absolute percentage error MAPE.
M A P E = 1 n i = 1 n | y m e a s u r e d y i d e a l y i d e a l | × 100 % ,

2.5. The Denoising Method Based on the EMD and the Gaussian Distribution Determination

To make the effect evaluation and analysis of PID control test more consistent with the actual situation, it is necessary to conduct a filtering process for the measured signal. The EMD, as an adaptive signal decomposition method, is slightly different from the traditional denoising methods (most of which depend on the setting of empirical parameters) [35,36,37]. Through the loop iteration calculation [38], the EMD decomposes the original signal x ( t ) into a series of IMF (Intrinsic Mode Function), as shown in Equation (6).
x ( t ) = i = 1 m c i ( t ) + r 0 ( t ) ,
in which m is the number of IMF after the decomposition of EMD, c i ( t ) is the IMF obtained after decomposition and r 0 ( t ) is the trend function, i.e., the allowance.
Generally, suppose the useful signal is the low-frequency signal and the noise is the white noise. Therefore, the high-frequency IMF should be removed. As for the research object, its system noise characteristics are unknown, so it is difficult to determine the IMF to be removed. In this case, the paper proposes an EMD-Gaussian-distribution-determination denoising method. The method first decomposes the original signal based on EMD, and then performs the Gaussian distribution probability density fitting (the GD-PDF-F) and the skewness-kurtosis test for every order of the IMF component after the decomposition [39]. If any order of the IMF component shows a good fitting result and passes the skewness-kurtosis test, it indicates that the IMF component meets the Gaussian distribution and should be the white noise. Finally, find all IMF components meeting the Gaussian distribution through the loop calculation. Then, subtract all the IMF components meeting the Gaussian distribution from the original signal to complete the denoising process. After denoising, the calculation formula of signal x f ( t ) is as follows:
x f ( t ) = x ( t ) i = 1 m 1 c r i ( t ) = j = 1 m m 1 c f j ( t ) + r 0 ( t ) ,
in which m 1 is the number of IMF components meeting the Gaussian distribution, c r i ( t ) is the ith IMF component meeting the Gaussian distribution and c f j ( t ) is the jth IMF component failing to meet the Gaussian distribution, i.e., the useful components reserved.
Figure 6 is the flow diagram of the proposed denoising method combining the EMD, the GGD-PDF-F and the skewness-kurtosis test.

2.6. The PLS-Based Parameter Influence Analysis Method

The PLS, combining multiple linear regression, canonical correlation analysis and the principal component analysis, is a method used to build the relational model of the independent variable’s influence on the dependent variable. It can explain the influence of each independent variable on the dependent variable through the regression coefficient of the independent variable [40,41,42]. For example, we explored the relationships of the variation between the three independent variables (the set value of target speed, the rate of load change K and the average load T ¯ h ) and the four dependent variables (the error between average HST output speed and target speed, the standard error σ , Δ n o the maximum deviation of output speed from the average speed and the range R) and the corresponding models.
The calculation formula of rate of load change K is as follows:
K = T h _ e n d T h _ 0 Δ t ,
in which T h _ e n d is the HST output end torque when the loading ends in the load change range, T h _ 0 is the HST output end torque when the loading begins in the load change range, and Δ t is the loading time consumed in the load change range.
The average load T ¯ h is the average value of load measurement data of the HST output end in one test. The average HST output speed n ¯ o and the standard deviation σ are the average value and standard deviation of the measured data of the HST output speed in one test.
The following is the calculation formula of Δ n o , the maximum deviation of the HST output speed from the average output speed:
Δ n o = max ( | n o n ¯ o | ) ,
in which n o is the measured value of the HST output speed in one test.
The following is the calculation formula of the HST output speed range R:
R = max ( n o ) min ( n o ) ,

3. Results and Discussion

3.1. Results of the Test of the Tractor HST Adjustable Speed Characteristics and Analysis

Figure 7 shows the results of the tractor HST adjustable speed characteristic test. In the test, the average HST input speed of tractor (i.e., the engine’s output speed) was 1041.09 rpm, and the standard deviation was 1.30 rpm. These results indicate that the engine’s output speed remained stable in the whole test and showed the reasonable volatility. The engine’s speed generally did not affect the HST output speed.
The variation of the HST output speed of the tractor in Figure 7a corresponds to the variation of the displacement in Figure 7b. Figure 8 shows the comparison results of the measured value and theoretical value of the HST adjustable speed characteristics of the tractor.
Figure 8 shows that the laws of change of the transmission ratio of the HST of the tractor were nonlinear, and the slope of change curve of transmission ratio decreased as the displacement ratio increased. The theoretical analysis results are consistent with the measured results in the test in terms of the change trend, with small errors. We evaluated the closeness degree of the theoretical characteristics to the measured characteristics using Equations (4) and (5). The results show that the coefficient of determination R 2 was 0.92, and the mean absolute percentage error MAPE was 12.56%. These results indicate that the theoretical characteristics are essentially consistent with the measured characteristics.

3.2. Results of PID-Based Constant Speed Step Response Test and Analysis

Figure 9 shows the results of the HST constant speed step response test of the tractor. In the test, the average HST input speed (i.e., the engine output speed) was 1143.12 rpm, and the standard deviation was 0.69 rpm. These results indicate, that the engine output speed remained stable with reasonable volatility throughout th whole test. The engine speed generally did not affect the HST output speed.
Table 4 shows the results of the constant speed step response.
According to Figure 9 and Table 4, the step response test shows that the HST constant speed of tractor design had a good effect. The tractor required less time to step from one fixed working speed to the next fixed working speed. The average rise time was about 0.87 s, and the overshoot was generally lower than 5%. In addition, Figure 9 shows that in the PID control, the HST system’s actual output speed was essentially consistent with its target speed with small steady-state errors.

3.3. Results of the PID-Based Constant Speed Test with the Load Disturbance and Analysis

3.3.1. The Results of the Denoising Test of the HST Output Speed Signal

We set the value of target speed at 25.75 rpm and the loading condition of HST output end at 50–100, 100–150 and 150–200 N•m for the advance test to design the filter of HST output speed signal, and used the filter for the signal denoising processing of constant speed control test with the whole load disturbance. Using the loading condition of 150–200 N•m as an example, Figure 10 shows the output speed signal’s EMD decomposition result.
Figure 10 shows that IMF1 and IMF2 were consistent with the characteristics of white noise. Thus, we chose IMF1 and IMF2 for the further GD-PDF-F and skewness-kurtosis test. Figure 11 and Figure 12 show the fitting and test results. Table 5 provides the analytic statistic results.
The statistical histogram and the results of the GD-PDF-F precision R2 and skewness-kurtosis test show that, for the constant speed control test with load disturbance, the output speed signal passing the EMD decomposition should remove the first two orders of components (i.e., remove IMF1 and IMF2).

3.3.2. The Influence of Load Disturbance on HST Adjustable Speed Characteristics in Open-Loop Control

To compare the adaptive adjustment effect of system to the load changes in the PID closed-loop control, the paper first conducted an open-loop control test. In the test, we set the system’s overall output speed at about 25.75 rpm. After the speed achieved the stability, we adjusted the overall output end’s load torque of system. Figure 13 shows the response state of overall output speed and the loading state of the load torque in the open-loop control.
According to Figure 13, as the load torque of output end increased continuously, HST output speed decreased continuously (when the set value of displacement ratio was constant). The average output speed was 22.89 rpm, and the standard deviation was 2.38 rpm. The maximum deviation of the HST output speed from the average value was 10.02 rpm, and the range was 10.80 rpm. Therefore, the tractor’s working load had a significant influence on HST adjustable speed transmission characteristics. To realize the constant-speed operation of agricultural machinery with HST, such as tractors, it is necessary to use the closed-loop control system for feedback regulation.

3.3.3. The Results of the PID-Based Constant Speed Control Test with Load Disturbance and Analysis

Figure 14 shows the results of the PID-based constant speed control test with load disturbance.
According to Figure 14, the HST output response of the tractor with the PID control improved greatly compared with that of tractor with open-loop control system, and its output speed varied steadily, essentially consistent with the target speed. Table 6 shows the average output speed, the standard deviation, the maximum deviation from the average value and the range in different working conditions.
Using target speeds of 25.75 rpm and 51.50 rpm as examples, we considered the cases of load change ranges of 0–50, 50–100, 100–150, 150–200, 200–250 and 250–300 N•m for the PLS-based parameter influence analysis. Figure 15, Figure 16, Figure 17 and Figure 18 show the analysis results.
According to Figure 15, Figure 16, Figure 17 and Figure 18, the PLS-based regression prediction coefficient of determination was 0.82, 0.86, 0.83 and 0.77 respectively, indicating the high correctness of PLS-based analysis results. According to the PLS analysis results, the rate of load change K influenced the speed error, the standard deviation, the maximum deviation from average value and the range the most. The set value of target speed had the least influence on speed error, but its influences on other three dependent variables were next only to the rate of load change K. The average load T ¯ h had the least influences on the four dependent variables. All independent variables’ influences on dependent variables showed positive correlations.
To summarize, when the tractor with the HST operates with a large rate of load change, the PID-based control error increases accordingly. Meanwhile, in the running of tractor, the increase in required speed of vehicle will further increase the PID control error. However, the value of load torque has a smaller influence on the stability of tractor speed. In addition, the PID-based HST system has a strong constant speed adaptive adjustment ability for load disturbance.
According to the research results found by the authors of [18], in the control of determining the accelerator to change the transmission ratio, the tractor needs an adjustment time of about 5.2 s for the step response in the low-speed state, with a relative error of 1%. The results of the bench test conducted in current paper are quite similar. The paper used a PID controller, of which the control result was better than that of the open-loop control. The authors of [18] focused on the actual working system of tractor, while the research in the paper is specific to the test bench of the HST for the tractor. Therefore, there are certain differences between the two systems. In the paper, the mean rise time of step response test was 0.87 s, the mean time to reach the steady state was 1.36 s and the mean steady state error was 0.12 rpm. In the state of the HST output load disturbance, the mean relative error of system was about 0.37%. According to the authors of [18] and the research in the paper, the tractor with the HST has a fast rate of step response and good stability of speed in operation (such as ploughing or transportation).

4. Conclusions

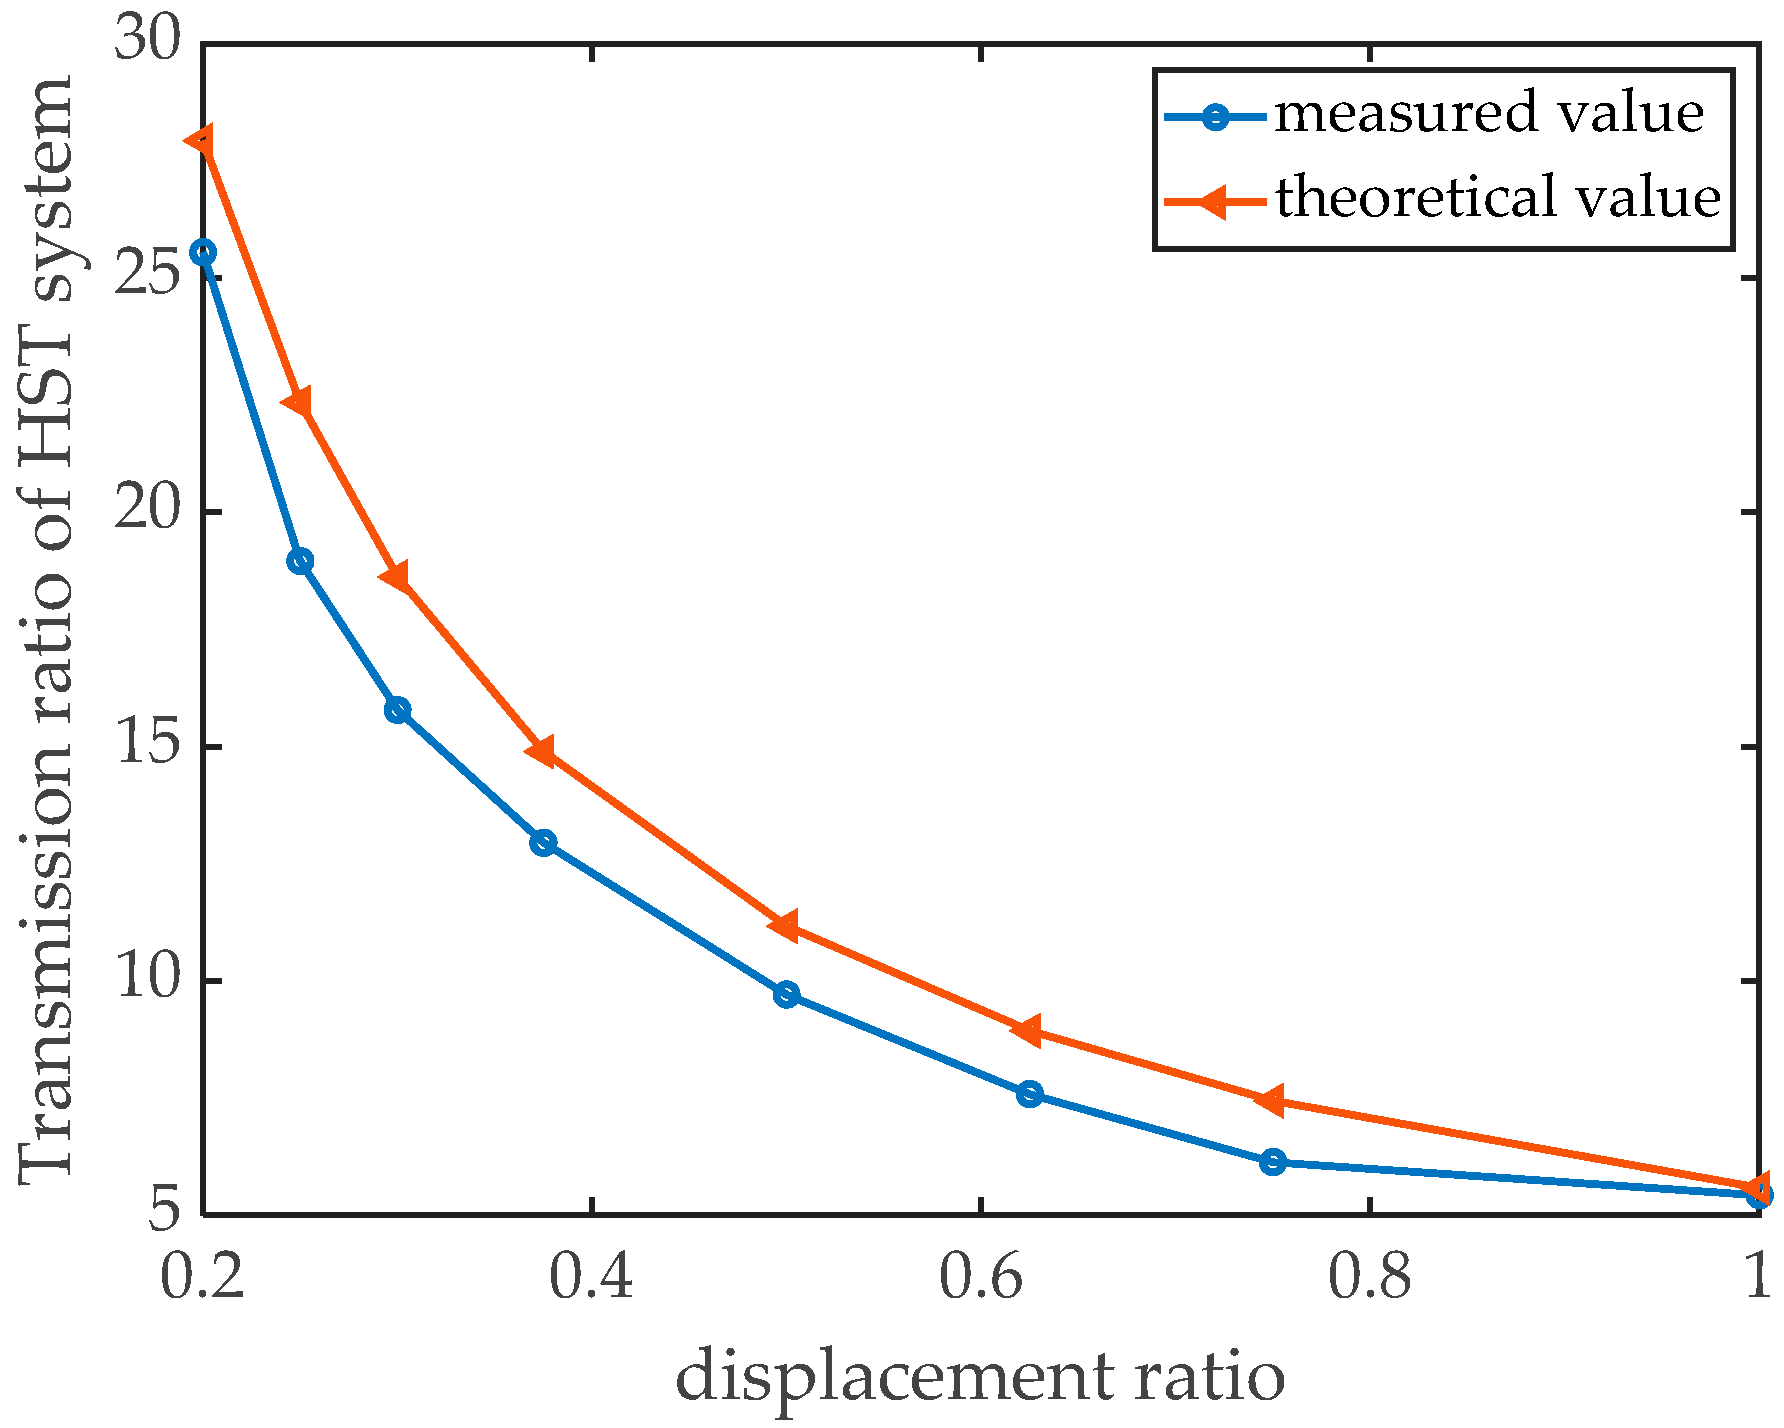
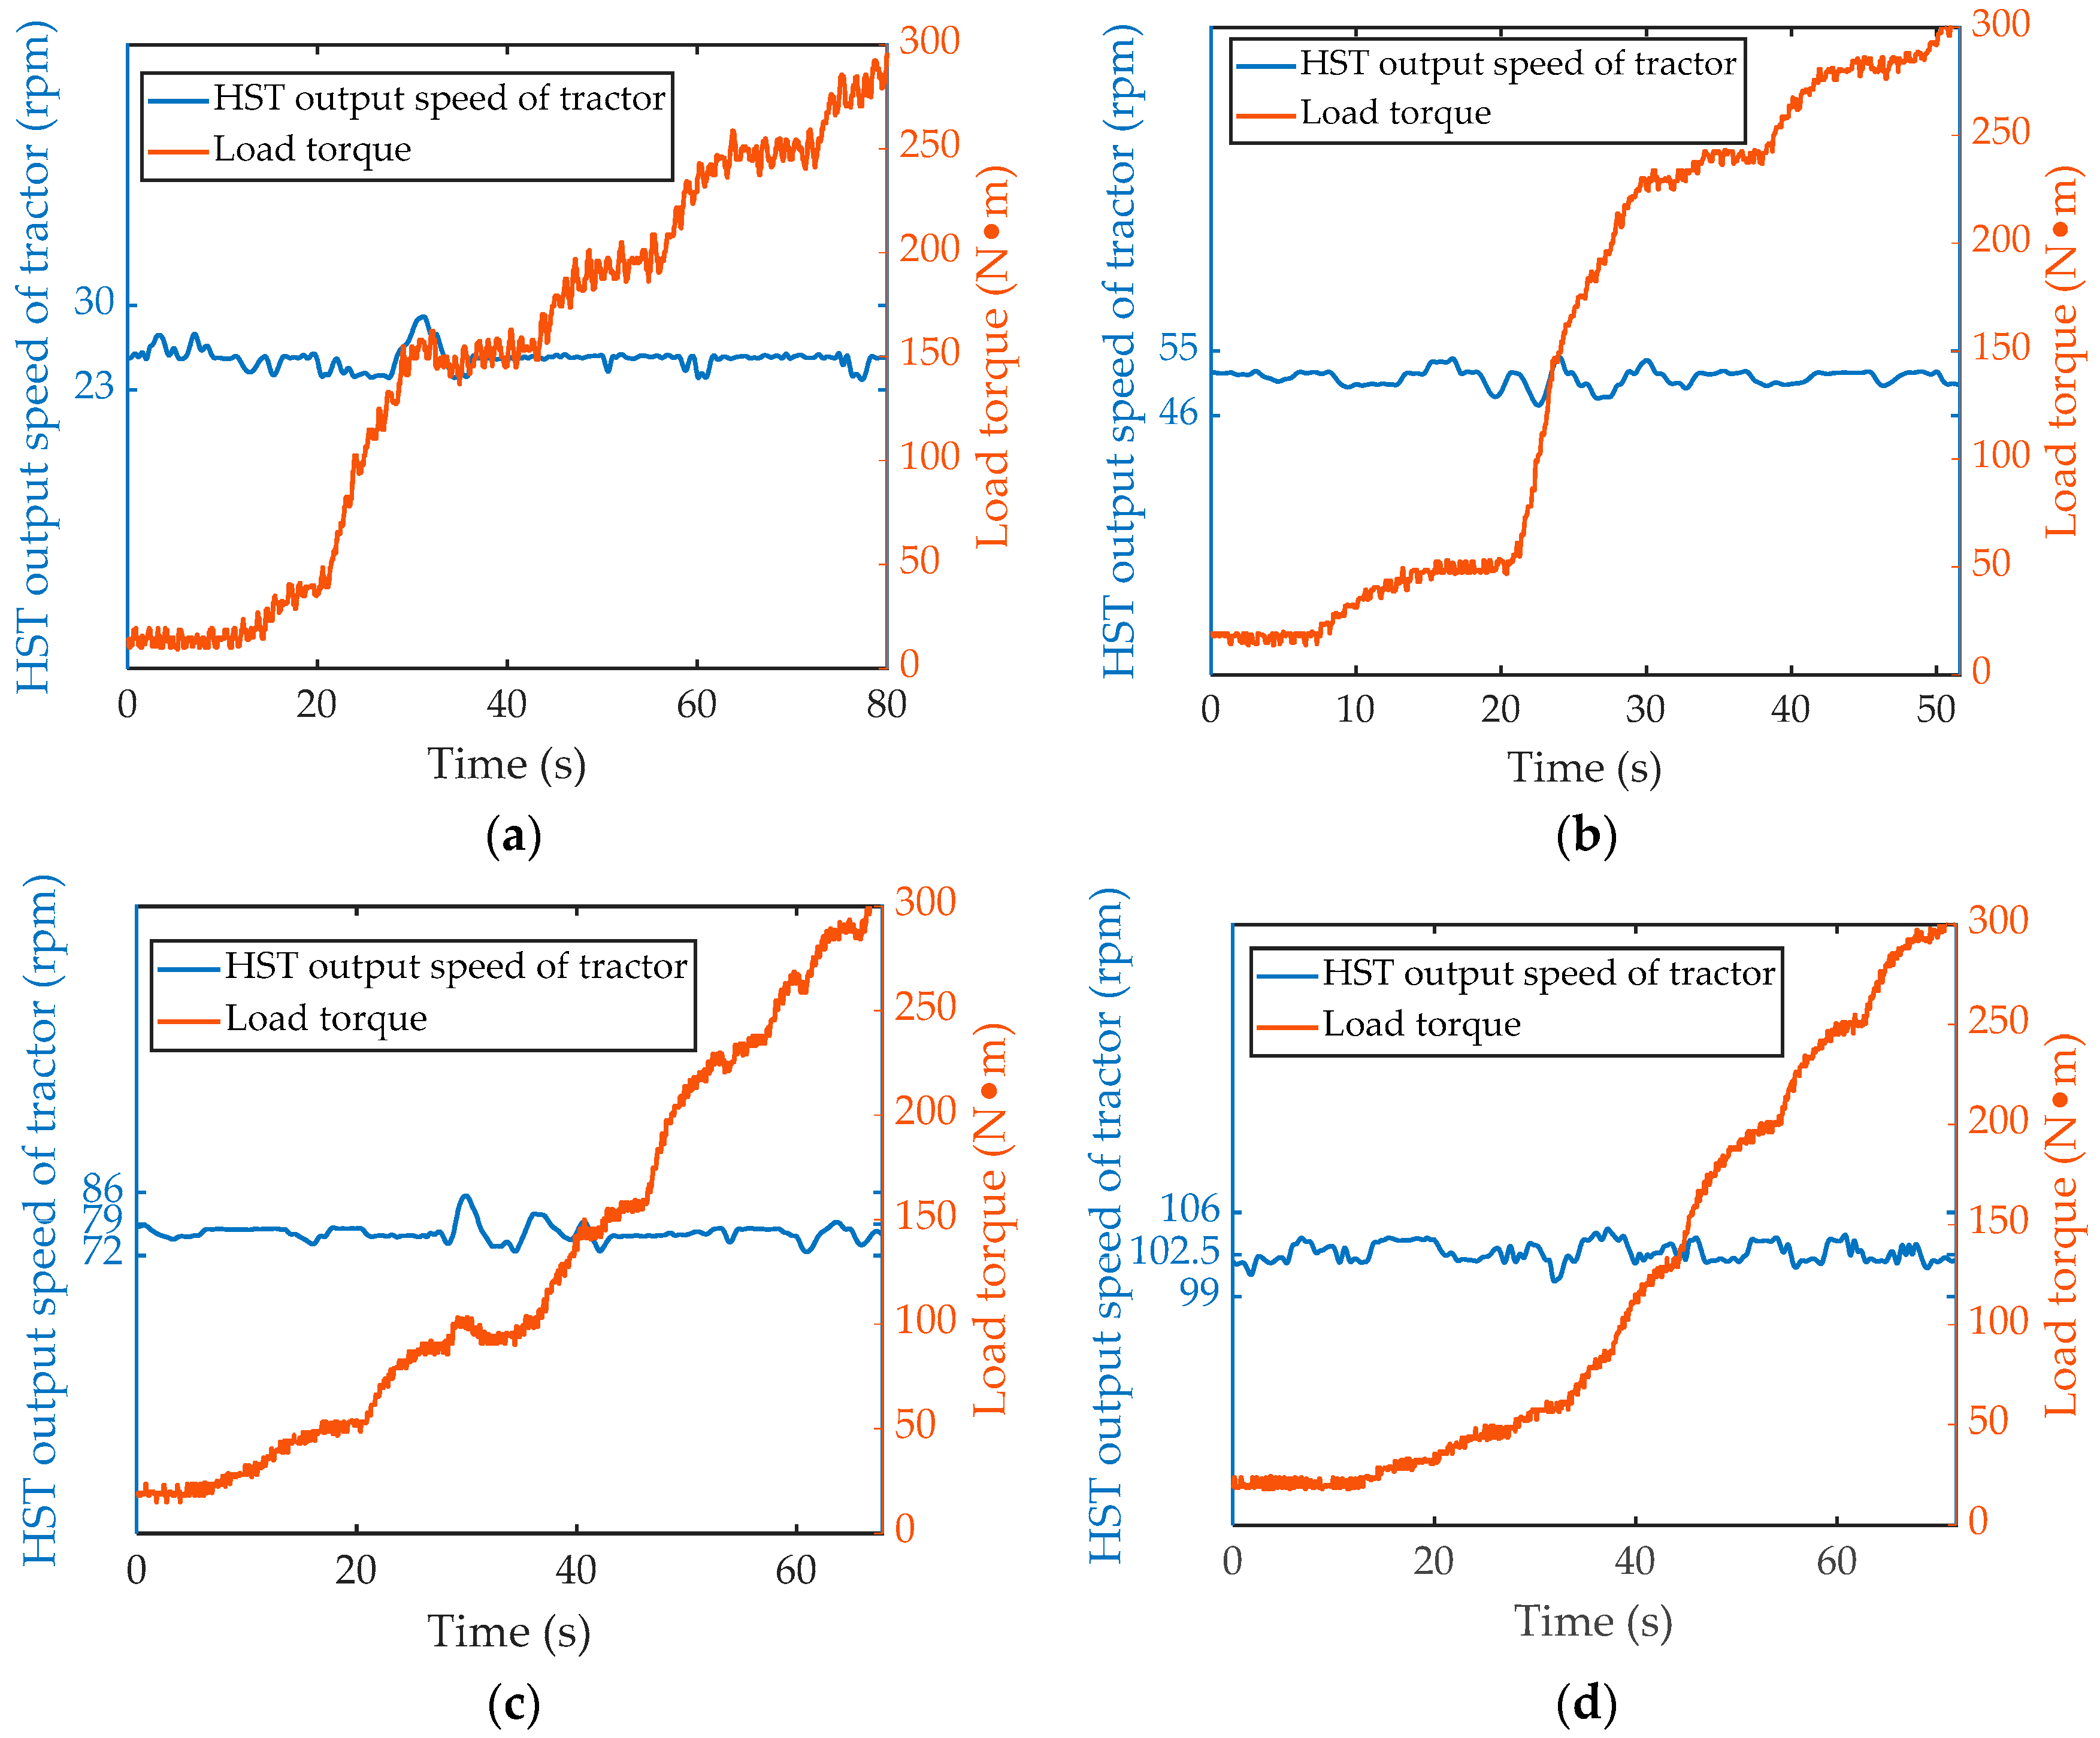
Estimating a tractor’s driving power performance according to the theoretical adjustable speed transmission characteristics of the HST only is not accurate. The step response test shows that the tractor consumes little time to step from one fixed working speed to the next fixed working speed, with an average rise of 0.87 s. The overshoot was generally lower than 5%, and the steady-state error was small. The load disturbance test results show that the researched PID control system can meet the load adaptation requirement well. When the load changes, the system can keep the output speed constant to a large extent (i.e., the error between output speed and target speed is small). In the four situations of closed-loop control, the errors between the average output speed and the target value set were 0.54% (25.75 rpm), 0.37% (51.50 rpm), 0.27% (77.25 rpm) and 0.30% (103 rpm), respectively, with relatively small standard deviation and maximum deviation.
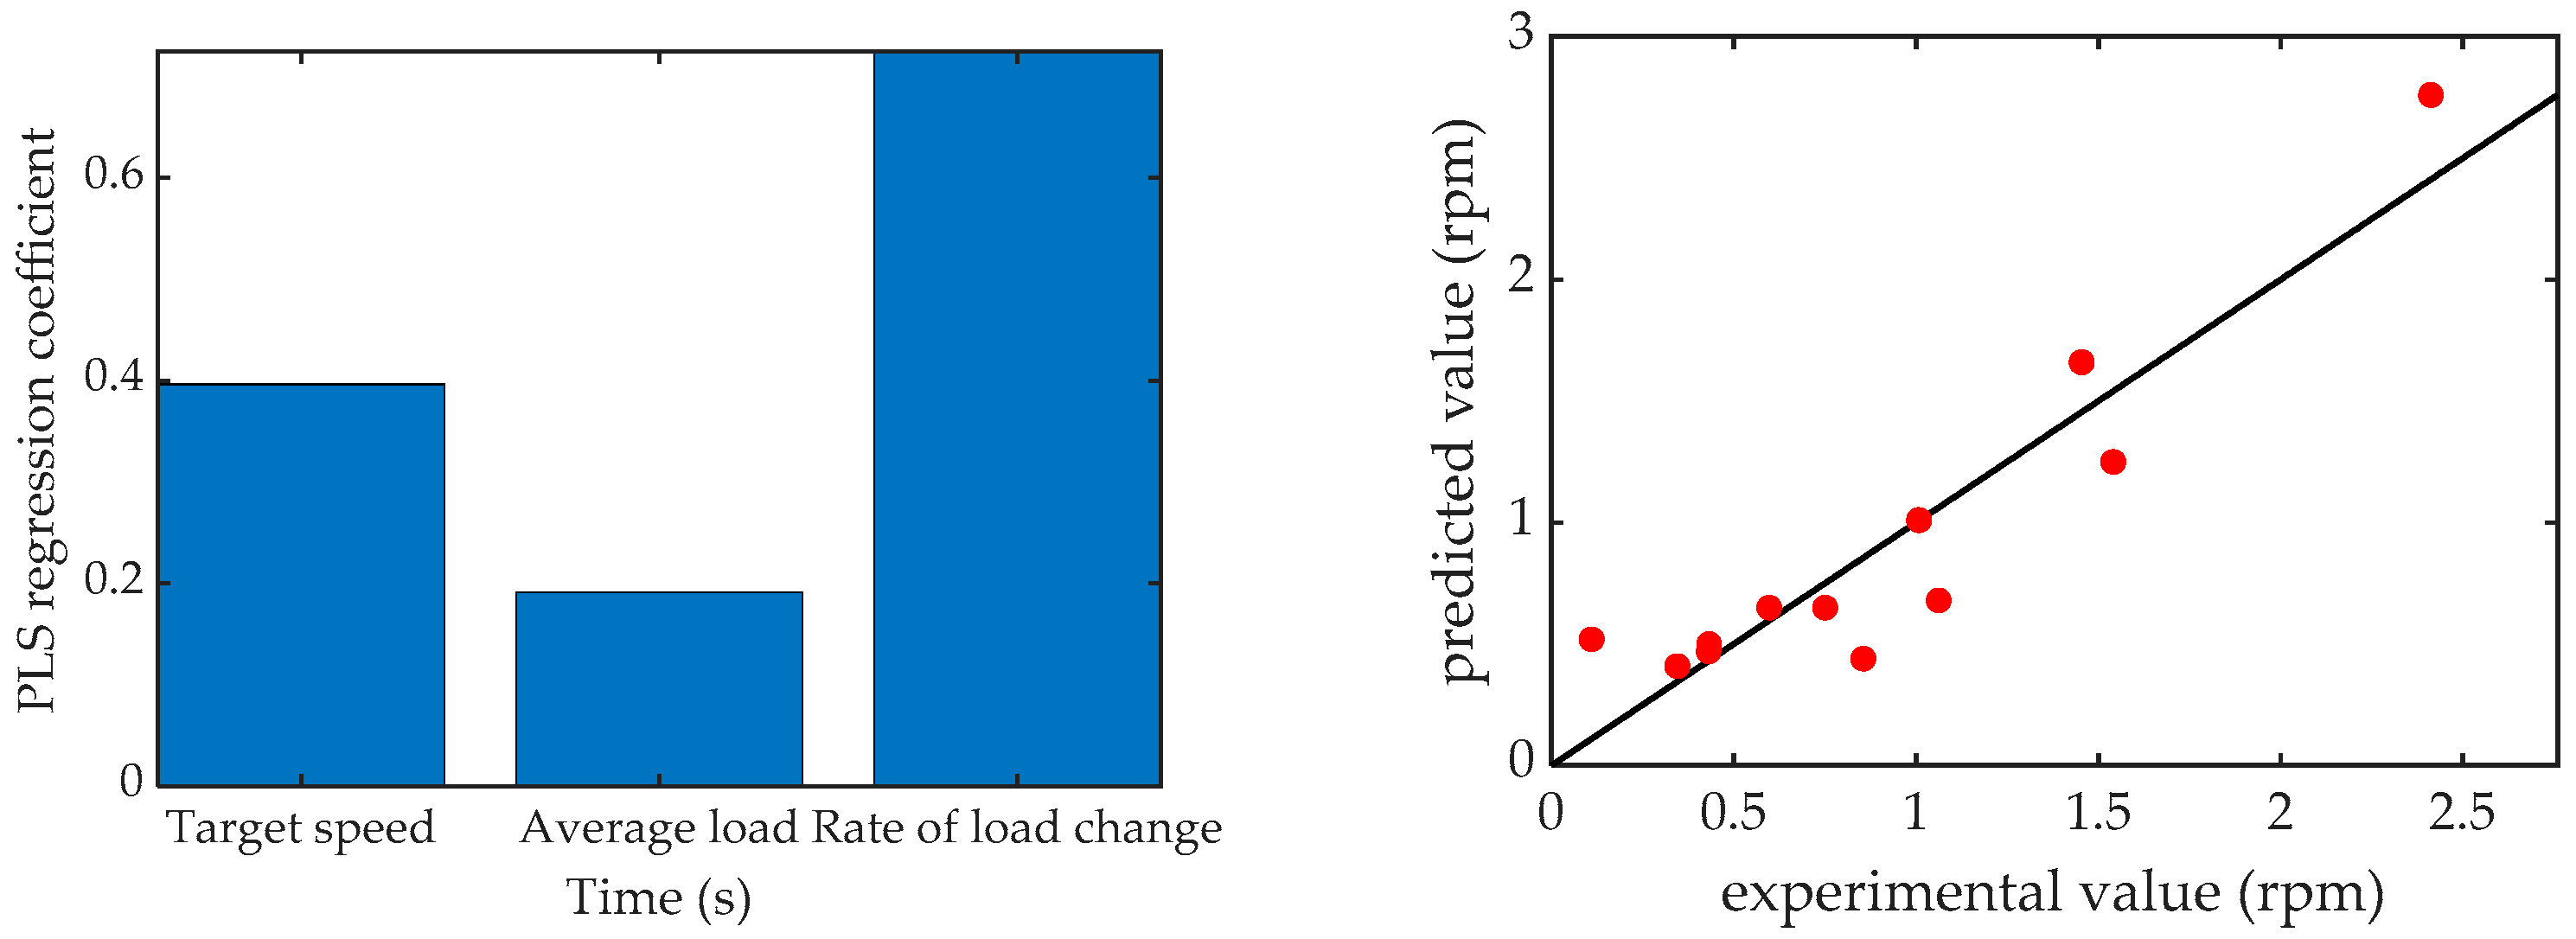
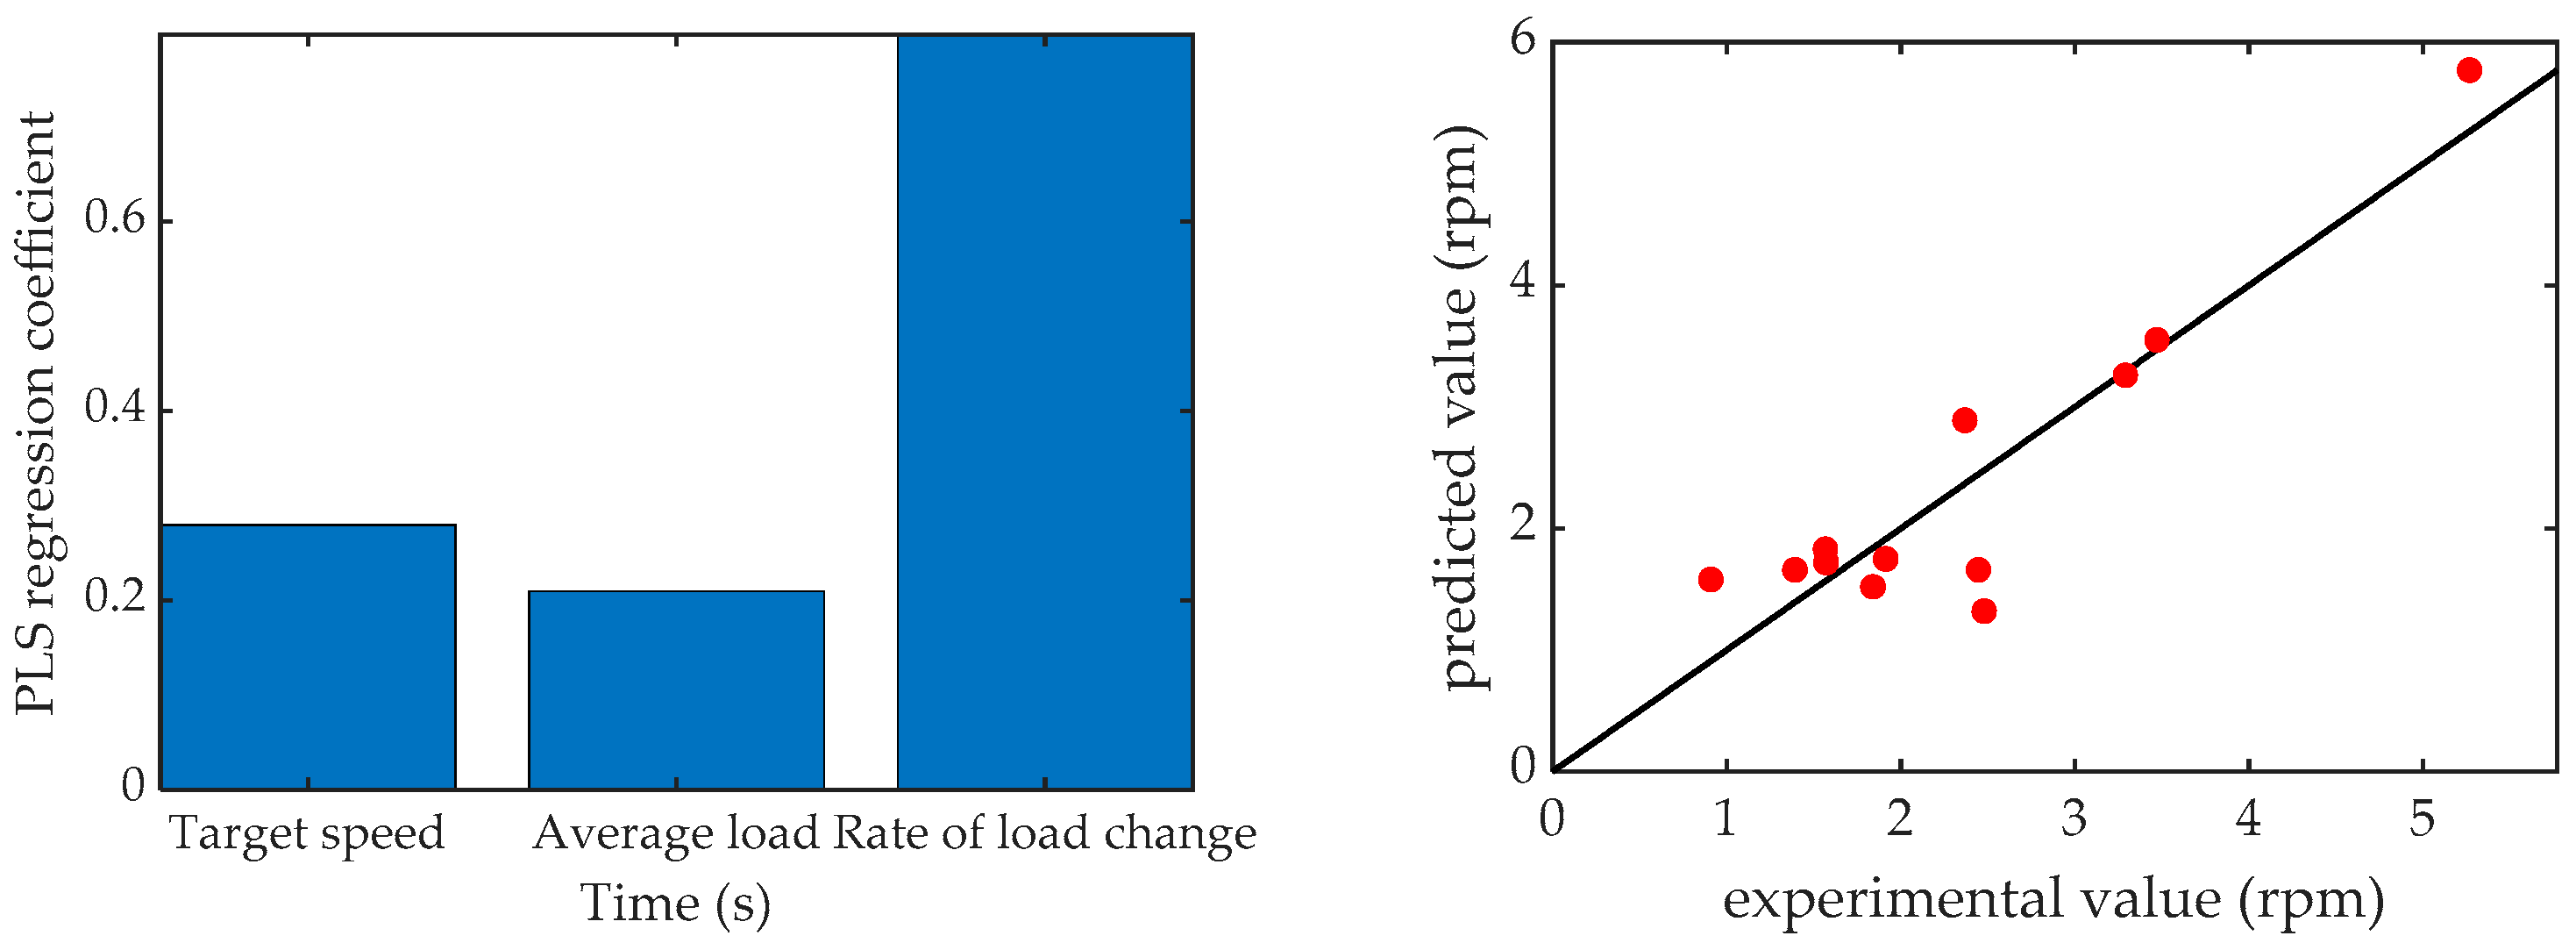
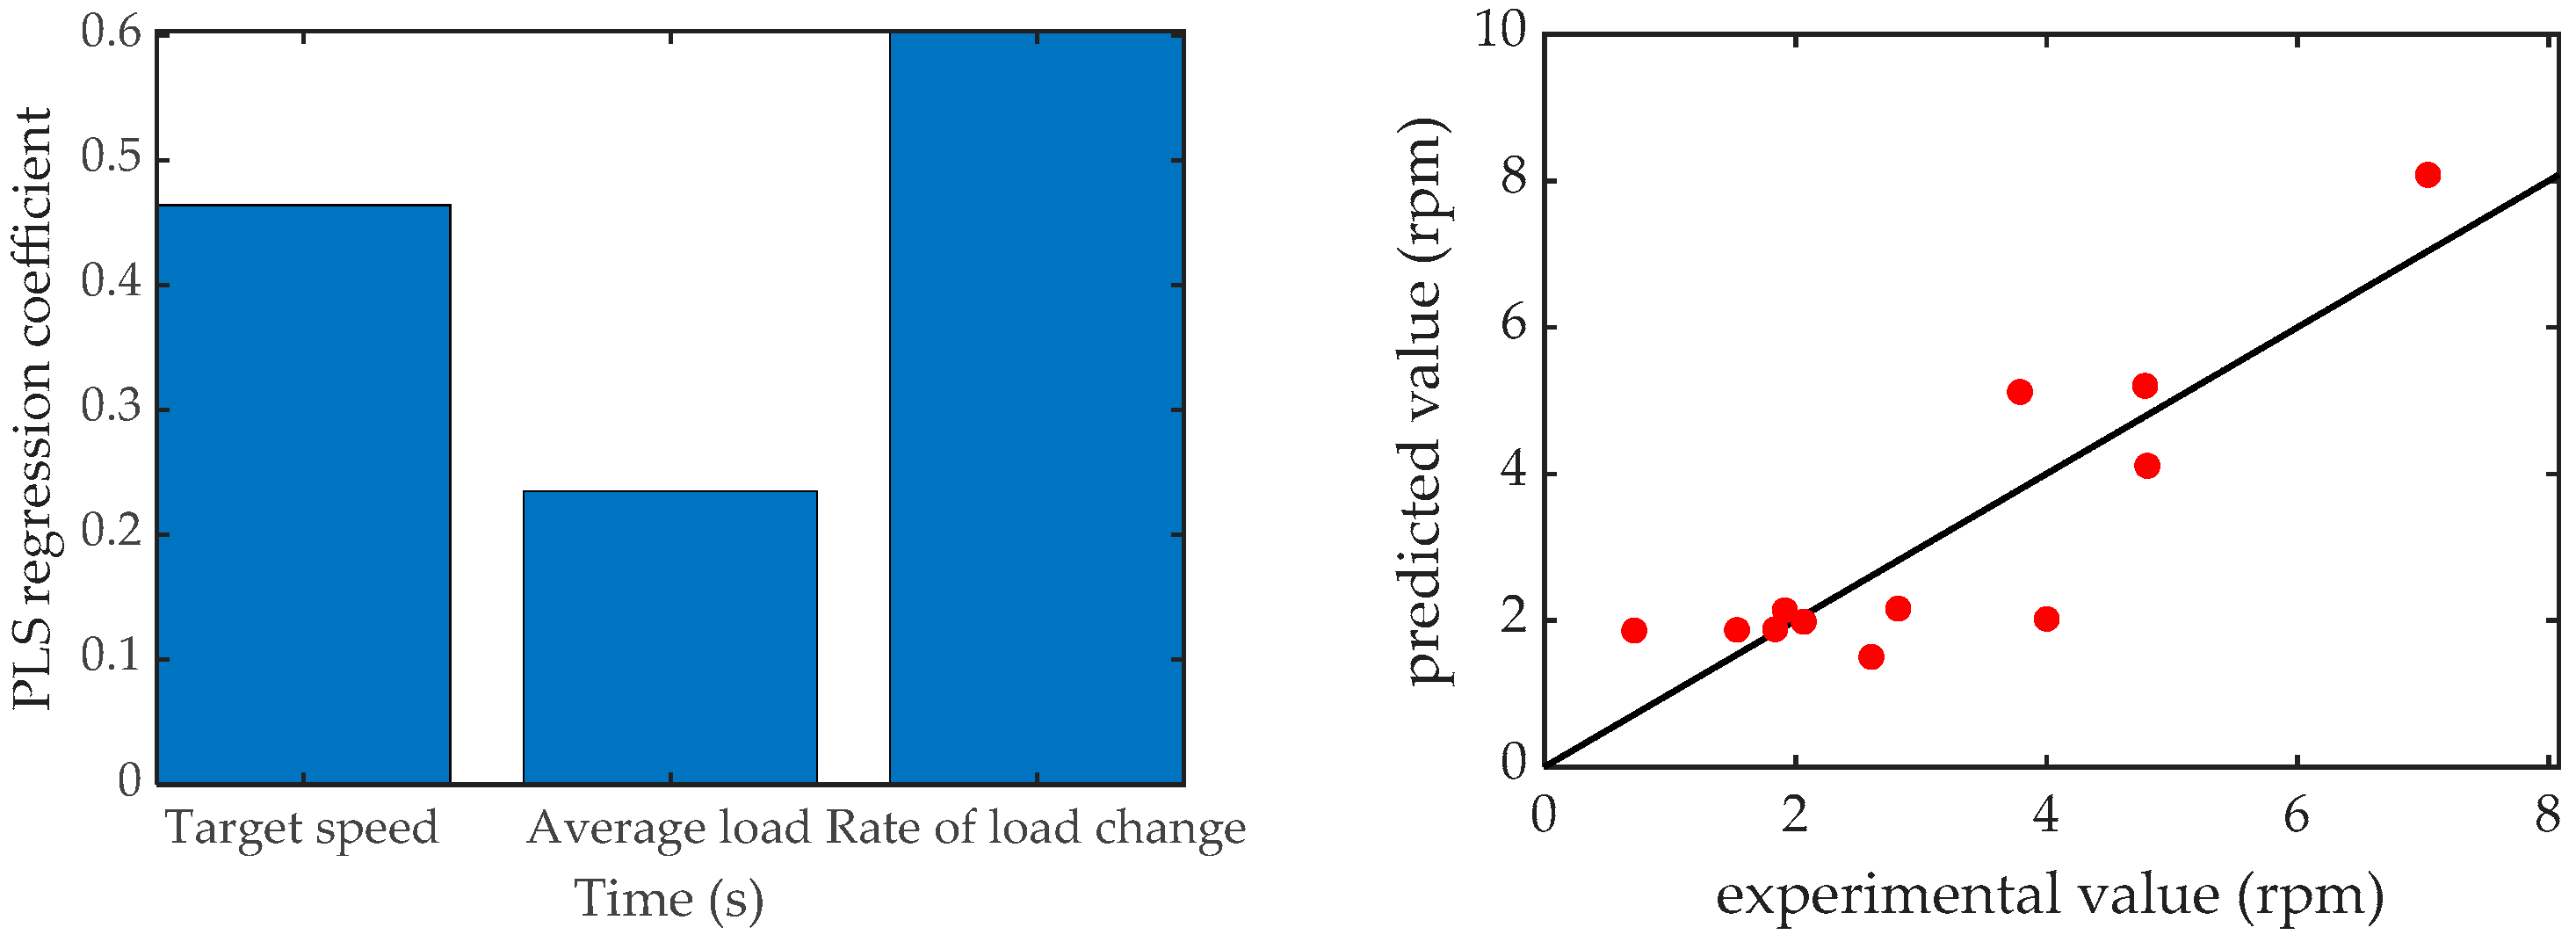
The paper proposes a denoising method combining the EMD, the GD-PDF-F and the skewness-kurtosis test. The research results show that the HST output speed signal tested should remove the first two orders of the IMF components. The rate of change of load torque has the biggest influence on the stability of the HST output speed, followed by the targe speed set, while the load torque has comparatively less influence on the HST output speed stability. It is recommended that the test and evaluation of the HST constant speed control performance of tractor should carefully consider the change of load torque in the future.

Author Contributions

Methodology, Z.C.; software, Z.C.; validation, Z.C.; investigation, Z.C.; resources, Z.L.; writing—original draft preparation, Z.C.; writing—review and editing, Z.C. and Z.L.; supervision, Z.L.; and project administration, Z.L. All authors have read and agreed to the published version of the manuscript.

Funding

This research was funded by the National Key Research and Development Plan (2016YFD0701103) and Metasequoia teacher research start-up fund of Nanjing Forestry University (163106061).

Institutional Review Board Statement

Not applicable.

Informed Consent Statement

Not applicable.

Data Availability Statement

The data presented in this study are available on demand from the corresponding author at chengzhun38@163.com.

Acknowledgments

The authors thank the National Key Research and Development Plan (2016YFD0701103) and Metasequoia teacher research start-up fund of Nanjing Forestry University (163106061) for funding. We also thank the anonymous reviewers for providing critical comments and suggestions that improved the manuscript.

Conflicts of Interest

The authors declare no conflict of interest.

References

  1. Pan, G.; Sun, J.; Wang, X.; Yang, F.; Liu, Z. Construction and experimental verification of sloped terrain soil pressure-sinkage model. Agriculture 2021, 11, 243. [Google Scholar] [CrossRef]
  2. Bulgakov, V.; Aboltins, A.; Ivanovs, S.; Holovach, I.; Nadykto, V.; Beloev, H. A mathematical model of plane-parallel movement of the tractor aggregate modular type. Agriculture 2020, 10, 454. [Google Scholar] [CrossRef]
  3. Kalinichenko, A.; Havrysh, V.; Hruban, V. Heat recovery systems for agricultural vehicles: Utilization ways and their efficiency. Agriculture 2018, 8, 199. [Google Scholar] [CrossRef]
  4. Park, Y.J.; Kim, S.C.; Kim, J.G. Analysis and verification of power transmission characteristics of the hydromechanical transmission for agricultural tractors. J. Mech. Sci. Technol. 2016, 30, 5063–5072. [Google Scholar] [CrossRef]
  5. Baek, S.M.; Kim, W.S.; Kim, Y.S.; Baek, S.Y.; Kim, Y.J. Development of a simulation model for HMT of a 50 kw class agricultural tractor. Appl. Sci. 2020, 10, 4064. [Google Scholar] [CrossRef]
  6. Thanpattranon, P.; Ahamed, T.; Takigawa, T. Navigation of autonomous tractor for orchards and plantations using a laser range finder: Automatic control of trailer position with tractor. Biosyst. Eng. 2016, 147, 90–103. [Google Scholar] [CrossRef]
  7. Jiang, Z.; Xia, C. Study on characteristic of hydrostatic transmission system of tractor. J. Agr. Mech. Res. 2021, 43, 249–254. [Google Scholar]
  8. Wang, S.; Liu, Q.; Ma, W.; Liu, C.; Li, J. Simulation anlysis and experimental study on characteristics for load traveling. Hydraulic. Pneum. 2019, 39, 34–39. [Google Scholar]
  9. Shi, H.; Mei, X. New features and development prospect of modern hydraulics drive techniques. Mach. Tool Hydraul. 2017, 45, 158–166. [Google Scholar]
  10. Lu, L.; Zhou, Y.; Li, H.; Wang, Y.; Yin, Y.; Zhao, J. Electro-hydraulic shift quality of power shift transmission of heavy duty tractor. T. Chin. Soc. Agr. Mech. 2020, 51, 550–556. [Google Scholar]
  11. Xi, Z.; Zhou, Z.; Zhang, M.; Cao, Q. Shift characteristics and control strategy of powershift transmission on tractor. T. Chin. Soc. Agr. Mech. 2016, 47, 350–357. [Google Scholar]
  12. Chen, Y.; Qian, Y.; Lu, Z.; Zhou, S.; Xiao, M.; Bartos, P.; Xiong, Y.; Jin, G.; Zhang, W. Dynamic characteristic analysis and clutch engagement test of HMCVT in the high-power tractor. Complexity 2021, 2021, 8891127. [Google Scholar]
  13. Wu, W.; Luo, J.L.; Wei, C.H.; Liu, H.; Yuan, S.H. Design and control of a hydro-mechanical transmission for all-terrain vehicle. Mech. Mach. Theory 2020, 153, 104052. [Google Scholar] [CrossRef]
  14. Xia, Y.; Sun, D.Y.; Qin, D.T.; Zhou, X.Y. Optimisation of the power-cycle hydro-mechanical parameters in a continuously variable transmission designed for agricultural tractors. Biosyst. Eng. 2020, 193, 12–24. [Google Scholar] [CrossRef]
  15. Bao, M.X.; Ni, X.D.; Zhao, X.; Li, S. Research on the HMCVT gear shifting smoothness of the four-speed self-propelled cotton picker. Mech. Sci. 2020, 11, 267–283. [Google Scholar] [CrossRef]
  16. Ren, J.; Yin, C.; Du, Y.; Zhang, Z. Study on characteristics of HST and power system of agricultural tractor. Agr. Equip. Vehicl. 2021, 59, 25–30. [Google Scholar]
  17. Liu, Z.; Zhang, G.; Chu, G.; Niu, H.; Zhang, Y.; Yang, F. Design matching and dynamic performance test for an HST-Based drive system of a hillside crawler tractor. Agriculture 2021, 11, 466. [Google Scholar] [CrossRef]
  18. Zhao, C.; Wei, C.; Fu, W.; Shang, Y.; Zhang, G.; Cong, Y. Design and experiment of cruise control system for hydrostatic transmission tractor. T. Chin. Soc. Agr. Mech. 2021, 52, 359–365. [Google Scholar]
  19. Kim, D.M.; Kim, S.C.; Noh, D.K.; Jang, J.S. Jerk phenomenon of the hydrostatic transmission through the experiment and analysis. Int. J. Automot. Tec. 2015, 16, 783–790. [Google Scholar] [CrossRef]
  20. Taswell, C. The what, how, and why of wavelet shrinkage denoising. Comput. Sci. Eng. 2000, 2, 12–19. [Google Scholar] [CrossRef] [Green Version]
  21. Gomi, T.; Nakajima, M.; Umeda, T. Wavelet denoising for quantum noise removal in chest digital tomosynthesis. Int. J. Comput. Ass. Rad. 2015, 10, 75–86. [Google Scholar] [CrossRef] [PubMed]
  22. Ding, Y.; Selesnick, I.W. Artifact-free wavelet denoising: Non-convex sparse regularization, convex optimization. IEEE Signal Proc. Let. 2015, 22, 1364–1368. [Google Scholar] [CrossRef] [Green Version]
  23. Ghezaiel, W.; Ben Slimane, A.; Ben Braiek, E. Nonlinear multi-scale decomposition by EMD for Co-Channel speaker identification. Multimed. Tools Appl. 2017, 76, 20973–20988. [Google Scholar]
  24. Colominas, M.A.; Schlotthauer, G.; Torres, M.E. Improved complete ensemble EMD: A suitable tool for biomedical signal processing. Biomed. Signal Proces. 2014, 14, 19–29. [Google Scholar] [CrossRef]
  25. Sharma, R.; Prasanna, S.R.M.; Rufiner, H.L.; Schlotthauer, G. Detection of the glottal closure instants using empirical mode decomposition. Circ. Syst. Signal Pr. 2018, 37, 3412–3440. [Google Scholar] [CrossRef]
  26. Qu, D.H.; Luo, W.; Liu, Y.F.; Fu, B.; Zhou, Y.S.; Zhang, F.T. Simulation and experimental study on the pump efficiency improvement of continuously variable transmission. Mech. Mach. Theory 2019, 131, 137–151. [Google Scholar] [CrossRef]
  27. Chen, S.; Zhao, J.; Mao, E.; Song, Z.; Zhu, Z.; Du, Y. Structural modeling and performance analysis of load-sensing variable pump. T. Chin. Soc. Agr. En. 2017, 33, 40–49. [Google Scholar]
  28. Cheng, Z.; Lu, Z. Research on the PID control of the ESP system of tractor based on improved AFSA and improved SA. Comput. Electron. Agr. 2018, 148, 142–147. [Google Scholar] [CrossRef]
  29. Garrido, J.; Ruz, M.L.; Morilla, F.; Vazquez, F. Interactive tool for frequency domain tuning of PID controllers. Processes 2018, 6, 197. [Google Scholar] [CrossRef] [Green Version]
  30. Cheng, Z.; Lu, Z.; Qian, J. A new non-geometric transmission parameter optimization design method for HMCVT based on improved GA and maximum transmission efficiency. Comput. Electron. Agr. 2019, 167, 105034. [Google Scholar] [CrossRef]
  31. Fussner, D.R.; Singh, Y.P. Design of input coupled split power transmissions, arrangements, and their characteristics. J. Mech. Des. 2004, 126, 542–550. [Google Scholar] [CrossRef]
  32. Ince, E.; Guler, M.A. Design and analysis of a novel power-split infinitely variable power transmission system. J. Mech. Des. 2019, 141, 054501. [Google Scholar] [CrossRef]
  33. Fu, H.; Zuo, Y.; Liu, C.; Zhang, J. A variable structure PI controller for permanent magnetic synchronous motor speed-regulation system. T. China Electrotechn. 2015, 30, 237–242. [Google Scholar]
  34. Cheng, Z. Research on System Dynamics Analysis and Continuously Variable Speed of Tractor; Nanjing Agricultural University: Nanjing, China, 2020. [Google Scholar]
  35. Qiao, N.; Wang, L.; Liu, Q.; Zhai, H. Multi-scale eigenvalues empirical mode decomposition for geomagnetic signal filtering. Measurement 2019, 146, 885–891. [Google Scholar] [CrossRef]
  36. Thirumalaisamy, M.R.; Ansell, P.J. Fast and adaptive empirical mode decomposition for multidimensional, multivariate signals. IEEE Signal Proc. Let. 2018, 25, 1550–1554. [Google Scholar] [CrossRef]
  37. Yang, Y.L.; Deng, J.H.; Kang, D.L. An improved empirical mode decomposition by using dyadic masking signals. Signal Image Video P. 2015, 9, 1259–1263. [Google Scholar] [CrossRef]
  38. Guo, C.; Wen, Y.; Li, P.; Wen, J. Enhancement of leak signals using EMD in pipeline. Chin. J. Sci. Instru. 2015, 36, 1397–1405. [Google Scholar]
  39. Lu, Y.; Huang, C.; Liu, C.; Jiang, J.; Yin, M. Indoor positioning algorithm of wireless local area networks position fingerprint based on skewness-kurtosis test. Sci. Technol. Eng. 2018, 18, 1–6. [Google Scholar]
  40. Zou, X.; Hao, Z.; Yi, R.; Guo, L.; Shen, M.; Li, X.; Wang, Z.; Zeng, X.; Lu, Y. Quantitative analysis of soil by laser-induced breakdown spectroscopy using genetic algorithm-partial least squares. Chin. J. Anal. Chem. 2015, 43, 181–186. [Google Scholar]
  41. Singer, M.; Krivobokova, T.; Munk, A.; De Groot, B. Partial least squares for dependent data. Biometrika 2016, 103, 351–362. [Google Scholar] [CrossRef] [Green Version]
  42. Druilhet, P.; Mom, A. PLS regression: A directional signal-to-noise ratio approach. J. Multivar. Anal. 2006, 97, 1313–1329. [Google Scholar] [CrossRef]
Figure 1. The schematic diagram of the continuously variable transmission system of the tractor with the HST.
Agriculture 11 00960 g001
Figure 2. A simplified diagram of the control work principle of the variable pump.
Agriculture 11 00960 g002
Figure 3. Test bench of HST variable speed control of the tractor. ① Engine (DEUTZ TCD2013L062V); ② speed and torque sensor of ZJ-2000A model; ③ HST; ④ speed torque sensor of the ZJ-5000A model; ⑤ pinion box; ⑥ electrical eddy current dynamometer of the DW250 model; ⑦ hydraulic system (realizing lubrication, cooling and other functions).
Agriculture 11 00960 g003
Figure 4. Schematic diagram of the output speed closed-loop PID control of the pump-motor system.
Agriculture 11 00960 g004
Figure 5. Schematic diagram of the tractor HST output speed of the PID control test.
Agriculture 11 00960 g005
Figure 6. The diagram of the proposed denoising method.
Agriculture 11 00960 g006
Figure 7. Results of the test of the HST adjustable speed transmission characteristics. (a) Variation of the HST input speed and output speed; (b) variation of the displacement ratio.
Agriculture 11 00960 g007
Figure 8. Results of the comparison of the theoretical value and the measured value of the HST adjustable speed transmission characteristics of the tractor.
Agriculture 11 00960 g008
Figure 9. The PID-based constant speed step response curve.
Agriculture 11 00960 g009
Figure 10. Results of the HST output speed signal’s EMD decomposition.
Agriculture 11 00960 g010
Figure 11. Statistical histogram of the IMF1 and GD-PDF-F curves. (a) 50–100 N•m; (b) 100–150 N•m; (c)150–200 N•m.
Agriculture 11 00960 g011
Figure 12. Statistical histogram of the IMF2 and GD-PDF-F curves. (a) 50–100 N•m; (b) 100–150 N•m; (c)150–200 N•m.
Agriculture 11 00960 g012
Figure 13. Variation curve of the system response and load in the open-loop control.
Agriculture 11 00960 g013
Figure 14. Variation curve of the system response and load in the PID control. (a) Target speed: 25.75 rpm; (b) target speed: 51.50 rpm; (c) target speed: 77.25 rpm; (d) target speed: 103 rpm.
Agriculture 11 00960 g014
Figure 15. Influence of the parameter on the error between the average speed measured and the target speed.
Agriculture 11 00960 g015
Figure 16. Influence of the parameter on the standard deviation of speed.
Agriculture 11 00960 g016
Figure 17. Influence of the parameter on the output speed’s maximum deviation from the average value.
Agriculture 11 00960 g017
Figure 18. Influence of the parameter speed range.
Agriculture 11 00960 g018
Table 1. Related specifications of the speed and torque sensors used in the test.
NameModelSpecification
HST Input End Speed & Torque SensorZJ-2000ARated Torque: 2000 N•m
Working Speed: 0–3000 rpm
HST Output End Speed & Torque SensorZJ-5000ARated Torque: 4000 N•m
Working Speed: 0–5000 rpm
Signal ConverterZJ-A-F/ASignal Output: 4–20 mA
Table 2. Main technical specifications of the variable pump of the HPV-02 model (55 cm3/rev).
ParameterValueSpecificationValue
Allowable Speed (rpm)3300Continuous Input Torque (N•m)218
Maximum Speed (rpm)3700Maximum Input Torque (N•m)353
Rate Pressure (MPa)42Continuous Power (kW)75
Peak Pressure (MPa)50Maximum Power (kW)122
Table 3. Main technical specifications of the constant motor of the HMF-02 model (55 cm3/rev).
ParameterValueSpecificationValue
Allowable Speed (rpm)4100Continuous Input Torque (N•m)218
Maximum Speed (rpm)4400Maximum Input Torque (N•m)366
Rated Pressure (MPa)42Continuous Power (kW)93
Peak Pressure (MPa)50Maximum Power (kW)157
Table 4. Result statistics of the PID-based constant speed step response test.
Target Speed (rpm)25.7551.5077.25103.00Mean
Overshoot (%)1.9417.485.183.647.06
Rise time (s)1.450.680.780.580.87
Steady state error (rpm)0.020.190.190.090.12
Time to reach steady state (s)1.732.330.800.601.36
Table 5. Results of the signal denoising test.
Loading Condition (N•m)50–100100–150150–200
IMF1IMF2IMF1IMF2IMF1IMF2
R20.99870.99480.94440.98280.99070.9989
Whether pass the skewness test or not×
Table 6. Statistical results of the different working conditions.
Target Speed (rpm)Mean (rpm)Standard Deviation (rpm)Maximum Deviation (rpm)Range (rpm)
25.7525.610.873.325.20
51.5051.311.184.046.81
77.2577.041.838.1112.55
103.00102.690.822.744.39
Publisher’s Note: MDPI stays neutral with regard to jurisdictional claims in published maps and institutional affiliations.

