Article

Evolutionary Subdivision of Domestic Chickens: Implications for Local Breeds as Assessed by Phenotype and Genotype in Comparison to Commercial and Fancy Breeds

by
Tatyana A. Larkina
1,
Olga Y. Barkova
1,
Grigoriy K. Peglivanyan
1,
Olga V. Mitrofanova
1,
Natalia V. Dementieva
1,
Olga I. Stanishevskaya
1,
Anatoly B. Vakhrameev
1,
Alexandra V. Makarova
1,
Yuri S. Shcherbakov
1,
Marina V. Pozovnikova
1,
Evgeni A. Brazhnik
2,
Darren K. Griffin
3 and
Michael N. Romanov
3,*
1
Russian Research Institute of Farm Animal Genetics and Breeding—Branch of the L. K. Ernst Federal Science Center for Animal Husbandry, Pushkin, 196625 St. Petersburg, Russia
2
BIOTROF+ Ltd., Pushkin, 196602 St. Petersburg, Russia
3
School of Biosciences, University of Kent, Canterbury CT2 7NJ, UK
*
Author to whom correspondence should be addressed.
Agriculture 2021, 11(10), 914; https://doi.org/10.3390/agriculture11100914
Submission received: 25 August 2021 / Accepted: 19 September 2021 / Published: 24 September 2021
(This article belongs to the Special Issue Poultry: Breeding, Health, Nutrition, and Management)

Abstract

:
To adjust breeding programs for local, commercial, and fancy breeds, and to implement molecular (marker-assisted) breeding, a proper comprehension of phenotypic and genotypic variation is a sine qua non for breeding progress in animal production. Here, we investigated an evolutionary subdivision of domestic chickens based on their phenotypic and genotypic variability using a wide sample of 49 different breeds/populations. These represent a significant proportion of the global chicken gene pool and all major purposes of breed use (according to their traditional classification model), with many of them being characterized by a synthetic genetic structure and notable admixture. We assessed their phenotypic variability in terms of body weight, body measurements, and egg production. From this, we proposed a phenotypic clustering model (PCM) including six evolutionary lineages of breed formation: egg-type, meat-type, dual purpose (egg-meat and meat-egg), game, fancy, and Bantam. Estimation of genotypic variability was carried out using the analysis of five SNPs, i.e., at the level of genomic variation at the NCAPG-LCORL locus. Based on these data, two generally similar genotypic clustering models (GCM1 and GCM2) were inferred that also had several overlaps with PCM. Further research for SNPs associated with economically important traits can be instrumental in marker-assisted breeding programs.

1. Introduction

The poultry industry is currently the most highly efficient livestock production sector, and the domestic chicken, Gallus gallus (Linnaeus, 1758), is the most common farm animal and a notable model organism (e.g., [1,2]). During long-term domestication of poultry, various breeds have been formed that differ significantly, both at the phenotypic and genetic levels, in terms of body weight, plumage color, and many other traits [3,4,5,6]. According to Bennett et al. [7], breeding efforts in the period from the late Middle Ages to the present day resulted in a doubling of the body size and a change in the skeleton morphology in chickens. Significant changes in overall appearance, arising from the synthesis of breeds through crossbreeding and selection, reflect the acquired biological characteristics of these birds and can be closely related to the purpose of use (i.e., utility types), and admixture of breeds formed from the moment of domestication and during further breeding. Therefore, information on the phenotypic diversity of poultry and its genetic background, including candidate genes and quantitative trait loci (QTLs) associated with conformation, body weight and egg production, is very important and relevant [8,9]. This information may be of particular importance for local breeds and populations of chickens (e.g., [10,11,12,13,14]), since it can be used for significant acceleration of breeding progress in these populations [15].
One of the areas in the chicken genome presumably associated with growth traits is a region on chromosome 4 (GGA4) that embraces the candidate genes LCORL (ligand dependent nuclear receptor corepressor-like) and NCAPG (non-SMC condensin I complex, subunit G). At the NCAPG-LCORL locus and in the area close to this region, SNPs were found that are associated with the weight of internal organs in chickens [16], egg weight [17], and oviduct size [18]. The NCAPG-LCORL region has also been studied in mammals and has been identified as a locus associated with growth and developmental traits. Furthermore, significant associations of this region with height in humans were shown among the European [19], Japanese [20], and African American populations [21], as well as in relation to body weight, growth, and skeletal size in cattle, horses, pigs, and sheep [22,23,24,25,26,27]. According to Lyu et al. [28], LCORL is one of the key genes that determine the characteristics of body weight in vertebrates and can be considered as potentially affecting the growth of chickens.
A unique bioresource collection farm at the Russian Research Institute of Farm Animal Genetics and Breeding (RRIFAGB) involves almost 50 chicken breeds and populations of various purposes, some of which are synthetic (Table S1). As an extensive sample of the world gene pool of chicken breeds [29,30], the bioresource collection is a good model for studying the phenotypic and genetic diversity of chickens [31]. It encompasses many commercial, local, and fancy breeds that conform to the traditional classification model (TCM) in terms of productivity and purpose of use, i.e., egg-type breeds (ETBs), meat-type breeds (MTBs), dual purpose breeds (DPBs), game breeds (GBs), and fancy breeds (FBs; also, ornamental or ‘decorative’ breeds) [32]. In particular, ETBs available in the collection are distinguished by high egg production, lower body weight, and light bones. MTBs are characterized by the development of pectoral and pelvic girdle muscles, and coarse skeleton, being also selected to reduce bone weight without reducing muscle weight. DPBs, which are often synthetic, include egg-meat breeds (EMBs) and meat-egg breeds (MEBs), and are intermediate between ETBs and MTBs. Depending on the preferred targets of selection, they belong either to MEBs (if meat productivity traits are more targeted), or to EMBs (if egg performance traits are predominantly selected for), while there is basically no essential difference between them in body weight and exterior. GB breeds are distinguished by unusually strong bones, have an often high and vertical body posture, are not very developed, but have very dense muscles. FB breeds are distinguished by the presence and strong development of one or several unusual (ornamental) traits, for example, dwarfism in Bantams. This has become the main selection factor in these breeds; therefore, the traits of meat and egg productivity fade into the background [32].
As a result of the assessment of chicken breeds and populations by phenotype and genotype (i.e., at certain genetic loci), it is possible to clarify their belonging to the main evolutionary branches of domestic chickens and types of their breed formation. As postulated by Moiseyeva et al. [3], there are four main evolutionary types of chicken breeds: egg, meat, game, and Bantam. The first of these, egg type, is suggested to be inherent in the birds of Mediterranean roots, and the other three have Asian roots. At the same time, there is a significant number of breeds that are difficult to relate with complete certainty to one of these four evolutionary lineages and which are mainly created synthetically, i.e., due to the crossing of different breeds and random or deliberate introgression during further breeding. As a rule, these breeds have a wide variety of geographic origins and pronounced genetic admixture and belong to DPB and FB breeds.
With this in mind, we contend that it is essential to conduct a broad survey of a wide range of various chicken breeds and populations to perform an advanced analysis of their phenotypic and genotypic diversity, admixture, and phylogeny. Along with examining evolutionary aspects of the subdivision of domestic chickens and their breed formation, it would be interesting to identify the respective variants at the NCAPG-LCORL locus, which may be selection markers associated with egg production, growth, and development in chickens. A better understanding of genomic variation at this locus can help to adjust breeding programs for commercial, local, and fancy breeds and include marker-assisted selection (MAS) using NCAPG-LCORL SNPs. In this regard, the main goal of this study was to study the phenotypic and genomic variability at the NCAPG-LCORL region on GGA4 to characterize genetic differences between 49 purebred and crossbred chicken populations of various purposes of use (i.e., utility types) that belong to different evolutionary branches and TCM categories of domestic chicken. Our extensive survey of various chicken breeds and populations enabled to reveal variation at the NCAPG-LCORL locus in connection with the evolutionary lineage affiliation and purpose of use of these breeds. We also discussed use of this locus as a possible candidate for MAS for egg and meat productivity traits.

2. Materials and Methods

2.1. Experimental Design

All chicken experiments were conducted with an ethical approval of the RRIFAGB—Branch of the L. K. Ernst Federal Research Center for Animal Husbandry (Protocol No. 2020-4 dated 3 March 2020).
The objects of the present experiments were chickens from the RRIFAGB bioresource collection farm, officially referred to as the “Genetic Collection of Rare and Endangered Chicken Breeds” (Pushkin, St. Petersburg, Russia), based on which this investigation was carried out.
In total, the study included 954 individuals from the following 49 purebred and crossbred populations that, according to TCM, are characterized by different purpose of use, with the alphabetic codes of each population being given in the parentheses: ETB, Leghorn Light Brown (LLB), Minorca Black (MB), Russian White (RW, of the most recent RRIFAGB collection strain sampled in 2016; RWG), RW (of a historical RRIFAGB collection strain sampled in 2001; RWS), RW (of an All-Russian Poultry Research and Technological Institute collection strain sampled in 2001; RWP); MTB, White Cornish (of commercial cross Smena-6, Line 1; WC1), White Cornish (of commercial cross Smena-6, Line 2; WC2), inter se crossbreds White Cornish × (Brahma Light × Sussex Light) (WC × (BL × SL)) and White Cornish × (Sussex Light × Amrock) (WC × (SL × Ar)), Red White-tailed Dwarf (RWD); DPB/EMB, Zagorsk Salmon (ZS), Pushkin (Pu), Rhode Island Red (RIR), Leningrad Mille Fleur (LMF), New Hampshire (NH), Leningrad Golden-and-gray (LGG), Pantsirevka Black (PB); DPB/MEB, Australorp Black Speckled (ABS), Aurora Blue (AB), Australorp Black (AoB), Amrock (Ar), Naked Neck (NN), Pervomai (Pm), Plymouth Rock Barred (PRB), Poltava Clay (PC), Sussex Light (SL), Faverolles Salmon (FS), Tsarskoye Selo (Ts), Yurlov Crower (YC), inter se crossbreds Sussex Light × Amrock (SL × Ar), Tsarskoye Selo × Sussex Light (Ts × SL), Tsarskoye Selo × (Sussex Light × Amrock) (Ts × (SL × Ar)), Brahma Light × Sussex Light (BL × SL); GB, Orloff Mahogany (OM), Moscow Game (MG), Uzbek Game (UG), inter se crossbreds Uzbek Game × Amrock (UG × Ar); FB, Russian Crested (RC), Ukrainian Muffed (UM), Bantam Mille Fleur (BMF), Brahma Buff (BB), Brahma Light (BL), Hamburg Silver Spangled Dwarf (HSSD), Poland White-crested Black (PWB), Silkie White (SW), Cochin Bantam (CB), Frizzle (F), Pavlov Spangled (PS), Pavlov White (PW) (see also Table S1 for further details). The basic diet and maintenance conditions were similar for all the experimental birds and comply with zootechnic/zoohygienic standards.

2.2. Phenotypic Characteristics of the Studied Chicken Populations

To assess the phenotypic diversity, a core of the RRIFAGB bioresource collection was examined including the 39 breeds and populations of chickens that represent, according to TCM, various purposes of breed use (Tables S2 and S3). We collected a series of phenotypic traits including body weight of sexually mature birds at the age of 52 weeks and 13 main body measurements at the age of 330 days were obtained. The body measurements were produced using a compass and a tape measure and included: body length (cm), body slanting length (cm), body and neck length (cm), keel length (cm), chest girth (cm), chest depth (cm), pectoral angle (°), distance between shoulder joints (cm), distance between hip joints (cm), femur length (cm), tibia length (cm), shank length (cm), and shank girth (cm). Morphometric parameters for hens and cocks specific to each breed/population are presented in Tables S2 and S3, respectively. Egg production was assessed over a 52-week life period and egg weight at 35 weeks of age (Table S2).
A variety of chicken exterior parameters was further examined relative to TCM and other clustering models (evolutionary affiliation), and genotypes at the NCAPG-LCORL locus.

2.3. Genotyping of Chickens and SNP Data Processing

DNA used in this study was isolated from whole blood cells by the conventional phenol-chloroform method. SNP scanning was performed using an Illumina Chicken 60K SNP iSelect BeadChip (Illumina, San Diego, CA, USA). Ten SNPs were selected in the NCAPG-LCORL region on GGA4 using the PLINK 1.9 program [33] and the extract function. Quality control of genotyped SNP loci was proceeded using PLINK 1.9. Additionally, DNA samples with a SNP genotyping quality of more than 90% were included in the further analysis as assessed using the GenomeStudio 2.0 software (Illumina Inc., San Diego, CA, USA). A threshold was set for Hardy–Weinberg equilibrium (HWE) errors (at p < 0.0001), and only SNPs with a minor allele frequency (MAF) of more than 5% were taken into account. After all filtering steps, five SNPs were selected for subsequent computations.

2.4. Mathematical and Statistical Analyzes

To assess variability of phenotypic traits, a heatmap for the distribution of the 39 phenotyped chicken breeds and populations was built using the heatmap function in the stats package (R v. 4.2; [34]). Fuzzy analysis clustering (FAC), principal component analysis (PCA), and average linkage clustering (ALC) were implemented using R and libraries for the R environment, along with Euclidean distance metric. For the FAC method, we applied the fanny function from the cluster package [35,36]. In the case of ALC, the unweighted pair group method with arithmetic mean (UPGMA) method was employed using the Euclidean distance matrix between objects with a bootstrapping validation using 1000 bootstrap samples. The pvclust software package for R [37] was used to calculate approximately unbiased (AU) p-values and bootstrap probability (BP) values. Clusters with AU values over 95% were considered significant. The optimal number of clusters was selected for interpretation using the Elbow method [38] and the factoextra package for R [39].
To estimate genotypic variation, biometric data processing was performed using PLINK 1.9 and Microsoft Excel programs. Generation of admixture models for distinguishing clusters based on genotype data for the five selected SNPs at the NCAPG-LCORL locus, including cross-validation (CV) error plots for determining the number of ancestral populations (K), was carried out using the ADMIXTURE program [40].
Degree of genetic diversity of the analyzed populations was evaluated by the indicators of observed (Ho) and expected (He) heterozygosity as calculated based on data for the genotype and allele occurrence frequencies at each polymorphic locus. Assessment of genetic diversity between populations was also carried out using the Hudson FST statistics implemented in the EIGENSOFT 6.1.4 software package [41].
The correspondence of the allele and genotype frequency distribution to HWE in each population was verified using the χ2 test. In particular, we analyzed the HoHe deviations for each locus in accordance with the HWE principle that also states that genotype frequencies are related to allele frequencies by simple (quadratic) relationships [42]. Estimation of the reliability of the data obtained was carried out using the Pearson χ2 test. If the obtained value of the χ2 statistic is greater than the critical one (i.e., 3.84, the number of degrees of freedom being 1), it was concluded that there was a shift in the genetic equilibrium in an analyzed population. For the studied populations, the inbreeding coefficient Fis was also calculated [43].
Using the STATISTICA 10.0 package (Statsoft, Inc./TIBCO, Palo Alto, CA, USA), a comparison of differences in allele frequencies between population groups (clusters) according to TCM and other clustering models was conducted by employing the non-parametric Kruskal–Wallis test for one-way analysis of variance (ANOVA) by ranks because the data did not pass the normality test. Boxplots were generated using STATISTICA 10.0, as well.
Pairwise values of the FST statistic and the average within-group and between-group divergence D were calculated using the SMARTPCA package (part of EIGENSOFT, [41]), as described elsewhere [44]. Unrooted neighbor-joining dendrograms were constructed based on pairwise FST statistics and average between-group divergence D using the online T-REX tool with the tree inference, also known as the NJ option [45].
The Chicken QTLdb database [46] was explored to test if any of the five significant SNPs identified in the present study would overlap with the previously established QTLs at the NCAPG-LCORL locus.
Linkage disequilibrium (LD) between pairs of SNPs in the 49 chicken populations was assessed using the PLINK 1.9 software, the D′ coefficient proposed by Lewontin (see for review [47]), and the squared Pearson correlation coefficient r2 [48]. LD block structure was determined according to the solid spine algorithm as implemented in the Haploview 4.2 software [48] wherein the specified parameters corresponded to the values D′ ≥ 0.75.

3. Results

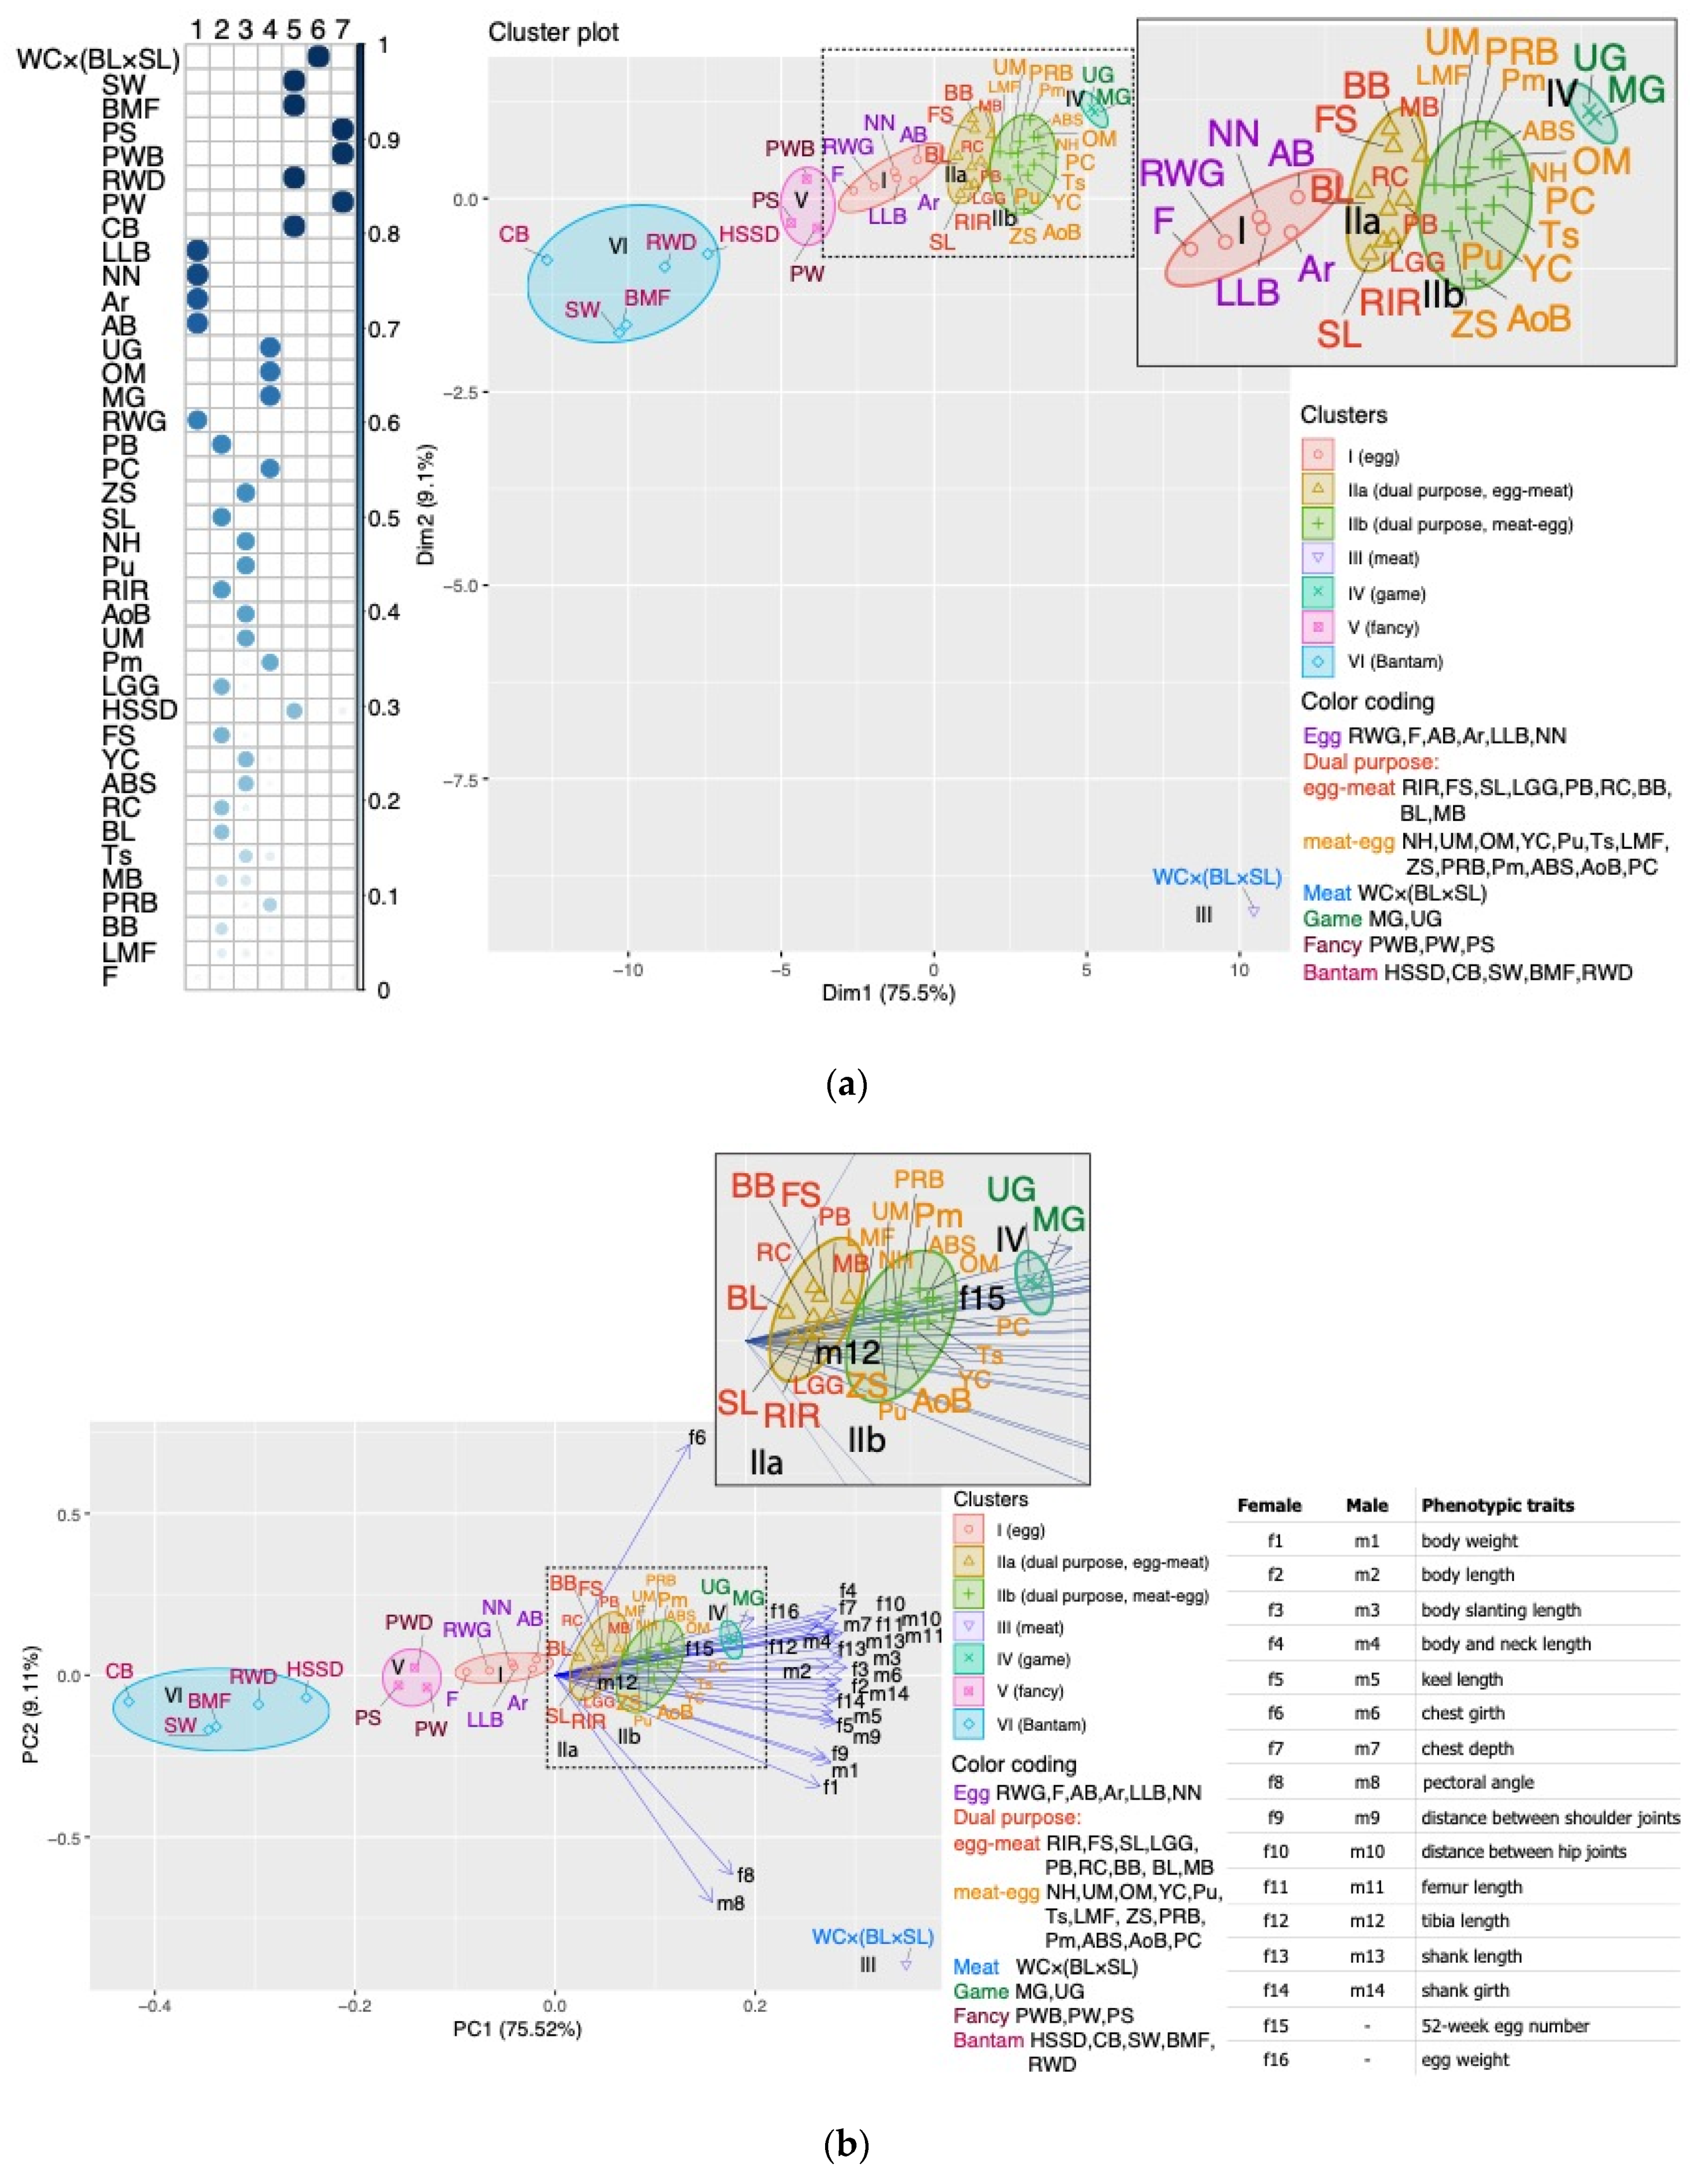
3.1. Analysis of Phenotypic Traits and Breed Clustering by Phenotype

As a result of the survey across the 39 breeds and populations of chickens, values of phenotypic traits were obtained for adult birds of both sexes (Tables S2 and S3). Variation was observed in terms of body weight, 13 main body measurements, egg number over a 52-week period of life, and egg weight. Herewith, the average body weight of females was 2.23 ± 0.80 kg, and that of males 2.49 ± 0.90 kg. The average egg production was 149.55 ± 27.67 eggs, and the average egg weight was 57.14 ± 4.60.
The clustering patterns by phenotypic traits in the breeds and populations observed were produced using more sophisticated mathematical approaches and are discussed in detail below.
Before the onset of the experiments, all breeds and populations in the RRIFAGB bioresource collection were a priori divided into groups in accordance with TCM, i.e., with five generally accepted categories (purposes of breed use, or utility types), namely ETBs, DPBs (with two subcategories, EMBs and MEBs), MTBs, GBs, and FBs (Table S1).
For all phenotypic traits (Tables S2 and S3) measured in hens and cocks, FAC and PCA clustering of breeds and populations (Figure 1a,b) revealed configurations (patterns) of breed grouping that differed from that in TCM. In these analyses, the first component corresponded to 75.5% of genetic variability, and the second one was responsible for 9.1% of genetic variability. In general, using both FAC (Figure 1a) and PCA (Figure 1b), six clusters were identified that we attributed, with a certain degree of conventionality, to ETBs (cluster I), DPBs (II) (including subclusters EMB/IIa, and MEB/IIb), MTBs (III), GBs (IV), FBs (V), and BTBs (VI; i.e., carriers of the dwarf mutation). We designated this breed grouping pattern as the phenotypic clustering model (PCM).
Within clusters I, IIa and IIb, there was a core of breeds that more or less adequately matched the basic characteristics of each breed category, as well as several other breeds that joined the core due to the similarity of the main phenotypic traits, regardless of their affiliation according to TCM and often in contrast to TCM. For example, the RWD breed was assigned to BTBs instead of MTBs by its phenotypic characteristics (Tables S2–S4).
A clear differentiation and a significantly isolated position on the FAC and PCA plots (Figure 1a,b) were observed for the only representative of the MTB category, i.e., the WC × (BL × SL) population (single cluster III). A separate position was also occupied, on the one hand, by clusters of two true GBs (IV), i.e., MGs and UGs, and, on the other hand, by BTBs and similar dwarf chickens (VI). Interestingly, a separate FB cluster (V) included the following three closely spaced and similar breeds with the most pronounced ornamental characters: PWB, and two varieties of the Pavlov breed (PS and PW). The suggested PCM and the respective subdivision of breeds into six phenotypic clusters were further used for comparison with other clustering patterns (models) obtained on the basis of both phenotypic traits and SNP genotypes at the NCAPG-LCORL locus.
Similarly to PCM (as in Figure 1a,b), the populations were located on the FAC and PCA plots that were produced for morphometric characters only (Figures S1a and S2a). At the same time, a different pattern can be seen in the FAC and PCA plots for egg production characteristics (Figures S1b and S2b).
A similar (as in Figure 1a,b) distribution of breeds and populations by phenotypic traits was discovered when using other mathematical methods of comparative analysis, i.e., building a heatmap based on indicators of body weight, egg weight, and egg number (Figure 2), and phylogenetic UPGMA trees using Euclidean distances for different groups of characters (all, Figure S3a; morphometric, Figure S3b; and egg characters, Figure S3c). Some incongruent clustering patterns observed in comparison with the FAC and PCA plots (Figure 1a,b) were explained in each case by peculiarities of the applied mathematical algorithms and a sample (set) of the phenotypic indicators used.

3.2. Analysis of Genetic Variation at the Locus NCAPG-LCORL

3.2.1. Population Genetic Parameters

As a result of SNP scanning, five significant SNPs were identified in all the 49 breeds and crossbreds in a region on GGA4 that harbors NCAPG-LCORL, as well as in the flanking regions as follows: GGaluGA265966, GGaluGA265969, rs15619223, rs14491017, and rs14491028 (Table 1). Genotype frequency distributions for the five SNP markers in the 49 chicken populations are presented in Table S4.
Analysis of the actual and theoretical distribution of genotypes (data not shown) revealed a significant shift (p < 0.05) of the genetic equilibrium for the rs14491017 substitution in the Ts × SL crossbred chickens (χ2 = 4.25), that for the rs14491028 substitution in the chicken breeds Ts (χ2 = 5.71), NH (χ2 = 5.00), and Pu (χ2 = 3.95), and for GGaluGA265969 substitution in the chicken populations F (χ2 = 4.36) and PRB (χ2 = 5.14).
For the substitutions GGaluGA265966 and rs15619223 in all analyzed populations of the bioresource collection, regardless of breed, the χ2 values did not significantly exceed the critical value, that is, there was no significant difference between the observed and expected heterozygosity. Lower occurrence frequency of individual genotypes did not correlate with a shift in the genetic equilibrium since it was a consequence of lower frequency of individual alleles. In general, it can be noted that the populations were in the genetic equilibrium.
Inbreeding coefficient, Fis, in the studied populations of the bioresource collection varied in the range –1 ≤ Fis ≤ 1 (data not shown). The maximum negative value was found in the RWP chicken population, and the maximum positive one in the CB population. With increasing positive value of the coefficient, a rise in inbreeding occurred in the studied populations. At the GGaluGA265969 locus, two breeds, Pu (Fis = 0.44) and F (Fis = 0.46), had higher positive values. FB chickens of the BMF, SW, PS, and PW breeds differed from all other analyzed groups in that the C allele was found in all their individuals, which could indicate a strong selection pressure on this locus. As for GGaluGA265966, the UM population had Fis = 0, with Hobs = Hexp, that suggested a panmixia in this population at this marker locus.
In almost each category of chicken breeds, except GBs, some separate populations were monomorphic and had only one certain genotype for the rs15619223 marker. For instance, in three MTB populations (WC1, WC2, and WC × (BL × SL)), only the AA genotype was found. Interestingly, for this same SNP, associations with body weight and egg weight were previously found in RWG [50,51]. Thus, this locus can be considered as a potentially effective candidate for selection, since it could be selected in the process of targeted selection based on the desired trait of body weight. It can also be noted that, in the ETB populations of RWS and RWP, only the CC genotype was found at rs14491017 in all individuals.

3.2.2. Clustering of the Analyzed Chicken Breeds by Genotypes

Using the results of the genotype frequency distributions for the five SNPs in the 49 genotyped breeds and chicken populations (Table S4), we performed the appropriate clustering procedures that showed population grouping patterns that was somewhat different from those for TCM and PCM. On the respective FAC and PCA plots (Figure S4a,b), a quite clearly distinguishable, isolated localization of ETB and MTB clouds was observed, with a cloud of DPB populations between them. In this case, the first component contributed to ~30% of the total genetic variability, i.e., significantly less than the analogous first component when using the phenotypic traits, and the second component accounted for 17% of genetic variability. Hereby, the observed clouds (clusters) were more diffuse along the contours. Besides the true representatives of each cluster (ETBs, MTBs, or DPBs), breeds and populations classified in other TCM and PCM categories were joining them. The ETB cluster was subdivided into two distinct subclusters (Ia and Ib), and the DPB cluster could also be subdivided into two subclusters (IIa and IIb). In addition, each cluster (subcluster) had outliers, e.g., LLB and HSSD in the ETB subcluster Ia, AoB in the DPB subcluster IIb, and CB and Pu in the MTB cluster, which also did not always correspond to the definition of either cluster. We designated the resulting distribution pattern of populations relative to each other (Figure S4a,b) as the genotypic clustering model 1 (GCM1).
Construction of the UPGMA tree using Euclidean metrics led to a slightly different clustering of the analyzed groups of chickens (Figure S4c). We conditionally designated this pattern as genotypic clustering model 2 (GCM2), which consists, as it were, of four population groups (clusters). In the first GCM2 group, we conditionally combined two ETB and two BTB populations from the GCM1 subcluster Ia. The second GCM2 cluster involved one DPB/MEB and one BTB population from the GCM1 cluster III; and the third GCM2 cluster involved three FB populations (those that formed a separate FB cluster in PCM), one ETB, and one DPB/EMB population from the GCM1 subcluster Ia. The largest was the fourth GCM2 cluster that consisted of the following two large subclusters: IVa (mainly MTBs with adjoining purebred populations and crossbreds from the GCM1 cluster III) and IVb (breeds and crossbreds from the GCM1 subclusters Ib, IIa, and IIb).

3.2.3. Assessment of Breed Admixture by Genotypes

In general, there was a significant admixture of the 49 chicken genotyped breeds and populations, which made it somewhat difficult to identify clearly pronounced admixture models. Comparative analysis of admixture was carried out between groups of breeds subdivided both in relation to their purpose of use (TCM) and according to other clustering models (PCM, GCM1, and GCM2). The plots for determining the number of K groups in the admixture models that could best fit the obtained data showed that the optimal number of ancestral populations was close to the values of K = 6 (Figure S5).
Analysis of admixture by genotype frequencies revealed some genetic characteristics of individual populations and their groups at the NCAPG-LCORL locus using TCM, PCM, GCM1, and GCM2 (Figure S6). Particularly, clustering analysis of admixture models revealed to a certain extent the subdivision of individuals according to their origin. At the same time, ETB and MTB chickens, as a rule, tended to form two separate patterns (clusters), which is consistent with the results of genotype frequencies and variants of the compared clustering (classification) models.

3.2.4. Genetic Differentiation of Populations by Alleles

At the first stage of determining the genetic differentiation of the 49 breeds and populations by allele frequencies in the five SNPs (as presented in Supporting Information (SI) S1), they were combined into classes and subclasses according to TCM. When comparing allele frequencies for the GGaluGA265969 substitution using the Kruskal–Wallis test (SI S2), we found out that ETB chickens significantly differed from MTBs and FBs, MTBs from DPBs, DPBs from FBs (at p < 0.05; SI S2a and SI S3a), and the MEB subgroup from FBs (at p < 0.05; SI S2f and SI S3a). For the GGaluGA265966 substitution, differences were found for the ETB group in comparison with the MTB and DPB groups (p < 0.05; SI S2b and SI S3b), as well as with MEB (p < 0.05; SI S2g and SI S3b). For the SNPs rs15619223 and rs14491028, ETB chickens differed from all other groups and subgroups at p < 0.05 (SI S2c,h and SI S3c; and SI S2e,j and SI S3e, respectively). MTB chickens differed in frequency from the DPB group in the SNPs rs15619223 and rs14491017 (p < 0.05; SI S2c and SI S3c; and SI S2d and SI S3d, respectively). In addition, the MTB group had significant differences with the MEB subgroup in allele frequencies at the rs15619223 locus (p < 0.05; SI S2h and SI S3c), as well as with the EMB and MEB subgroups at the rs14491017 locus (p < 0.05; SI S2i and SI S3d). FB chickens significantly differed from the ETB, DPB, and MEB subgroups at GGaluGA265969 (p < 0.05; SI S2a and SI S3a), and also from ETB, MTB, and DPB at rs15619223 (p < 0.05; SI S2c,h and SI S3c).
Next, we compared clusters and subclusters if combined according to PCM for the significance of differences in allele frequencies in the five SNPs (SI S3f–j). All PCM clusters/subclusters differed in pairs at all five marker loci, except for FBs which had significant pairwise differences at four loci. At the same time, FBs had the greatest number of significant pairwise differences, i.e., 17. For other clusters/subclusters, the following number of significant pairwise differences was found: ETBs and MTBs, 12 each; MEBs, 11; EMBs, 8; and GBs, 6.
Finally, when comparing GCM1 clusters/subclusters, numbers of their significant pairwise differences were revealed in the following descending order: ETB/Ia, 11 (in four SNPs); ETB Ib, 10 (in five SNPs); DPB/IIa, 11 (in five SNPs); DPB/IIb, 8 (in four SNPs); and MTB/III, 14 (in five SNPs) (SI S3k–o).
If we estimate the number of significant pairwise differences for individual SNP loci for a total of all three models (TCM, PCM, and GCM1), the following data were obtained: GGaluGA265966, 14; GGaluGA265969, 16; rs15619223, 28; rs14491017, 23; and rs14491028, 14 differences (SI S3).
Genetic differentiation between the analyzed groups of chickens by allele frequencies was also compared based on paired FST. The differences for the calculated pairwise FST values were significant at p ˂ 0.05. In the case of TCM (data not shown), the maximum FST distances relative to other groups were obtained for ETBs when paired with MTBs (0.330), EMBs (0.237), GBs (0.225), and MEBs (0.178), as well as for the pair MTB–FB (0.153). If PCM was applied (Table 2), FBs demonstrated the greatest FST distances when comparing to MTBs (0.393), GBs (0.321), DPBs (0.219), BTBs (0.142), and ETBs (0.100).
An unrooted neighbor-joining dendrogram built on the basis of pairwise FST values for six PCM groups (Figure 3) seemed to adequately reflect both TCM and PCM, and the contemporary concept of the main evolutionary branches of domestic chickens [3]. Herewith, FBs and BTBs were closer to ETBs (on the right side of the tree), GBs to MTBs (on the left side of the tree), and DPBs occupied an intermediate position between these two major parts of the dendrogram.
Similar relationships between the six PCM groups were also found for paired average between-group divergence values D based on allele frequencies (Table 2). Using the D metrics, a phylogenetic neighbor-joining tree was built (data not shown), which completely coincides in its topology with the FST tree (Figure 3). Additionally, an UPGMA tree was generated based on the analysis of genotype frequencies (Figure S7). Although its topology had a slightly different spatial configuration, mutual positions of individual branches relative to each other generally coincided with the topology of the FST tree.
In addition, we note that, judging from values of the average within-group divergence D, a clear interrelation was also observed within each of the six PCM groups (Table 2). BTBs and ETBs had the highest D values (1.20 and 1.27, respectively); MTBs, GBs, and FBs had the lowest D values (0.79–0.84); and DPBs showed a more intermediate value (1.11).
In general, the results of examining the populations and their groups by allele frequencies in the five SNPs showed that the compared groups of chickens differ genetically from each other, which has also been confirmed by the data on genotype frequencies.

3.2.5. Overlapping of SNPs with QTLs

Using the Chicken QTLdb database [46], we found that the NCAPG-LCORL locus (75,897,761…75,920,718; GRCg6a build [49]) harbors 15 known SNPs linked to the previously established QTLs (SI S4).
Out of the five significant SNPs discovered in the present study (Table 1), two, rs15619223 and rs14491017, were directly listed in the Chicken QTLdb database. For one more, rs14491028, there was a very close interval flanked by two known SNPs. Anyway, all the five SNPs were located near and within the NCAPG-LCORL region and overlapped with known QTLs for egg weight, egg production and growth traits (SI S4).

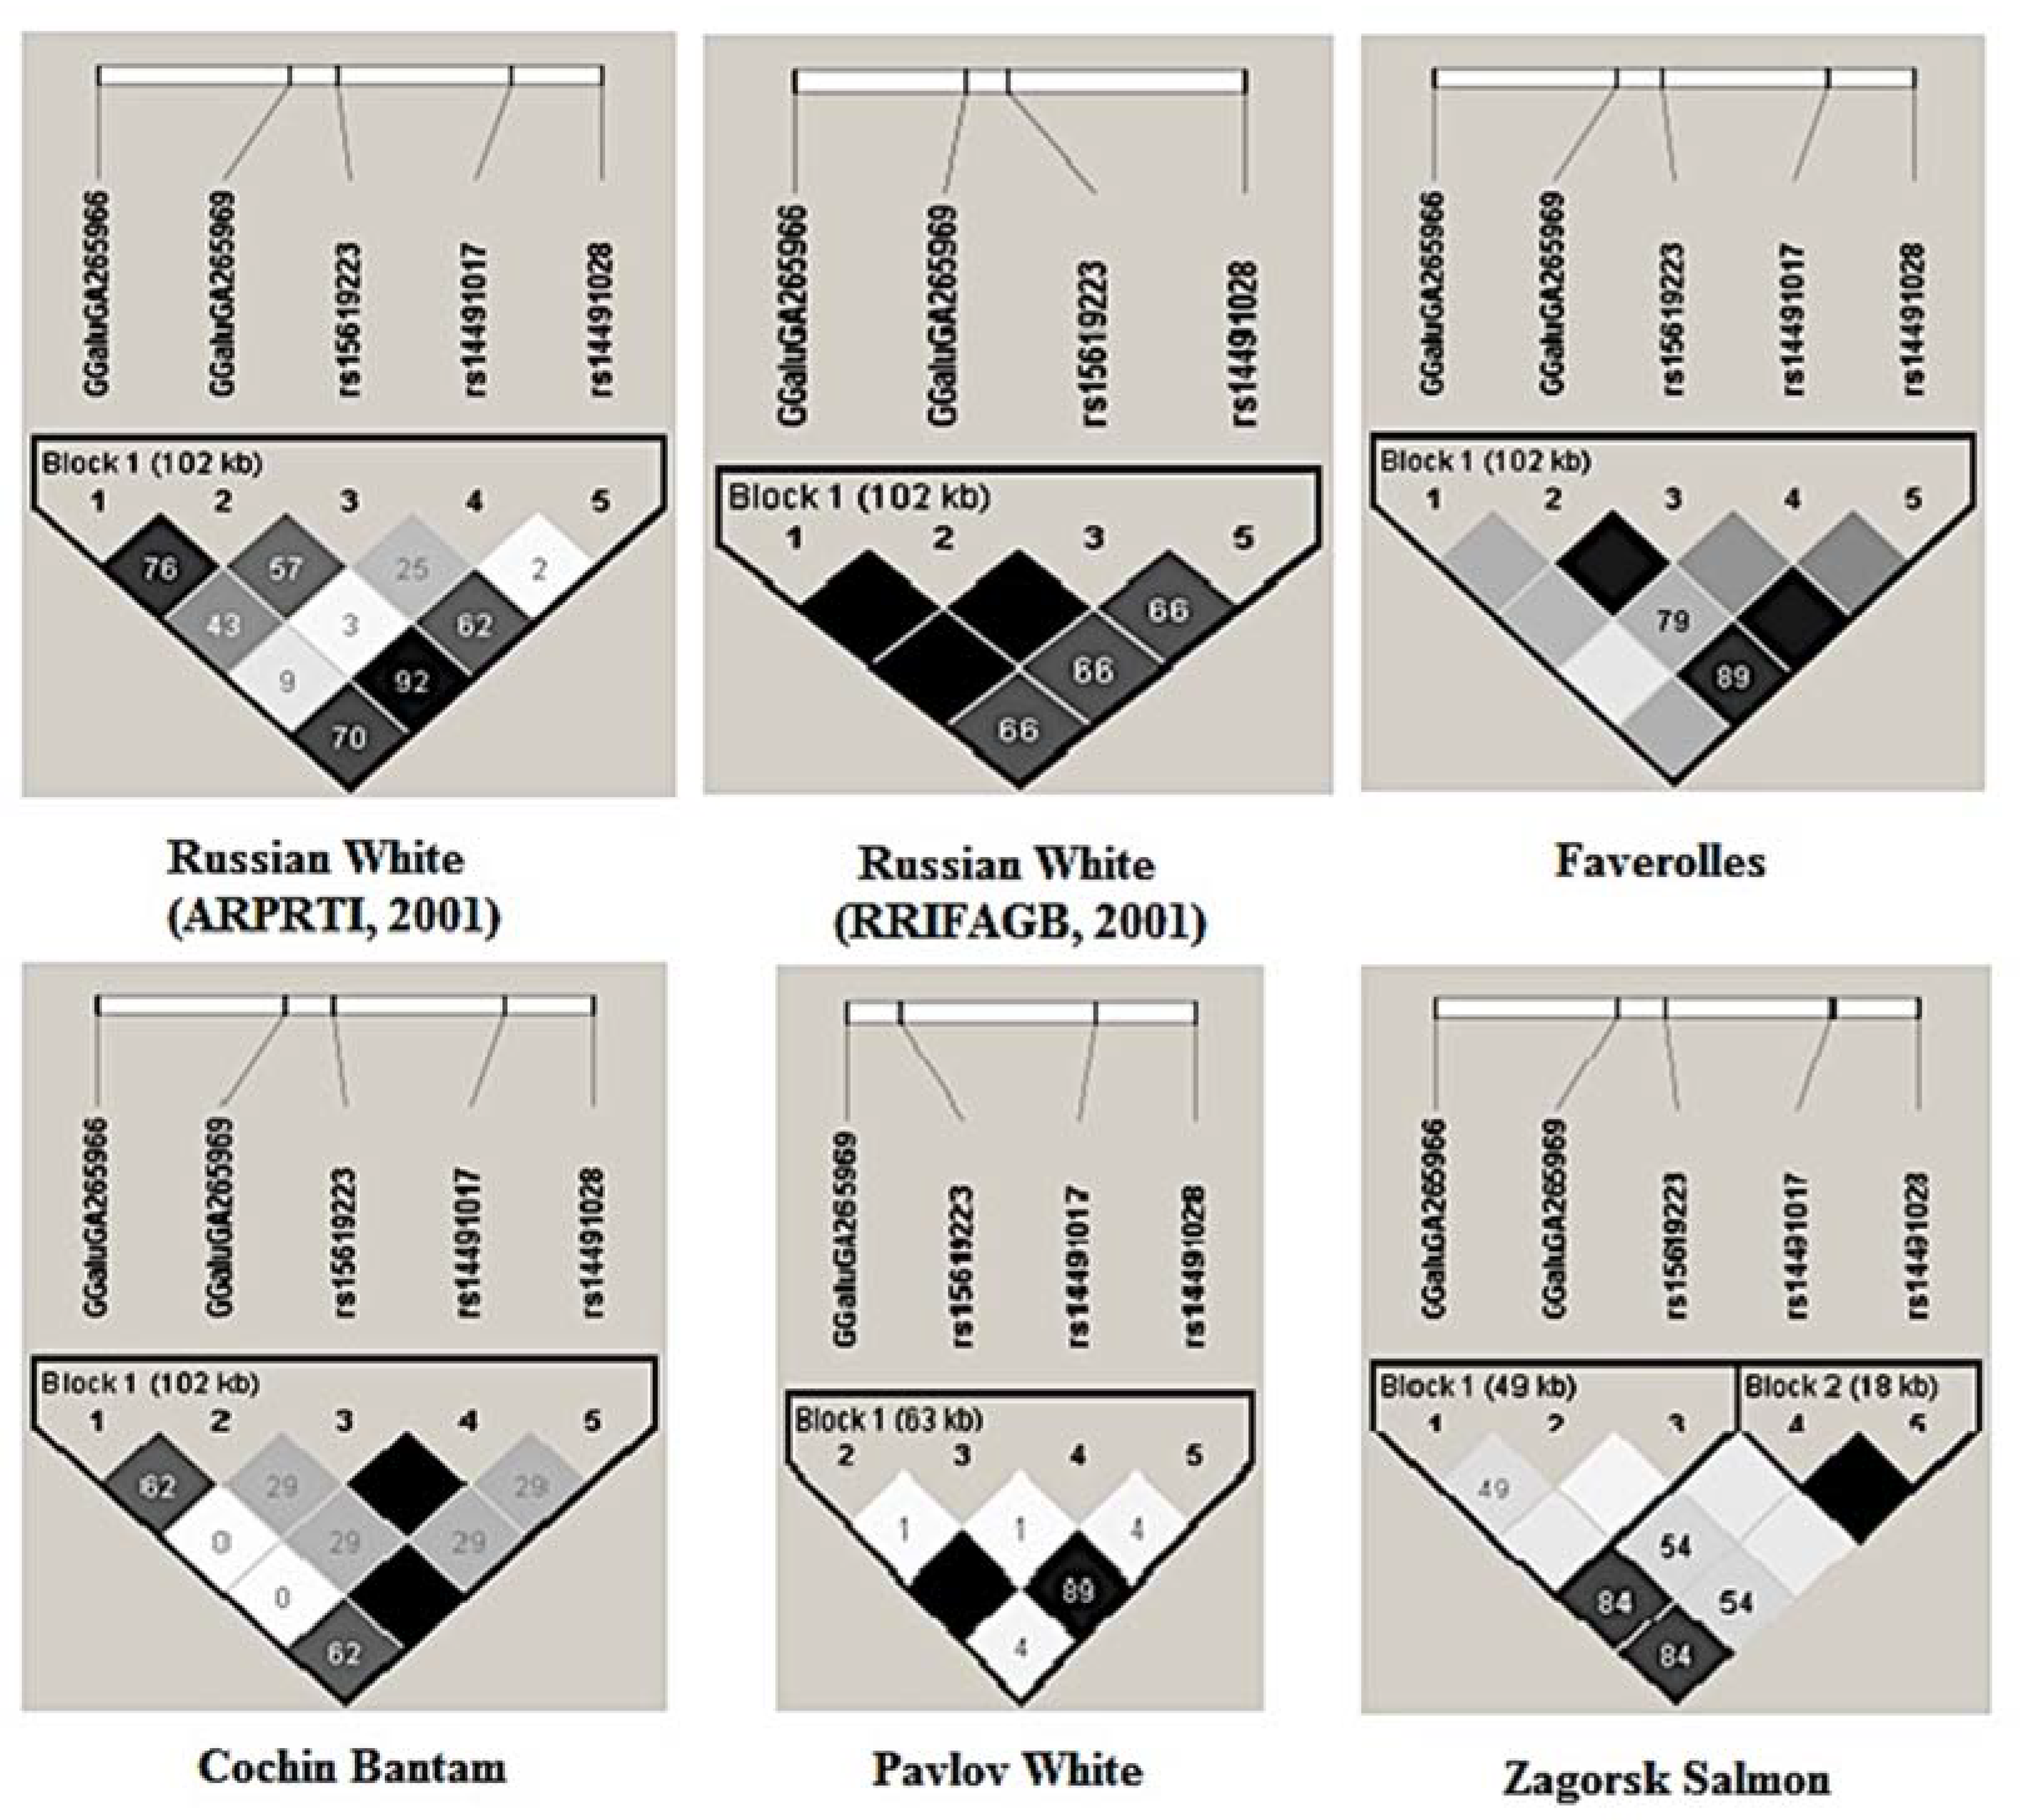
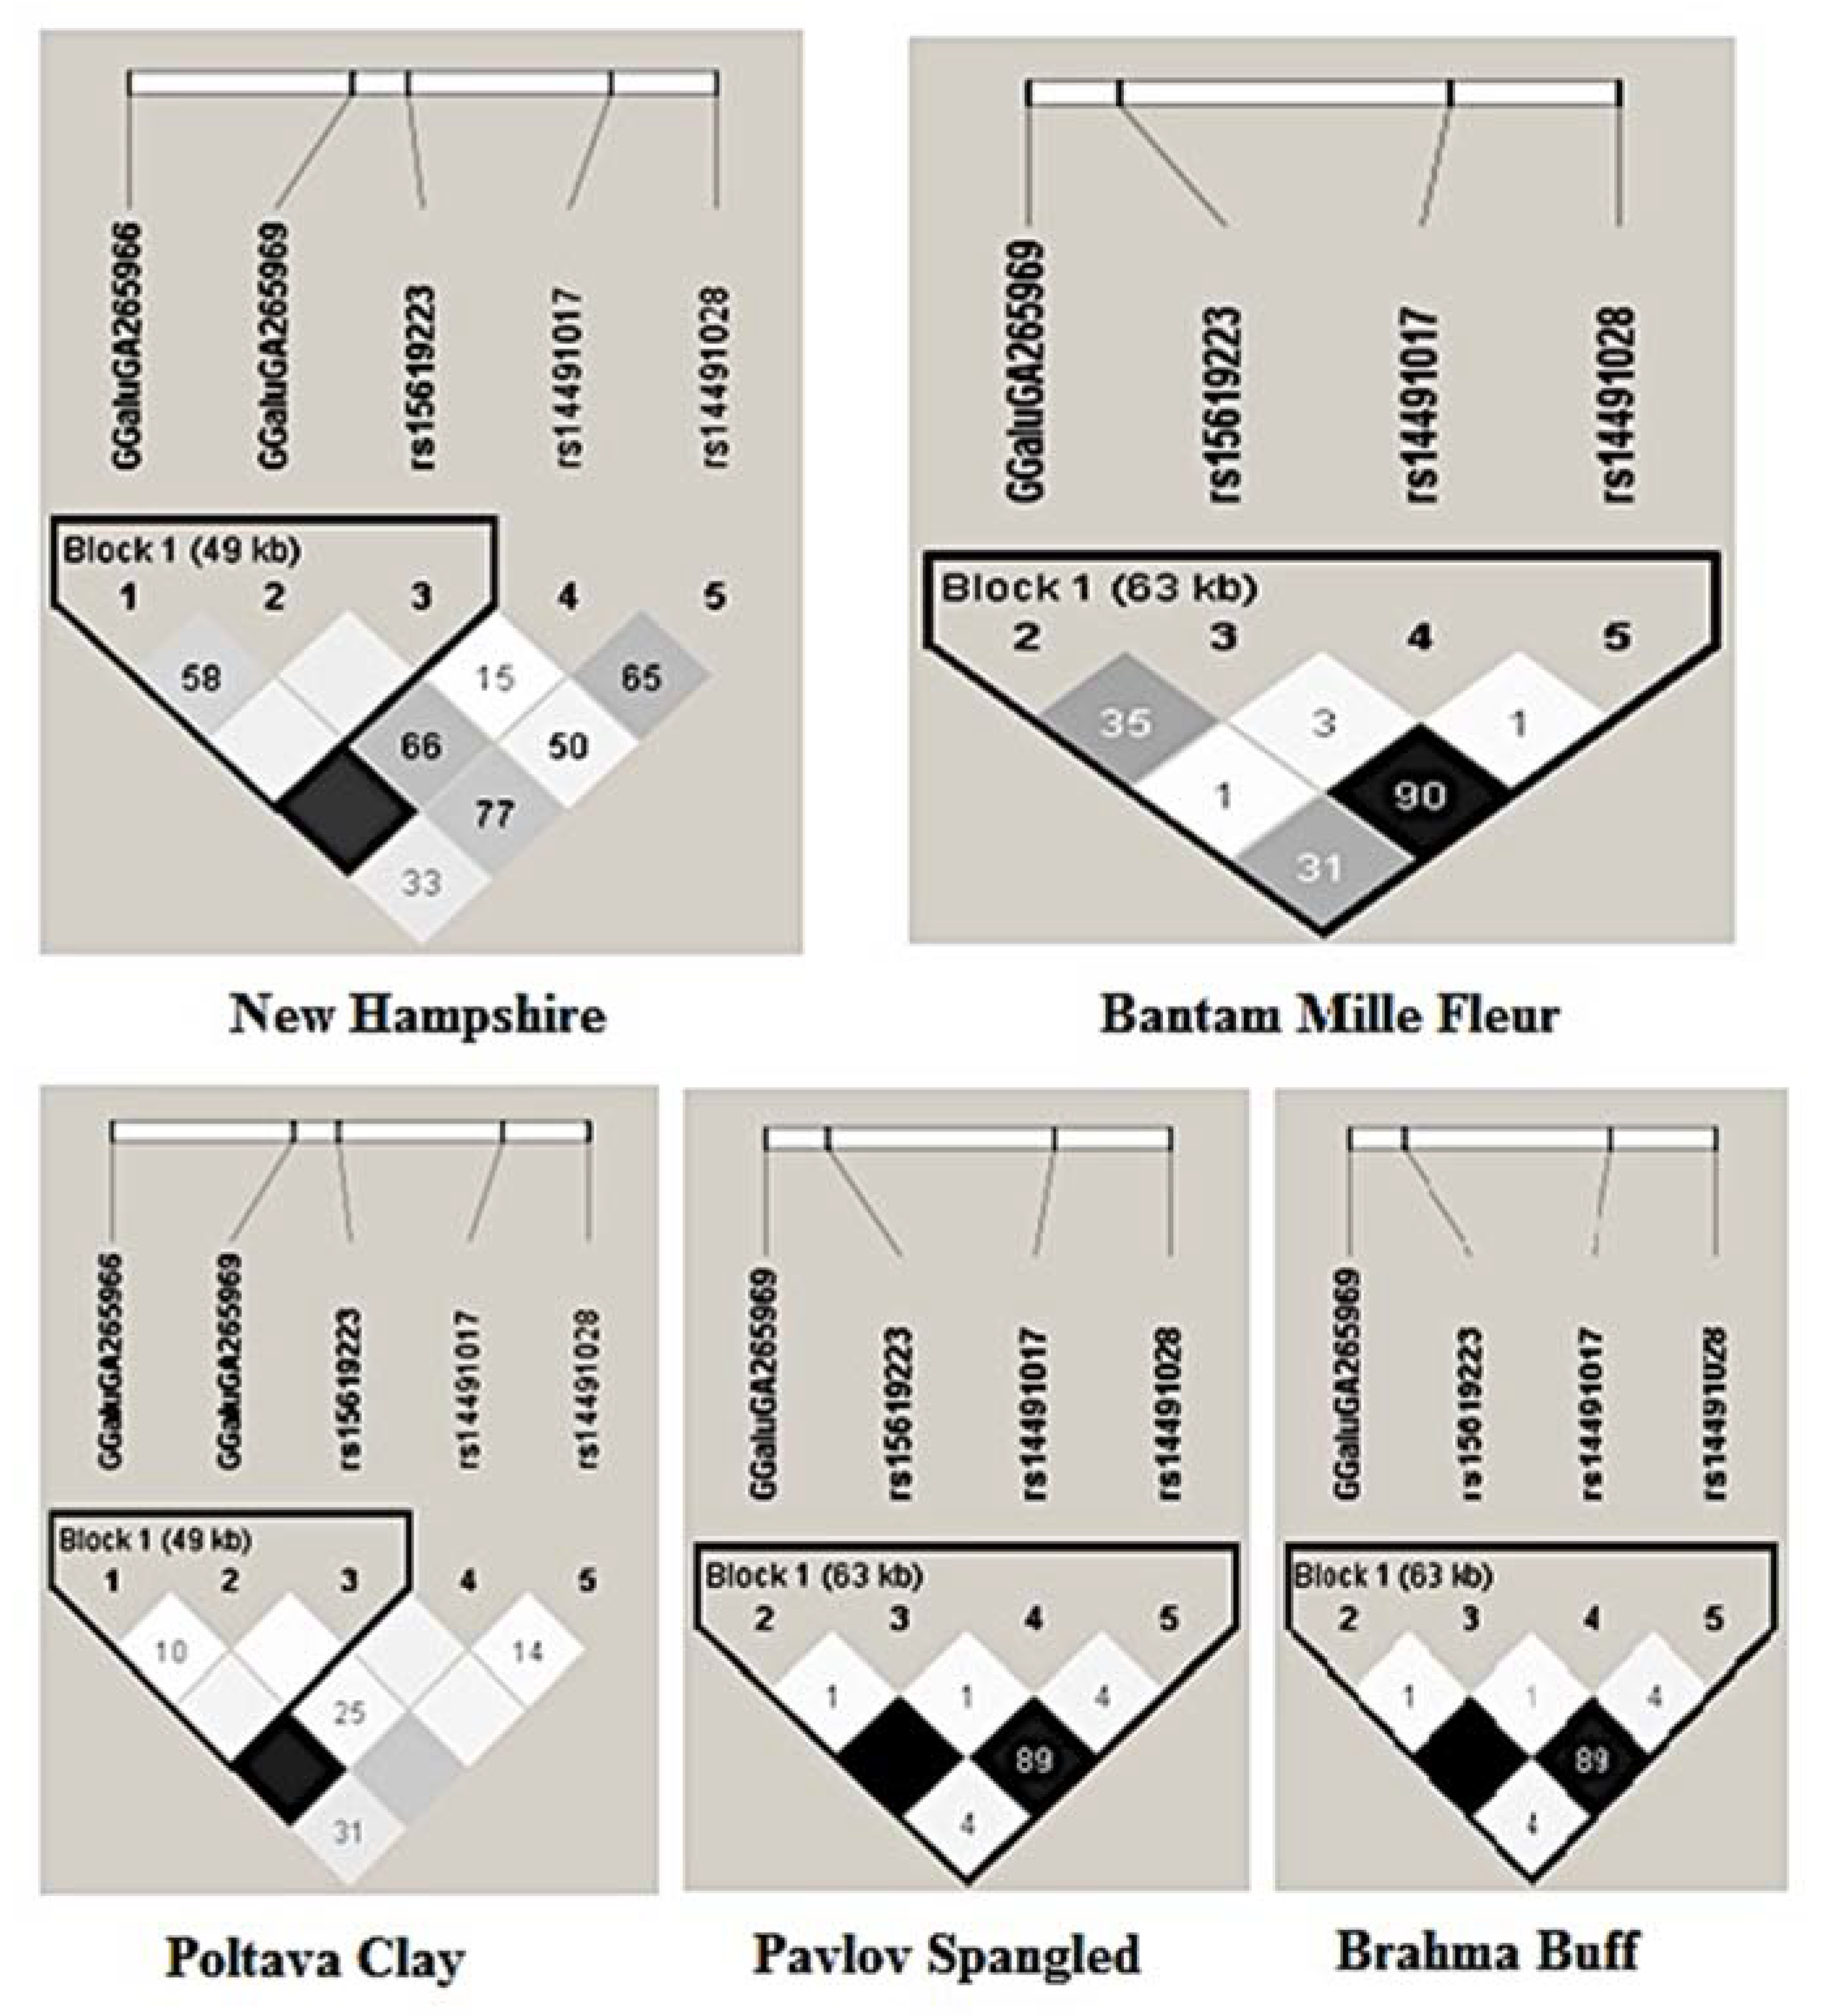
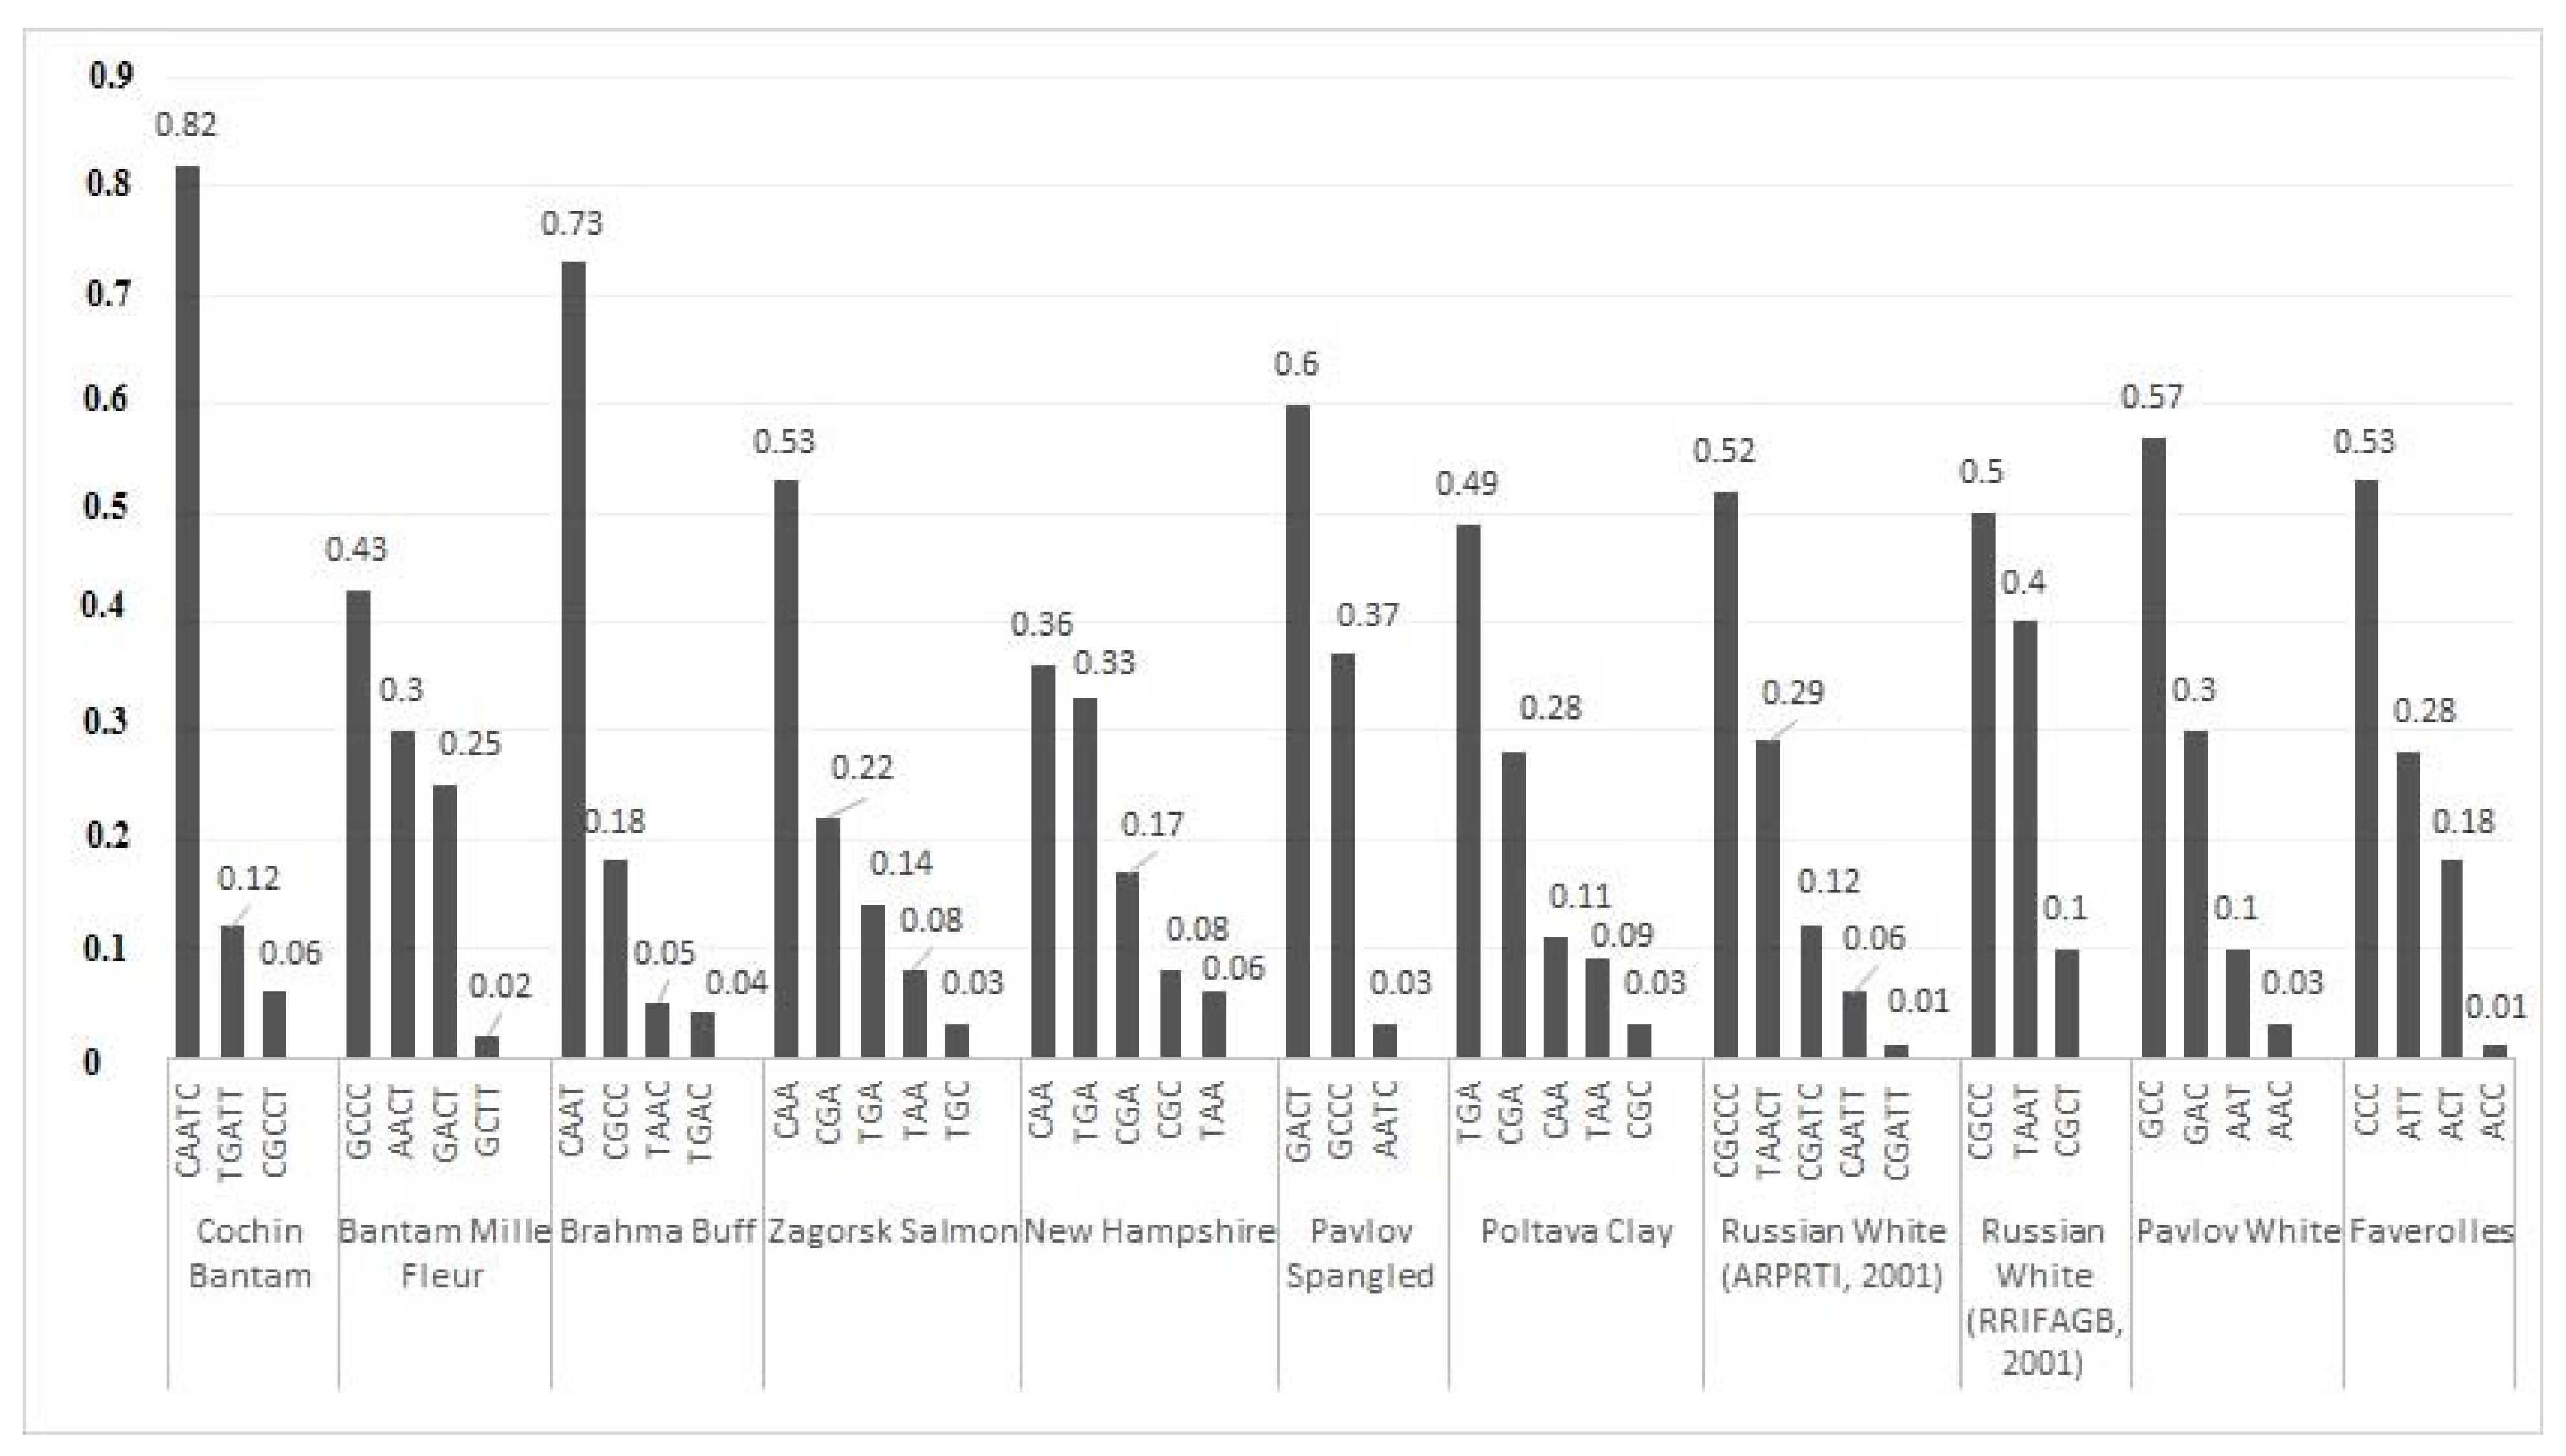
3.2.6. LD Structure of Gene Pool Breeds Based on Haplotypes

LD analysis in the 49 chicken populations resulted in identifying the following 11 populations with similar haploblocks at the NCAPG-LCORL locus: PW, BMF, PS, two historical populations of the RW breed (RWS, RWP), FS, CB, BB, NH, PC, and ZS (Figure 4). Further, a comparative assessment of these populations was carried out. As a result, a population specificity of the LD structure at the NCAPG-LCORL locus was found in these 11 chicken populations. In Figure 4, SNPs GGaluGA265966 in PW, BMF, and PS, and rs14491017 in RWS were removed from the LD analysis due to their complete heterozygosity. Two populations of the RW breed (RWP and RWS), FS, and CB showed a strong linkage between all the five SNPs, making up a common 102-kb block.
There were an analogous block structure and almost complete LD between the substitutions GGaluGA265969 and rs15619223 observed in the FS and CB breeds (r2 = 1 and r2 = 0.89, respectively), as well as a similar LD between the substitutions GGaluGA265969 and rs15619223 in BB and FS (r2 = 1 and r2 = 0.73, respectively).
In the breeds ZS, PC, and NH, a 49-kb block of similar structure can be distinguished, which included the following three polymorphisms: GGaluGA265969, GGaluGA265966, and rs15619223. In the same three breeds, linkage was revealed between the SNPs GGaluGA265966 and rs14491017: at r2 = 1 for NH and PC, and at r2 = 0.84 for ZS.
The PC and BMF breeds had the same 63-kb block structure between the substitutions GGaluGA265969, rs15619223, rs14491017, and rs14491028. Moreover, high r2 values (0.90 and 0.80) were found in these two breeds between the rs15619223 and rs14491028 nucleotide substitutions.
Figure 5 illustrates the distribution of haplotypes in the 11 studied populations. In the populations studied, a different degree of haplotype diversity was found, while only three breeds contained the same haplotypes. Of the hypothetically possible 45 haplotypes (when a single diploid individual has nine possible haplotypes) and based on the five SNPs at the NCAPG-LCORL locus, we identified 36 haplotypes. The same haplotypes (CAA, CGA, TGA, and TAA) were found in the breeds NH, PC, and ZS, with haplotype CGC being found in NH and PC. It should also be noted that there were the formation of a common SNP haploblock and the presence of complete LD between nucleotide substitutions in the above breeds.

4. Discussion

4.1. Analysis of Phenotypic Traits and a Model for Clustering Breeds by Phenotypes (PCM)

To preserve and use the available poultry genetic resources effectively, priority should be given to phenotypic characterization [52,53]. Phenotypic traits, primarily body weight and linear body measurements, are not only of economic importance, but also significant, alongside genetic parameters, in the classification of domestic animals, their assessment, and the search for ways to improve their productivity (e.g., [3,54,55,56]). Phenotypic and morphometric evaluation is often used in chicken breeding because it is simple, quick, and cost-effective (e.g., [3,53,57,58,59]). Body measurements are not uncommon in assessing the diversity of indigenous chicken breeds (e.g., [53,56,59,60]).
Based on the phenotypic diversity analysis of a wide range of global chicken gene pool breeds, we constructed PCM and compared it with TCM. For this purpose, we took phenotypic characteristics reflecting the morphometric parameters of the breeds including body weight and 13 body measurements of hens and cocks, as well as two main traits of egg productivity: egg number for 52 weeks of life and egg weight (Figure 1). We have shown that morphometric characters provided the greatest contribution to the formation of the breed clustering pattern in accordance with the PCM. This was clearly seen on the FAC and PCA plots (Figures S1a and S2a), in which the morphometric characters were used alone (i.e., without egg production traits), while fully resembling the PCM pattern. If clustering was achieved only based on egg production traits, the PCM pattern was disrupted (Figures S1b and S2b). At the same time, if we compare the characteristics of egg number and body weight, we can see that the contribution of the former to the clustering of breeds significantly exceeds the contribution of the latter (Figure 2 and Figure S1a,b). Thus, we can assume that among the morphometric and all phenotypic traits in general, the main contribution to PCM seems to be made by the traits of body measurements in females and males. Moiseyeva et al. [3] stated that body measurements, being quantitative traits, have a high heritability coefficient (h2 ≈ 0.5) and a lower intrapopulation variability. These features determine their high correlation with the genetic structure of breeds that was created over a relatively long evolutionary process of their development.
To the best of our knowledge, the proposed assessment of phenotypic diversity using phenotypic clustering of chicken breeds that we designated PCM, as well as the assessment of the contributions of certain phenotypic traits to this PCM, have not been specifically and purposefully examined in other previous studies. It is noteworthy that we carried out such assessments using quite a vast part of the world gene pool of chicken breeds that have different origins (often mixed), purpose of use, and the degree of admixture. Moiseyeva et al. [3] were also able to demonstrate good distinguishability of phenotypic (morphometric) traits to reproduce plausible breed differentiations and topologies of appropriate phylogenetic trees, even using smaller samples of 8–10 different breeds.
Our research not only has confirmed the main insights of the work by Moiseyeva et al. [3], but also significantly expanded them. Due to a larger sample of the global gene pool, including a great number of synthetic breeds and populations, and in the light of the clustering data obtained, we were able to revise the concept of four main evolutionary lineages of breed formation in domestic chickens as postulated by Moiseyeva et al. [3], which embraced ETBs, MTBs, GBs, and BTBs. According to our updated concept based on PCM, it is also necessary to distinguish two more evolutionary branches of chicken breeds, namely DPBs and FBs (Figure 1a,b). The PCM postulated by us and the appropriate concept of six major evolutionary lineages of chicken breed formation would, in our opinion, most fully reflect the entire spectrum of phenotypic diversity of the world gene pool of domestic chickens.
It should also be noted that our concept of evolutionary subdivision of domestic chickens and breed formation based on PCM also has certain discrepancies with TCM adopted in conventional and specialized literature on poultry (e.g., [32]). TCM is grounded on a rather simplified, speculative, and, to a certain extent, very artificial scheme for dividing chicken breeds into conditional utility types, i.e., purposes of use, when only one criterion for selecting poultry for egg or meat productivity can determine if a breed belongs to a certain TCM class. This traditional approach does not consider history of the origin (often mixed) and development of this breed, the degree of its synthetic nature and introgression, as well as the whole complex of its phenotypic features. This also results in significant artificiality, fuzziness, and uncertainty in terms of a defined phenotypic characterization and classification among numerous synthetic breeds from the EMB and MEB subcategories, which are commonly referred to as DPBs. The FB class looks no less artificial and speculative in TCM because it involves any breeds (including BTB) kept by fanciers for their phenotypic diversity and not related to explicit ETBs, MTBs, and GBs. Our proposed concept and PCM produced through an appropriate analysis of the phenotypic diversity of chicken breeds would highlight and correct the said shortcomings of TCM.

4.2. Genotypic Models of Clustering and Admixture

Concerning the development of two genotypic clustering models (GCM1 and GCM2), in a number of instances we noted both their congruence with each other and some similarities with PCM. For example, breeds and populations from the GCM2 cluster I were fully included in the GCM1 subcluster Ia (ETB), and members of the GCM2 subcluster IVa in the GCM1 cluster III (MTBs). Breeds of the PCM cluster V (FB) were stably clustered together in the GCM1 subcluster Ia and in the GCM2 cluster III, etc. The existing differences between the models can be attributed to the various algorithms used to construct them, and to the differences in the nature of the compared traits. It should also be noted that, for PCM, we used a fairly wide set of phenotypic traits describing both morphology and performance characteristics of poultry, while for genotypic models, one region of the chicken genome corresponding to the NCAPG-LCORL locus was employed, which apparently narrowed the resolving power of analyzing the breeds and populations by genotypes. Many other investigations including Moiseyeva et al. [3] also observed an unequal contribution of certain sets of phenotypic/genetic factors to the resulting patterns of phylogeny/clustering among examined breeds.
Nevertheless, combining data on genotyping (i.e., allele frequencies in the five SNPs) and on their grouping according to PCM showed significant differences between groups (clusters) of breeds and an expected topology of the breed phylogenetic tree (Figure 3) in full accordance with our proposed updated concept of the evolutionary subdivision of domestic chickens into six evolutionary lineages of breed formation. In addition, the observed differences at the NCAPG-LCORL locus between the identified groups (clusters) of breeds did not contradict the previous information on the relationship of variability at this locus with certain phenotypic traits (e.g., [50,51,61,62]). Considering the above, we would suggest the importance of our findings at the NCAPG-LCORL locus that demonstrated a genetic variability among a wide sample of commercial, local, and fancy chicken breeds, including synthetic ones, which largely overlaps with the patterns of their phenotypic variability and does not contradict the general ideas about history of formation and development of a particular breed.
An important aspect of our study was the detection of significant admixture among the 49 genotyped chicken breeds and populations. This was expressed in complex patterns of admixture models (Figure S6), which, as a rule, did not allow us to clearly distinguish among themselves the classes (clusters) that we proposed for four models (TCM, PCM, GCM1, and GCM2). This significant admixture can be explained by the history of mixed origin of the studied breeds, i.e., a synthetic nature of their formation, when genetic makeup of many breeds was composed by mixing the genomes of several original, distinctive breeds and/or due to individual crossbreeding events with other breeds and introgression during their breeding (e.g., [63]). Nevertheless, by exploring the obtained patterns of admixture models, one could generally notice certain differences between ETB and MTB chickens, which is consistent with the results of the genotype frequency analysis. We would also suggest that the admixture models themselves can be considered as an auxiliary tool in clarifying evolutionary signatures of subdivision and inference of demographic history among chicken breeds and populations.

4.3. Analysis of Genetic Variation at the Locus NCAPG-LCORL

Characterization of genetic variation and population genetic structure based on SNPs at key chicken performance-related genes not only helps to determine the characteristics of various commercial, fancy, and local breeds and populations, including synthetic and highly admixed ones, but also to assess whether this information can be useful in MAS [50,64]. We genotyped chickens of various purposes of use (TCM) and phenotypes (PCM) using the Illumina Chicken 60K SNP iSelect BeadChip, which revealed the presence of the five significant SNPs on GGA4 in the area of the NCAPG-LCORL locus and flanking regions.
The differences found at the genetic level, i.e., in the SNPs within the locus covering the NCAPG-LCORL genes may be of great interest, since these genes are one of the key regulators of RNA polymerase II transcription and have pleiotropic effects in terms of body weight/size and egg weight/size [65,66]. Guo et al. [67] identified genomic variants associated with the size and mass of chicken bones at the NCAPG-LCORL locus. SNPs at the NCAPG gene (rs14491030) and the LCORL gene (rs14699480) were associated with egg weight [68]. According to Yi et al. [17], rs14491030 at the NCAPG gene can simultaneously affect both egg weight and body weight. In an investigation by Barkova and Smaragdov [69], significant associations of rs14491030 at the NCAPG gene with egg weight and shell elastic deformation were found. Sun et al. [70] showed that NCAPG had a definite effect on the eggshell quality in pullets. The pleiotropic effect of the NCAPG-LCORL locus may be related to the fact that egg weight affects the body weight of chickens at birth, their physical shape and further performance [71]. Eggshell, providing gas exchange between an embryo and environment and supplying calcium to embryo bones, is of biological importance for the development of avian embryos [72]. In a study by Liu et al. [61], the LCORL locus was significantly associated with the body weight of chickens. It was also shown that the LCORL gene has different levels of expression in slow-growing and fast-growing broiler chickens.
In the present investigation, we found that following even TCM, ETB chickens in general were significantly different from chickens of other purposes of use (utility types). So, for the GGaluGA265969 substitution, significant differences were shown when comparing the ETB–MTB and ETB–FB group pairs. Presumably, such differences could be due to the fact that this SNP might be associated with the body weight of hens.
SNP rs15619223 showed the largest number (28) of significant pairwise differences between chicken groups of various use/productivity types (TCM) or various clusters/subclusters (PCM and GCM1) (SI S3). According to our previous studies [50,51], this SNP is probably associated with body weight and egg weight in RW chickens. Although for SNPs GGaluGA265966 (14 significant pairwise differences), rs14491028 (14 differences), and rs14491017 (23 differences) we did not find any other reports on their relationship with productive traits in chickens, the presence of polymorphism and a significant difference in allele frequencies between groups of contrasting chicken breeds (SI S3) would suggest considering these SNPs as potentially momentous.
In general, for three models, TCM, PCM, and GCM1, we demonstrated a reliable resolution of the obtained data on allele frequencies in the SNPs of the NCAPG-LCORL locus to discriminate chicken breeds and populations related to ETBs, MTBs, DPBs (EMBs, MEBs), GBs, or FBs (SI S3). Thus, based on our own data available for the region on GGA4 that involves NCAPG-LCORL, we can confirm that there is a definite relationship between genetic variation at this locus and phenotypic diversity in chicken breeds, and this is an important QTL for body weight and egg weight [61].
The maximum heterozygosity for a particular locus is achieved when the frequencies of its alleles are equal and depends on the number of alleles. This is relevant for populations under selection for a desired trait. In the conditions of artificial breeding of populations, parental pairs are assorted, while relationship of individuals participating in mating increases. As a result of mating closely related individuals (i.e., inbreeding), proportion of homozygous genotypes is growing in a population. An important feature of inbreeding is the constancy of allele frequencies in all inbred generations observed while the number of heterozygous genotypes declines [73]. In our study, we used closed gene pool populations with a small population size and identified isolated cases of inbreeding (see Section 3.2.1). However, due to paucity of the studied populations, assessment of the inbreeding level in them would be possible with full confidence in further detailed genome-wide studies.
Among the identified SNPs, a shift in genetic equilibrium was found in crossbred chickens Ts × SL and in purebred populations Ts, NH, Pu, F and PRB (χ² > 3.84), which may be indicative of strong selection pressure and a consequence of the selection of offspring from the best sire.
In the SNP-assisted analysis of genetic differentiation between chicken groups using TCM and paired FST, significant differences were detected for ETB chickens in comparison with MTBs, EMBs, GBs, and MEBs, as well as MTBs and FBs. With applying PCM (Table 2), greatest FST distances were shown for FBs relative to other clusters. These results of the FST-based analysis suggest a certain “predictive power” of the five SNPs for discriminating chickens of different other groups (clusters) when employing TCM and PCM.
The five significant SNPs identified in this study overlapped with the previously established QTLs for egg weight, egg production and growth traits at the NCAPG-LCORL locus (SI S4), confirming that these SNPs are relevant to and important for evaluating genomic variation among the studied local, commercial and fancy chicken breeds.
In the present study, we also investigated LD structure at the LCORL gene among various chicken breeds. Close LD was observed in the FS, CB, and BB breeds, suggesting their common origin as the Cochin, Brama, Dorking, and Houdan were FS ancestors. Chickens of the ZS breed were developed by crossing the RW, RIR, NH, and YC breeds. PC, such as NH, was created using the RIR breed [31]. The common origin of the listed breeds could explain their almost complete identity in LD. A similar conformation and diminutive sizes of the BMF and PS chicken breeds probably determined the same structure of their LD patterns. This may be due to the fact that polymorphism in the LCORL gene in animals can have a significant effect on the height, skeletal size, bone formation, and muscle development during embryogenesis [62].
When examining LD haploblocks between the SNPs in the studied chicken populations, important information was obtained regarding a population specificity of the haploblock structure at the NCAPG-LCORL locus for the 11 breeds/populations. These included two ETB populations (RWS and RWP), two EMB populations (FS and BB), three MEB populations (NH, PC and ZS), two FB populations (PS and PW), and two BTB populations (BMF and CB).
LD analysis revealed 36 haplotypes for these breeds. Common haplotypes are confirmed by the origin of breeds and similar phenotypes, suggesting a common mechanism for the formation of these LD patterns. Four similar haplotypes in the three MEB (NH, PC, and ZS) breeds, as well as one more common haplotype in NH and PC, can be associated with their common descent from the same ancestral breeds.
Due to the intensive selection in the breeding program and a significant reduction in the population size, changes in LD were observed in the chicken gene pool populations over several generations. Characterization of LD is of fundamental importance in carrying out genome-wide association analysis and genomic selection, as well as in identifying recent genomic rearrangements. LD can make a certain positive contribution when used in MAS in the future poultry farming [74]. At the same time, the costs of genotyping SNPs can be significantly reduced since markers are usually linked with each other in the area of influence on a trait [75]. Comparative assessment of populations with different demographic histories is an important source of information on changes in the genome when breeding small groups and assessing the results of crossing [64,76].

5. Conclusions

According to the FAO recommendations [52], to characterize the genetic resources of agricultural animals, it is necessary to rely on three types of information: phenotypic, genetic, and historical, which we attempted to do in the framework of this study. Herein, we proposed and studied four models of clustering (classification), i.e., TCM, PCM, GCM1, and GCM2, using a large spectrum of the global gene pool of chicken breeds that often have a synthetic genetic structure, significant admixture, and possible introgression. Based on these models, we expanded the earlier concept of four evolutionary lineages in domestic chicken breeding postulated by Moiseyeva et al. [3]. Our updated concept of evolutionary subdivision and breed formation includes six evolutionary branches of domestic chickens: ETBs, FBs, BTBs, DPBs, MTBs, and GBs as represented on the appropriate phylogenetic tree (Figure 3). We also found a complex and indistinct character of admixture models for many phenotypically and genotypically diverse breeds, many of which have a specific demographic history and a synthetic genetic blueprint.
Additionally, we discovered significant differences in allele frequencies for the analyzed SNPs at the NCAPG-LCORL locus in the small chicken populations of different phenotypes and purposes of use. This may point out that the importance of this locus in understanding the genetic basis for the formation of productive traits in poultry. Chickens of ETB and MTB are genetically far apart and formed two distinct clusters. Analysis of LD patterns revealed a close linkage between the SNPs in some DPB populations, which may prove a history of their origin from common ancestral breeds. Based on the data obtained, it can be assumed that the presence of LD can be an auxiliary tool in carrying out MAS for a small number of markers associated with each other in the area of influence on a trait, which can significantly reduce the costs of genotyping SNPs in general.
In addition, the current authentic allele composition in FB chickens at the NCAPG-LCORL locus was characterized, suggesting their gene pool as unique “inexhaustible” genetic resources. Since the NCAPG-LCORL locus is one of the key regulators of RNA polymerase II transcription and has a noticeable pleiotropic effect in relation to body weight and size, as well as egg size in chickens, we characterized genetic variants at this locus in various commercial, fancy, and local breeds and populations. Our research findings seem to be relevant for the purpose of identifying individuals that are carriers of SNP variants potentially associated with economically important QTLs. This information can also be in demand in MAS for meat and egg performance in chickens.
Genome-wide association studies can identify SNPs related to formation of phenotypic traits. This provides a unique opportunity to improve the methods for choosing markers of choice for MAS using information about many SNP markers across the entire genome, and thus increasing the selection accuracy. The data obtained can also be used in determining parental pairs and correcting selection targets in local chicken populations. The tested approaches in analyzing SNPs show their high efficiency and will be put into practical use in breeding and preservation programs for small chicken breeds and populations. Importantly, the current thorough phenotypic and genotypic survey involved several remarkable native breeds of Russia and the former USSR including OM [77], YC [78,79], RW [50,51,64], PC [80,81,82,83], PS/PW, RC, MG, UM, and UG. The obtained information will be helpful in their future conservation and commercial use.
Overall, our investigation has further contributed to solving the problem of evolutionary subdivision of domestic chickens including implications for synthetic breeds and admixture through a comprehensive assessment of phenotypic variation and genotypic structure at the NCAPG-LCORL locus, an important QTL for body meat and egg production traits.

Supplementary Materials

The following are available online at https://www.mdpi.com/article/10.3390/agriculture11100914/s1, Figure S1: Fuzzy Analysis Clustering-based plots showing the distribution of the 39 phenotyped breeds/populations and built using (a) morphometric traits and (b) egg production traits; Figure S2: PCA plots showing the distribution of the 39 phenotyped breeds/populations and built using (a) morphometric traits and (b) egg production traits; Figure S3: Plots of phylogenetic UPGMA-based trees constructed in comparison with PCM (shown via color coding) and using Euclidean distances for different sets of phenotypic traits; Figure S4: Clustering plots for the 49 chicken breeds/populations based on their genotypes in the five SNPs at the NCAPG-LCORL locus and produced using (a) Fuzzy Analysis Clustering, (b) PCA, and (c) an UPGMA-assisted tree using Euclidean metrics; Figure S5: Number of ancestral populations using genotypes in the five SNPs at the NCAPG-LCORL locus for the 49 genotyped chicken breeds/populations and applying different clustering models; Figure S6: Population structure based on the genetic variability in the 49 genotyped chicken breeds/populations for five SNP markers at the NCAPG-LCORL locus and produced by Bayesian clustering using the ADMIXTURE program (as visualized in color in R v.4.1.0); Figure S7: An UPGMA-based tree using Euclidean distances for six chicken breed clusters according to PCM and based on genotype frequencies in the five SNPs at the NCAPG-LCORL locus among the 49 genotyped chicken breeds/populations; Table S1: Forty-nine chicken breeds, strains and crosses used in the study and listed in accordance with TCM; Table S2: Phenotypic traits in females among the 39 studied chicken gene pool breeds/populations listed in accordance with PCM; Table S3: Phenotypic traits in males among the 39 studied chicken gene pool breeds/populations listed in accordance with PCM; Table S4: Frequency distribution of genotypes for five SNPs at the NCAPG-LCORL locus on GGA4 among the 49 studied chicken gene pool breeds/populations listed in accordance with PCM; Supporting Information (SI) S1: Allele frequencies in the five studied SNPs at the NCAPG-LCORL locus; SI S2: Significance levels of differences in allele frequencies for the five SNPs; SI S3: Boxplots and significance of differences in allele frequencies for the studied five SNPs at the locus NCAPG-LCORL as assessed for chicken breed groups; SI S4: Known QTLs at the NCAPG-LCORL locus and relevant SNPs in the Chicken QTLdb database.

Author Contributions

Conceptualization, T.A.L., M.N.R. and M.V.P.; methodology, M.N.R., M.V.P., Y.S.S. and E.A.B.; software, M.V.P., Y.S.S. and E.A.B.; validation, O.Y.B., T.A.L. and O.V.M.; formal analysis, M.V.P., N.V.D., A.B.V., O.V.M. and M.N.R.; investigation, G.K.P., A.V.M., A.B.V., T.A.L. and O.Y.B.; resources, O.I.S., A.B.V., A.V.M. and G.K.P.; data curation, O.I.S., A.B.V., N.V.D., M.V.P., O.V.M., G.K.P. and T.A.L.; writing—original draft preparation, T.A.L. and M.N.R.; writing—review and editing, T.A.L., M.N.R. and D.K.G.; visualization, M.V.P., Y.S.S., E.A.B.; supervision, T.A.L., M.V.P.; project administration, T.A.L.; funding acquisition, T.A.L. All authors have read and agreed to the published version of the manuscript.

Funding

This research was funded by the Ministry of Science and Higher Education of the Russian Federation (State Assignment Program 0445-2021-0010).

Institutional Review Board Statement

The study was conducted according to the guidelines of the Declaration of Helsinki and approved by the Institutional Review Board of the Russian Research Institute of Farm Animal Genetics and Breeding—Branch of the L. K. Ernst Federal Research Center for Animal Husbandry (Protocol No. 2020-4 dated 3 March 2020).

Informed Consent Statement

Not applicable.

Data Availability Statement

The data presented in this study are available in this article and Supplementary Material.

Conflicts of Interest

The authors declare no conflict of interest. The funders had no role in the design of the study; in the collection, analyses, or interpretation of data; in the writing of the manuscript, or in the decision to publish the results.

References

  1. Romanov, M.N. Genetics of Broodiness in Poultry—A Review. Asian-Australas. J. Anim. Sci. 2001, 14, 1647–1654. [Google Scholar] [CrossRef]
  2. Dodgson, J.B.; Romanov, M.N. Use of Chicken Models for the Analysis of Human Disease. Curr. Protoc. Hum. Genet. 2004, 40, 15.5.1–15.5.15. [Google Scholar] [CrossRef] [PubMed]
  3. Moiseyeva, I.G.; Romanov, M.N.; Nikiforov, A.A.; Sevastyanova, A.A.; Semyenova, S.K. Evolutionary Relationships of Red Jungle Fowl and Chicken Breeds. Genet. Sel. Evol. 2003, 35, 403–423. [Google Scholar] [CrossRef] [Green Version]
  4. Kholofelo Malomane, D.; Simianer, H.; Reimer, C.; Weigend, A.; Weigend, S. Different Evolutionary Dynamics Revealed by Functional SNP Classes in Global Chicken Groups. Worlds Poult. Sci. J. 2018. Suppl.: The XVth European Poultry Conference. Conference Information and Proceedings, Dubrovnik, Croatia, 17–21 September 2018, p. 87, Abstract ID 207. [Google Scholar]
  5. Makarova, A.V.; Mitrofanova, O.V.; Vakhrameev, A.B.; Dementeva, N.V. Molecular-Genetic Bases of Plumage Coloring in Chicken. Vavilovskii Zh. Genet. Sel. (Vavilov J. Genet. Breed.) 2019, 23, 343–354. [Google Scholar] [CrossRef] [Green Version]
  6. Wang, M.-S.; Thakur, M.; Peng, M.-S.; Jiang, Y.; Frantz, L.A.F.; Li, M.; Zhang, J.-J.; Wang, S.; Peters, J.; Otecko, N.O.; et al. 863 Genomes Reveal the Origin and Domestication of Chicken. Cell Res. 2020, 30, 693–701. [Google Scholar] [CrossRef]
  7. Bennett, C.E.; Thomas, R.; Williams, M.; Zalasiewicz, J.; Edgeworth, M.; Miller, H.; Coles, B.; Foster, A.; Burton, E.J.; Marume, U. The Broiler Chicken as a Signal of a Human Reconfigured Biosphere. R. Soc. Open Sci. 2018, 5, 180325. [Google Scholar] [CrossRef] [PubMed] [Green Version]
  8. Wang, M.-S.; Huo, Y.-X.; Li, Y.; Otecko, N.O.; Su, L.-Y.; Xu, H.-B.; Wu, S.-F.; Peng, M.-S.; Liu, H.-Q.; Zeng, L.; et al. Comparative Population Genomics Reveals Genetic Basis Underlying Body Size of Domestic Chickens. J. Mol. Cell Biol. 2016, 8, 542–552. [Google Scholar] [CrossRef] [PubMed] [Green Version]
  9. Li, J.-J.; Zhang, L.; Ren, P.; Wang, Y.; Yin, L.-Q.; Ran, J.-S.; Zhang, X.-X.; Liu, Y.-P. Genotype Frequency Distributions of 28 SNP Markers in Two Commercial Lines and Five Chinese Native Chicken Populations. BMC Genet. 2020, 21, 12. [Google Scholar] [CrossRef] [PubMed]
  10. Wężyk, S.; Cywa-Benko, K.; Romanov, M.N. Ochrona Przed Zagładą Rodzimych Ras Drobiu w Krajach Wschodniej Europy/Protection against the Extinction of the Native Breeds of Poultry in the Countries of Eastern Europe. In Proceedings of the International Symposium Conservation Measures for Rare Farm Animal Breeds, Balice, Poland, 17–19 May 1994; National Research Institute of Animal Production: Balice, Poland; Polish Society of Animal Production: Balice, Poland, 1994; pp. 25–26. [Google Scholar]
  11. Romanov, M.N.; Sakhatsky, N.I. Ochrona Zasobów Genetycznych Drobiu na Ukrainie/Conservation of Poultry Genetic Resources in Ukraine. In Summaries of the 9th International Symposium of Young Poultry Scientists, Siedlce, Poland, 8–10 June 1995; World’s Poultry Science Association, Polish Branch: Siedlce, Poland, 1995; pp. 87–88. [Google Scholar]
  12. Romanov, M.N.; Sakhatsky, N.I. Inventory of Poultry Genetic Resources in Ukraine. In Naučno-Tehničeskij Bûlleten-Institut Pticevodstva; Poultry Research Institute, Ukrainian Academy of Agrarian Sciences: Kharkiv, Ukraine, 1995; No. 34; pp. 3–14. [Google Scholar]
  13. Wezyk, S.; Cywa-Benko, K.; Romanov, M.N. Protection against the Extinction of the Native Breeds of Poultry in Eastern European Countries. In Proceedings of the International Symposium “Conservation Measures for Rare Farm Animal Breeds, Balice, Poland, 17–19 May 1994; pp. 89–101. [Google Scholar]
  14. Romanov, M.N.; Weigend, S.; Bondarenko, Y.V.; Podstreshny, A.P.; Kutnyuk, P.I.; Sakhatsky, N.I. Studies on poultry germplasm diversity and conservation in Ukraine. In Proceedings of the Poultry Genetics Symposium, Mariensee, Germany, 6–8 October 1999; Working Group 3 of WPSA: Mariensee, Germany, 1999; p. 140. [Google Scholar]
  15. Dementeva, N.V.; Vakhrameev, A.B.; Larkina, T.A.; Mitrofanova, O.V. Efficiency of Using SNP Markers in the MSTN Gene in the Selection of the Pushkin Breed Chickens. Vavilovskii Zh. Genet. Sel. (Vavilov J. Genet. Breed.) 2019, 23, 993–998. [Google Scholar] [CrossRef]
  16. Dou, T.; Shen, M.; Ma, M.; Qu, L.; Li, Y.; Hu, Y.; Lu, J.; Guo, J.; Wang, X.; Wang, K. Genetic Architecture and Candidate Genes Detected for Chicken Internal Organ Weight with a 600 K Single Nucleotide Polymorphism Array. Asian-Australas. J. Anim. Sci. 2019, 32, 341–349. [Google Scholar] [CrossRef] [PubMed] [Green Version]
  17. Yi, G.; Shen, M.; Yuan, J.; Sun, C.; Duan, Z.; Qu, L.; Dou, T.; Ma, M.; Lu, J.; Guo, J.; et al. Genome-Wide Association Study Dissects Genetic Architecture Underlying Longitudinal Egg Weights in Chickens. BMC Genom. 2015, 16, 746. [Google Scholar] [CrossRef] [PubMed] [Green Version]
  18. Shen, M.; Qu, L.; Ma, M.; Dou, T.; Lu, J.; Guo, J.; Hu, Y.; Wang, X.; Li, Y.; Wang, K.; et al. A Genome-Wide Study to Identify Genes Responsible for Oviduct Development in Chickens. PLoS ONE 2017, 12, e0189955. [Google Scholar] [CrossRef] [PubMed] [Green Version]
  19. Wood, A.R.; Esko, T.; Yang, J.; Vedantam, S.; Pers, T.H.; Gustafsson, S.; Chu, A.Y.; Estrada, K.; Luan, J.; Kutalik, Z.; et al. Defining the Role of Common Variation in the Genomic and Biological Architecture of Adult Human Height. Nat. Genet. 2014, 46, 1173–1186. [Google Scholar] [CrossRef] [Green Version]
  20. Okada, Y.; Kamatani, Y.; Takahashi, A.; Matsuda, K.; Hosono, N.; Ohmiya, H.; Daigo, Y.; Yamamoto, K.; Kubo, M.; Nakamura, Y.; et al. A Genome-Wide Association Study in 19 633 Japanese Subjects Identified LHX3-QSOX2 and IGF1 as Adult Height Loci. Hum. Mol. Genet. 2010, 19, 2303–2312. [Google Scholar] [CrossRef] [PubMed] [Green Version]
  21. Carty, C.L.; Johnson, N.A.; Hutter, C.M.; Reiner, A.P.; Peters, U.; Tang, H.; Kooperberg, C. Genome-Wide Association Study of Body Height in African Americans: The Women’s Health Initiative SNP Health Association Resource (SHARe). Hum. Mol. Genet. 2012, 21, 711–720. [Google Scholar] [CrossRef] [Green Version]
  22. Soranzo, N.; Rivadeneira, F.; Chinappen-Horsley, U.; Malkina, I.; Richards, J.B.; Hammond, N.; Stolk, L.; Nica, A.; Inouye, M.; Hofman, A.; et al. Meta-Analysis of Genome-Wide Scans for Human Adult Stature Identifies Novel Loci and Associations with Measures of Skeletal Frame Size. PLoS Genet. 2009, 5, e1000445. [Google Scholar] [CrossRef]
  23. Lindholm-Perry, A.K.; Sexten, A.K.; Kuehn, L.A.; Smith, T.P.; King, D.A.; Shackelford, S.D.; Wheeler, T.L.; Ferrell, C.L.; Jenkins, T.G.; Snelling, W.M.; et al. Association, Effects and Validation of Polymorphisms within the NCAPG-LCORL Locus Located on BTA6 with Feed Intake, Gain, Meat and Carcass Traits in Beef Cattle. BMC Genet. 2011, 12, 103. [Google Scholar] [CrossRef] [Green Version]
  24. Rubin, C.-J.; Megens, H.-J.; Barrio, A.M.; Maqbool, K.; Sayyab, S.; Schwochow, D.; Wang, C.; Carlborg, Ö.; Jern, P.; Jørgensen, C.; et al. Strong Signatures of Selection in the Domestic Pig Genome. Proc. Natl. Acad. Sci. USA 2012, 109, 19529–19536. [Google Scholar] [CrossRef] [Green Version]
  25. Metzger, J.; Schrimpf, R.; Philipp, U.; Distl, O. Expression Levels of LCORL are Associated with Body Size in Horses. PLoS ONE 2013, 8, e56497. [Google Scholar] [CrossRef] [Green Version]
  26. Al-Mamun, H.A.; Kwan, P.S.; Clark, A.; Ferdosi, M.H.; Tellam, R.; Gondro, C. Genome-Wide Association Study of Body Weight in Australian Merino Sheep Reveals an Orthologous Region on OAR6 to Human and Bovine Genomic Regions Affecting Height and Weight. Genet. Sel. Evol. 2015, 47, 66. [Google Scholar] [CrossRef] [Green Version]
  27. Takasuga, A. PLAG1 and NCAPG-LCORL in Livestock. Anim. Sci. J. 2016, 87, 159–167. [Google Scholar] [CrossRef] [PubMed] [Green Version]
  28. Lyu, S.; Arends, D.; Nassar, M.K.; Brockmann, G.A. Fine Mapping of a Distal Chromosome 4 QTL Affecting Growth and Muscle Mass in a Chicken Advanced Intercross Line. Anim. Genet. 2017, 48, 295–302. [Google Scholar] [CrossRef]
  29. Dementieva, N.V.; Kudinov, A.A.; Larkina, T.A.; Mitrofanova, O.V.; Dysin, A.P.; Terletsky, V.P.; Tyshchenko, V.I.; Griffin, D.K.; Romanov, M.N. Genetic Variability in Local and Imported Germplasm Chicken Populations as Revealed by Analyzing Runs of Homozygosity. Animals 2020, 10, 1887. [Google Scholar] [CrossRef] [PubMed]
  30. Dementieva, N.V.; Mitrofanova, O.V.; Dysin, A.P.; Kudinov, A.A.; Stanishevskaya, O.I.; Larkina, T.A.; Plemyashov, K.V.; Griffin, D.K.; Romanov, M.N.; Smaragdov, M.G. Assessing the Effects of Rare Alleles and Linkage Disequilibrium on Estimates of Genetic Diversity in the Chicken Populations. Animal 2021, 15, 100171. [Google Scholar] [CrossRef] [PubMed]
  31. Paronyan, I.A.; Plemyashov, K.V.; Segal, E.L.; Yurchenko, O.P.; Shabanova, S.A.; Vakhrameev, A.B.; Karpukhina, I.V.; Makarova, A.V.; Pervushina, A.T. Breeds and Populations of Chickens Bred at the Germplasm Farm of the State Scientific Institution VNIIGRZh of the Russian Agricultural Academy: Album; GNU VNIIGRZh: St. Petersburg, Russia, 2014; Available online: http://vniigen.ru/wp-content/uploads/2017/04/Katalog-Kur-1.pdf (accessed on 9 July 2021).
  32. Bogolyubsky, S.I. Poultry Breeding; Agropromizdat: Moscow, Russia, 1991. [Google Scholar]
  33. Chang, C.C.; Chow, C.C.; Tellier, L.C.; Vattikuti, S.; Purcell, S.M.; Lee, J.J. Second-Generation PLINK: Rising to the Challenge of Larger and Richer Datasets. Gigascience 2015, 4, 7. [Google Scholar] [CrossRef] [PubMed]
  34. RDocumentation. Heatmap: Draw a Heat Map. Available online: https://www.rdocumentation.org/packages/stats/versions/3.6.2/topics/heatmap (accessed on 9 July 2021).
  35. Shitikov, V.K.; Mastitsky, S.E. 10.4.2 Fuzzy k-Means Method (Fuzzy Analysis Clustering). In Classification, Regression, Data Mining Algorithms Using R. Electronic Book. 2017. Available online: https://ranalytics.github.io/data-mining/104-Other-Clustering-Methods.html#sec_10_4_2 (accessed on 9 July 2021).
  36. Fanny: Fuzzy Analysis Clustering. Documentation for Package ‘Cluster’ Version 2.1.0. “Finding Groups in Data”: Cluster Analysis Extended Rousseeuw et al. 2019. Available online: https://rdrr.io/cran/cluster/man/fanny.html (accessed on 9 July 2021).
  37. Suzuki, R.; Shimodaira, H. Pvclust: An R Package for Assessing the Uncertainty in Hierarchical Clustering. Bioinformatics 2006, 22, 1540–1542. [Google Scholar] [CrossRef]
  38. Zhao, Q.; Hautamaki, V.; Fränti, P. Knee Point Detection in BIC for Detecting the Number of Clusters. In Lecture Notes in Computer Science; Blanc-Talon, J., Bourennane, S., Philips, W., Popescu, D., Scheunders, P., Eds.; Springer: Berlin/Heidelberg, Germany, 2008; Volume 5259, pp. 664–673. [Google Scholar]
  39. Kassambara, A.; Mundt, F. Factoextra: Extract and Visualize the Results of Multivariate Data Analyses. Version 1.0.5; 22 August 2017. Available online: https://cran.r-project.org/web/packages/factoextra/index.html (accessed on 9 July 2021).
  40. Alexander, D.H.; Novembre, J.; Lange, K. Fast Model-Based Estimation of Ancestry in Unrelated Individuals. Genome Res. 2009, 19, 1655–1664. [Google Scholar] [CrossRef] [PubMed] [Green Version]
  41. Price, A.L.; Patterson, N.J.; Plenge, R.M.; Weinblatt, M.E.; Shadick, N.A.; Reich, D. Principal Components Analysis Corrects for Stratification in Genome-Wide Association Studies. Nat. Genet. 2006, 38, 904–909. [Google Scholar] [CrossRef]
  42. Ayala, F.J.; Kiger, J.A., Jr. Modern Genetics, 2nd ed.; Benjamin/Cummings: Menlo Park, CA, USA; London, UK, 1984. [Google Scholar]
  43. Wright, S. The Genetical Structure of Populations. Ann. Eugen. 1951, 15, 323–354. [Google Scholar] [CrossRef] [PubMed]
  44. Pilot, M.; Greco, C.; vonHoldt, B.M.; Jędrzejewska, B.; Randi, E.; Jędrzejewski, W.; Sidorovich, V.E.; Ostrander, E.A.; Wayne, R.K. Genome-Wide Signatures of Population Bottlenecks and Diversifying Selection in European Wolves. Heredity 2014, 112, 428–442. [Google Scholar] [CrossRef] [PubMed] [Green Version]
  45. Boc, A.; Diallo, A.B.; Makarenkov, V. T-REX: A Web Server for Inferring, Validating and Visualizing Phylogenetic Trees and Networks. Nucleic Acids Res. 2012, 40, 573–579. [Google Scholar] [CrossRef] [Green Version]
  46. The Chicken Quantitative Trait Locus (QTL) Database (Chicken QTLdb). Available online: https://www.animalgenome.org/cgi-bin/QTLdb/GG/index (accessed on 4 September 2021).
  47. Wellek, S.; Ziegler, A. A Genotype-Based Approach to Assessing the Association between Single Nucleotide Polymorphisms. Hum. Hered. 2009, 67, 128–139. [Google Scholar] [CrossRef] [PubMed]
  48. Barrett, J.C.; Fry, B.; Maller, J.; Daly, M.J. Haploview: Analysis and Visualization of LD and Haplotype Maps. Bioinformatics 2005, 21, 263–265. [Google Scholar] [CrossRef] [Green Version]
  49. Genome Reference Consortium Chicken Build 6a. Available online: https://www.ncbi.nlm.nih.gov/assembly/GCF_000002315.6 (accessed on 4 September 2021).
  50. Kudinov, A.A.; Dementieva, N.V.; Mitrofanova, O.V.; Stanishevskaya, O.I.; Fedorova, E.S.; Larkina, T.A.; Mishina, A.I.; Plemyashov, K.V.; Griffin, D.K.; Romanov, M.N. Genome-Wide Association Studies Targeting the Yield of Extraembryonic Fluid and Production Traits in Russian White Chickens. BMC Genom. 2019, 20, 270. [Google Scholar] [CrossRef] [PubMed]
  51. Dementeva, N.V.; Larkina, T.A.; Mitrofanova, O.V.; Fedorova, E.S.; Pozdnyakova, T.E. Association of Single Nucleotide Polymorphism in LCORL Gene with the Productive Traits in Russian White Chicken Breed. Ptitsevodstvo 2019, 5, 14–17. [Google Scholar] [CrossRef]
  52. FAO. Phenotypic Characterization of Animal Genetic Resources; FAO Animal Production and Health Guidelines No. 11; FAO: Rome, Italy, 2012. [Google Scholar]
  53. Dorji, N.; Sunar, S.K. Short Communication: Morphometric Variations among Five Bhutanese Indigenous Chickens (Gallus domesticus). J. Anim. Poult. Sci. 2014, 3, 76–85. [Google Scholar]
  54. Mel’nyk, Y.F.; Mykytyuk, D.M.; Bilous, O.V.; Kudryavs’ka, N.V.; Burkat, V.P.; Huzyev, I.V.; Podoba, B.Y.; Sharan, P.I.; Kovtun, S.I.; Platonova, N.P.; et al. Program of Preservation of the Gene Pool of Main Types of Farm Animals in Ukraine for the Period Till 2015; Aristey: Kyiv, Ukraine, 2009. [Google Scholar]
  55. Negassa, D.; Melesse, A.; Banerjee, S. Phenotypic Characterization of Indigenous Chicken Populations in Southeastern Oromia Regional State of Ethiopia. Anim. Genet. Resour. Inf. 2014, 55, 101–113. [Google Scholar] [CrossRef]
  56. Assefa, S.; Melesse, A.; Banerjee, S. Egg Production and Linear Body Measurement Traits of Local and Three Exotic Chicken Genotypes Reared under Two Agroecological Zones. Int. J. Ecol. Ecosolut. 2018, 5, 18–23. [Google Scholar]
  57. Romanov, M.N. Study of Feathering Phenotypes in Hisex Brown Parent Lines and Their Hybrids—A Population-Genetic Analysis. In Proceedings of the 9th European Poultry Conference, Glasgow, UK, 7–12 August 1994; World’s Poultry Science Association, UK Branch: Glasgow, UK; Volume 1, pp. 352–354. [Google Scholar]
  58. Weigend, S.; Romanov, M.N. Current Strategies for the Assessment and Evaluation of Genetic Diversity in Chicken Resources. In Abstracts and Proceedings of the XXI World’s Poultry Congress, Montreal, QC, Canada, 20–24 August 2000; CD-ROM; World’s Poultry Science Association: Montreal, QC, Canada, 2000. [Google Scholar]
  59. Otecko, N.O.; Ogali, I.; Ng’ang’a, S.I.; Mauki, D.H.; Ogada, S.; Moraa, G.K.; Lichoti, J.; Agwanda, B.; Peng, M.S.; Ommeh, S.C.; et al. Phenotypic and Morphometric Differentiation of Indigenous Chickens from Kenya and Other Tropical Countries Augments Perspectives for Genetic Resource Improvement and Conservation. Poult. Sci. 2019, 98, 2747–2755. [Google Scholar] [CrossRef]
  60. Tyasi, T.L.; Mashiloane, K.; Mokoena, K. Comparison of Some Linear Body Measurement Traits of Local and Commercial Chicken Breeds of South Africa. Sib. J. Life Sci. Agric. 2021, 13, 134–143. [Google Scholar] [CrossRef]
  61. Liu, R.; Sun, Y.; Zhao, G.; Wang, H.; Zheng, M.; Li, P.; Liu, L.; Wen, J. Identification of Loci and Genes for Growth Related Traits from a Genome-Wide Association Study in a Slow- × Fast-Growing Broiler Chicken Cross. Genes Genom. 2015, 37, 829–836. [Google Scholar] [CrossRef]
  62. Han, Y.J.; Chen, Y.; Liu, Y.; Liu, X.L. Sequence Variants of the LCORL Gene and Its Association with Growth and Carcass Traits in Qinchuan Cattle in China. J. Genet. 2017, 96, 9–17. [Google Scholar] [CrossRef] [PubMed]
  63. Tiley, G.P.; Pandey, A.; Kimball, R.T.; Braun, E.L.; Burleigh, J.G. Whole Genome Phylogeny of Gallus: Introgression and Data-Type Effects. Avian Res. 2020, 11, 1–15. [Google Scholar] [CrossRef] [Green Version]
  64. Dementeva, N.V.; Romanov, M.N.; Kudinov, A.A.; Mitrofanova, O.V.; Stanishevskaya, O.I.; Terletsky, V.P.; Fedorova, E.S.; Nikitkina, E.V.; Plemyashov, K.V. The Study of the Structure of the Gene Pool of the Russian White Breed of Chickens by the Method of Genomic SNP-Scanning. Selskokhoziaĭstvennaia Biol. (Agric. Biol.) 2017, 52, 1166–1174. [Google Scholar] [CrossRef] [Green Version]
  65. Sasaki, O.; Odawara, S.; Takahashi, H.; Nirasawa, K.; Oyamada, Y.; Yamamoto, R.; Ishii, K.; Nagamine, Y.; Takeda, H.; Kobayashi, E.; et al. Genetic Mapping of Quantitative Trait Loci Affecting Body Weight, Egg Character and Egg Production in F2 Intercross Chickens. Anim. Genet. 2004, 35, 188–194. [Google Scholar] [CrossRef]
  66. Schreiweis, M.A.; Hester, P.Y.; Settar, P.; Moody, D.E. Identification of Quantitative Trait Loci Associated with Egg Quality, Egg Production, and Body Weight in an F2 Resource Population of Chickens. Anim. Genet. 2006, 37, 106–112. [Google Scholar] [CrossRef]
  67. Guo, J.; Qu, L.; Dou, T.-C.; Shen, M.-M.; Hu, Y.-P.; Ma, M.; Wang, K.-H. Genome-Wide Association Study Provides Insights into the Genetic Architecture of Bone Size and Mass in Chickens. Genome 2020, 63, 133–143. [Google Scholar] [CrossRef]
  68. Wolc, A.; Arango, J.; Settar, P.; Fulton, J.E.; O’Sullivan, N.P.; Preisinger, R.; Habier, D.; Fernando, R.; Garrick, D.J.; Hill, W.G.; et al. Genome-Wide Association Analysis and Genetic Architecture of Egg Weight and Egg Uniformity in Layer Chickens. Anim. Genet. 2012, 43, 87–96. [Google Scholar] [CrossRef]
  69. Barkova, O.Y.; Smaragdov, M.G. Association of a Nonsynonymous Substitution in the Condensin NCAPG Gene with Traits of Eggs in Laying Hens. Russ. J. Genet. Appl. Res. 2016, 6, 804–808. [Google Scholar] [CrossRef]
  70. Sun, C.; Qu, L.; Yi, G.; Yuan, J.; Duan, Z.; Shen, M.; Qu, L.; Xu, G.; Wang, K.; Yang, N. Genome-Wide Association Study Revealed a Promising Region and Candidate Genes for Eggshell Quality in an F2 Resource Population. BMC Genom. 2015, 16, 565. [Google Scholar] [CrossRef] [Green Version]
  71. Nangsuay, A.; Ruangpanit, Y.; Meijerhof, R.; Attamangkune, S. Yolk Absorption and Embryo Development of Small and Large Eggs Originating from Young and Old Breeder Hens. Poult. Sci. 2011, 90, 2648–2655. [Google Scholar] [CrossRef]
  72. Lourens, A.; van den Brand, H.; Meijerhof, R.; Kemp, B. Effect of Eggshell Temperature during Incubation on Embryo Development, Hatchability, and Posthatch Development. Poult. Sci. 2005, 84, 914–920. [Google Scholar] [CrossRef]
  73. Gaevsky, N.A. Acquaintance with Evolutionary Genetics; Krasnoyarsk State University: Krasnoyarsk, Russia, 2002. [Google Scholar]
  74. Dekkers, J. Commercial Application of Marker- and Gene-Assisted Selection in Livestock: Strategies and Lessons. J. Anim. Sci. 2004, 82, 313–328. [Google Scholar] [CrossRef]
  75. Boichard, D.; Chung, H.; Dassonneville, R.; David, X.; Eggen, A.; Fritz, S.; Gietzen, K.; Hayes, B.; Lawley, C.; Sonstegard, T.; et al. Design of a Bovine Low-Density SNP Array Optimized for Imputation. PLoS ONE 2012, 7, e34130. [Google Scholar] [CrossRef] [PubMed] [Green Version]
  76. Dementiva, N.V.; Kudinov, A.A.; Mitrofanova, O.V.; Mishina, A.I.; Smaragdov, M.G.; Yakovlev, A.F. WPSI-6 Chicken Resource Population as the Source of Study Genetic Improvement of Indigenous Breeds. J. Anim. Sci. 2018, 96, 513. [Google Scholar] [CrossRef]
  77. Moiseyeva, I.G.; Sevastyanova, A.A.; Aleksandrov, A.V.; Vakhrameev, A.B.; Romanov, M.N.; Dmitriev, Y.I.; Semenova, S.K.; Sulimova, G.E. Orloff Chicken Breed: History, Current Status and Studies. Izv. Timiryazev. S-Kh. Akad. (Proc. Timiryazev Agric. Acad.) 2016, (Issue 1), 78–96. [Google Scholar]
  78. Moiseyeva, I.G.; Nikiforov, A.A.; Romanov, M.N.; Aleksandrov, A.V.; Moysyak, Y.V.; Semyenova, S.K. Origin, History, Genetics and Economic Traits of the Yurlov Crower Chicken Breed. In Elektronnyi zhurnal (Electronic Journal); Laboratory of Animal Comparative Genetics, N.I. Vavilov Institute of General Genetics: Moscow, Russia, 2007; Available online: https://web.archive.org/web/20120210170800/http://www.lab-cga.ru/articles/Yurlovskaya/Yurlovskaya.htm (accessed on 9 July 2021).
  79. Moiseyeva, I.G.; Romanov, M.N.; Aleksandrov, A.V.; Nikiforov, A.A.; Sevastyanova, A.A. Evolution and Genetic Diversity of Old Domestic Hen’s Breed—Yurlovskaya Golosistaya: System Analysis of Variability Forms. Izv. Timiryazev. S-Kh. Akad. (Proc. Timiryazev Agric. Acad.) 2009, (Issue 3), 132–147. [Google Scholar]
  80. Romanov, M.N.; Bondarenko, Y.V. Introducing the Ukrainian Indigenous Poultry—The Poltava Chickens. Fancy Fowl 1994, 14(2), 8–9. [Google Scholar]
  81. Moiseyeva, I.G.; Kovalenko, A.T.; Mosyakina, T.V.; Romanov, M.N.; Bondarenko, Y.V.; Kutnyuk, P.I.; Podstreshny, A.P.; Nikiforov, A.A.; Tkachik, T.E. Origin, History, Genetics and Economic Traits of the Poltava Chicken Breed. In Elektronnyi zhurnal (Electronic Journal); Laboratory of Animal Comparative Genetics, N.I. Vavilov Institute of General Genetics: Moscow, Russia, 2006; Issue 4, Available online: https://web.archive.org/web/20120205195904/http://www.lab-cga.ru/articles/Jornal04/Statia2.htm (accessed on 9 July 2021).
  82. Moiseyeva, I.G.; Romanov, M.N.; Kovalenko, A.T.; Mosyakina, T.V.; Bondarenko, Y.V.; Kutnyuk, P.I.; Podstreshny, A.P.; Nikiforov, A.A. The Poltava Chicken Breed of Ukraine: Its History, Characterization and Conservation. Anim. Genet. Resour. Inf. 2007, 40, 71–78. [Google Scholar] [CrossRef] [Green Version]
  83. Kulibaba, R.; Tereshchenko, A. Transforming Growth Factor β1, Pituitary-Specific Transcriptional Factor 1 and Insulin-Like Growth Factor I Gene Polymorphisms in the Population of the Poltava Clay Chicken Breed: Association with Productive Traits. Agric. Sci. Pract. 2015, 2, 67–72. [Google Scholar] [CrossRef]
Figure 1. Clustering patterns for the 39 chicken breeds/populations based on their phenotypic traits and using fuzzy analysis clustering (a) and PCA (b). The observed clustering pattern of six clusters formed the basis of PCM. Population codes are given according to Supplementary Table S1.
Agriculture 11 00914 g001
Figure 2. A heatmap showing distribution of the 39 phenotyped chicken breeds/populations and built using the heatmap function in stats package (R v. 4.2) on the base of the following phenotypic traits: female body weight (F_b_w), a sum of male and female body weights (M_F), egg weight (Egg_w), and 52-week egg number (Egg_N). The rows (populations) and columns (traits) are ordered in accordance with hierarchical clustering as displayed through the respective dendrograms. Lighter colors correspond to lower correlation, and darker ones to higher correlation. Population codes are given according to Supplementary Table S1.
Agriculture 11 00914 g002
Figure 3. An unrooted phylogenetic tree constructed using the neighbor-joining method and based on the FST values (Table 2) inferred from allele frequencies in the five SNPs for six chicken breed/population groups as clustered according to PCM (Figure 1a,b).
Agriculture 11 00914 g003
Figure 4. Structure of linkage disequilibrium at the LCORL gene in the 11 studied chicken populations using Haploview 4.2. The color scheme represents a linkage rate between the SNPs: white, no linkage (r2 = 0); light gray, slight linkage (0 < r2 ≤ 0.5); dark gray, strong linkage (0.5 < r2 <1); black, full linkage (r2 = 1).
Agriculture 11 00914 g004aAgriculture 11 00914 g004b
Figure 5. Distribution of haplotype frequencies in the 11 gene pool chicken populations.
Agriculture 11 00914 g005
Table 1. Summary for the five SNPs at the NCAPG-LCORL locus on GGA4.
SNPPosition in GRCg6a Build [49]Nearest GeneNucleotide ChangeLocation
GGaluGA26596675,796,627NCAPGA/GIntergenic region
GGaluGA26596975,827,200NCAPG
LCORL
T/CIntron
rs1561922375,850,294NCAPG
LCORL
A/CIntron
rs1449101775,885,777NCAPGC/TIntron
rs1449102875,903,919NCAPGC/TIntron
Table 2. Pairwise D and FST values 1 based on allele frequencies in the five SNPs at the NCAPG-LCORL locus among the studied chicken breeds/populations grouped by differences in phenotypic traits (according to PCM that involves six clusters as in Figure 1a,b).
No. of
Animals
Chicken GroupsEgg-Type and RelatedDual Purpose and RelatedMeat-Type and RelatedGameFancyBantam and Related
132Egg-type and related(1.20)1.221.301.211.211.27
470Dual purpose and related0.0290 ± 0040(1.11)1.081.011.461.27
65Meat-type and related0.1490 ± 0.05220.0690 ± 0.0322(0.79)0.861.681.26
48Game0.0970 ± 0.03280.0290 ± 0.01300.0420 ± 0.0242(0.79)1.561.27
53Fancy0.1000 ± 0.01250.2190 ± 0.02580.3930 ± 0.05480.3210 ± 0.0325(0.84)1.30
92Bantam and related0.0160 ± 0.01240.0310 ± 0.02790.1200 ± 0.05260.1020 ± 0.04570.1420 ± 0.0493(1.27)
1 Genetic differentiation values as calculated in EIGENSOFT. Above the diagonal: D (average divergence) values between population groups; on the diagonal: D (average divergence) values within population groups (in parentheses); below the diagonal: pairwise FST values between population groups ± standard deviations (in italics). All the pair-wise differences as assessed by FST were significant (shown by analysis of variance, p < 0.05).
Publisher’s Note: MDPI stays neutral with regard to jurisdictional claims in published maps and institutional affiliations.

