Assessing the Value of Agroecosystem Services in Warmia and Mazury Province Using Choice Experiments


Abstract
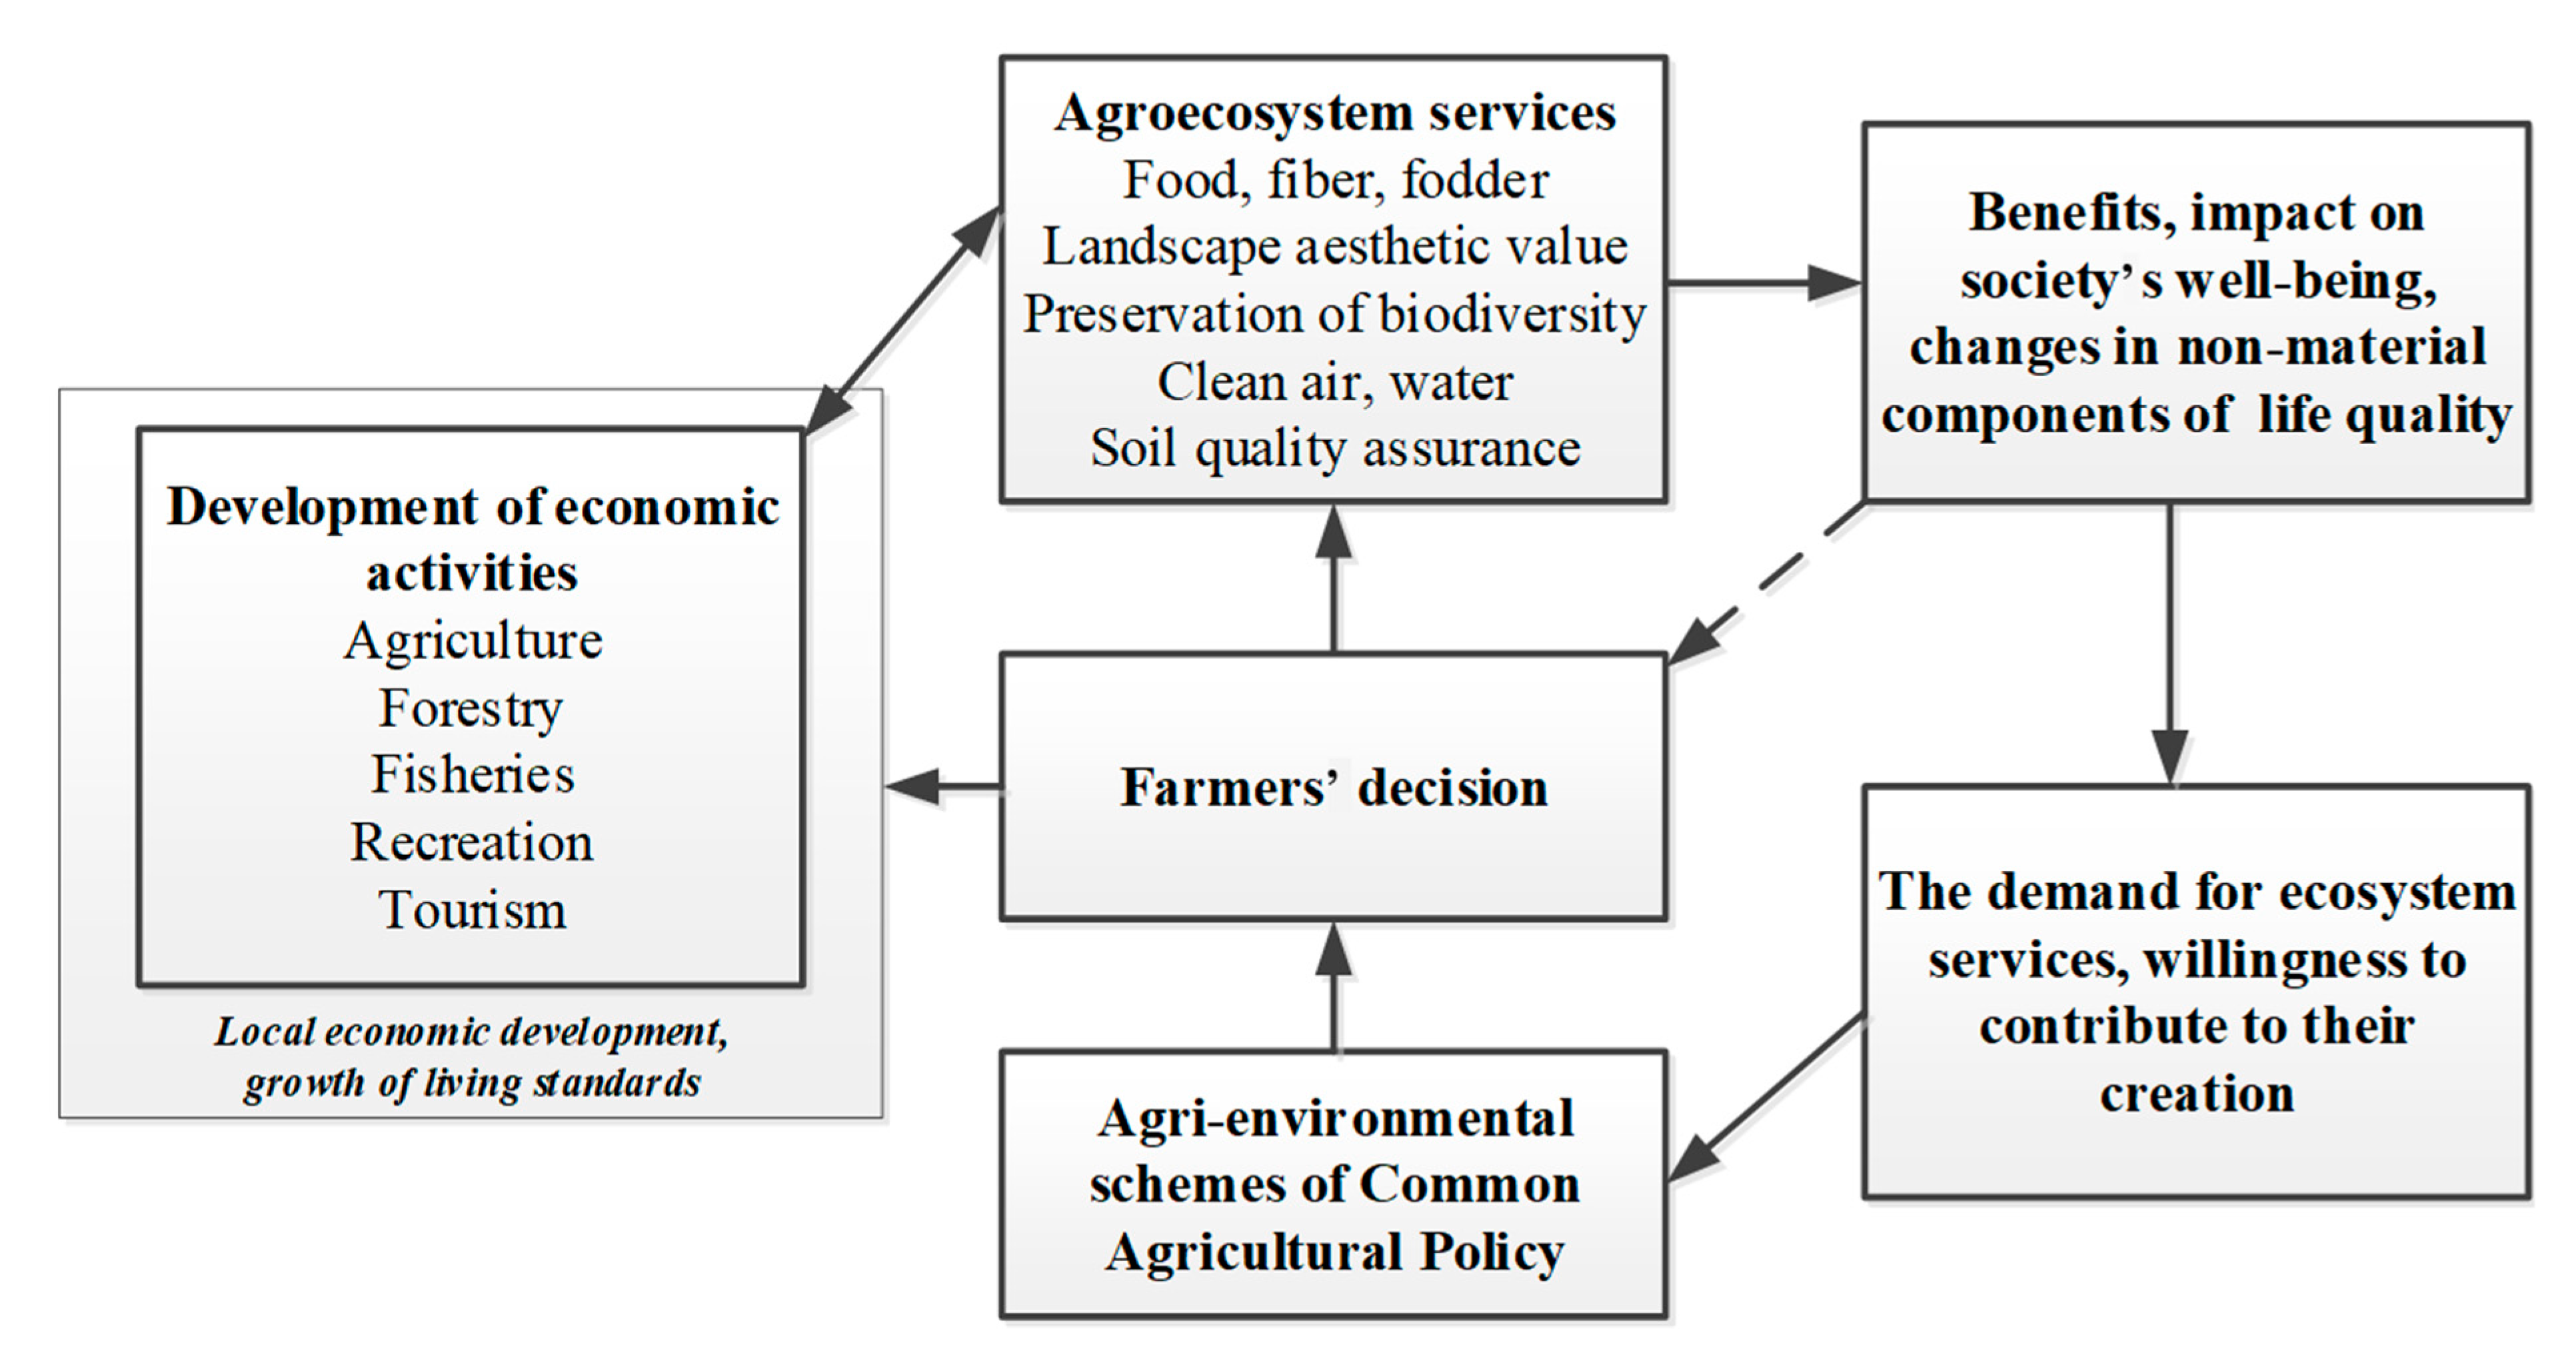
:1. Introduction
2. Materials and Methods
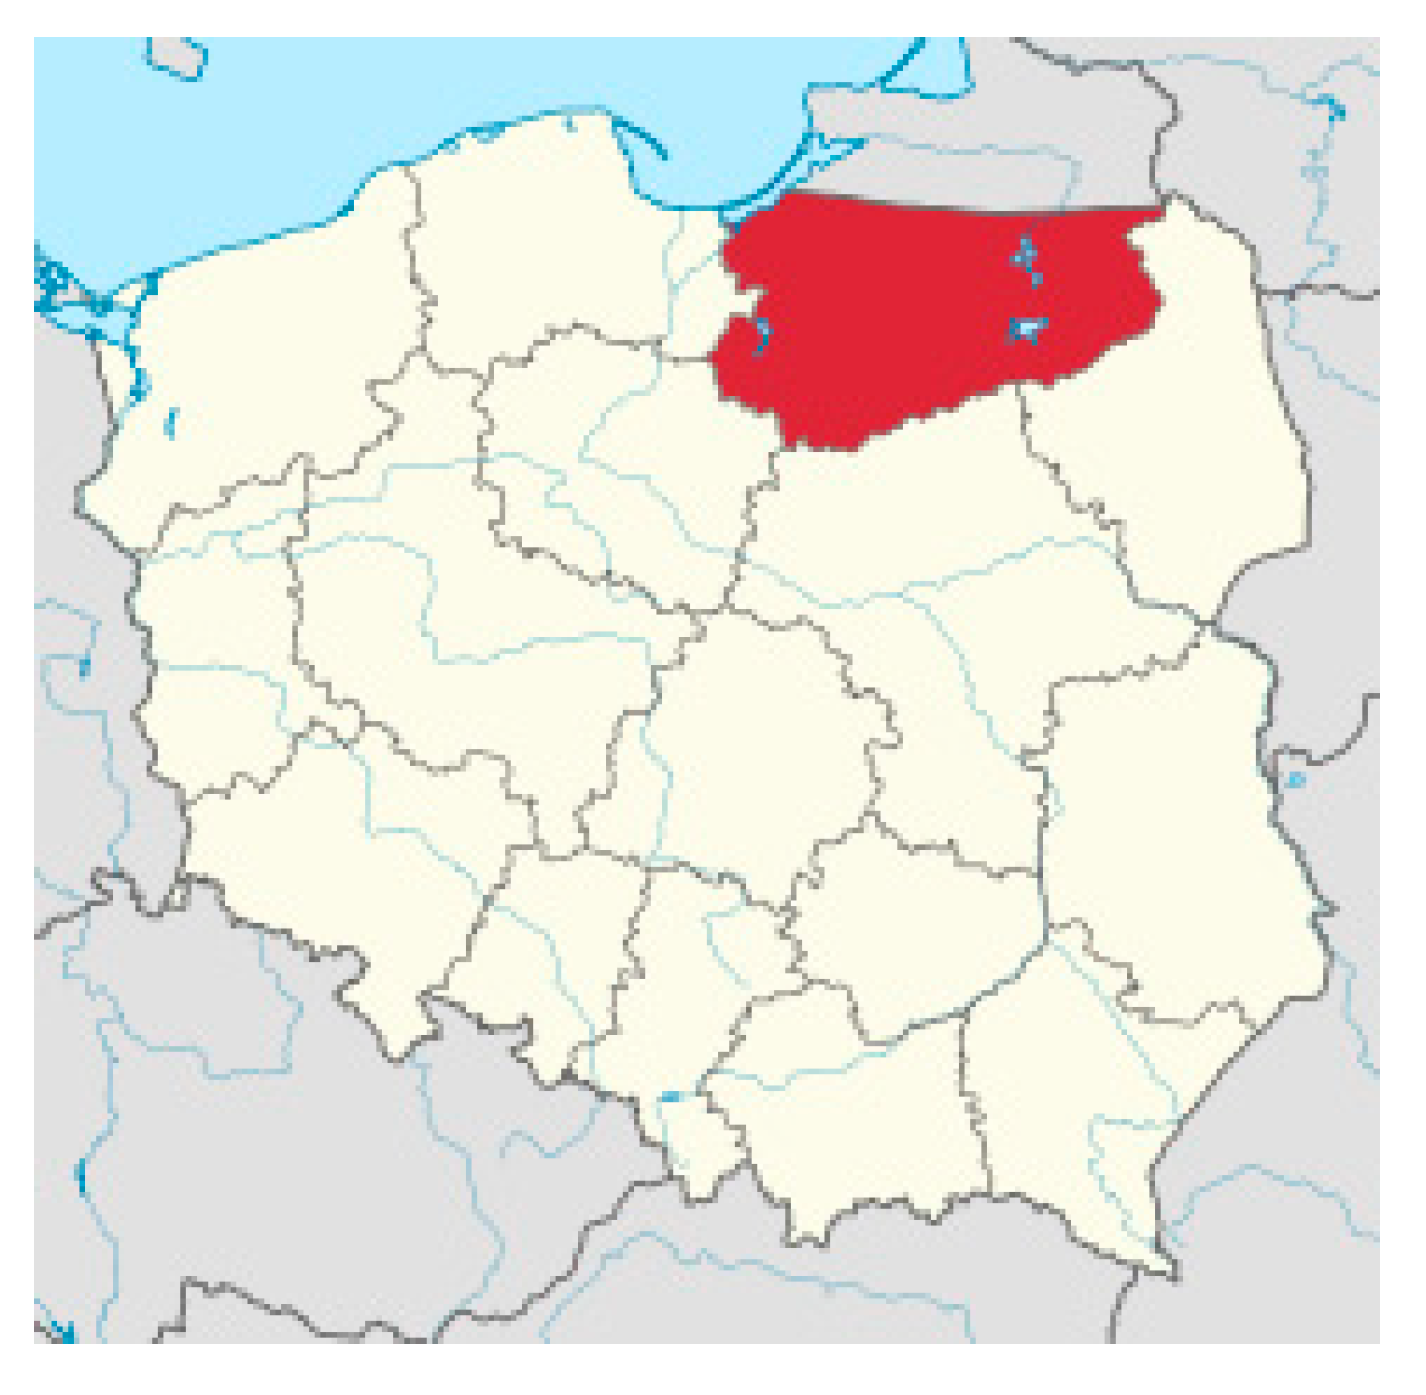
2.1. Case Study: Warmia and Mazury
- -
- A relatively low population density per unit area (more than twice lower than the average in Poland);
- -
- Low pollution of the atmosphere of harmful emissions of gases and dust;
- -
- Lack of soil contamination with heavy metals and lack of potential premises for the occurrence of such threats on a larger scale;
- -
- Branched network of rivers and lakes, which causes a system of circulation of surface and deep ground water, requiring special protection, as opposed to elsewhere than in the country;
- -
- Unique and extremely beautiful landscape diversity, enabling the development of numerous forms of tourism, recreation, and treatment;
- -
- Diversified terrain configuration and soil mosaicism, justifying the use of appropriate directions of land use and maintaining the appropriate level of intensification of agricultural production, which results from the need to prevent erosion processes and leaching nutrients from the soil;
- -
- Low level of industrialization of the area, including lack of environmentally troublesome industry;
- -
- Relatively low share of people living from non-agricultural sources;
- -
- Favorable area structure of farms;
- -
- Significant area of forests [17].
2.2. Experimental Design
- −
- −
- −
2.3. Modeling Framework
3. Results
3.1. Sampling Characteristics
3.2. Modeling Results
- −
- through the interaction with water quality: respondents’ awareness about the environmental issues from agriculture and area of residence;
- −
- through the interaction with wildlife populations and income;
- −
- through the interaction with agricultural landscape: area of residence and gender (Table 5).
4. Discussion
5. Conclusions
Author Contributions
Funding
Informed Consent Statement
Conflicts of Interest
References
- Choruma, D.J.; Odume, O.N. Exploring Farmers’ Management Practices and Values of Ecosystem Services in an Agroecosystem Context—A Case Study from the Eastern Cape, South Africa. Sustainability 2019, 11, 6567. [Google Scholar] [CrossRef] [Green Version]
- Petway, J.R.; Lin, Y.P.; Wunderlich, R.F. A Place-Based Approach to Agricultural Nonmaterial Intangible Cultural Ecosystem Service Values. Sustainability 2020, 12, 699. [Google Scholar] [CrossRef] [Green Version]
- Christiansen, S. On classification of agricultural systems—An ecological approach. Geogr. Tidsskr. 1979, 79, 1–4. [Google Scholar] [CrossRef]
- Swinton, S.M.; Lupi, F.; Robertson, G.P.; Hamilton, S.K. Ecosystem services and agriculture: Cultivating agricultural ecosystems for diverse benefits. Ecol. Econ. 2007, 64, 245–252. [Google Scholar] [CrossRef]
- Garbach, K.; Milder, J.C.; Montenegro, M.; Karp, D.S.; De Clerck, F.A.J. Biodiversity and Ecosystem Services in Agroecosystems. Encycl. Agric. Food Syst. 2014, 2, 21–40. [Google Scholar] [CrossRef]
- Bernués, A.; Alfnes, F.; Clemetsen, M.; Eik, L.O.; Faccioni, G.; Ramanzin, M.; Ripoll-Bosch, R.; Rodríguez-Ortega, T.; Sturaro, E. Exploring social preferences for ecosystem services of multifunctional agriculture across policy scenarios. Ecosyst. Serv. 2019, 39. [Google Scholar] [CrossRef]
- Bennett, J.; Blamey, R. The Choice Modelling Approach to Environmental Valuation, New Horizons in Environmental Economics; Edward Elgar: Cheltenham, UK; Northampton, MA, USA, 2001. [Google Scholar]
- Hanley, N.; Mourato, S.; Wright, R.E. Choice modelling approaches: A superior alternative for environmental valuation? J. Econ. Surv. 2001, 15, 435–462. [Google Scholar] [CrossRef]
- Arriaza, M.; Gomez-Limon, J.A.; Kallas, Z.; Nekhay, O. Demand for non-commodity outputs from mountain olive groves? Agric. Econ. Rev. 2008, 9, 5–23. [Google Scholar]
- Domínguez-Torreiro, M.; Soliño, M. Provided and perceived status quo in choice experiments: Implications for valuing the outputs of multifunctional rural areas. Ecol. Econ. 2011, 7, 2523–2531. [Google Scholar] [CrossRef]
- Faccioni, G.; Sturaro, E.; Ramanzin, M.; Bernués, A. Socio-economic valuation of abandonment and intensification of Alpine agroecosystems and associated ecosystem services. Land Use Policy 2019, 81, 453–462. [Google Scholar] [CrossRef]
- Lankia, T. The Economic Value of the Priceless: Revealing the Benefits of Outdoor Recreation in Finland. Ph.D. Thesis, Natural Resources Institute Finland, Helsinki, Finland, 13 March 2020. [Google Scholar]
- Grammatikopoulou, I.; Pouta, E.; Salmiovirta, M.; Soini, K. Heterogeneous preferences for agricultural landscape improvements in Southern Finland. Landsc. Urban Plann. 2012, 107, 181–191. [Google Scholar] [CrossRef]
- Włodarczyk-Marciniak, R.; Piotr Frankiewicz, P.; Krauze, K. Socio-cultural valuation of Polish agricultural landscape components by farmers and its consequences. J. Rural Stud. 2020, 74, 190–200. [Google Scholar] [CrossRef]
- Czyżewski, B.; Matuszczak, A.; Czyżewski, A.; Brelik, A. Public goods in rural areas as endogenous drivers of income: Developing a framework for country landscape valuation. Land Use Policy. in press.
- Characteristics of Warmia and Mazury Province. Available online: https://bip.warmia.mazury.pl/informacja/1/ogolna-charakterystyka-wojewodztwa-warminsko-mazurskiego.html (accessed on 5 July 2019). (In Polish).
- Jasiński, J.; Kostyk-Wodzińska, E.; Suchta, J. Środowisko przyrodnicze filarem województwa warmińsko-mazurskiego w warunkach integracji z Unią Europejską.(The natural environment is a pillar of the Warmia and Masuria Province in the conditions of integration with the European Union. Acta Sci. Pol. Adm. Locorum 2004, 3, 5–16. (In Polish) [Google Scholar]
- Encyclopedia. Available online: http://encyklopedia.warmia.mazury.pl/index.php/Wojew%C3%B3dztwo_warmi%C5%84sko-mazurskie (accessed on 5 July 2019). (In Polish).
- Lancaster, K.J. A new approach to consumer theory. J. Polit. Econ. 1966, 74, 132–157. [Google Scholar] [CrossRef]
- Thurstone, l. A law of comparative judgement. Psychol. Rev. 1927, 34, 273–286. [Google Scholar] [CrossRef]
- Jianjun, J.; Chong, J.; Thuy, T.D.; Lun, L. Public preferences for cultivated land protection in Wenling city, China: A choice experiment study. Land Use Policy 2013, 30, 337–343. [Google Scholar] [CrossRef]
- Bateman, I.J.; Carson, R.T.; Day, B.; Hanemann, M.; Hanley, N.; Hett, T.; Jones-Lee, M.; Loomes, G.; Mourato, S.; Özdemiroglu, E.; et al. Economic Valuation with Stated Preference Techniques: A Manual; Edward Elgar: Cheltenham, UK, 2002. [Google Scholar]
- Mazzanti, M.; Montini, A. “Valutazione Economica Multi-AttributoMediante Esperimenti di Scelta Aspetti Metodologici e Strumenti di Analisi Econometrica.” (Multiattribute Economic Evaluation by Means of Choice Experiments. Methodological Aspects and Econometrics Analysis Tools). In Proceedings of the XIII conference SIEP: “Stato o mercato? Intervento pubblico e architettura dei mercati” (State or Market? Public Interventions and Markets Structure), University of Pavia, Pavia, Italy, 5–6 October 2001. [Google Scholar]
- Novikova, A. Agroaplinkos Išorinių Padarinių Vertės Integravimas į Žemės Ūkio Produktyvumo Vertinimą (Integration of Value of Agri-environmental Externalities into Measurement of Agricultural Productivity). Ph.D. Thesis, Aleksandras Stulginskis University, Akademija, Lithuania, 16 December 2016. (In Lithuanian). [Google Scholar]
- Gwiaździńska-Goraj, M.; Goraj, S. The Contribution of the Natural Environment to Sustainable Development on the Example of Rural Areas in the Region of Warmia and Mazury. J. Rural Dev. 2013, 6, 266–271. [Google Scholar]
- Baskaran, R.; Cullen, R.; Colombo, S. Estimating values of environmental impacts of dairy farming in New Zealand. N. Z. J. Agric. Res. 2009, 52, 377–389. [Google Scholar] [CrossRef] [Green Version]
- Goibov, M.; Schmitz, P.M.; Bauer, S.; Ahmed, M.N. Application of a choice experiment to estimate farmers preferences for different land use options in Northern Tajikistan. J. Sustain. Dev. 2012, 5, 2–16. [Google Scholar] [CrossRef]
- Takatsuka, Y.; Cullen, R.; Wilson, M.; Wratten, S. Values of Ecosystem Services on Arable Land and the Role of Organic Farming. In Proceedings of the 2005 NZARES Conference Tahuna Conference Centre, Nelson, New Zealand, 26–27 August 2005. [Google Scholar]
- Hasund, K.P.; Kataria, M.; Lagerkvist, C.J. Valuing public goods of the agricultural landscape: A choice experiment using reference points to capture observable heterogeneity. J. Environ. Plan. Manag. 2011, 54, 31–53. [Google Scholar] [CrossRef]
- Colombo, S.; Hanley, N.; Calatrava-Requena, J. Designing policy for reducing the off-farm effects of soil erosion using choice experiments. J. Agric. Econ. 2005, 56, 81–95. [Google Scholar] [CrossRef]
- McFadden, D. Conditional logit analysis of qualitative choice behaviour. In Frontiers in Econometrics; Zarembka, P., Ed.; Academic Press: New York, NY, USA, 1974. [Google Scholar]
- Ben-Akiva, M.; Lerman, S. Discrete Choice Analysis. Theory and Application to Travel Demand; MIT Press: Cambridge, MA, USA, 1985. [Google Scholar]
- Mazzocchi, C.; Sali, G. Assessing the value of pastoral farming in the Alps using choice experiments: Evidence for public policies and management. J. Environ. Plan. Manag. 2019, 62, 552–567. [Google Scholar] [CrossRef]
- Baskaran, R.; Cullen, R.; Takatsuka, Y. Estimating the value of agricultural eco-system services: A case study of New Zealand pastoral farming. Australas. J. Environ. Manag. 2009, 16, 103–112. [Google Scholar] [CrossRef]
- Borresch, R.; Maas, S.; Schmitz, K.P.; Schmitz, M. Modelling the value of a multifunctional landscape—A discrete choice experiment. In Proceedings of the International Association of Agricultural Economists Conference, Beijing, China, 16–22 August 2009. [Google Scholar]
- Soini, K.; Aakkula, J. Framing the biodiversity of agricultural landscape: The essence of local conceptions and constructions. Land Use Policy 2007, 24, 311–321. [Google Scholar] [CrossRef]
- Alcon, F.; Marín-Miñano, C.; Zabala, J.A.; De-Miguela, M.D.; Martínez-Paz, J.M. Valuing diversification benefits through intercropping in Mediterranean agroecosystems: A choice experiment approach. Ecol. Econ. 2020, 171, 106593. [Google Scholar] [CrossRef]
- Rodríguez-Ortega, T.; Bernués, A.; Alfnes, F. Psychographic profile affects willing-ness to pay for ecosystem services provided by Mediterranean high nature value farmland. Ecol. Econ. 2016, 128, 232–245. [Google Scholar]
- Niedermayr, A.; Schaller, L.; Mariel, P.; Kieninger, P.; Kantelhardt, J. Heterogeneous Preferences for Public Goods Provided by Agriculture in a Region of Intensive Agricultural Production: The Case of the Marchfeld. Sustainability 2018, 10, 2061. [Google Scholar] [CrossRef] [Green Version]


| Attribute | Description | Levels |
|---|---|---|
| Water quality (WATER) | Expected % of reduction in underground water pollution due to agricultural activity | 0 10 20 |
| Wildlife populations (WILD_L) | Expected % of improvement by protecting the diversity of wildlife | 0 10 20 |
| Agricultural landscape (LANDSC) | Expected % of improved agricultural landscape | 0 10 20 |
| Cost (PRICE) | Personal contribution (EUR per year for the next 5 years) | 0 12 23 35 46 |
| Attributes | Status Quo (No Application) | Alternative A | Alternative B |
|---|---|---|---|
| Water quality | No change—0 | No change—0 | 10% reduction |
| Wildlife populations | No change—0 | 10% improvement | 10% improvement |
| Agricultural landscape | No change—0 | 20% improvement | No change—0 |
| Personal contribution (EUR per year for the next 5 years) | EUR 0 | EUR 35 | EUR 12 |
| Your choice (select only one) |  | | |
| Variables | Study Sample | General Population |
|---|---|---|
| % | % | |
| Gender | ||
| Male | 36.5 | 51.1 |
| Female | 63.5 | 48.9 |
| Age 18–39 40–65 over 65 | 86.4 9.1 4.5 | 26.7 34.4 15.3 |
| Area of residence | ||
| City Village | 53.5 46.5 | 60.0 40.0 |
| Education | ||
| High school | 22.4 | 18.2 |
| Comparative, special secondary | 13.9 | 22.6 |
| Secondary and elementary | 63.7 | 58.0 |
| Monthly Income <EUR 460 EUR 460–745 EUR 745–1000 >EUR 1000 | 45.6 36.3 6.5 11.6 | 9.9 29.0 36.0 25.1 |
| How do you rate the impacts of farming on the natural environment? (%) | ||||||
| Very bad 0.3 | Bad 30.9 | No impact 4.2 | Good 57.8 | Very good 6.8 | ||
| How often are you concerned about the following environmental aspects in Warmia and Mazury? (%) | ||||||
| Attributes | Always | Very often | Sometimes | Rarely | Never | |
| Water quality in rivers and lakes | 12.2 | 37.7 | 35.1 | 13.3 | 1.7 | |
| Drinking water quality | 30.3 | 47.3 | 15.3 | 6.5 | 0.6 | |
| Decline in flora populations | 5.1 | 20.4 | 35.7 | 32.3 | 6.5 | |
| Decline in fauna populations | 9.6 | 31.7 | 33.7 | 22.1 | 2.8 | |
| Formation and maintenance of landscape | 11.0 | 32.3 | 32.9 | 19.8 | 4.0 | |
| Are you aware of the following environmental issues from agriculture? (%) | ||||||
| Elements | Yes | No | ||||
| Use of mineral fertilizers | 79.6 | 20.4 | ||||
| Use of organic fertilizers | 68.6 | 31.4 | ||||
| Use of pesticides | 90.9 | 9.1 | ||||
| Animal urine and faeces leaching into streams and lakes | 78.2 | 21.8 | ||||
| Coastwise buffer strips | 47.3 | 52.7 | ||||
| Management of meadows and wetlands | 75.4 | 24.6 | ||||
| Leaving stubble for the winter | 60.6 | 39.4 | ||||
| Tree buffer strips in the arable land | 47.6 | 52.4 | ||||
| Variable | Description |
|---|---|
| CWAR (water_res) | Interaction of water quality and residence |
| CLR (landsc_res) | Interaction of agricultural landscape and residence |
| CLG (landsc_gen) | Interaction of agricultural landscape and gender |
| CWII (wild_inc) | Interaction of wildlife populations and income |
| CWAB (wat_env) | Interaction of water quality: respondents’ awareness of the environmental issues from agriculture |
| Variables | Model I without Additional Variables | Model II with Additional Variables | ||||
|---|---|---|---|---|---|---|
| Coefficients | Standard Error | p-Value | Coefficients | Standard Error | p-Value | |
| CW (water) | 0.05141 *** | 0.00470 | 0.000 | 0.07270 *** | 0.00703 | 0.0000 |
| CWI (wildlife) | 0.05135 *** | 0.00437 | 0.000 | 0.03813 *** | 0.00815 | 0.0000 |
| CL (landscape) | 0.03349 *** | 0.00432 | 0.000 | 0.03180 *** | 0.00630 | 0.0000 |
| CP (price) | −0.03709 *** | 0.00296 | 0.000 | −0.03739 *** | 0.00298 | 0.0000 |
| CWAR (water_res-) | −0.02464 *** | 0.00804 | 0.0022 | |||
| CLR (landsc_res) | 0.01833 ** | 0.00777 | 0.0183 | |||
| CLG (landsc_gen) | −0.01754 ** | 0.00769 | 0.0224 | |||
| CWII (wild_inc) | 0.00439 * | 0.00228 | 0.0544 | |||
| CWAB (wat_env) | −0.01963 ** | 0.00766 | 0.0103 | |||
| Summary statistics | ||||||
| Log-likelihood | −1510.27924 | −1496.00282 | ||||
| AIC/N | 2.012 | 2.000 | ||||
| Pseudo-R2 | 0.0641 | 0.0729 | ||||
| Observations | 1505 | 1505 | ||||
| Attributes | MWTP 10% | MWTP 20% |
|---|---|---|
| Water quality | 19.4 | 38.8 |
| Wildlife populations | 10.2 | 20.4 |
| Agricultural landscape | 8.5 | 17.0 |
Publisher’s Note: MDPI stays neutral with regard to jurisdictional claims in published maps and institutional affiliations. |
© 2020 by the authors. Licensee MDPI, Basel, Switzerland. This article is an open access article distributed under the terms and conditions of the Creative Commons Attribution (CC BY) license (http://creativecommons.org/licenses/by/4.0/).
Share and Cite
Bielski, S.; Marks-Bielska, R.; Novikova, A.; Vaznonis, B. Assessing the Value of Agroecosystem Services in Warmia and Mazury Province Using Choice Experiments. Agriculture 2021, 11, 4. https://doi.org/10.3390/agriculture11010004
Bielski S, Marks-Bielska R, Novikova A, Vaznonis B. Assessing the Value of Agroecosystem Services in Warmia and Mazury Province Using Choice Experiments. Agriculture. 2021; 11(1):4. https://doi.org/10.3390/agriculture11010004
Chicago/Turabian StyleBielski, Stanisław, Renata Marks-Bielska, Anastasija Novikova, and Bernardas Vaznonis. 2021. "Assessing the Value of Agroecosystem Services in Warmia and Mazury Province Using Choice Experiments" Agriculture 11, no. 1: 4. https://doi.org/10.3390/agriculture11010004