Article

Assessment of the Effect of the Mineral Fertilization System on the Nutritional Status of Maize Plants and Grain Yield Prediction

1
Department of Agricultural Chemistry and Environmental Biogeochemistry, Poznań University Life of Sciences, Wojska Polskiego 71F, 60-625 Poznań, Poland
2
Department of Agronomy, Poznań University of Life Sciences, Dojazd 11, 60-632 Poznań, Poland
3
Department of Mathematical and Statistical Methods, Poznań University of Life Sciences, 28 Wojska Polskiego St., 60-637 Poznań, Poland
*
Author to whom correspondence should be addressed.
Agriculture 2020, 10(9), 404; https://doi.org/10.3390/agriculture10090404
Submission received: 21 July 2020 / Revised: 6 September 2020 / Accepted: 9 September 2020 / Published: 12 September 2020

Abstract

:
A strict field experiment with maize was carried out in the years 2009–2011 at the Experimental Station of the Poznań University of Life Sciences. The impact of mineral fertilization levels on the nutritional status of plants at an early development stage 5–6 leaves (BBCH 15/16) was assessed, as well as the possibility of using biomass and the current state of nutrient supply to predict grain yield. The adopted assumptions were verified on the basis of field experiments with nine variants of mineral fertilization and two maize varieties (EURALIS Semences, Lescar, France) (ES Palazzo and ES Paroli SG—“stay-green” (SG)). Regardless of the variety tested, the plants were under-nutritioned with calcium and magnesium. Plant nutritional status and the accumulation of minerals at the BBCH 15/16 stage were the main factors determining the variability of maize grain yields. In addition, it was shown that maize biomass in the BBCH 15/16 stage, calcium content and the N:K ratio significantly determined grain yield of traditional variety. The yield of the “stay-green” hybrid was largely shaped by plant biomass in the BBCH 15/16 stage, potassium, calcium, magnesium contents and N:Mg ratio. Regression analysis showed that grain yield of the tested maize varieties was determined by plant biomass and its content from 59% to 69%.

1. Introduction

Correct recognition of cereal nutritional status during vegetation provides the possibility to predict yield at a very early stage [1]. For proper growth, a plant needs a certain amount of mineral components in a specific developmental phase [2]. Initial growth stages of this plant, i.e., until the 8th leaf formation, are particularly important. At this stage of development, maize is very sensitive to the deficiency of phosphorus, whose uptake depends on the concentration of orthophosphate ions in soil solution as well as on the temperature and nutrition of other minerals [3]. Thus, to achieve the assumed grain yield one should aim to: (1) increase the content of ingredients in the plant above the critical value, and (2) maintain the defined balance of mineral components in the plant. Water and lack of mineral balance in relation to plant nutritional needs are most often encountered among the factors limiting the size of possible yields [4]. The effect of phosphorus and potassium on the yield results mainly from the functions of these elements in reducing the effects of biotic and abiotic stress. Well-supplied plants in phosphorus and potassium better tolerate water shortages, low temperatures and are less susceptible to pathogen infections [5]. Failure to adapt the fertilization system to quantitative needs, and especially the dynamics of mineral component uptake by plants growing in the field, is the cause of disturbances in the functioning of individual components, their low utilization by the plant and an increase in the risk of environmental pollution [6]. Therefore, it is necessary to have knowledge about the effectiveness of individual components, while controlling the yield of the crop [7]. Hence, new agrotechnical solutions are sought, aimed at, on the one hand, optimizing nutrient application in maize, while limiting the eutrophication of the natural environment. The improvement of agrotechnics for the application of mineral fertilizers should always be aimed at increasing the use of a component of the mineral fertilizer. On the other hand, breeding new varieties that for example, utilize nitrogen more efficiently, and thus better absorb the component from the soil and manage the uptake of nitrogen more effectively, is a complementary strategy for administering this compound in modern agriculture. Knowledge about genetics, physiology, nutrient uptake and utilization is necessary in the process of breeding new varieties characterized by effective nitrogen metabolism, etc. High population variability of maize, according to Paponow et al. [8], gives the opportunity to find efficient genotypes, thanks to which it will be possible to obtain varieties that also will produce efficiently under conditions of moderate nitrogen deficiency stress. From an agronomic point of view, nitrogen utilization by a specific plant genotype (variety) refers to the size of grain yield obtained with the available resources of soil nitrogen (Nres) and mineral fertilizers [9]. High variation in nitrogen utilization among maize genotypes indicates that this trait is genetically determined and can be improved through breeding works. New maize varieties, for example the “stay-green” type, better utilize nitrogen [10], because their physiological features related to crop production are comprehensively improved.
The adopted hypothesis in the work assumes that in conditions of low and medium availability of absorbable component forms in soil, varied mineral fertilization does not affect the nutritional status of maize in the initial growth phase and grain yield.
The aim of the study was to evaluate the yield-forming reaction of two maize varieties and the nutritional status and accumulation of ingredients in the stage 5–6 leaves (BBCH 15/16), considered in terms of the optimal dose and reduced level of mineral fertilization with nitrogen, phosphorus, potassium, magnesium and sulfur.

2. Materials and Methods

2.1. Field Experiments

Field experiments were conducted (2009–2011) at the Department of Agronomy at Poznań University of Life Sciences on the fields of the Research Institute in Swadzim (52°26′20″ N 16°44′58″ E). They were conducted using the split-plot block with two research factors, in four field replications. The first factor was established as a nine fertilizer combination (control—no fertilization, NPK, N, NMg, NS, NP, NK, NMgS, NPKMgS), but the second factor was characterized as two cultivars of maize: ES Palazzo (FAO 230–240) and ES Paroli (FAO 250) “stay-green” SG type (ES Paroli SG). Nitrogen at a dose of 120 kg N ha−1 was applied in the form of ammonium nitrate and ammonium sulfate, phosphorus at a dose of 70 kg P2O5 ha−1 in the form of granular triple superphosphate 46% P2O5, potassium at a dose of 130 kg K2O ha−1 in the form of potassium salt 60% K2O, magnesium at a dose of 25 kg MgO ha−1 in the form of dolomitic lime 15% MgO, while sulfur at a dose of 20 kg S ha−1 in the form of ammonium sulfate. Sulfur in nitrogen-sulfur (NS) objects was used in the form of ammonium sulfate, while nitrogen was supplemented with ammonium nitrate to a final dose of 120 kg N ha−1. All mineral fertilizers were applied before sowing maize. The cultivars used in the experiment came from EURALIS Semences Breeding and Seed Production Company (Lescar, France). ES Palazzo cultivar (single hybrid, flint grain type, use for grain and silage, effective temperature sum, 1600 °C). ES Paroli SG cultivar (single hybrid, flint-dent grain type, use for grain and silage, effective temperature sum, 1665 °C). All plot sizes were 30.8 m2 (width 2.8 m, length 11.0 m). The yield of maize grain was determined at BBCH 89 stage on the area of 15.4 m2 (two central rows). The total grain yield value was adjusted to 14% moisture content. The soil with acidic reaction (pH KCL 5.1–5.4) was characterized by low contents of available phosphorus, potassium and magnesium. Soil properties are summarized in Table 1. The morphological structure of the experimental field is typical of the bottom moraine of the North Polish (Baltic) glaciation, the Poznań stadium. The parent materials of the soil are clay or sandy-loam formations. The terrain configuration shows little differentiation, the dominant terrain is flat and low undulating. Typologically, the soils of the test field belong to the black-earth type, a subtype of cambic black-earth, which belong to the black-earth order. According to the international classification of WRB, the studied soils should be classified as Phaeozemes, and according to the US Soil Taxonomy as Mollisols. In terms of soil valuation, the experimental field was classified as IIIb class. The black earth type includes soils where the direct influence of groundwater or heavy rainfall covers the lower and partly middle parts of the soil profile. In the surface horizons, rainfall and water management dominates, which can be modified to some extent by changing water properties of the deeper parts of the soil profile. Maize was seeded with the use of seeding machine equipped in a seed drill (rows spaced 0.75 m). All cultivation and harvest practices were carried out in accordance with agricultural requirements for maize.

2.2. Thermal and Humidity Conditions

Total atmospheric precipitation and the average daily air temperature in individual years of research are shown in Figure 1. It was shown that the years of field experiments were very diverse in terms of thermal and humidity conditions. The lowest amount of precipitation was recorded in 2011 (424.2 mm), while the highest in 2010 (500.7 mm). In turn, the average daily air temperature measured at 2 m height ranged from 14.5 °C (2010) to 15.9 °C (2011).

2.3. Chemical Analysis

Plant yield and N, P and K concentrations were assessed every year study of the study. Maize grain yield was determined in plants harvested manually from two adjacent central rows (11 m long). During nutrient concentration assessments, 5 maize plants were randomly chosen (on each treatment) and divided into the sets of leaves, stems, husks, grain and cob cores. Plant samples were dried out at 65 °C to the constant weight and ground for further analyses. Nitrogen concentration in the plant material was determined by the Kjeldahl method (Auto Distillation unit Kjeltec 2200, FOSS, Hillerød, Denmark). P and K concentrations were assessed in ground plant material and mineralized at 550 °C for 6 h. Next, the ash obtained was mixed with 2 cm3 of diluted HNO3 (concentrated nitric acid and distilled water 1:1). Phosphorus was determined calorimetrically with vanadium-ammonium molybdate. Potassium concentration was assessed using atomic absorption spectroscopy (SpectrAA-250Plus, Varian, Markham, ON, Canada). Concentrations of all the nutrients examined were expressed based on dry weights. Nutrient uptake was calculated based on dry weight values multiplied by nutrient concentration in plant organs (information on dry weights available from the authors).

2.4. Statistical Analysis

Statistical analysis of the experiment began with the assessment of three factors: years, variety and fertilization, using analysis of variance ANOVA of a split-plot design. Because the ANOVA test showed that the objects in the groups differ statistically significantly, Tukey’s HSD (honestly significant difference) test investigated, which objects they were. Statistical analyses were performed separately for varieties. Then, the dependence of the corn grain yield of the tested varieties on the plant biomass and the content of selected components was determined using backward stepwise multiple linear regression. In the last stage of the experiment analysis, path analysis was used. The result of path analysis was presented as a plot path diagram. The R software, version 3.6.2, was used for statistical calculations [11].

3. Results and Discussion

3.1. Grain Yield

Maize grain yield showed great variability under the influence of experimental factors and ranged from 8.50 to 11.03 t ha−1. A detailed assessment of the experimental factors showed significant differences between the tested varieties (Table 2). Higher yields were recorded for the ES Paroli SG variety and the difference in yield between the varieties was 1.06 t ha−1. Yields also varied between the research years (Table 3). The lowest grain yield for both varieties was found in 2010 and it was significantly different from the other two years of the study.
The level of yields also varied depending on the mineral fertilization variant applied. Regardless of the year of research, a significant increase in grain yield was noted in all fertilized objects compared to the control variant (Table 4 and Table 5). Significant differences were also found between fertilized objects, which means that the variant of mineral fertilization under the conditions of the experiment significantly influenced the differences in maize grain yield, although its effect varied depending on the variety and was more pronounced in the variety ES Paroli SG. The risk of a lower yield can be reduced by using balanced mineral fertilization of all nutrients, which has been confirmed by the results of the present research recorded for the tested varieties in NPKMgS variants, which amounted to 10 t ha−1 and 11.26 t ha−1, respectively. Maize grain yield reflects the state of ingredient imbalance during plant growing period. The amount of the main nutrients used in fertilizers is highly unbalanced both on a global and national scale [12]. In the last decade, the N:P2O5:K2O ratio was approximately 1:0.3:0.40, while the physiologically determined ratio of these nutrients in the biomass of high-yielding maize at harvest was 1:0.45:1.0 (1.2) [13]. The role of nitrogen in maize yielding is very well recognized, but at the same time the intensity of the discussion on the yield-forming efficiency of this mineral in maize fertilization does not decrease [14,15]. Particularly noteworthy are variants where no phosphorus or potassium was applied (Table 4 and Table 5). Lack of fertilization with these components caused a decrease in yield compared to the optimally balanced variant with respect to the nitrogen dose. Lack of phosphorus in the fertilizer dose compared to the variant optimally fertilized with NPKMgS, resulted in a decrease in maize grain yield by an average of 4.1% (ES Palazzo) and 8.7% (ES Paroli SG). The above relationship confirms the general view that maize is a species with specific phosphorus requirements [16]. According to Shenoy and Kalagudi [17] insufficient amount of available P may cause a yield reduction in the range from 10 to 15% compared to maximum yield. In the field experiments, maize was grown in sites with low available phosphorus content. Banaj et al. [18] have indicated that phosphorus fertilization can increase maize grain yield, but on the other hand, excessive application of this ingredient usually does not cause additional yield increases [19] and can lead to environmental pollution [20,21] and contribute to micronutrient deficiencies in maize plants [22,23]. Yi et al. [24] have proved that high maize performance when soil fertility is low would likely depend on other factors such as seeding density and application of additional complementary fertilizers during the growing season, and particularly during the grain formation phase. Huang et al. (1) reported that unbalanced mineral fertilization increased maize yield in a short period of time but had a negative effect on soil fertility in a longer perspective. This regularity has also been confirmed in studies of Gaj [25] and Bąk and Gaj [16]. The yield response of maize to the lack of potassium fertilization compared to objects without phosphorus was weaker and showed dependence on the tested variety. The reduction of yield due to the lack of potassium in fertilization was more pronounced in the variety ES Palazzo, for which the decrease in grain yield was 2.4% as compared to the NPKMgS object. The role of potassium in shaping the size of maize yield was emphasized by many researchers while pointing to the importance of utilization of this ingredient from sub-arable layers [26]. In order to increase the effectiveness of nitrogen, apart from the dose, attention should be paid to other nutritional factors that determine nitrogen utilization from fertilizers, i.e., phosphorus, magnesium and sulfur. In the current study, the highest maize grain yields, regardless of the variety, were recorded in variants optimally balanced in terms of nitrogen (NPKMgS). The introduction of magnesium and sulfur caused a slight increase in grain yield, which was below 1% compared to NPK objects. Salvagiotti et al. [4] showed that the average grain yield response to S and P addition was approximately 13% and 20%, respectively.

3.2. Assessment of Maize Nutritional Status

It is assumed that the initial growth phase of the 4–5th leaf is important for maize growth and development [27]. The first ear buds appear in the period from the leaf stage 3 to 6. The assessment of plant nutritional status during vegetation is performed in order to diagnose the current state of mineral nutrition and predict the final yield. The prognostic value increases when the content of components is referenced to their current content in the plant. Nutritional status of plants in the stage of 5–6 developed maize leaves, based on the average ingredient contents from 2009–2011, showed nitrogen malnutrition in control variants of the tested varieties (Table 4 and Table 5). Lower nitrogen content compared to normative values was also recorded in NPKMgS objects for the variety ES Palazzo and NK, NMg, NMgS for the variety ES Paroli SG. The remaining variants were characterized by optimal nitrogen and potassium contents compared to the normative values. It can therefore be assumed that maize plants were well nourished with these ingredients at the beginning of the growing season and were prepared for intensive CO2 assimilation and had sufficient resources of this component, both from soil and fertilizers. An insufficient amount of nitrogen when maize reaches a height of 20 cm reduces the number of grain rows in the ear bud and, consequently, reduces the final yield [28]. According to Subedi and Ma [29], plant nitrogen malnutrition before the 6–8 leaf stage leads to an irreversible reduction in the number of ears and potential kernels by up to 30%.
Mineral fertilization significantly differentiated potassium content in maize leaves of the variety ES Paroli SG at the BBCH 1516 stage. Omission of potassium in fertilization (objects: Control, N, NMg, NMgS, NP, NS) resulted in a significant decrease of this component in plants compared to the NPKMgS object (Table 5). Many literature data [30,31,32] indicate that the genetic factor is an element that significantly differentiates potassium content in plants and not the K dose used in the fertilizer. Askegaard et al. [33] emphasized that the assessment of potassium content in plants is a key factor in the effective management of this element and is a complement to soil tests. The analyzed varieties were cultivated in conditions of low abundance in available potassium (87.9–165.2 mg kg−1). Every agricultural process or procedure that interferes with potassium plant nutrition reduces the plant’s metabolic activity, and thus contributes to the reduction of nitrogen yield-forming efficiency. Moreover, Yang et al. [32] has emphasized that potassium content in maize organs was significantly dependent on the cultivation system and application technique of this ingredient. Maize is a very sensitive plant to potassium supply, especially in the period from 5/6 leaves to flowering. Appropriate plant nutrition in the critical growth phase results in a reduced risk of lodging (better developed mechanical tissue), higher grain number in the ear, higher weight of kernels (longer grain filling stage), even maturation and lower water content during the maturation stage [34].
Irrespective of the analyzed variety, a significant deficiency of phosphorus, magnesium and calcium was noted in maize leaves (Table 4 and Table 5). Except for the control object, the plants were well-fed with nitrogen. Maize nutrition with phosphorus, magnesium and calcium was significantly below the critical value, which in the case of phosphorus is 4.0 g kg−1, 3–6 g for Mg kg−1 and 5–16 g for Ca kg−1 [35]. At this stage of development, phosphorus determines the rate of growth of the root system and thus the plant’s ability to absorb water and nutrients from the soil. In the period from emergence to the BBCH-12 leaf stage, maize builds a root system, and the basic factors determining the conditions of its formation is the availability of phosphorus as well as the lack of limiting factors. Modern approach to fertilization requires balancing all ingredients, including secondary ones. Magnesium and sulfur play a specific role in this context. In addition to the specific physiological functions in the plant, both elements play an important role in nitrogen metabolism [36]. In the BBCH 15/16 stage, no significant differences were found in magnesium and calcium content under the influence of variable levels of mineral fertilization. Calcium and magnesium content was 1.01–2.05 Ca g·kg−1 and 2.0–2.7 Mg g·kg−1, respectively (Table 1). The obtained contents of ingredients, regardless of the analyzed experimental variant, were significantly below the normative values (Ca: 5.1–16 g·kg−1; Mg: 3–6 g·kg−1) set by Schulte and Kelling [37]. The causes of Ca and Mg deficiency in plants can be complex and result from both a deficiency of soil components, acidic soil reaction, excess of other cations as well as disruption of their uptake and translocation in the plant during develops [38,39]. Literature data shows that intensive potassium fertilization can sometimes affect the content not only of potassium [40,41], but also other ingredients in crop yields, causing their excessive or deficient concentration, especially in relation to two elements i.e., calcium and magnesium [42]. The issue of interaction between potassium and magnesium has been discussed in many studies [43,44,45]. Magnesium ions passively translocate through the cytoplasmic membrane with the electrochemical gradient of cation concentration and are first exposed to competition with actively taken up potassium ions [46]. Secondly, Mg2+ ions compete with calcium ions, which are also passively taken up by the plant [47].
A comprehensive analysis of the assessment taking into account the dependence of maize grain yield of the tested varieties on the produced biomass of plants in the BBCH 15/16 stage and component contents (N, P, K, Ca, Mg, Na) in leaves and N:K, N:P and N:Mg ratios was performed using multiple retrograde linear regression. Regression analysis showed that a strong relationship between the yield size and produced biomass as well as calcium content and N:K ratio was found in the variety ES Palazzo at the initial growth stage (BBCH 15/16). These variables determined the yield of ES Palazzo maize in 69%. The above relationship is expressed by the following regression Equation (1):
Grain yield (GY) = 3.82 ** + 0.03 Bp *** + 64.23 Ca ** + 1.85 N:K; R2 = 69.1
Significant codes—***: p-value < 0.001; **: p-value < 0.01.
In the present study, maize was grown on acidic soil (pH 5.1–5.4), which in consequence resulted in a low Mg and Ca content in the plant at the early developmental stage. Low calcium and magnesium content in plants at the BBCH 15/16 stage showed a significant impact on the grain yield and this relationship was confirmed by regression Equations (1) and (2).
As regards the second variety ES Paroli SG, the yield was largely shaped by plant biomass and the content of potassium (K), calcium (Ca), magnesium and N:Mg ratio (Equation (2)). These variables determined maize grain yield in 59.7%.
Grain yield (GY) = −1.80 + 0.02 Bp *** + 3.57 K * + 107.54 Ca * − 37.08 Mg * + 11.99 N:K * − 0.05 N:Mg *
Significant codes—***: p-value < 0.001; *: p-value < 0.05.
The relationships found prove that the more disturbed nutritional homeostasis, the greater the role of the analyzed ingredients in shaping the yield. The content of individual components changes with plant age, thus the relationships between the components that provide more information about the physiological state of plants are more useful for diagnostic purposes [48,49]. Confirmation of this thesis were path analyses (Figure 2 and Figure 3), which indicated a number of interactions between ingredients in maize leaves at the BBCH15/16 stage. In the case of the variety ES Paroli SG, interactions between Ca and Mg, Ca and N:Mg, Ca and N:P and Ca and Na were found. For the variety EC Palazzo, relationships between P and Mg, P and Ca and N:Mg and Na were observed. In addition, it should be noted that the yield of the variety ES Paroli SG (Figure 2) was mainly influenced by the content of potassium, phosphorus and N:K and N:P ratios, while nitrogen content and N:Mg ratio had a significantly lower effect. Yield of the variety ES Palazzo (Figure 3) was most strongly dependent on potassium content and N:K ratio, while the content of nitrogen, phosphorus, N:P ratio and plant biomass in the BBCH 15/16 phase had a lower effect. The issue of interaction between nitrogen and phosphorus has been raised in many works [50,51,52,53] emphasized that the prolonged phosphorus deficiency in the plant reduced the ATP energy pool and, as a result, nitrate nitrogen (N-NO3) uptake was reduced. Excess nitrogen, during the lack of phosphorus, causes the first sign of phosphorus deficiency.

3.3. Component Accumulation in Plants at the BBCH 15/16 Stage

The accumulation of components in maize biomass at the BBCH 15/16 stage was significantly dependent on the action of experimental factors (Table 6). Regardless of the experimental variant, an increase in the accumulation of macronutrients under the influence of mineral fertilization was found in comparison to the control object, but significant differences were noted only in phosphorus and potassium accumulation for the variety ES Palazzo and calcium and magnesium for the variety ES Paroli SG (Table 7 and Table 8). Nitrogen needs are minimal in the initial period of maize growth, they increase at a later stage of development and reach maximum between the beginning of flowering and grain formation [54]. Until the 6–8 leaf stage, maize absorbs about 3% of the total amount of nitrogen, while 85% of this component is taken up from the 6–8 leaf stage to the silk drying stage. Potassium removal from fertilization resulted in a significantly greater reduction in the accumulation of this component in the biomass of ES Palazzo plants compared to ES Paroli SG. A significant decrease in potassium uptake compared to the optimally fertilized variant NPKMgS was observed in N and NS positions for both varieties, but significant differences were found only for the variety ES Palazzo and on average they amounted to 36% for the mentioned objects (Table 7).
Particular attention should be paid to NMg objects for both tested cultivars, where the highest reduction in leaf potassium accumulation was noted, which indicated antagonistic effect of the components.
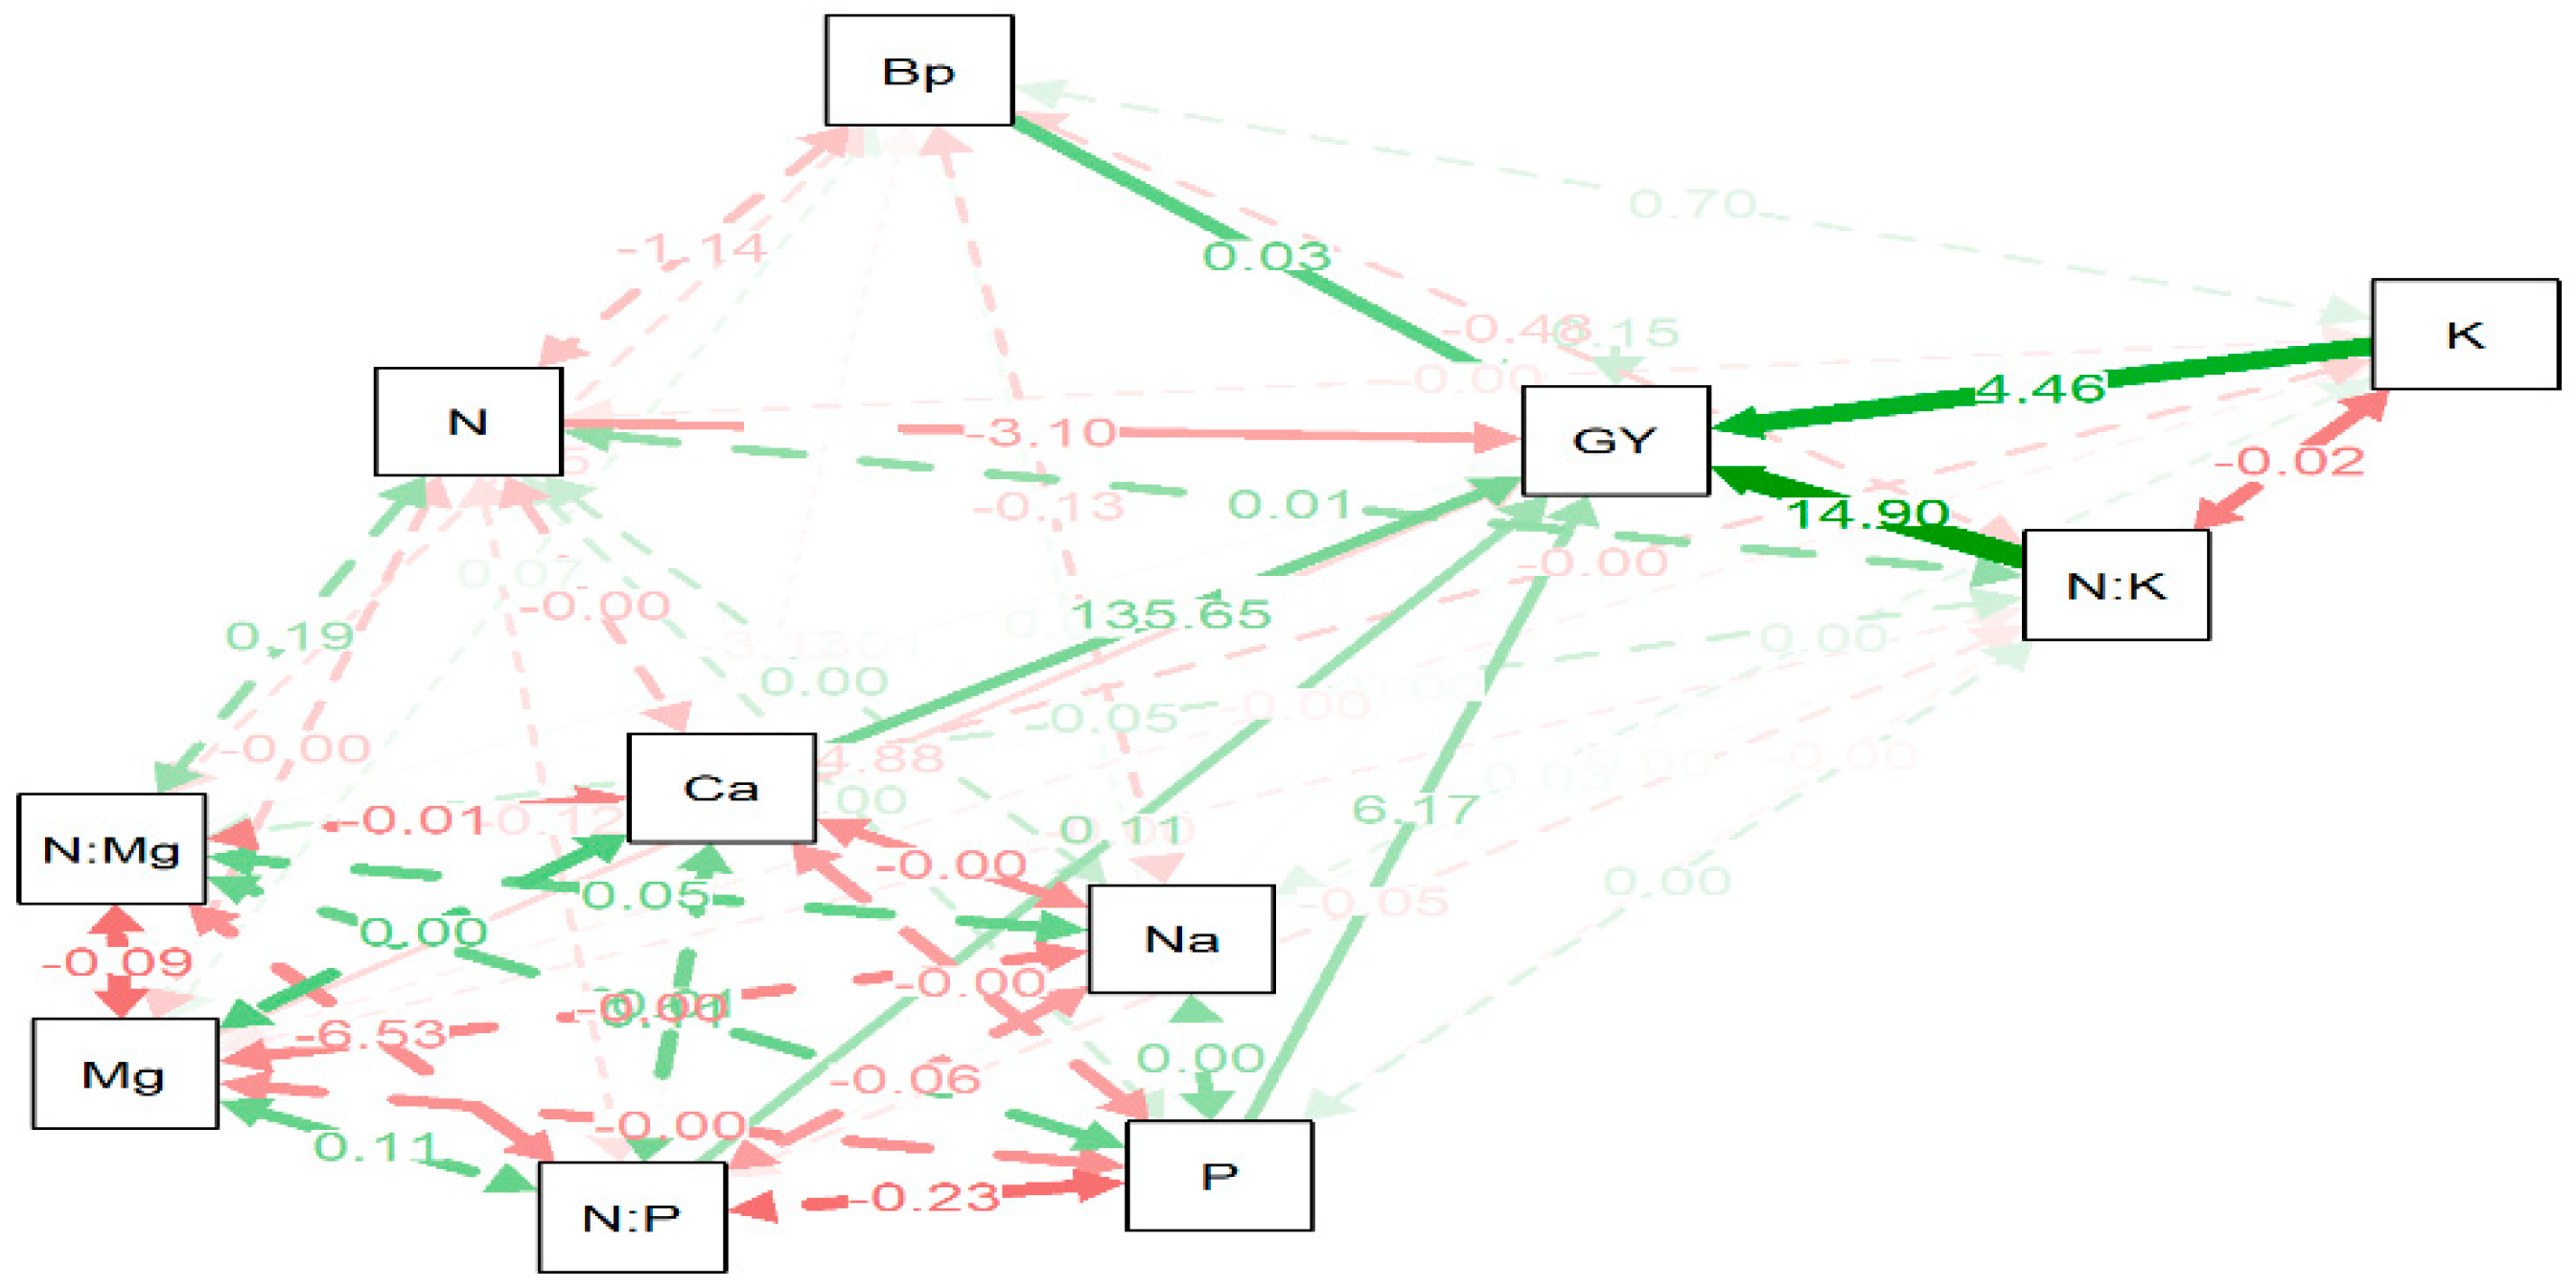
Analysis of the path diagram (Figure 4) showing the dependence of ES Paroli SG grain yield on component accumulation in leaf biomass at the BBCH 15/16 stage indicated that grain yield largely depended on the accumulation of nitrogen, potassium and calcium in the leaves. In addition, strong interactions between phosphorus, sodium, potassium, nitrogen and magnesium accumulation were found.
In the case of the second variety tested, path analysis (Figure 5) expressing the dependence of maize grain yield on component accumulation in the BBCH 15/16 stage showed that the yield largely depended on the accumulation of potassium, magnesium and calcium in the leaves in the initial growth phase. Strong interactions have also been noted between the accumulation of phosphorus and nitrogen and potassium and sodium, as well as between the accumulation of potassium and phosphorus, magnesium and sodium (Figure 5).

4. Conclusions

  • Experimental factors significantly differentiated the level of maize grain yield irrespective of the year of research. The “stay green” variety showed a higher yield-forming reaction to varied mineral fertilization than the classical variety and this difference was particularly evident in the reaction to the lack of phosphorus fertilization.
  • The nutritional status of plants was assessed in the initial growth stage of maize. Plant calcium and magnesium malnutrition was observed regardless of the analyzed fertilization variant and variety.
  • There was a significant relationship between the nutritional status of maize in the BBCH 15/16 stage, plant biomass and grain yield. Regression analysis showed that grain yield was determined by plant biomass and its component content from 59% to 69%.

Author Contributions

Conceptualization, P.S. and R.G.; methodology, P.S.; software, I.S.; validation, P.S., R.G. and H.W.; formal analysis, H.W.; investigation, I.S.; resources, P.S.; data curation, H.W.; writing—original draft preparation, R.G.; writing—review and editing, P.S.; visualization, I.S.; supervision, P.S.; project administration, R.G.; funding acquisition, R.G. All authors have read and agreed to the published version of the manuscript.

Funding

The paper was financed within the framework of the Ministry of Science and Higher Education program ‘Regional Initiative of Excellence’ in the years 2019–2022; Project No. 005/RID/2018/2019.

Conflicts of Interest

The authors declare no conflict of interest.

References

  1. Huang, S.; Zhang, W.; Yu, X.; Huang, Q. Effects of long-term fertilization on corn productivity and its sustainability in an Ultisol of Southern China. Agric. Ecosyst. Environ. 2010, 138, 44–50. [Google Scholar] [CrossRef]
  2. Zhang, K.; Greenwood, D.J.; White, P.J.; Burns, I.G. A dynamic model for the combined effects of N, P and K fertilizers on yield and mineral composition; description and experimental test. Plant Soil 2007, 298, 81–98. [Google Scholar] [CrossRef]
  3. Sucunza, F.A.; Gutierrez-Boem, F.H.; Garcia, F.O.; Boxler, M. Long-term phosphorus fertilization of wheat, soybean and maize on Molisols: Soil test trends, critical levels and balances. Eur. J. Agron. 2018, 96, 87–95. [Google Scholar] [CrossRef]
  4. Salvagiotti, F.; Prystupa, P.; Ferraris, G.; Courenot, L.; Maganano, L.; Dignani, D.; BGuttierrez-Bemoem, F. N:P:S stoichiometry in grains and physiological attributes associated with grain yield in maize as affected by phosphorus and sulfur nutrition. Field Crops Res. 2017, 203, 128–138. [Google Scholar] [CrossRef]
  5. Ma, Q.; Niknam, S.R.; Turner, D.W. Responses of osmotic adjustment and seed yield of Brassica napus and B. junacea to soil water deficit at different growth stages. Aust. J. Agric. Res. 2006, 57, 221–226. [Google Scholar] [CrossRef]
  6. Roberts, T.L. Improving nutrient use efficiency. Turk. J. Agric. For. 2008, 32, 177–182. [Google Scholar]
  7. Erley, G.S.; Kaul, H.; Krause, M.; Aufhammer, W. Yield and nitrogen utilization efficiency of the pseudocereals amaranth, quinna, and buckwheat under differing nitrogen fertilization. Eur. J. Agron. 2005, 22, 95–100. [Google Scholar] [CrossRef]
  8. Paponov, I.A.; Sambo, P.; Erley, G.S.; Presterl, T.; Geiger, H.H.; Engels, C. Grain yield and kernel weight of two maize genotypes differing in nitrogen use efficiency at various levels on nitrogen and carbohydrate availability during flowering and grain filling. Plant Soil 2005, 272, 111–123. [Google Scholar] [CrossRef]
  9. Moll, R.H.; Kamprath, E.J.; Jackson, W.A. Analysis and interpretation of factors which contribute to efficiency of nitrogen utilization. Agron. J. 1982, 74, 562–564. [Google Scholar] [CrossRef]
  10. Szulc, P.; Bocianowski, J.; Rybus-Zając, M. Accumulation of N, P, K and Mg nutrient elements and nutrient remobilization indices in the biomass of two contrasting maize (Zea mays L.) hybrids. Fresenius Environ. Bull. 2012, 21, 2062–2071. [Google Scholar]
  11. R Core Team. R: A Language and Environment for Statistical Computing; R Foundation for Statistical Computing: Vienna, Austria, 2019; Available online: https://www.R-project.org/ (accessed on 11 September 2020).
  12. FAOSTAT. Food and Agriculture Organization of the United Nations. Available online: http://faostat.fao.org/site/567/default.aspx#ancor (accessed on 25 September 2019).
  13. GUS. Statistical Yearbook of Republic of Poland 2019. 2019. Available online: https://stat.gov.pl/en/topics/statistical-yearbooks/statistical-yearbooks/statistical-yearbook-of-the-republic-of-poland-2019,2,21.html (accessed on 11 September 2020).
  14. Wang, Y.; Lu, Y. Evaluating the potential health and economic effects of nitrogen fertilizer application in grain production systems of China. J. Clean. Prod. 2020, 264, 121635. [Google Scholar] [CrossRef]
  15. Davies, B.; Coulter, J.A.; Pagliari, P.H. Timing and rate of nitrogen fertilization influence maize yield and nitrogen use efficiency. PLoS ONE 2020, 15, e0233674. [Google Scholar] [CrossRef] [PubMed]
  16. Bąk, K.; Gaj, R. The effect of differentiated phosphorus and potassium fertilization on maize grain yield and plant nutritional status at the critical growth stage. J. Elementol. 2016, 21, 337–348. [Google Scholar]
  17. Shenoy, V.V.; Kalagudi, G.M. Enhancing plant phosphorus use efficiency for suitable cropping. Biotechnol. Adv. 2005, 23, 501–513. [Google Scholar] [CrossRef]
  18. Banaj, D.; Kovacevic, V.; Simic, D.; Seput, M.; Stojic, B. Phosphorus impacts on yield and nutritional status of maize. Cereal Res. Commun. 2006, 34, 393–396. [Google Scholar] [CrossRef]
  19. Bai, Z.H.; Li, H.G.; Yang, X.Y.; Zhou, B.K.; Shi, X.J.; Wang, B.R.; Li, D.C.; Shen, J.B.; Chen, Q.; Qin, W.; et al. The critical soil P levels for crop yield, soil fertility and environmental safety in different soil types. Plant Soil 2013, 372, 27–37. [Google Scholar] [CrossRef]
  20. Glibert, P.M. Eutrophication, harmful algae and biodiversity—Challenging paradigms in a world complex nutrient changes. Mar. Pollut. Bull. 2017, 124, 591–606. [Google Scholar] [CrossRef]
  21. Le, C.; Zha, Y.; Li, Y.; Sun, D.; Lu, H.; Yin, B. Eutrophication of lake waters in China: Cost, causes, and control. Environ. Manag. 2010, 45, 662–668. [Google Scholar] [CrossRef]
  22. Cakmak, I. Plant nutrition research: Priorities to meet human needs for food in sustainable ways. Plant Soil 2002, 247, 3–24. [Google Scholar] [CrossRef]
  23. Stein, A.J. Global impacts of human mineral malnutrition. Plant Soil 2010, 335, 133–154. [Google Scholar] [CrossRef]
  24. Yi, C.; Jie, Z.; Zhen-Xiang, L.; Zhi-Jin, H.; Shu-Ting, D.; Ji-Wang, Z.; Bin, Z. Modified fertilization management of summer maize (Zea mays L.) in northern China improves grain yield and efficiency of nitrogen use. J. Integr. Agric. 2015, 14, 1644–1657. [Google Scholar]
  25. Gaj, R. Sustainable management of phosphorus in soil and plant in condition of intensive plant production. In Adaptive Soil Management—From Theory to Practices; Fertilizers and Fertilization; Springer: Berlin, Germany, 2008; Volume 33, p. 143. [Google Scholar]
  26. Qiu, S.; Xie, J.; Zhao, S.; Xu, X.; Hou, Y.; Wang, X.; Zhou, W.; He, P.; Johnston, A.; Christie, P.; et al. Long-term effects of potassium fertilization on yield, efficiency, and soil fertility status in a rain-fed maize system in northeast China. Field Crops Res. 2014, 163, 1–9. [Google Scholar] [CrossRef]
  27. Leach, K.A.; Hameleers, A. The effects of a foliar spray containing phosphorus and zinc on the development, composition and yield of forage maize. Grass Forage Sci. 2001, 56, 311–315. [Google Scholar] [CrossRef]
  28. Vega, C.R.C.; Andrade, F.H.; Sadras, V.O.; Uhart, S.A.; Valentinuz, O.R. Seed number as a function of growth. A comparative study in soybean, sunflower and maize. Crop. Sci. 2001, 41, 748–754. [Google Scholar]
  29. Subedi, K.D.; Ma, B.L. Nitrogen Uptake and Partitioning in Stay-Green and Leafy Maize Hybrids. Crop. Sci. 2005, 45, 740–747. [Google Scholar] [CrossRef]
  30. Damon, P.M.; Osbornel, D.; Rengel, Z. Canola genotypes differ in potassium efficiency during vegetative growth. Euphytica 2007, 156, 387–397. [Google Scholar] [CrossRef]
  31. Woodend, J.J.; Glass, A.D.M. Genotype environment interaction and correlation between vegetative and grain production measures of potassium use efficiency in wheat (T. aestivum L.) grown under potassium stress. Plant Soil 1993, 151, 39–44. [Google Scholar] [CrossRef]
  32. Yang, F.; Wang, G.; Zhang, Z.; Eneji, A.E.; Duan, L.; Li, Z.; Tian, X. Genotypic variations in potassium uptake and utilization in cotton. J. Plant Nutr. 2011, 34, 83–97. [Google Scholar] [CrossRef]
  33. Askegaard, M.; Eriksen, J.; Johnston, A.E. Sustainable management of potassium. In Managing Soil Quality —Challenges in Modern Agriculture; Schjonning, P., Elmholt, S., Christensen, B.T., Eds.; CABI Publishing International: Wallingford, UK, 2004; pp. 85–102. [Google Scholar]
  34. Asibi, A.E.; Chai, Q.; Coulter, J.A. Mechanisms of nitrogen use in maize. Agron. J. 2019, 9, 775. [Google Scholar] [CrossRef] [Green Version]
  35. Lockman, R.B. Relationships between corn fields and nutrient concentrations in seedling whole-plant samples. Agron. Abstr. 1969, 1969, 97. [Google Scholar]
  36. Marschner, H. Mineral Nutrition of Higher Plants; Academic Press: New York, NY, USA, 1995. [Google Scholar]
  37. Schulte, E.; Kelling, K. Plant Analysis: A Diagnostic Tool; University of Wisconsin: Madison, IA, USA, 2000; Available online: www.ces.pardue.edu/extmedia/NCH/NCH-46.html (accessed on 11 September 2020).
  38. Fageria, V.D. Nutrient interactions in crop plants. J. Plant Nutr. 2001, 24, 1269–1290. [Google Scholar] [CrossRef]
  39. Shaul, O. Magnesium transport and function in plants: The tip of the iceberg. Biometals 2002, 15, 309–323. [Google Scholar] [CrossRef] [PubMed]
  40. Tan, D.; Jin, J.; Jiang, L.; Huang, S.; Liu, Z. Potassium assessment of grain producting soils in North China. Agric. Ecosyst. Environ. 2012, 148, 65–71. [Google Scholar] [CrossRef]
  41. Niu, J.; Zhang, W.; Ru, S.; Chen, X.; Xiao, K.; Zhang, X.; Assaraf, M.; Imas, P.; Magen, H.; Zhang, F. Effects of potassium fertilization on winter wheat under different production practices in the North China Plain. Field Crops Res. 2013, 140, 69–76. [Google Scholar] [CrossRef]
  42. Karley, A.; White, P. Moving cationic minerals to edible tissues: Potassium, magnesium, calcium. Curr. Opin. Plant Biol. 2009, 12, 291–298. [Google Scholar] [CrossRef] [PubMed]
  43. Farhat, N.; Rabhi, M.; Falleh, H.; Lenliz, K.; Smaoui, A.; Abdelly, C.; Lachaal, M.; Karray-Bouraoui, N. Interactive effects of excessive potassium and Mg deficiency on sanfflowe. Acta Physiol. Plant. 2013, 35, 2737–2745. [Google Scholar] [CrossRef]
  44. Diem, B.; Godbold, D.L. Potassium, calcium and magnesium antagonism in clones of Populus trichocarp. Plant. Soil. 1993, 155, 411–414. [Google Scholar] [CrossRef]
  45. Pujos, A.; Morasd, P. Effects of potassium deficiency on tomato growth and mineral nutrition at the early production stage. Plant Soil 1997, 189, 189–196. [Google Scholar] [CrossRef]
  46. Gierth, M.; Mäser, P. Potassium transporters in plants—Involvement in K+ acquisition, redistribution and homeostasis. FEBS Lett. 2007, 581, 2348–2356. [Google Scholar] [CrossRef] [Green Version]
  47. Pfeiffer, W.; Hager, A. A Ca2+-ATPase and Mg2+/H+-antiporter are present on tonoplast membranes from foots of Zea mays L. Planta 1993, 191, 377–385. [Google Scholar] [CrossRef]
  48. Santa-Maria, G.E.; Epstein, E. Potassium/sodium selectivity in wheat and the amphiploid cross wheat X. Lophopyrum elongatum. Plant Sci. 2001, 160, 523–534. [Google Scholar] [CrossRef]
  49. Nebolsin, A.N.; Nebosina, Z.P.; Alekseev, Y.V.; Yakovleva, L.V. Liming of soils contaminated with heavy metals. Agrochemistry 2004, 3, 48–54. [Google Scholar]
  50. Skowrońska, A.; Filipek, T. Accumulation of nitrogen and phosphorus by maize as the result of a reduction in the potassium fertilization rate. Ecol. Chem. Eng. S 2010, 17, 83–88. [Google Scholar]
  51. Zidai, N.; Bêlanger, G.; Cambouris, A.N.; Trmblay, N.; Nolin, M.C.; Claessens, A. Relationship between P and N concentration in corn. Agron. J. 2007, 99, 833–838. [Google Scholar] [CrossRef]
  52. Sadras, V.O. The N:P stoichiometry of cereal, grain legume and oilseed crops. Field Crops Res. 2006, 95, 13–29. [Google Scholar] [CrossRef]
  53. Rychter, A.M.; Randall, D.D. The effect of phosphate deficiency on carbohydrate metabolism in bean roots. Physiol. Plant. 1994, 91, 383–388. [Google Scholar] [CrossRef]
  54. Szulc, P.; Bocianowski, J. Hierarchy of mineral uptake in the creation of generative yield. Fres. Environ. Bull. 2011, 20, 2135–2140. [Google Scholar]
Figure 1. The average daily air temperature and the sum of atmospheric precipitations in maize growing seasons.
Agriculture 10 00404 g001
Figure 2. Path analysis expressing the dependence of maize grain yield (GY) of the variety ES Paroli SG on component contents and plant biomass in the BBCH 15/16 stage. GY—grain yield of maize; Bp—plant biomass at BBCH 15/16; N, P, K, Mg, Ca, Na—nutrients concentration in leaves at BBCH 15/16; N:K—nutrient ratio of N to K contents in maize leaves at BBCH 15/16; N:P—nutrient ratio of N to P contents in maize leaves at BBCH 15/16; N:Mg—nutrient ratio of N to Mg contents in maize leaves at BBCH 15/16. Green line: positive parameter estimates; red line: negative parameter estimates.
Agriculture 10 00404 g002
Figure 3. Path analysis expressing the dependence of maize grain yield of the variety ES Palazzo on component contents and plant biomass in the BBCH 15/16 stage. GY—grain yield of maize; Bp—plant biomass at BBCH 15/16; N, P, K, Mg, Ca, Na—nutrients concentration in leaves at BBCH 15/16; N:K—nutrient ratio of N to K contents in maize leaves at BBCH 15/16; N:P—nutrient ratio of N to P contents in maize leaves at BBCH 15/16; N:Mg—nutrient ratio of N to Mg contents in maize leaves at BBCH 15/16.
Agriculture 10 00404 g003
Figure 4. Path analysis expressing the dependence of maize grain yield of the variety ES Paroli SG on component accumulation in plant dry weight at the BBCH 15–16 stage. GY—grain yield of maize; UN, UK, UMg, UCa, UNa—nutrients accumulation in leaves at stage BBCH15/16 of plant development.
Agriculture 10 00404 g004
Figure 5. Path analysis expressing the dependence of maize grain yield of the variety ES Palazzo on component accumulation in plant dry weight at the BBCH 15–16 stage. GY—grain yield; UN, UK, UMg, UCa, UNa—nutrients accumulation in leaves at stage BBCH 15/16 of plant development.
Agriculture 10 00404 g005
Table 1. Soil fertility indicators before the experimental setup.
IndicatorsYears
200920102011
Phosphorus mg P kg−1 of soil 66.740.537.8
Potassium mg K kg−1 of soil87.9130.3165.2
Magnesium mg Mg kg−1 60.035.055.0
pH in 1 mol dm−3 KCl5.25.45.1
Nmin (kg ha−1) in soil, layer 0–60 cm68.579.271.4
C, org. %1.010.990.99
Texture %Sand 2–0.05 mm838383
Silt 0.05–0.02 mm666
Salt 0.02–0.002 mm774
Clay <0.002 mm444
Textural grouploamy sandloamy sandloamy sand
Table 2. Analysis of variance for the split-plot design.
Source of VariationGrain Yield Plant Biomass at BBCH15–16Nutrients Concentration in Maize Leaf at BBCH 15/16Nutrient Ratio
NPKCaMgNaN:KN:PN:Mg
Year 7.3 *36420.13 *0.09 **0.050.03 *0.0250.012 **0.012326.3 **109.9 *
Variety15.1 *22200.13 *0.0010.010.010.0070.0010.0130.819.2
Ea0.39270.010.0010.030.010.00070.0010.0021.71.5
Fertilization1.7 ***1044 ***0.05 *0.0010.23 ***0.01 *0.00150.0002 *0.032 ***2.3 *5.5
Variety: Fertilization 0.1670.020.0010.070.010.00030.00010.0040.73.4
Eb0.11980.020.0010.050.010.00050.00010.0060.92.6
Numerical values correspond to “mean square” (Msq). Ea—error for big plot. Eb—error for small plot. Significant codes—***: p-value < 0.001; **: p-value < 0.01; *: p-value < 0.05.
Table 3. Tukey’s multiple comparison test for years.
YearGrain Yield
t ha−1
Plant Biomass at BBCH 15/16 kg ha−1Nutrients Concentration in Maize Leaf at BBCH 15/16 g kg−1Nutrient Ratio
NPKCaMgNaN:KN:PN:Mg
ES Palazzo
20099.81 a *91.39 a4.13 ab0.34 a3.710.01 b0.23 b0.06 a1.1212.13 c17.74 a
20108.75 b69.40 b4.19 a0.25 b3.860.01 b0.25 b0.07 a1.0916.66 b16.96 a
201110.06 a93.61 a4.01 b0.19 c3.810.02 a0.31 a0.02 b1.0620.63 a12.81 b
ES Paroli SG
200911.03 a118.01 a4.070.32 a3.830.01 b0.22 b0.06 a1.0812.72 c18.25 a
20109.92 b83.30 b4.050.25 b3.870.01 b0.22 b0.07 a1.0516.20 b18.48 a
201110.83 a91.57 b3.920.18 c3.770.02 a0.28 a0.02 b1.0521.24 a14.35 b
* Means with the same letter are not significantly different (separately for column and variety); α = 0.05 (Tukey’s test).
Table 4. Tukey’s multiple comparison test of the variety ES Palazzo depending on mineral fertilization level.
TreatmentsGrain Yield t ha−1Plant Biomass at BBCH 15/16 kg ha−1Nutrients Concentration in Maize Leaf at BBCH 15/16, g kg−1Nutrient Ratio
NPKCaMgNaN:KN:PN:Mg
Control8.50 b *75.73 b39.8 ab2.938.51.012.70.51.0314.8814.95
N9.53 a77.80 b42.5 a2.738.22.032.60.41.1216.4316.69
NK9.59 a82.56 ab40.1 ab2.538.71.032.50.61.0316.8016.34
NMg9.46 ab74.38 b41.2 ab2.635.22.042.80.41.1816.5215.37
NMgS9.41 ab79.17 ab40.8 ab2.538.42.032.70.61.0617.2115.45
NP9.76 a89.46 ab41.9 ab2.635.72.082.70.51.1816.9815.94
NPK9.94 a97.66 ab42.0 ab2.738.51.912.70.41.1016.0915.74
NPKMgS10.00 a111.23 a39.5 b2.740.21.852.50.50.9815.7516.15
NS9.66 a75.21 b42.0 ab2.537.81.962.70.51.1117.6115.89
* Means in column with the same letter are not significantly different; α = 0.05.
Table 5. Tukey’s multiple comparison test of the variety ES Paroli SG depending on mineral fertilization level.
TreatmentsGrain Yield
t ha−1
Plant Biomass at BBCH 15/16 kg ha−1Nutrients Concentration in Maize Leaf at BBCH 15/16 g kg−1Nutrient Ratio
NPKCaMgNaN:KN:PN:Mg
Control9.21 d *88.6839.82.638.7 ab1.062.50.41.03 ab16.5116.59
N10.67 abc88.3340.62.535.2 b2.102.50.51.15 a17.0916.92
NK10.28 c86.2137.52.442.2 a1.822.10.60.89 b16.5417.71
NMg10.65 abc80.3539.92.435.2 b2.522.40.51.14 a17.2616.77
NMgS10.44 bc99.7339.62.437.1 ab2.332.70.51.07 ab17.5015.05
NP11.25 a114.5641.22.737.6 ab1.522.50.51.10 ab16.2016.63
NPK11.16 ab107.2540.22.637.8 ab1.022.50.41.06 ab16.1215.95
NPKMgS11.26 a123.5841.12.743.1 a1.632.00.50.95 ab15.9120.93
NS10.44 bc89.9641.12.536.9 ab2.022.50.51.11 ab17.3616.69
* Means in column with the same letter are not significantly different; α = 0.05.
Table 6. Multiple comparisons Tukey’s test of component accumulation in the years 2009–2011.
Variety YearNutrients Accumulation, kg ha−1
UNUPUKUCaUMgUNa
ES Palazzo20093.76 ± 0.61 a *0.32 ± 0.06 a3.40 ± 0.77 a1.01 ± 0.2 b0.21 ± 0.04 b0.05 ± 0.04 a
20101.90 ± 0.53 b0.17 ± 0.04 b2.69 ± 0.48 b1.01 ± 0.1 c0.17 ± 0.02 c0.03 ± 0.01 ab
20114.55 ± 2.14 a0.16 ± 0.03 b3.58 ± 0.81 a1.02 ± 0.3 a0.29 ± 0.04 a0.02 ± 0.01 b
ES Paroli SG20094.81 ± 0.95 a0.38 ± 0.08 a4.53 ± 0.96 a1.01 ± 0.2 b0.26 ± 0.05 a0.10 ± 0.06 a
20102.94 ± 1.93 b0.21 ± 0.07 b3.25 ± 0.89 b1.01 ± 0.2 c0.18 ± 0.03 b0.05 ± 0.03 b
20114.01 ± 2.43 ab0.17 ± 0.05 b3.49 ± 1.04 b1.02 ± 0.3 a0.25 ± 0.04 a0.02 ± 0.01 b
* Means in column with the same letter are not significantly different; α = 0.05. Numerical values: mean ± SD, U: uptake.
Table 7. Multiple comparisons Tukey’s test of component accumulation in the leaves in the variety ES Palazzo at the BBCH 15/16 stage depending on the mineral fertilization factor.
TreatmentsNutrients Accumulation, kg ha−1
UNUPUKUCaUMgUNa
Control2.56 ± 0.610.21 ± 0.10 ab *2.91 ± 0.25 b1.01 ± 0.40.21 ± 0.050.02 ± 0.012
N3.02 ± 1.170.20 ± 0.08 ab2.98 ± 0.60 b1.06 ± 0.40.21 ± 0.080.02 ± 0.007
NK2.80 ± 1.260.23 ± 0.07 ab3.20 ± 0.28 ab1.05 ± 0.50.21 ± 0.050.03 ± 0.008
NMg2.94 ± 1.280.17 ± 0.05 b2.60 ± 0.32 b1.09 ± 0.50.21 ± 0.080.02 ± 0.007
NMgS2.69 ± 1.720.21 ± 0.15 ab3.05 ± 1.18 ab1.03 ± 0.30.21 ± 0.080.05 ± 0.054
NP4.06 ± 1.620.22 ± 0.08 ab3.18 ± 0.53 ab1.07 ± 0.70.24 ± 0.080.04 ± 0.014
NPK4.44 ± 1.960.24 ± 0.06 ab3.76 ± 0.73 ab1.01 ± 0.30.27 ± 0.070.04 ± 0.002
NPKMgS5.31 ± 3.280.29 ± 0.13 a4.47 ± 1.09 a1.08 ± 0.30.27 ± 0.070.07 ± 0.056
NS2.72 ± 0.790.19 ± 0.08 ab2.85 ± 0.30 b1.09 ± 0.30.20 ± 0.030.03 ± 0.012
* Means in column with the same letter are not significantly different; α = 0.05. Numerical values: mean ± SD, U: uptake.
Table 8. Multiple comparisons Tukey’s test of component accumulation in maize leaves in the variety ES Paroli SG depending on the mineral fertilization factor.
TreatmentsNutrients Accumulation, kg ha−1
UNUPUKUCaUMgUNa
Control2.75 ± 1.400.23 ± 0.123.45 ± 1.141.01 ± 0.7 ab *0.21 ± 0.04 abc0.04 ± 0.04
N3.12 ± 1.170.22 ± 0.103.11 ± 0.511.01 ± 0.5 ab0.22 ± 0.05 abc0.03 ± 0.02
NK2.70 ± 1.020.22 ± 0.083.65 ± 0.661.01 ± 0.3 b0.18 ± 0.03 c0.04 ± 0.03
NMg2.75 ± 1.070.20 ± 0.092.80 ± 0.201.01 ± 0.4 ab0.20 ± 0.04 bc0.03 ± 0.02
NMgS3.43 ± 2.650.27 ± 0.223.77 ± 2.111.02 ± 0.6 ab0.26 ± 0.08 abc0.09 ± 0.12
NP5.31 ± 1.370.30 ± 0.164.27 ± 0.701.02 ± 0.7 a0.29 ± 0.06 a0.07 ± 0.05
NPK5.22 ± 2.200.26 ± 0.064.07 ± 0.731.01 ± 0.3 ab0.27 ± 0.03 ab0.05 ± 0.01
NPKMgS6.73 ± 1.550.33 ± 0.065.32 ± 0.191.01 ± 0.3 ab0.25 ± 0.03 abc0.10 ± 0.05
NS3.28 ± 1.630.28 ± 0.143.34 ± 1.051.01 ± 0.4 ab0.22 ± 0.06 abc0.04 ± 0.03
* Means in column with the same letter are not significantly different; α = 0.05 (Tukey’s test). Numerical values: mean ± SD, U: uptake.

