Article

Content of Trace Elements in Soil Fertilized with Potassium and Nitrogen

by
Mirosław Wyszkowski
1 and
Marzena S. Brodowska
2,*
1
Department of Environmental Chemistry, Faculty of Environmental Management and Agriculture, University of Warmia and Mazury in Olsztyn, Łódzki 4 Sq., 10-727 Olsztyn, Poland
2
Department of Agricultural and Environmental Chemistry, Faculty of Agrobioengineering, University of Life Sciences in Lublin, Akademicka 15 Str., 20-950 Lublin, Poland
*
Author to whom correspondence should be addressed.
Agriculture 2020, 10(9), 398; https://doi.org/10.3390/agriculture10090398
Submission received: 24 July 2020 / Revised: 28 August 2020 / Accepted: 7 September 2020 / Published: 8 September 2020
(This article belongs to the Special Issue Soil Quality and Crop Nutrition)

Abstract

:
The aim of the study was to determine the effect of increasing potassium fertilization (0, 140, 190, and 240 mg K2O/kg of soil) in the interaction with nitrogen fertilization (130 and 170 mg N/kg of soil) on the trace elements content in the typical, non-contaminated agricultural soil. The trace elements content in the soil depended on nitrogen and potassium fertilization. Potassium fertilization had a more significant effect on trace elements content in the soil fertilized at the same time with a lower nitrogen dose (130 mg N/kg soil). Increasing potassium fertilization increased the content of cadmium by 83% and lead by 32% and reduced the amounts of chromium by 10% and iron by 3% in the soil, particularly in the series with a lower nitrogen dose (130 mg N/kg soil). The effect of potassium fertilization on the content of other trace elements was less unambiguous since, for most of trace elements, lower doses of this fertilizer contributed to growth of trace element, while higher doses lead to a decrease in their accumulation in the soil. Nitrogen fertilization increased the contents of zinc and iron—3%, copper—9%, manganese—12%, chromium—15%, and cobalt—59%, while reducing the contents of cadmium and nickel—24% and lead—45%. Permissible standards for trace elements content in the soil have not been exceeded.

1. Introduction

The growing world population is increasing the demand for food, and in highly developed countries consumer requirements necessitate the production of high-quality foods. The production of large amounts of food and feeding stuffs requires the supply of agricultural raw materials of plant origin on an adequate scale, which, in turn, is closely linked to securing the fertilizer needs of plants. This would not be possible without the application of mineral, natural, and organic fertilizers to agricultural fields in a proper ratio, in doses adapted to the nutritional and fertilizer needs of individual plant species [1,2].
The application of mineral fertilizers to the soil entails the introduction of a whole range of elements into the environment [3,4], of which, apart from the macronutrients and certain trace elements necessary for the proper growth and development, heavy metals are also present [5], which probably play no physiological role in living organisms [6]. Even when elements which are useful (for plants) are found in the soil in excessive amounts, they are moved along the subsequent chains of the trophic chain, and, in extreme cases, may even have a negative effect on the growth and development of plants and other living organisms [6,7]. The application of mineral fertilizers in doses recommended for crop cultivation is not expected to result in an excessive uptake of trace elements by plants [3,8].
The average content of trace elements in world uncontaminated soil (depending on the type of soil) are as follows: cadmium 0.37–0.78 mg/kg, lead 22–44 mg/kg, chromium 12–83 mg/kg, cobalt 4.5–12 mg/kg, nickel 12–34 mg/kg, zinc 45–100 mg/kg, copper 13–24 mg/kg, manganese 270–525 mg/kg, and iron 8000–18,000 mg/kg [9]. Gray et al. [10] showed that the application of mineral fertilizers, particularly phosphorus fertilizers, for more the 40 years, resulted in an increase in the cadmium content in the soil (as much as 7.8 g Cd/ha/year), including cadmium bound with exchangeable fractions and soil organic matter. As time passed, however, cadmium was redistributed into forms less available to plants and it was leached down the soil profile. According to Hejcman et al. [11], after 65 years of mineral fertilizer application, the content of trace elements, particularly arsenic, in the soil fertilized with mineral fertilizers, increased considerably. Majority trace elements have also interaction with iron and manganese [9]. However, trace elements availability to plants was determined by the soil pH and decreased following the application of oxide lime. On the other hand, Losak et al. [12] showed that nitrogen fertilization had a relatively inconsiderable effect on the availability of trace elements for plants. Only positive correlations were noted between fertilization with nitrogen and fertilization with zinc and iron. The application of ammonium nitrogen fertilizers can affect the availability of trace elements to plants through, for example, causing transformations of unavailable or hardly available manganese forms to the available Mn(II) in the soil [13]. These transformations, however, limited the uptake of Mn(II) by plants, unlike nitrate nitrogen fertilizers which had an opposite effect. Lorenz et al. [14], under the influence of nitrogen potassium containing NH4+, noted an increase in the content of zinc available to plants, following a decrease in the pH of the soil from 6.8 to 6.0, by as much as 5–15 times. According to Richards et al. [3], the amounts of trace elements introduced into the soil with mineral fertilizers are smaller than those introduced with organic fertilizers. Pogrzeba et al. [2] found that mineral fertilization can increase the uptake of certain trace elements by plants. Jiao et al. [15], as regards classic mineral fertilizers, indicated that phosphorus fertilizers could be a potentially significant source of trace elements such as arsenic, cadmium, and lead in cultivated fields. In areas directly adjacent to expressways and industrial plants, characterized by elevated trace element contents, their additional doses originating from mineral fertilizers can, at some point in time, contribute to exceeding the permissible trace element contents in soils used for agricultural purposes, as set out by the existing regulations [11]. Some trace elements such as copper, zinc, chromium, manganese, and cobalt are essential for the growth and development of plants in small amounts [16]. According to Kabata-Pendias [9], the following content of trace elements in plants is excessive (toxic): cadmium 5–30 mg/kg, lead 30–300 mg/kg, chromium 5–20 mg/kg, cobalt 15–50 mg/kg, nickel 10–100 mg/kg, zinc 100–400 mg/kg, copper 20–100 mg/kg, and manganese 400–1000 mg/kg of dry matter (DM). Excessive content of trace elements in soils and plants may cause chlorosis and even plant death. Their impact depends on many factors, including on the type of trace element and the species of the plant [9].
Therefore, the study was aimed to determine the effect of increasing potassium fertilization in the interaction with nitrogen fertilization on the trace elements content in the soil.

2. Materials and Methods

2.1. Methodological Design

The study was based on a vegetative pot experiment conducted at a plant growth facility in three repetitions in polyethylene pots (height—25 cm, diameter at the top—24 cm, and diameter at the bottom—19 cm). The pots were filled with 9 kg of soil material collected from the top layer (0–25 cm) of a non-contaminated agricultural typical brown soil (Eutric Cambisol) according to the World Reference Base of Soil Resources [17] with a granulometric composition of sand. The properties of soil were located in Table 1.
The soil was dried and sieved through a 1 cm diameter sieve before setting up the experiment. The experiment was established using the complete randomized block design. The experiment investigated the effect of increased potassium doses of 0, 140, 190, and 240 mg K2O/kg soil. It was conducted in two series with a lower and a higher nitrogen dose of 130 and 170 mg N/kg soil. Potassium was applied in the form of potassium sulphate (500 g K2O/kg and 450 g SO3/kg), while nitrogen was applied in the form of a urea and ammonium nitrate solution—UAN (280 g N/kg). Half of the potassium and nitrogen dose was applied before sowing. Additionally, phosphorus in the form of Superfosdar40 (Fosfory Ltd., Gdańsk, Poland) (85 mg P2O5/kg soil) and micronutrients in equal amounts (2.9 mg Zn; 3.4 mg Cu; 1 mg B; 2.7 mg Mn; 0.02 mg Mo/kg soil) were introduced into each pot to meet the nutritional needs of the cultivated plants. Micronutrients were applied in the following forms: Zn—ZnCl2·7H2O; Cu—CuSO4·5H2O; B—H3BO3; Mn—MnCl2·H2O; and Mo—(NH4)6Mo7O24·4H2O. The fertilizers used in experiment met requirements of Regulation EC No 2003/2003 of the European Parliament and of the Council of 13 October 2003 relating to fertilizers [18]. The test plant was maize (Zea mays L.) of the Kadryl variety. The soil, after being thoroughly mixed with mineral fertilizers, in accordance with the study pattern, was introduced into the pots, which was followed by the sowing of maize (in the next day) with a density of 16 plants per pot. The plants were thinned after seedling emergence to 8 plants per pot. At the stage of 4–6 leaves, a second dose of potassium and nitrogen fertilizers was applied. Double-distilled water was added to each pot by watering. During the experiment, the moisture content was maintained at a level of 60% of the capillary water field capacity. The plants were harvested in the middle of heading: half of the inflorescence emerged stage (BBCH 55–71 days after sowing) and soil material samples were collected for laboratory analyses.

2.2. Methods of Laboratory and Statistical Analyses
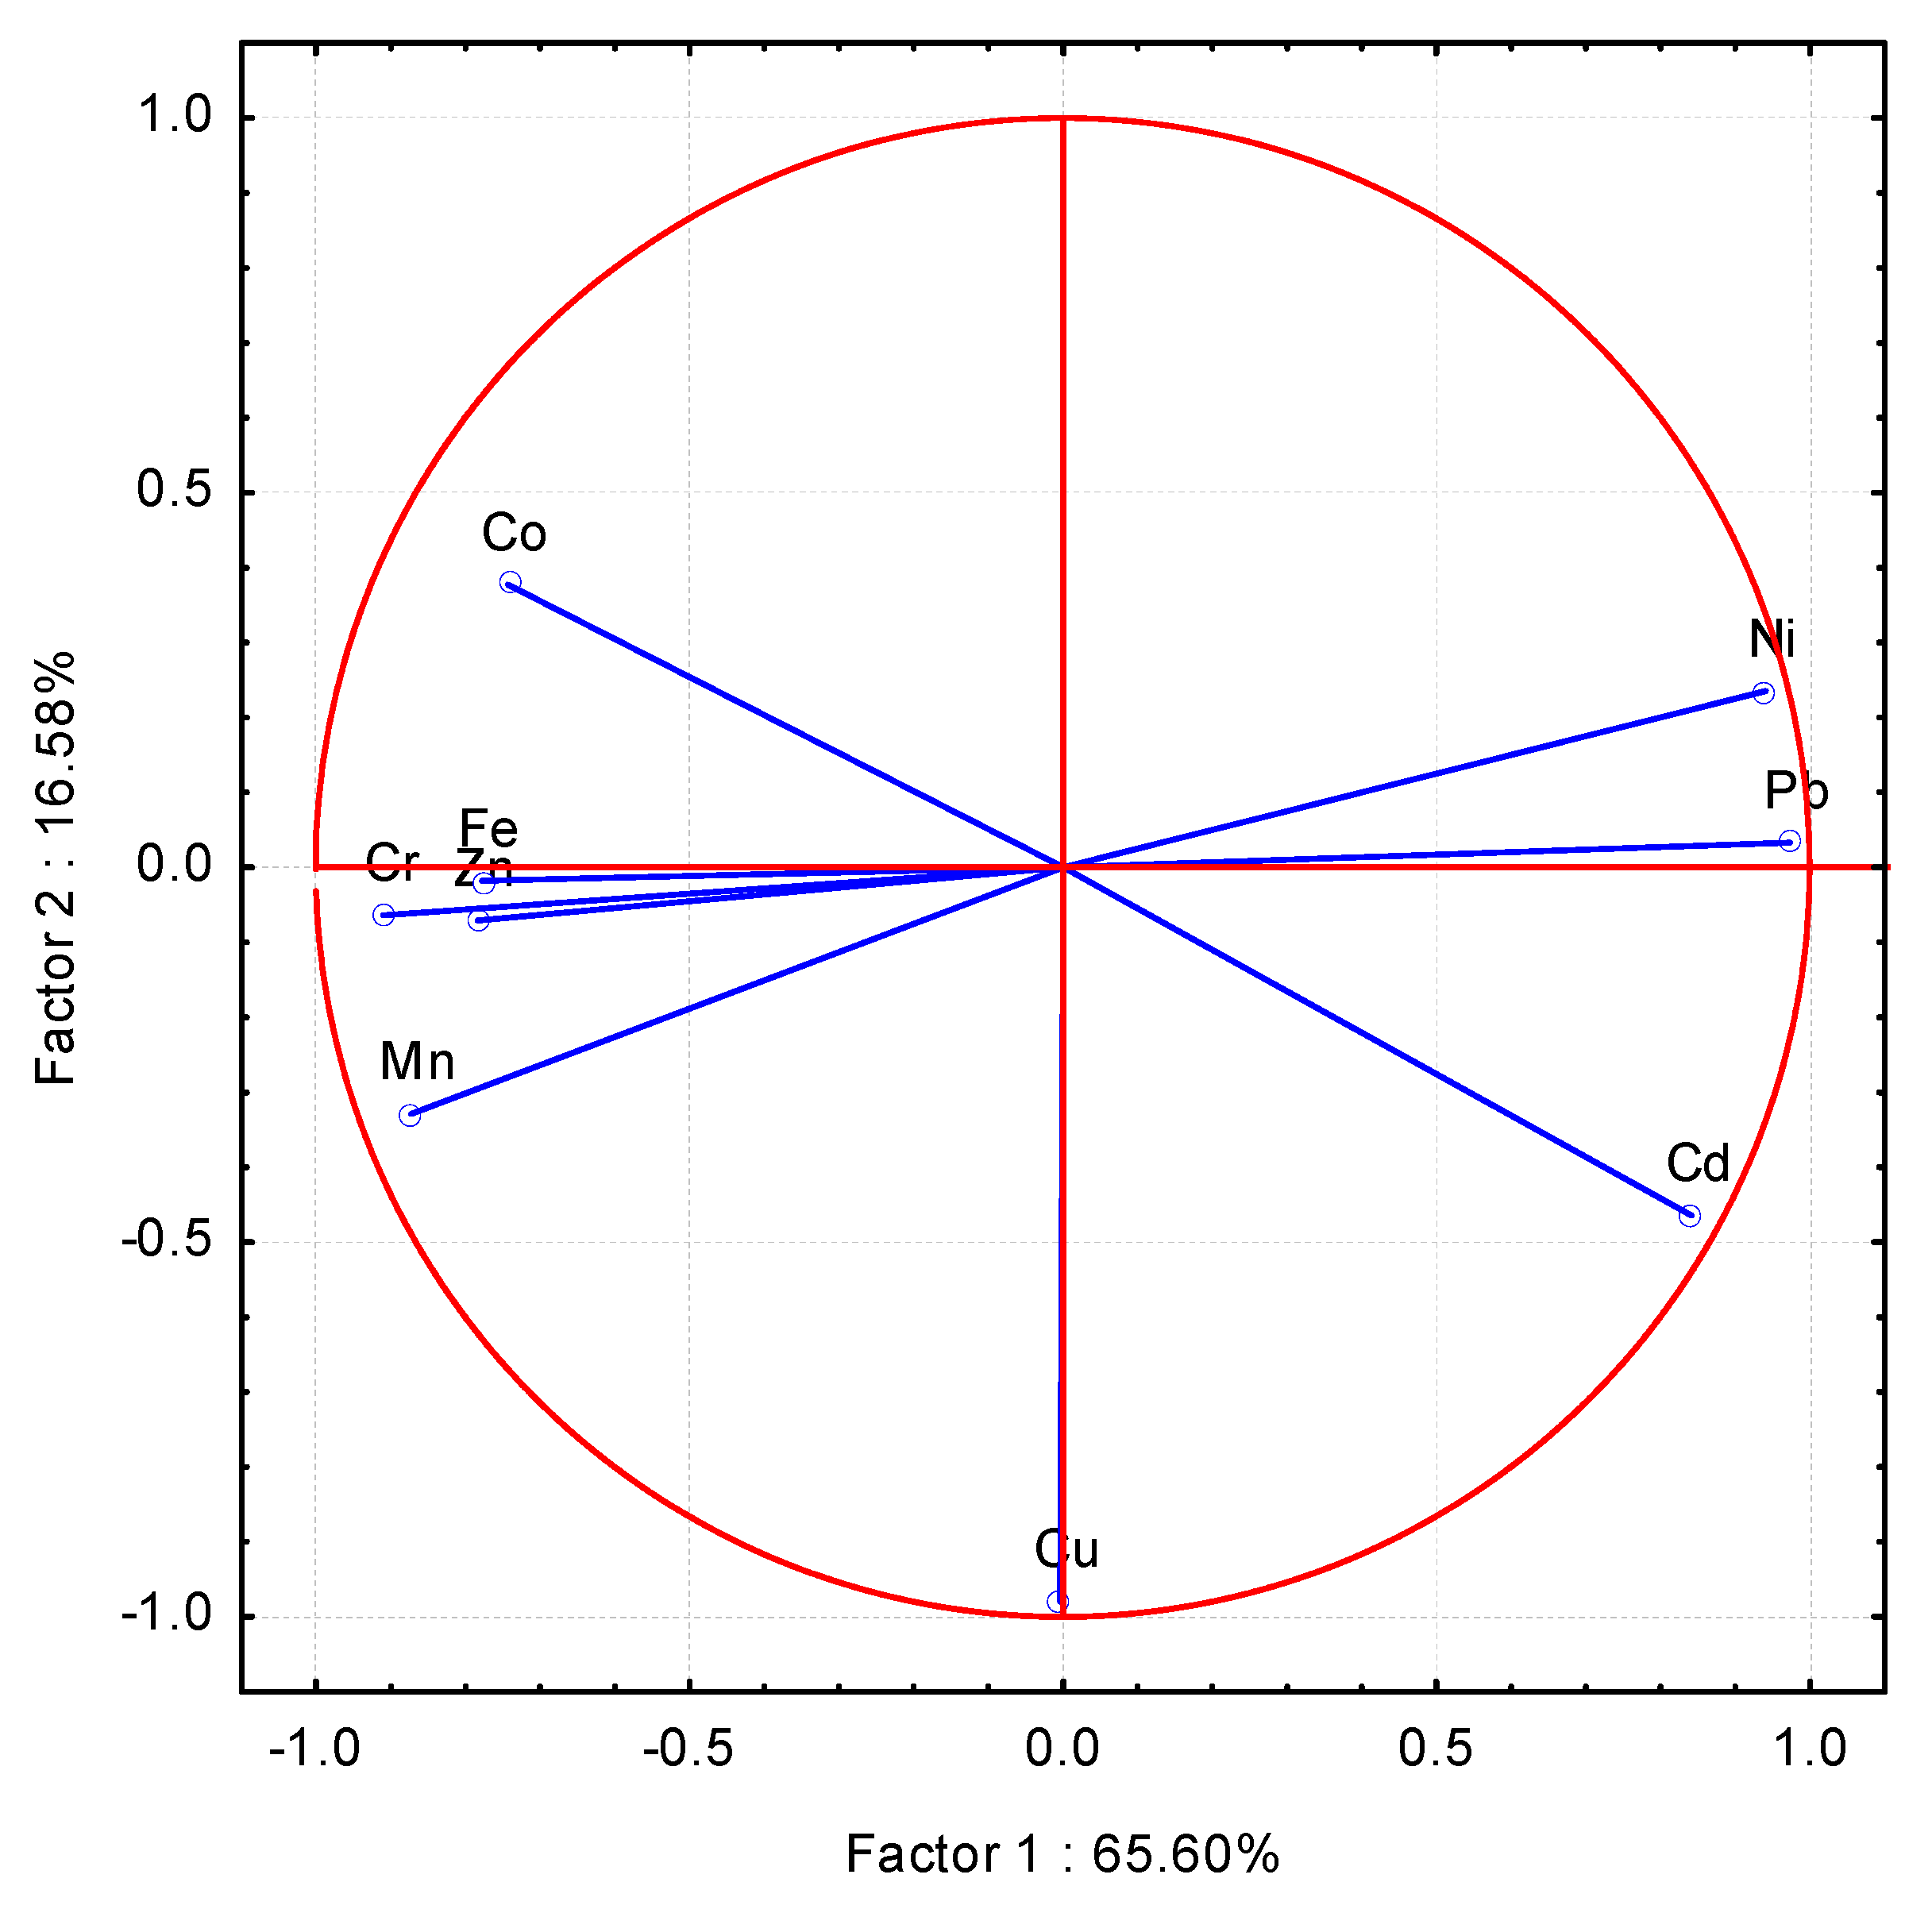
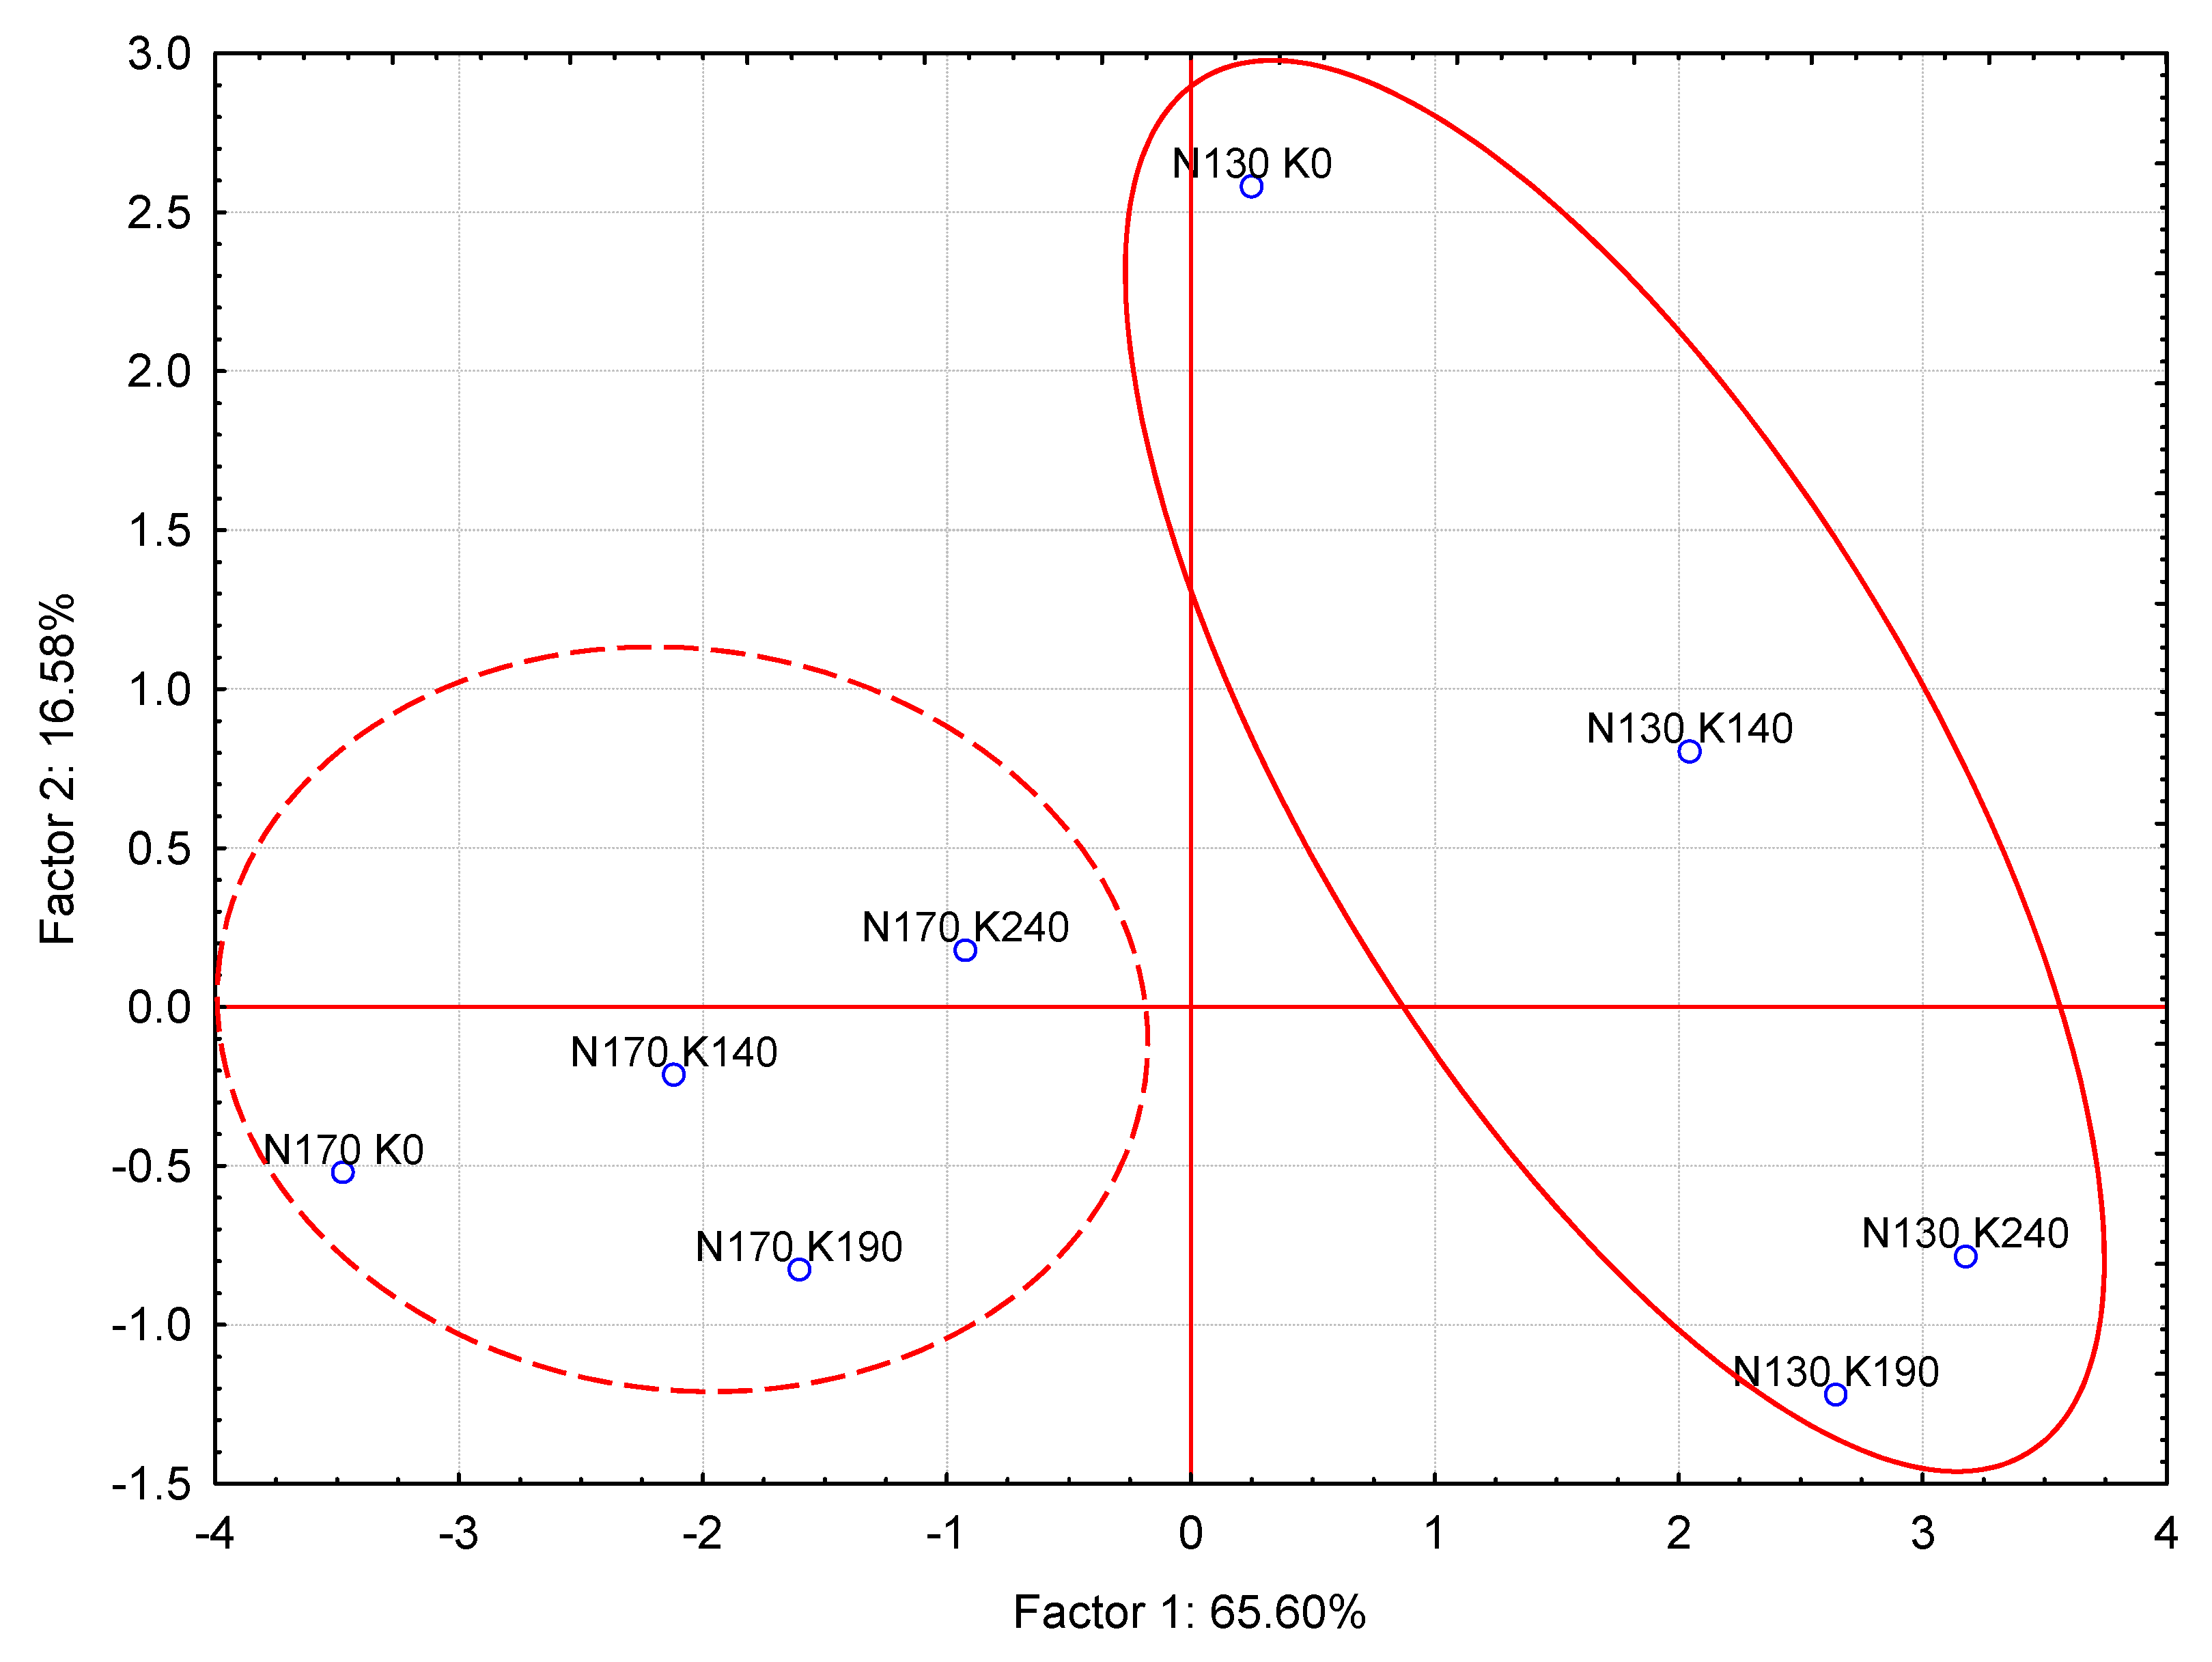
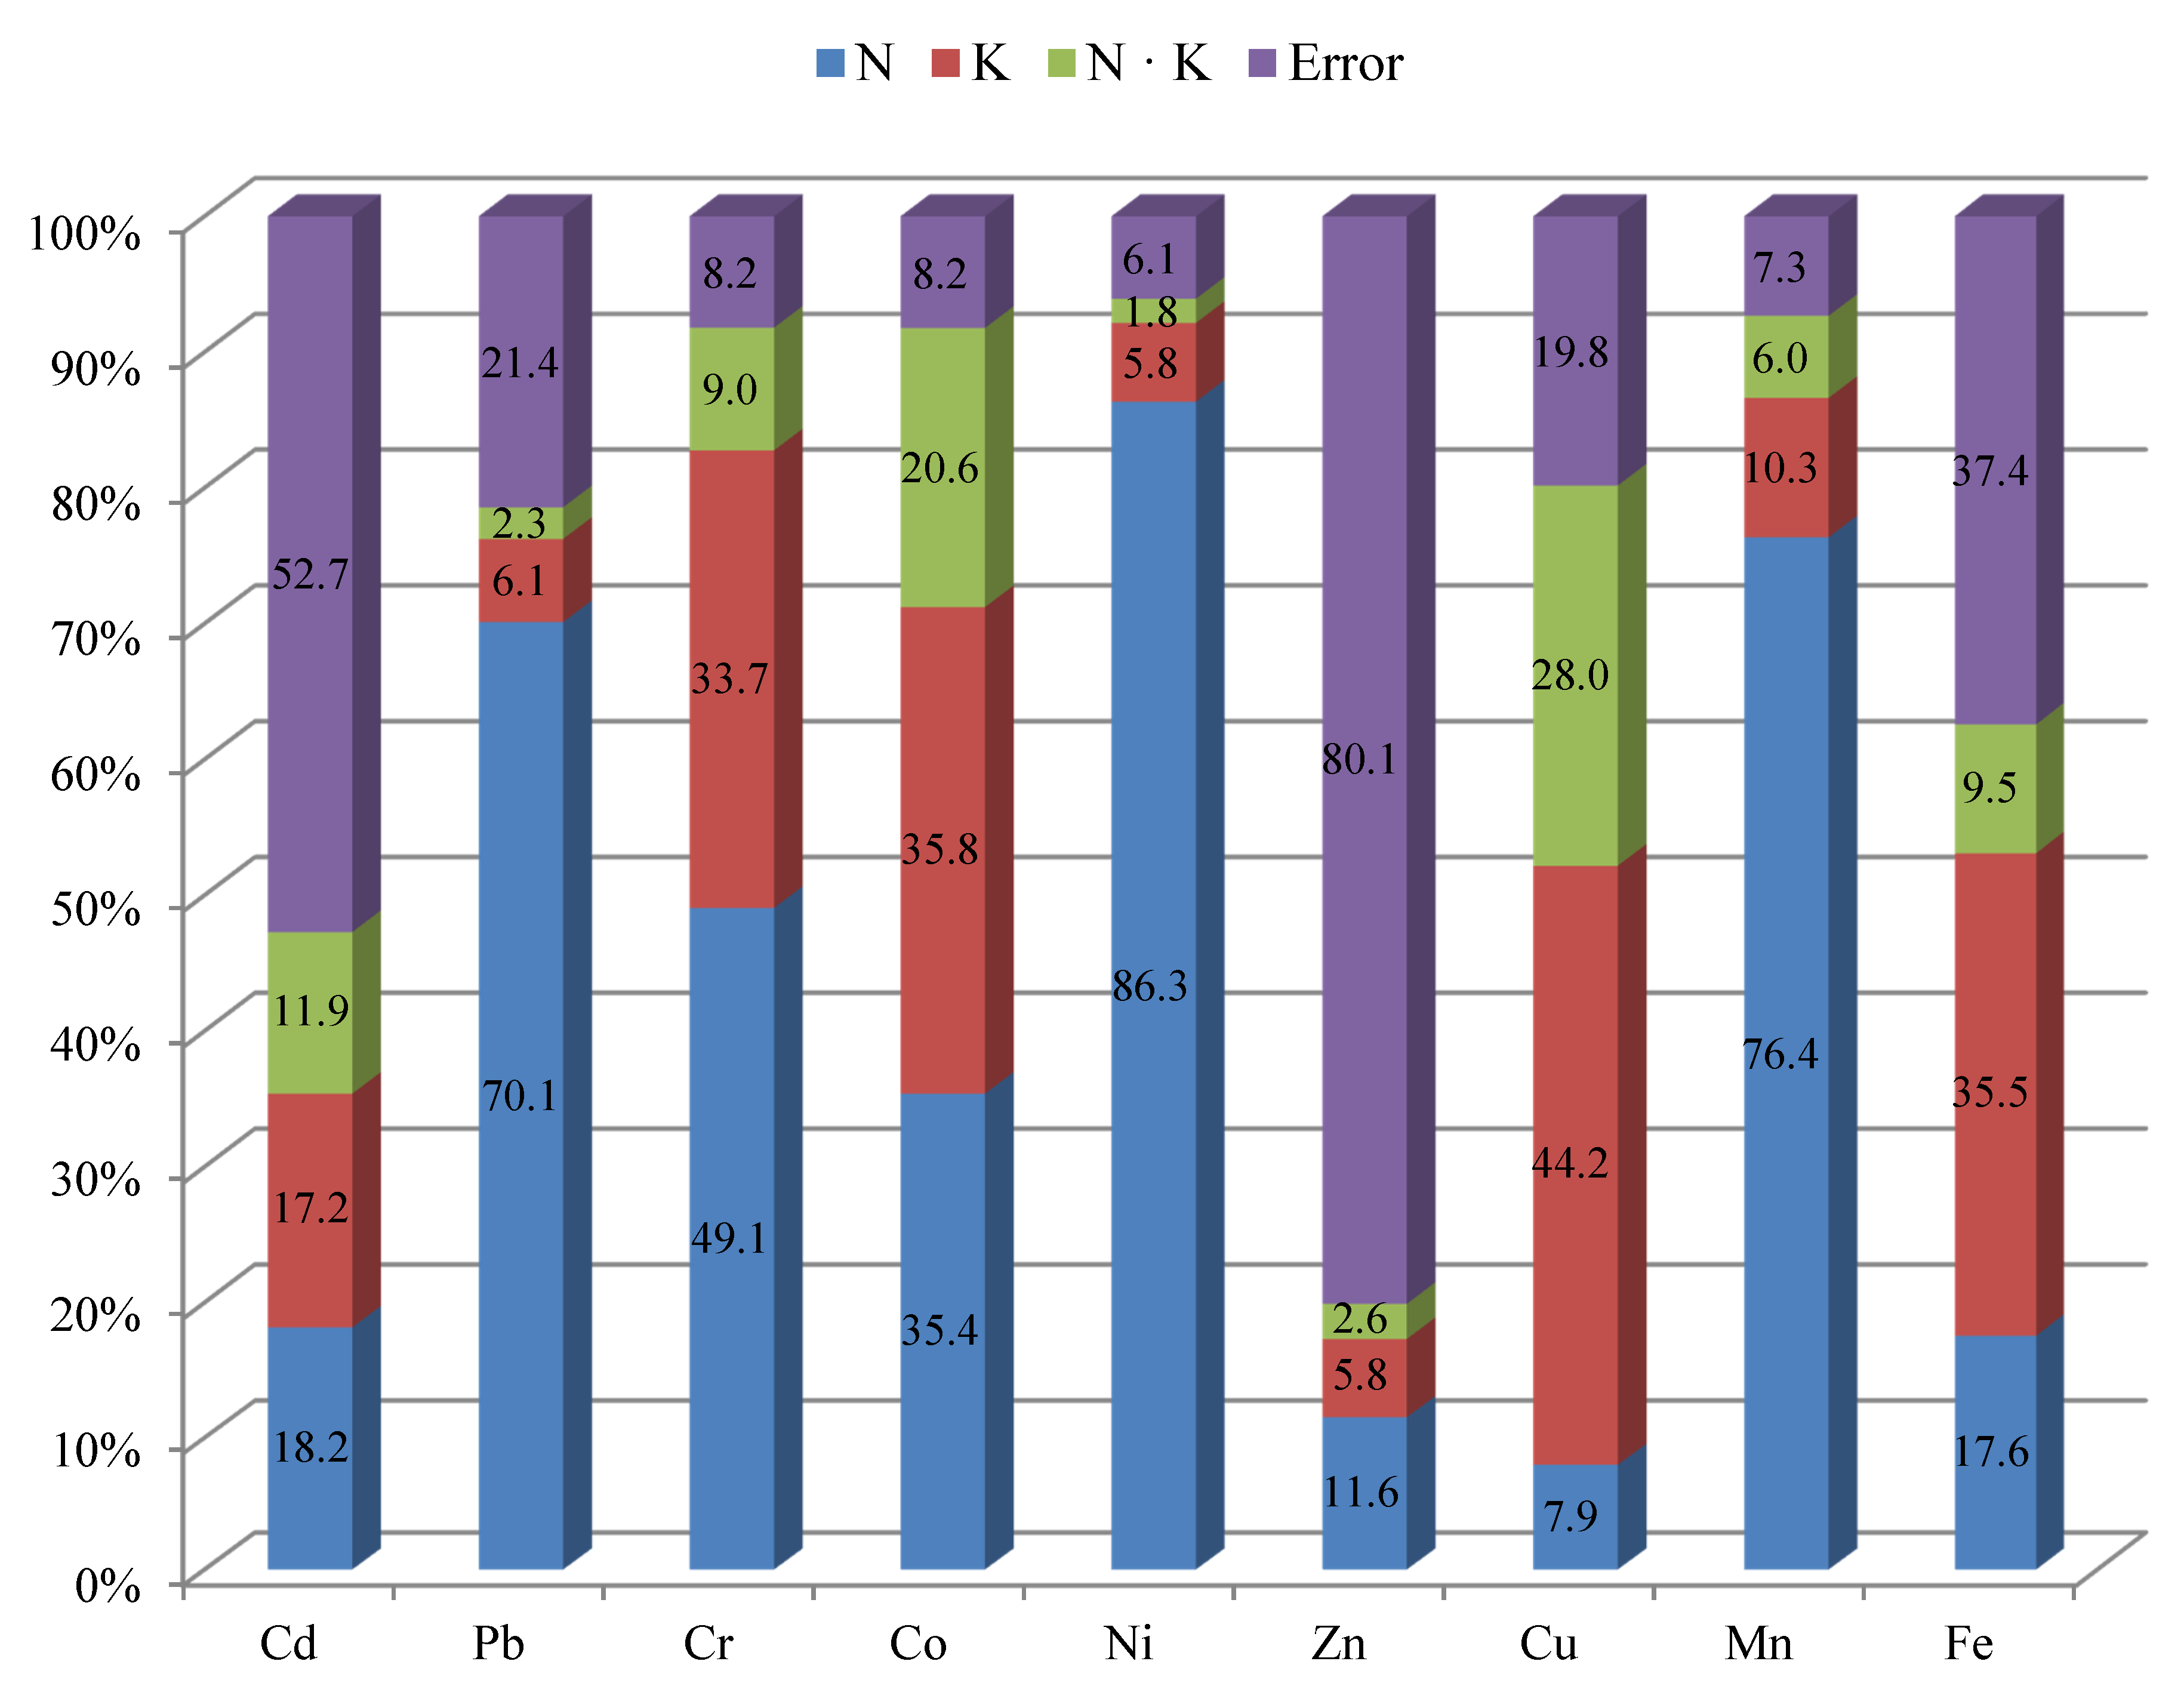
The collected soil material was air dried, sifted through a 1 mm mesh screen, and subjected to batch acid digestion system in a mixture of concentrated nitric acid (HNO3 of analytical grade—1.40 g/cm3) and hydrochloric acid (HCl of analytical grade—1.18 g/cm3), in a 4:1 ratio, in a MARS 6 microwave oven (CEM Corporation, Matthews, NC, USA) in Xpress Teflon® vessels, in accordance with the US-EPA3051 [19] method. All soil samples are digested at the same time and under the same conditions. The total content of cadmium, lead, chromium, cobalt, nickel, zinc, copper, manganese, and iron was then determined by flame atomic absorption spectrometry (FAAS) in an air-acetylene flame [20]. For the performance of analyses, Fluka standard solutions with the following symbols were used: Cd 51994, Pb 16595, Cr 02733, Co 119785.0100, Ni 42242, Zn 188227, Cu 38996, Mn 63534, and Fe 16596. The obtained results were compared to the Certified Analytical Reference Material Soil S-1 from the AGH University of Science and Technology in Kraków, Poland.
In addition, prior to the establishment of the experiment, the granulometric composition in the soil was determined by the aerometric method [21] and the laser diffraction method, the pH in 1 M KCl (soil/1 M KCL solution ratio—1:2.5) was determined by the potentiometric method [22], hydrolytic acidity (HAC) and total exchangeable bases (TEB) by Kappen method [20], and the following contents were determined: total organic carbon (TOC) using a Shimadzu TOC-L analyzer (Kyoto, Japan) with a solid sample module SSM-5000A [23], total nitrogen by the Kjeldahl method [24], the available forms of phosphorus and potassium by the Egner–Riehm method [25], magnesium by the Shachtschabel method [26], and sulfur by the nephelometric method according to the instructions by Bardsley and Lancaster [27], trace elements by the same method as in the soil collected after corn harvest. The cation exchange capacity (CEC) and the base saturation (BS) were calculated with formulas: CEC = TEB + HAC; BS = (TEB/CEC)·100. The study results were processed statistically using the two-factor ANOVA analysis, the principal component analysis (PCA) and by calculating the correlation coefficients and the percentage of the observed variability using the η2 coefficient by the ANOVA method using the Statistica 13 package (StatSoft, Inc., Tulsa, OK, USA) [28]. The variables were normally distributed, and the variances were homogeneous (Shapiro–Wilk test). The results were processed statistically at the level of significance of ** p ≤ 0.01, * p ≤ 0.05.

3. Results

Mineral fertilization with both potassium and nitrogen had a significant effect on the trace elements content in the soil (Table 2 and Table 3). Potassium fertilization had a stronger effect on their content in the soil in pots fertilized with a lower nitrogen dose (130 mg N/kg soil).
In the lower nitrogen dose series (130 mg N/kg soil), changes were observed in the contents of all analyzed trace elements in the soil under the influence of increasing potassium fertilization, as compared to the control pot (Table 2 and Table 3). It should be noted, however, that the trend was determined by the element type. The most unambiguous effect of potassium fertilization was observed for lead, chromium, and iron, with positive relationships observed for lead, and negative relationships for chromium and iron. Increasing potassium doses increased the lead content in the soil by up to 32% (r = 0.961) and reduced the chromium content by 10% (r = −0.928) and iron content by only 3% (r = −0.656). The cadmium content was also increased (r = 0.984). However, it should be noted that the effect of cadmium, after performing statistical calculations, appeared to be insignificant. The effects of potassium fertilization on the contents of other trace elements were less unambiguous. The first potassium dose (140 mg K2O/kg soil) increased the cobalt content (r = −0.765) and nickel (r = 0.446), and the second dose (190 mg K2O/kg soil) increased the contents of copper (r = −0.920), while higher levels of potassium fertilization reduced the amounts of these elements in the soil. Potassium fertilization had no significant effect on zinc and manganese contents in the soil in this experiment series.
In the higher nitrogen dose series (170 mg N/kg soil), the trend of changes in the contents of individual trace elements in the soil under the influence of potassium fertilization was generally analogous as in the first series of the experiment (Table 2 and Table 3). Changes in the contents of all analyzed trace elements (except cobalt) in the soil due to the effect of increasing potassium fertilization were relatively small and amounted to several percent compared to the control pot. Potassium fertilization contributed to an increase in the soil contents of cadmium by 9% (r = 0.865) and of lead by 15% (r = 0.986), and to a reduction in the content of chromium by 18% (r = −0.969) and of iron by 7% (r = −0.999). However, its effect on the cadmium content in the soil was insignificant. The effects of potassium fertilization on the contents of other trace elements were less unambiguous. Under the influence of the lowest potassium dose (140 mg K2O/kg soil), an increase was noted in the cobalt content (r = 0.066) and as a result of the effect of its subsequent dose (190 mg K2O/kg soil), an increase in the contents of nickel (r = 0.893), copper (r = −0.023), and manganese (r = −0.318). Further increasing the potassium fertilization reduced the contents of these elements in the soil. Fertilization with potassium had no significant effect on zinc content in the soil.
Nitrogen fertilization increased the contents of most trace elements in the soil (Table 2 and Table 3). The average differences from series in trace elements contents in the soil with a higher nitrogen fertilization level (170 mg N/kg soil) were as follows: zinc and iron—3%, copper—9%, manganese—12%, chromium—15%, and cobalt—59%, for pots with a lower dose of this component (130 mg N/kg soil). Moreover, nitrogen fertilization reduced the average cadmium and nickel contents by an average of 24%, and the lead content by 45%.
The performed PCA analysis (Figure 1 and Figure 2) and the calculated Pearson’s correlation coefficients (Table 4) with all results of experiment indicate significant relationships between the contents of the individual trace elements in the soil. Vector variables of the PCA analysis illustrate the accumulated effect of potassium and nitrogen fertilization on the trace elements content in the soil (Figure 1). The total correlation of the set of data for most trace elements (chromium, lead, iron, zinc, nickel, manganese, cobalt, and cadmium) amounted to 65.60% and in the second group (copper only) to 16.56%. Most vectors had a similar length, and only iron and zinc were slightly shorter, which indicates their lower significance as compared to other elements in the proportion of variability. The position of vectors indicates rather strong positive correlations between lead and nickel; between chromium, and manganese and cobalt; and weaker between chromium and zinc and iron, and between cadmium and lead. Moreover, strong negative correlations were also noted between lead and nickel versus manganese, chromium, and cobalt; and between cadmium versus cobalt and iron, while weaker correlations were noted between nickel and iron, and between cadmium and manganese. The PCA relationships between majority trace elements in soil are similar as the Pearson’s correlations showed in Table 4.
Factor 1 had a stronger effect on the content of most trace elements in soil than factor 2 (Figure 2). Potassium fertilization had a stronger effect on the content of trace elements in soil with the 130 mg N/kg than in the series with 170 mg N/kg of soil. Clear relationships were observed between potassium and nitrogen fertilization and the content of trace elements in the soil, while the dispersion of results in Figure 2 shows that higher potassium doses (190 and 240 mg K2O/kg soil) had a greater effect, particularly in pots fertilized with a lower nitrogen dose (130 mg N/kg soil).
An analysis of the percentage of the observed variability calculated using the η2 coefficient by the ANOVA method indicated that the contents of most trace elements in the soil were mostly determined by nitrogen fertilization (Figure 3). Its distribution was the highest for chromium, lead, manganese, and nickel and amounted to 49.1%, 70.1%, 76.4%, and 86.3% of the proportion of this variable, respectively. The proportion of potassium fertilization predominated in relation to the contents of iron (35.5%) and copper (44.2%). The effects of potassium and nitrogen fertilization on the cadmium and cobalt contents in the soil were similar since the percentage of the observed variability amounted to 17–18% and 35–36%, respectively. Its low values of the order of a few or several % indicate the insignificant effect of both potassium and nitrogen fertilizers on the zinc content in the soil.

4. Discussion

In multi-annual field experiments conducted by Lehoczky et al. [8], the effect of long-term application of NPK fertilizers on the availability of certain trace elements by plants in the soil was relatively insignificant, with phosphorus fertilizers having a stronger effect than nitrogen and potassium fertilizers. The strongest effect was noted for molybdenum following the application of phosphorus fertilizers. No correlations or ambiguous trends were demonstrated between the manganese and zinc contents in the soil fertilized with nitrogen and potassium. The effect of these fertilizers on the contents of other trace elements in the soil was also relatively inconsiderable. According to Richards et al. [3], the application of phosphorus fertilizers into the soil has no significant effect on the content of trace element forms available to plants. Different views are expressed by Jiao et al. [15] who claim that these are a significant source of arsenic, cadmium, and lead in cultivated fields. According to Ni and Ma [29], the content of lead and copper in nitrogen fertilizers and cadmium in potassium fertilizers in China had increased since 2003. However, it is much lower than in phosphorus and multi-component fertilizers. The nickel content in mineral fertilizers (mainly phosphorus fertilizers) was also higher than in recent years. Benson et al. [30] indicate that urea fertilizer may contain higher levels of nickel, lead, and cadmium. According to Atafar et al. [31] fertilization increases the content of cadmium and, in particular, lead in the soil. Despite an occasionally significant increase noted in the trace element contents in the soil following the application of NPK fertilizers, the proportion of forms available to plants of, for example, cadmium, zinc, manganese and iron, decreases with an increase in the pH of the soil [11]. Increased NPK fertilization increases the content of copper and zinc in soils [9,32]. In the studies of Mazur and Mazur [33], long-term use of mineral fertilizers increased the content of trace elements in soils, especially copper, lead, and nickel. Uprety et al. [34] also noted that as a result of NPK fertilization, the content of chromium, copper, nickel, lead, and zinc in the soil increased. However, the content of these elements was below the acceptable legislation limits. Czarnecki and Düring [35] showed that after several years of using various mineral fertilizers (N, P, NP, and NPK), the total content and mobile forms of cadmium, lead, copper, zinc, and manganese in the soil increased. Fertilization with nitrogen as well as other fertilizers often decreases the soil pH, which results in an increase in the mobility of many trace elements, e.g., zinc, copper, manganese, and iron [36,37]. Analogously, a study by Singh et al. [38] also observed an increase in the mobility of copper and manganese. Li et al. [39] also noted an increase in the content of trace element forms available to plants in fertilized pots with NPK. By applying calcium fertilizers in a competent manner, trace elements uptake by plants can be regulated and limited [37]. Therefore, the availability of trace elements to plants does not have to be strictly correlated with their total amounts introduced into the soil with classic mineral, nitrogen, potassium, or phosphorus fertilizers [11].
The proper supply of plants with the necessary nutrients is determined by antagonistic and synergistic relationships between elements [40]. Antagonisms are noted mainly between cations such as potassium, copper, iron, manganese, and zinc, and synergism between potassium and copper, which was partially confirmed in the authors’ own study. Moreover, antagonism is frequently observed between nitrogen and manganese and iron and synergism between nitrogen and copper and, occasionally, iron. Mazur and Mazur [33] demonstrated a positive correlation between manganese and cadmium and nickel, and also between cadmium and nickel and lead, and between zinc and lead in soils after the application of mineral fertilization. Therefore, the application of mineral fertilizers into the soil may determine the decrease or increase in the uptake of other elements by plants. An experiment by Pogrzeba et al. [2] shows that fertilization with nitrogen, phosphorus, and potassium increased the uptake of zinc and certain macronutrients by plants. In the research of Rutkowska et al. [41] nitrogen fertilization increased the content of iron, manganese, zinc, and copper and decreased the concentration of molybdenum in the soil. In an experiment by Symanowicz et al. [42], nitrogen fertilization significantly contributed to a reduction in chromium, copper, and zinc contents, and insignificantly contributed to cadmium accumulation and an increase in lead accumulation in the soil. The cadmium and lead contents, however, increased in the next year of the study. Rutkowska et al. [41] did not show a significant effect of potassium fertilization on the concentration of microelements in the soil.
Knowledge of antagonisms and synergisms is useful in estimating the amounts of fertilizers used in crop fertilization [40].
In summary, it can be concluded that nitrogen and potassium fertilizers can provide an additional source of trace elements in soils. In general, however, the increase in their content is relatively inconsiderable. The authors’ own study noted no permissible standards for the soil used for agricultural purposes [43] to be exceeded for any of the elements under study.

5. Conclusions

Potassium and nitrogen fertilization had a significant effect on the development of the trace elements content in the soil. Potassium fertilization had a more significant effect on trace elements content in the soil fertilized at the same time with a lower nitrogen dose (130 mg N/kg soil).
Increasing potassium fertilization increased the cadmium and lead contents and reduced the amounts of chromium and iron in the soil, particularly in the series with a lower nitrogen dose (130 mg N/kg soil). The effect of potassium fertilization on the content of other trace elements was less unambiguous since, for most of trace elements, lower doses of this fertilizer contributed to growth, while higher doses lead to a decrease in their accumulation in the soil.
Nitrogen fertilization increased the contents of zinc, iron, copper, manganese, chromium, and cobalt, while reducing the contents of cadmium, nickel, and lead.
Following the performance of PCA analysis and the calculation of Pearson’s correlation coefficients, the significance of the correlation between the contents of certain trace elements in the soil was statistically proven.
However, the increase in the contents of certain studied trace elements in the soil under the influence of nitrogen and potassium fertilization was so small that no permissible standards for trace elements content in the soil were demonstrated to have been exceeded.
The use of classic fertilizers in doses recommended for plants does not cause a risk of introducing excessive amounts of trace elements into the soil. This is important information from the point of view of the quality of plants grown in soils fertilized with nitrogen and potassium fertilizers.

Author Contributions

Conceptualization, M.S.B.; methodology, M.S.B.; analysis, M.W.; writing—review and editing, M.W. and M.S.B.; M.S.B., corresponding author. All authors contributed significantly to the discussion of the results and the preparation of the manuscript. All authors have read and agreed to the published version of the manuscript.

Funding

The project was financed by the University of Warmia and Mazury in Olsztyn (Poland) as part of the topic No. 20.610.003-110.

Conflicts of Interest

The authors declare no conflict of interest. The funders had no role in the design of the study; in the collection, analyses, or interpretation of data; in the writing of the manuscript, or in the decision to publish the results.

References

  1. Steffen, W.; Richardson, K.; Rockström, J.; Cornell, S.E.; Fetzer, I.; Bennett, E.M.; Biggs, R.; Carpenter, S.R.; De Vries, W.; De Wit, C.A.; et al. Planetary boundaries: Guiding human development on a changing planet. Science 2015, 347, 6223. [Google Scholar] [CrossRef] [Green Version]
  2. Pogrzeba, M.; Rusinowski, S.Z.; Sitko, K.; Krzyżak, J.; Skalska, A.; Małkowski, E.; Ciszek, D.; Werle, S.; McCalmont, J.P.; Mos, M.; et al. Relationships between soil parameters and physiological status of Miscanthus x giganteus cultivated on soil contaminated with trace elements under NPK fertilisation vs. microbial inoculation. Environ. Pollut. 2017, 225, 163–174. [Google Scholar] [CrossRef] [PubMed]
  3. Richards, J.R.; Zhang, H.; Schroder, J.L.; Hattey, J.A.; Raun, W.R.; Payton, M.E. Micronutrient availability as affected by the long-term application of phosphorus fertilizer and organic amendments. Soil Fertil. Plant Nutr. 2011, 75, 927–939. [Google Scholar] [CrossRef]
  4. Belon, E.; Boisson, M.; Deportes, I.Z.; Eglin, T.K.; Feix, I.; Bispo, A.O.; Galsomies, L.; Leblond, S.; Guellier, C.R. An inventory of trace elements inputs to French agricultural soils. Sci. Total Environ. 2012, 439, 87–95. [Google Scholar] [CrossRef] [PubMed]
  5. Latifi, Z.; Jalali, M. Trace element contaminants in mineral fertilizers used in Iran. Environ. Sci. Pollut. Res. 2018, 25, 31917–31928. [Google Scholar] [CrossRef] [PubMed]
  6. Mortvedt, J.J. Heavy metal contaminants in inorganic and organic fertilizers. Fert. Res. 1995, 43, 55–61. [Google Scholar] [CrossRef]
  7. Soriano-Disla, J.M.; Gómez, I.; Navarro-Pedreño, J.; Lag-Brotons, A. Evaluation of single chemical extractants for the prediction of heavy metal uptake by barley in soils amended with polluted sewage sludge. Plant Soil 2010, 327, 303–314. [Google Scholar] [CrossRef]
  8. Lehoczky, É.; Debreczeni, K.; Szalai, T. Available micronutrient contents of soils in long-term fertilization experiments in Hungary. Commun. Soil Sci. Plant Anal. 2005, 36, 423–430. [Google Scholar] [CrossRef]
  9. Kabata-Pendias, A. Trace Elements in Soils and Plants, 4th ed.; CRC Press: Boca Raton, FL, USA, 2011; p. 403. Available online: http://base.dnsgb.com.ua/files/book/Agriculture/Soil/Trace-Elements-in-Soils-and-Plants.pdf (accessed on 20 July 2020).
  10. Gray, C.; McLaren, R.; Roberts, A.; Condron, L.M. The effect of long-term phosphatic fertiliser applications on the amounts and forms of cadmium in soils under pasture in New Zealand. Nutr. Cycl. Agroecosyst. 1999, 54, 267–277. [Google Scholar] [CrossRef]
  11. Hejcman, M.; Szaková, J.; Schellberg, J.; Šrek, P.; Tlustoš, P. The Rengen Grassland Experiment: Soil contamination by trace elements after 65 years of Ca, N, P and K fertiliser application. Nutr. Cycl. Agroecosyst. 2009, 83, 39–50. [Google Scholar] [CrossRef]
  12. Losak, T.; Hlusek, J.; Martinec, J.; Jandak, J.; Szostkova, M.; Filipcik, R.; Manasek, J.; Prokes, K.; Peterka, J.; Varga, L.; et al. Nitrogen fertilization does not affect micronutrient uptake in grain maize (Zea mays L.). Acta Agric. Scand. B Soil Plant Sci. 2011, 61, 543–550. [Google Scholar] [CrossRef]
  13. Husted, S.; Thomsen, M.U.; Mattsson, M.; Schjoerring, J. Influence of nitrogen and sulphur form on manganese acquisition by barley (Hordeum vulgare). Plant Soil 2005, 268, 309–317. [Google Scholar] [CrossRef]
  14. Lorenz, S.E.; Hamon, R.E.; Mcgrath, S.P.; Holm, P.E.; Christensen, T.H. Applications of fertilizer cations affect cadmium and zinc concentrations in soil solutions and uptake by plants. Eur. J. Soil Sci. 1994, 45, 159–165. [Google Scholar] [CrossRef]
  15. Jiao, W.; Chen, W.; Chang, A.C.; Page, A.L. Environmental risks of trace elements associated with long-term phosphate fertilizers applications: A review. Environ. Pollut. 2012, 168, 44–53. [Google Scholar] [CrossRef]
  16. Nagajyoti, P.C.; Lee, K.D.; Sreekanth, T.V.M. Heavy metals, occurrence and toxicity for plants: A review. Environ. Chem. Lett. 2010, 8, 199–216. [Google Scholar] [CrossRef]
  17. IUSS Working Group WRB. World Reference base for soil resources. In International Soil Classification System for Naming Soils and Creating Legends for Soil Maps; WRB: London, UK, 2014; Volume 106, p. 182. [Google Scholar]
  18. Regulation (EC) No 2003/2003 of the European Parliament and of the Council of 13 October 2003 relating to fertilizers. Off. J. L 2003, 304, 1–194.
  19. US-EPA Method 3051A. Microwave Assisted Acid Digestion of Sediment, Sludges, Soils and Oils; Office of Solid Waste and Emergency Response, United States Government Printing Office: Washington, DC, USA, 2007; p. 30. Available online: https://www.epa.gov/sites/production/files/2015-12/documents/3051a.pdf (accessed on 23 July 2020).
  20. Ostrowska, A.; Gawliński, S.; Szczubiałka, Z. Methods for Analysis and Evaluation of Soil and Plant Properties; IOŚ: Warszawa, Poland, 1991; pp. 1–334. (In Polish) [Google Scholar]
  21. PN-R-04032. Soil and Mineral Materials—Sampling and Determination of Particle Size Distribution; Polish Committee for Standardization: Warszawa, Poland, 1998. [Google Scholar]
  22. ISO 10390. Soil Quality—Determination of Ph; International Organization for Standardization: Geneva, Switzerland, 2005. [Google Scholar]
  23. Shimadzu, C. Shimadzu Analytical and Measuring Instruments. Shimadzu Corporation, Japan. 2019. Available online: https://solutions.shimadzu.co.jp/an/n/en/etc/jpz19014.pdf?_ga=2.50821161.1231336941.1597769507-1298426863.1597769507 (accessed on 18 August 2020).
  24. ISO 11261. Soil Quality—Determination of Total Nitrogen—Modified Kjeldahl Method; International Organization for Standardization: Geneva, Switzerland, 1995. [Google Scholar]
  25. Egner, H.; Riehm, H.; Domingo, W.R. Untersuchun-gen über die chemische Bodenanalyse als Grundlage für die Beurteilung des Nährstoffzustandes der Böden. II. Chemische Extractionsmethoden zur Phospor- und Kaliumbestimmung. Ann. R. Agric. Coll. Sweden 1960, 26, 199–215. [Google Scholar]
  26. Schlichting, E.; Blume, H.P.; Stahr, K. Bodenkundliches Praktikum; Pareys Studientexte 81; Blackwell Wissenschafts-Verlag: Berlin, Germany, 1995; p. 81. [Google Scholar]
  27. Boratyński, K.; Grom, A.; Ziętecka, M. Research on the content of sulfur in soil. Part I. Rocz. Gleboz. 1975, 3, 121–139. [Google Scholar]
  28. Dell Inc. Dell Statistica (Data Analysis Software System), Version 13. 2016. Available online: http://software.dell.com (accessed on 24 July 2020).
  29. Ni, R.; Ma, Y. Current inventory and changes of the input/output balance of trace elements in farmland across China. PLoS ONE 2018, 13, e0199460. [Google Scholar] [CrossRef] [Green Version]
  30. Benson, N.U.; Anake, W.U.; Etesin, U.M. Trace metals levels in inorganic fertilizers commercially available in Nigeria. J. Sci. Res. Rep. 2014, 3, 610–620. [Google Scholar] [CrossRef]
  31. Atafar, Z.; Mesdaghinia, A.; Nouri, J.; Homaee, M.; Yunesian, M.; Ahmadimoghaddam, M.; Mahvi, A.H. Effect of fertilizer application on soil heavy metal concentration. Environ. Monit. Assess. 2010, 160, 83–89. [Google Scholar] [CrossRef] [PubMed]
  32. Huang, S.; Jin, J. Status of heavy metals in agricultural soils as affected by different patterns of land use. Environ. Monit. Assess. 2008, 139, 317. [Google Scholar] [CrossRef] [PubMed]
  33. Mazur, Z.; Mazur, T. The influence of long-term fertilization with slurry, manure and NPK on the soil content of trace elements. J. Elem. 2016, 21, 131–139. [Google Scholar] [CrossRef]
  34. Uprety, D.; Hejcman, M.; Száková, J.; Kunzová, E.; Tlustoš, P. Concentration of trace elements in arable soil after long-term application of organic and inorganic fertilizers. Nutr. Cycl. Agroecosyst. 2009, 85, 241–252. [Google Scholar] [CrossRef]
  35. Czarnecki, S.; Düring, R.A. Influence of long-term mineral fertilization on metal contents and properties of soil samples taken from different locations in Hesse, Germany. Soil 2015, 1, 23–33. [Google Scholar] [CrossRef] [Green Version]
  36. Fan, J.; Ding, W.; Chen, Z.; Ziadi, N. Thirty-year amendment of horse manure and chemical fertilizer on the availability of micronutrients at the aggregate scale in black soil. Environ. Sci. Pollut. Res. 2011, 19, 2745–2754. [Google Scholar] [CrossRef]
  37. Rutkowska, B.; Szulc, W.; Sosulski, T.; Stępień, W. Soil micronutrient availability to crops affected by long-term inorganic and organic fertilizer applications. Plant Soil Environ. 2014, 60, 198–203. [Google Scholar] [CrossRef]
  38. Singh, A.; Agrawal, M.; Marshall, F.M. The role of organic vs. inorganic fertilizers in reducing phytoavailability of heavy metals in a wastewater-irrigated area. Ecol. Eng. 2010, 36, 1733–1740. [Google Scholar] [CrossRef]
  39. Li, B.Y.; Zhou, D.M.; Cang, L.; Zhang, H.L.; Fan, X.H.; Qin, S.W. Soil micronutrient availability to crops as affected by long-term inorganic and organic fertilizer applications. Soil Tillage Res. 2007, 96, 166–173. [Google Scholar] [CrossRef]
  40. René, P.J.; Rietra, J.; Heinen, M.; Dimkpa, C.O.; Bindraban, P.S. Effects of nutrient antagonism and synergism on yield and fertilizer use efficiency. Commun. Soil Sci. Plant Anal. 2017, 48, 1895–1920. [Google Scholar] [CrossRef] [Green Version]
  41. Rutkowska, B.; Szulc, W.; Łabętowicz, J. Influence of soil fertilization on concentration of microelements in soil solution of sandy soil. J. Elem. 2009, 14, 349–355. [Google Scholar] [CrossRef]
  42. Symanowicz, B.; Kalembasa, S.; Jaremko, D.; Niedbała, M. Effect of nitrogen application and year on concentration of Cu, Zn, Ni, Cr, Pb and Cd in herbage of Galega orientalis Lam. Plant Soil Environ. 2015, 61, 11–16. [Google Scholar] [CrossRef] [Green Version]
  43. Regulation. Regulation of Minister of the Environment of 1 September 2016 on the procedures for the assessment of land surface contamination. J. Laws 2016, 1395. [Google Scholar]
Figure 1. Content of trace elements in soil illustrated with the PCA method. Key: vectors represent analyzed variable (content of Cd, Pb, Cr, Co, Ni, Zn, Cu, Mn, and Fe).
Agriculture 10 00398 g001
Figure 2. Effect of N and K fertilization on content of trace elements in soil illustrated with the PCA method. Key: points show soil samples with trace elements (N 130—130 mg N/kg, N 170—170 mg N/kg; K0—0 mg K/kg, K140—140 mg K/kg, K190—190 mg K/kg, K240—240 mg/kg of soil).
Agriculture 10 00398 g002
Figure 3. Per cent contribution of variable factors according to the content of trace elements in soil: N—Nitrogen dose, K—Potassium dose.
Agriculture 10 00398 g003
Table 1. Properties of soil.
ParameterSoil
Granulometric compositionsand
Sand > 0.05 mm (%)90.28
Silt 0.002–0.05 mm (%)7.86
Clay < 0.002 mm (%)1.86
pH value in 1 M KCl/dm36.02
Hydrolytic acidity—HAC (mM(+)/kg DM)16.00
Total exchangeable bases—TEB (mM(+)/kg DM)41,25
Cation exchange capacity—CEC (mM(+)/kg DM)57.75
Base saturation—BS (%)71.43
Total organic carbon—TOC (g/kg DM)3.304
Total nitrogen (g/kg DM)0.620
Available phosphorus (mg P/kg DM)14.20
Available potassium (mg K/kg DM)98.00
Available magnesium (mg Mg/kg DM)38.56
Sulphur (mg S-SO4/kg DM)18.56
Cadmium (mg Cd/kg DM)0.142
Lead (mg Pb/kg DM)13.12
Chromium (mg Cr/kg DM)58.65
Cobalt (mg Co/kg DM)5.741
Nickel (mg Ni/kg DM)16.31
Copper (mg Cu/kg DM)4.142
Zinc (mg Zn/kg DM) 32.78
Manganese (mg Mn/kg DM)143.6
Iron (mg Fe/kg DM)11,209
DM—dry matter.
Table 2. Content of cadmium (Cd), lead (Pb), chromium (Cr), and cobalt (Co) in soil (mg/kg DM).
K Dose in mg/kg of SoilContent of Trace Elements in mg/kg DM
CdPbCrCo
130 mg N/kg of soil
00.12113.4356.964.966
1400.19617.1755.685.360
1900.20817.3653.451.796
2400.22117.7951.471.710
Average0.18716.4454.393.458
r0.984 **0.961 **−0.928 **−0.765 **
170 mg N/kg of soil
00.1388.3971.214.995
1400.1428.9860.686.465
1900.1429.2460.435.773
2400.1509.6758.284.813
Average0.1439.0762.655.512
r0.865 **0.986 **−0.969 **0.066
Average
00.13010.9164.094.981
1400.16913.0858.185.913
1900.17513.3056.943.785
2400.18613.7354.883.262
Average0.16512.7558.524.485
r0.991 **0.981 **−0.997 **−0.613 *
LSD for:
N dosen.s.3.32 **2.76 **0.808 **
K dosen.s.n.s.3.90 **1.143 **
interactionn.s.n.s.5.51 *1.616 **
LSD (least squares deviation); significant for: ** p ≤ 0.01, * p ≤ 0.05, n.s. non-significant; r—correlation coefficient; DM—dry matter.
Table 3. Content of nickel (Ni), zinc (Zn), copper (Cu), manganese (Mn), and iron (Fe) in soil (mg/kg DM).
K Dose in mg/kg of SoilContent of Trace Elements in mg/kg DM
NiZnCuMnFe
130 mg N/kg of soil
015.6331.653.905140.411063
14017.0430.425.281140.311125
19016.3131.096.496140.011003
24016.1631.405.956138.110686
Average16.2931.145.410139.710969
r0.446−0.2900.920 **−0.725 **−0.656 *
170 mg N/kg of soil
011.2332.565.779157.911726
14012.3732.185.936157.911266
19013.0531.506.398164.011129
24012.5632.395.453148.410942
Average12.3032.165.892157.111266
r0.893 **−0.457−0.023−0.318−0.999 **
Average
013.4332.114.842149.211395
14014.7131.305.609149.111196
19014.6831.306.447152.011066
24014.3631.905.705143.310814
Average14.2931.655.651148.411118
r0.793 **−0.4430.778 **−0.386−0.950 **
LSD for:
N dose0.86 **n.s.n.s.4.4 **353 *
K dose1.22 **n.s.0.879 **6.2 **499 *
interaction1.73 *n.s.1.242 *8.8 *n.s.
LSD (least squares deviation); significant for: ** p ≥ 0.01, * p ≥ 0.05, n.s. non-significant; r—correlation coefficient; DM—dry matter.
Table 4. Pearson’s correlation coefficients (r) between content of trace elements in soil.
FactorContent of Trace Elements in Soil
CdPbCrCoNiZnCuMn
Pb0.543 **
Cr−0.287−0.611 **
Co−0.562 **−0.622 **0.507 **
Ni0.3540.868 **−0.795 **−0.535 **
Zn−0.059−0.1780.376−0.008−0.291
Cu0.290−0.0220.032−0.200−0.1920.079
Mn−0.479 * −0.689 **0.695 **0.602 **−0.767 **0.2910.287
Fe−0.567 **−0.3060.707 **0.414 *−0.428 * 0.1950.0180.561 **
Significant at ** p ≥ 0.01 * p ≥ 0.05; r—correlation coefficient.

