Article

Soil Quality of Ananas comosus Cultivation Land in the Papaloapan Basin Region of Mexico after Wastes Addition as Fertilizer Supplement

by
Ricardo Acevedo-Gómez
1,2,
Miguel Angel Sánchez-Hernández
2,
Fernando Carlos Gómez-Merino
3,
Patricia Ponce-Peña
4,
María Azucena González-Lozano
4,
Leticia Navarro-Moreno
5 and
Martha Poisot
5,*
1
División de Estudios de Posgrado, Universidad del Papaloapan, Circuito Central 200, Tuxtepec, Oaxaca 68301, Mexico
2
Instituto de Agro-Ingeniería, Universidad del Papaloapan, Avenida Ferrocarril S/N, Loma Bonita, Oaxaca 68400, Mexico
3
College of Postgraduates in Agricultural Sciences, Carretera México-Texcoco km 36.5, Montecillo, Texcoco 56230, Mexico
4
Facultad de Ciencias Químicas, Universidad Juárez del Estado de Durango, Avenida Veterinaria s/n, Durango, Durango 34120, Mexico
5
Instituto de Química Aplicada, Universidad del Papaloapan, Circuito Central 200, Tuxtepec, Oaxaca 68301, Mexico
*
Author to whom correspondence should be addressed.
Agriculture 2020, 10(5), 173; https://doi.org/10.3390/agriculture10050173
Submission received: 30 March 2020 / Revised: 28 April 2020 / Accepted: 6 May 2020 / Published: 15 May 2020
(This article belongs to the Section Agricultural Soils)

Abstract

:
Three pineapple (Ananas comosus L.) cultivation soils of the south-east Mexico were analyzed in relation to the amendment effect of two agro-industrial wastes: sugar mill filter cake (SC) and paper mill sludge (CR) jointly added by weight. The plot P50 was cultivated with only chemical fertilizer, P51 was lying fallow with only wastes added, and P52 was cultivated and fertilized by both ways. After 14 months the soils were analyzed again. The plots texture was found to be sandy loam whose organic matter widely increased, and the pH shifted from acidic to rather neutral. Low concentrations of N, P, and K were found in CR, although its content of Ca2+ and Mg2+ was high, while the SC contained P, N, and K in higher amounts than CR. Initially, the plots showed a low level of N, P, and K, in the specific case of P51 values clearly increased up to 522%, 190%, and 204%, respectively, due to the synergy effect of CR and SC combined as soil amendment. The cation exchange capacity (CEC) changed only in P51, increased 11.8%, but in the other two plots CEC did not change significantly.

1. Introduction

Agricultural soils whose productive capacity may be reduced could be defined as deteriorated or degraded soils. Such a problem results from various physical, chemical, and biological processes, that often come from human activities, such as compaction, erosion, acidification, leaching, decreasing of cationic exchange capacity, scarcity of nutrients, and biodiversity depletion [1]. The extraction and demand for mineral fertilizers for food production continues to rise, the demand for phosphorus fertilizers is expected to increase 24 times the 2000 level by the year 2050 [2], and we should keep in mind that phosphorus rock is a non-renewable key raw material.
The use of chemical fertilization in the soil clearly needs to evolve to nutrient recycling, recovery, and reuse. This trend has been already implemented by the European Commission that has updated the European Union critical raw materials list including phosphorus to stimulate the development of processes to upcycle phosphorus from secondary raw resources contributing to the Nutrient Circular Economy [3].
In order to correct soil environmental impoverishment, the organic matter sources commonly used are agricultural wastes, garden and kitchen residues, municipal solid wastes, and sludge from industrial processes or by-products [4]. The effect of the sugarcane industry wastes like filter cake and bagasse ash on the productivity of wheat in acid soils of Central Ethiopia was reported recently, indicating that such agro-industrial wastes are good sources of nutrients [5].
On the other hand, the use of cellulose and cellulose derivatives as slow-release fertilizer can be synchronized with plant uptake achieving soil nitrification and denitrification rates that would decrease losses of nitrogen soil concentration and environmental impact on greenhouse gas emissions. The slow release of nutrients from fertilizer can also reduce operational costs [6].
Excellent results have been obtained by developing root-targeted delivery vehicles (RTD) of fertilizers such as carboxymethyl cellulose. This vehicle may be cross-linked while mixed with liquid fertilizer to evaluate efficiency on wheat growing in nutrient depleted media [7].
Such previous works allow us to propose that adding mixtures of both selected agro-industrial residues, CR being the short fiber cellulose rejected in the paper recycling process that contains inks also and SC being the final filter cake of the sugar mill process, to the regional Ananas comosus farming land will optimize the agricultural production.
The addition of these agroindustrial residues will avoid the use of primary source soil enrichers like minerals, in order to probe the effectiveness of secondary raw resources in conservation practices.
Admixtures of both sugar mill filter cake and sludge from the recycling paper mill were used for the first time in combination as soil amendment and chemical fertilizers supplement. The purpose of this work is to examine the effect of introducing joined amendments, CR and SC, on chemical and nutrient availability 14 months after the surface application to representative pineapple farming lands of the Papaloapan lower basin region of Mexico.
The effect of such soil amendment on the pineapple plant development and fruit yield is the second part of this work that it is still in progress.

2. Materials and Methods

2.1. Cultivation Fields Selected

The Ananas comosus cultivation fields chosen are located in Loma Bonita Oaxaca county, south-east Mexico, with geographical coordinates determined by GPS Garmin GPSMAP 60CSx north latitude of 18°02′55.7″ and western length of 95°51′32″. The altitude of 46 m above sea level allows the accumulation of rain, 1845–2000 mm, facilitating high concentration of humidity and heat providing ideal conditions for microorganisms’ proliferation.
Farming lands were chosen due to long time of pineapple cultivation delivering lately unsatisfactory crops for the owners. Such fields were kept uncultivated for two years before this study began. The farming lands were distributed into three plots: the first (P50) of 1800 m2 size shows a flat sloping surface and is characterized by the use of only chemical fertilizer for pineapple cultivation. The second plot (P51) of 8438 m2 size shows a slope of 1.5° south to north, good slope for runoff hindering roots rotting; in contrast to P50 and P52 this plot was uncultivated and received only the combination of CR and SC as fertilization. The third plot (P52) of 5818 m2 size shows a slope of 6° southeast to northwest with moderate capacity of runoff and characterized by the use of both fertilization ways, chemical fertilizer and the combination of CR and SC for pineapple cultivation too. The plot figure of P52 can be found as Supplementary Materials.

2.2. Soil Samples

Sampling of soils followed the cross-type sampling technique by measuring the plots length and width under rectangle geometry. A soil sample was extracted with Euger device in 17 equally distant points, each measuring 30 cm depth and 10 cm diameter, forming a rectangular figure. The figure of soil sampling can be found as Supplementary Materials.
All the soil samples collected in every plot were carefully mixed and joined in a single composite sample per plot for the posterior laboratory analyses. Each plot final sample of 5 kg was obtained according to the standard procedure, NOM-021-SEMARNAT [8] and stored in glass jar at 4 °C according to the national standard procedure [9].

2.3. Soil Analyses

Each plot corresponding sample was separately sieved through 2 mm mesh, then finely ground for posterior analyses by triplicate according to the following standard methods.
Moisture percentage (MT) was determined with a Termobalance Shimadzu MOC-120H. Field capacity percentage (FC) was calculated by a gravimetric method based on the difference in weight between moist and dry soil, according to NOM-021-RECNAT-2000, AS-05 [10]. The wilting point (WP) was determined following the porous plate method as previously reported [11]. The electrical conductivity (EC) was measured by a conductivity meter Hanna HI 8033 in the distilled water saturation extract of soil, water:soil 5:1, according to the procedure of NOM-021-RECNAT-2000, AS-18 [10].
Bulk density (BD) was determined by the paraffin clod method according to NOM-021-RECNAT-2000, AS-03, measuring 10 samples [10]. The pH was measured in deionized water at water:soil ratio of 10:1 by potentiometric method with a glass electrode 6175 Jenco Vision device according to NOM-021-RECNAT-2000, AS-02 [10].
The content of total nitrogen was determined by Microkjeldahl equipment. Available phosphorus was determined by extraction with sodium bicarbonate and quantified colorimetrically with a Thermo scientific spectronic 200, following Olsen and Sommers [12]. The total micronutrient of boron was extracted with a mixture of nitric acid and hydrochloric acid in a molar ratio of 3:1, and quantified with the above mentioned instrument.
The exchangeable ions of K+, Mg2+, and Ca2+ were extracted with ammonium acetate and quantified by optical emission spectroscopy with inductive coupled plasma (ICP–OES) by PerkinElmer Optima 7000 DV instrument following the 7000 A EPA method. The ions Mn2+, Fe2+,3+, Cu2+, and Zn2+ were extracted in the same way as B but determined by ICP-OES too.
The total organic carbon (TOC) and organic matter (OM) were quantified by dichromate oxidation according to the Walkley and Black method [13]. The soil texture was analyzed in percentage using the densimeter method of Bouyoucos, and classified according to the textural triangle of the official methods of soil analysis [14].
The C:N ratio was calculated according to the TOC amount as reported by the association of official agricultural chemists [15]. Cation exchange capacity (CEC) was determined after calculation from the ammonium acetate centrifugation amount according to the method described in NOM-021-RECNAT-2000, AS-12 [10]. The data is reported at time zero (t0) in November of 2012 when the plots and the combination of agroindustrial wastes were not yet mixed and at the final time (tf) of 14 months after soil amendment.

2.4. Industrial By-Products

Paper mill sludge, the residue obtained in the paper recycling process, has a liming property, since calcium carbonate is present in bond paper giving whiteness and brilliance. This specific waste, named CR from cellulose rejected, has an average calcium carbonate content of nearly 50% besides variable content of ink residuals from printing, providing then an abundance of carbon as organic matter, 39.71% and, high C:N ratio of 63% (see Table 1).
The sugar mill filter cake named SC, is the final solid residue after sugarcane juice thorough filtration, very similar to soil in appearance. It is a rich source of phosphorus, 75 mg·kg−1, nitrogen with 77 mg·kg−1, and potassium with 41 mg·kg−1 enabling it to be used as a supplement of mineral fertilizer in sugar cane cultivation [16]. The chemical composition and physical features of both wastes can be found in Table 1.
The industrial wastes used in these experiments were kindly donated, SC by the Adolfo López Mateos sugar mill, and CR by the paper recycling mill of BioPAPPEL. Both production plants are located in Tuxtepec, Oaxaca, just 55 km away from the farming lands. Wastes samples were used immediately after reception on field and no further treatment was applied, in order to prepare the experiment admixtures, but storage for analysis followed the same method applied above and the same analyses applied to soil samples. The relevance of this industrial by-products’ chemical composition will be clear in the results and discussion section.

2.5. Field Application of the Amendments

Every plot was prepared by tilling with heavy harrow three times every 4 months. The Ananas comosus L. MD2 plants were planted 0.25 m apart from each other at the age of 4 months, average weight of 350 g per plant, with 0.70 m between furrows. The culture density was 60,000 plants ha−1. Most of the fertilization (75%) was applied solid, while the rest was applied diluted in water on foliar treatment during the period of drought, May–September, every 30 days.
The plot irrigation at the beginning of this study was of 20,000 L·ha−1 applied by the spray boom system keeping in mind 15% of field capacity per hectare in order to maintain humidity and temperature that would further spread cellulolytic fungi releasing the nitrogen contained in the paper inks. No further water irrigation was supplied.
The determination of macro and micronutrients content of the plots was useful to calculate the by-products to be added per hectare for reaching good fruit yield (width, length, and weight of fruit) and soil enrichment. The mixture of wastes was supplied as supplement to commercial fertilizer, where it is indicated, based on weight percentage of N, phosphorous pentoxide (P2O5), potassium oxide (K2O), Ca2+ and Mg2+, in order to reach the C:N:P:K:Mg ratio of 100:12:8:12:4 according to the literature for pineapple plants. The required amount of nutrient was calculated following the adapted equation [17]:
E tfE t0 = E needed,
where E can be: C, N, P, K+ or Mg2+; while
TOC plot + TOC c R + TOC s C = 100,
The commercial fertilizers, urea (NH2CONH2), diammonium phosphate or DAP ((NH4)2HPO4), potassium sulphate (K2SO4), and magnesium sulphate (MgSO4) were added to plots P51 and P52, in contrast P50 was supplied only with commercial fertilizers. Urea was supplied in several applications to reach 48 kg·ha−1: three applications of 12 kg·ha−1 followed by five applications of 2.4 kg diluted in 200 L of water. A total of 120 kg·ha−1 of DAP was supplied: three applications of 30 kg·ha−1 and five more applications of 6 kg·ha−1 diluted in 200 L of water. K+ was supplied by K2SO4 for a total amount of 96 kg·ha−1 in three applications of 24 kg·ha−1, and five more applications of 4.8 kg·ha−1 diluted in 200 L of water. Magnesium sulphate (MgSO4) was supplied in three applications of 14 kg·ha−1 and five more applications of 2.8 kg·ha−1 diluted in 200 L of water, delivering a total of 56 kg·ha−1 of Mg2+.

2.6. Experiments and Statistical Analysis

The experiment is based on three study factors: chemical fertilizer (CF), cultivated plot (CP), and the combination of CR and SC (AF), where AF is amendment fertilizer, under two levels, present (+) or absent (-). We can assume the experiment as: P50 = CF+/CP+/AF-, P51 = CF-/CP-/AF+, and P52 = CF+/CP+/AF+ evaluated at initial and final states for the soils.
This study was not applied on random plots of every experimental field instead into the whole cultivation field separately of each other. The aim of this experiment was to study how soil characteristics evolve with time, under the applied treatments in the climatic conditions of the Papaloapan region of Mexico.
Statistical data analysis was performed with Statistical Analysis System for Windows 9 [18]. Data is displayed in the corresponding table with ± as standard deviation of three replicate analysis of the same composite sample per plot at initial, t0, and final time, tf, of this study for the soils while the by-products were analyzed just at initial time. Means and least significant difference were also calculated (LSD test, p ≤ 0.05).

3. Results and Discussion

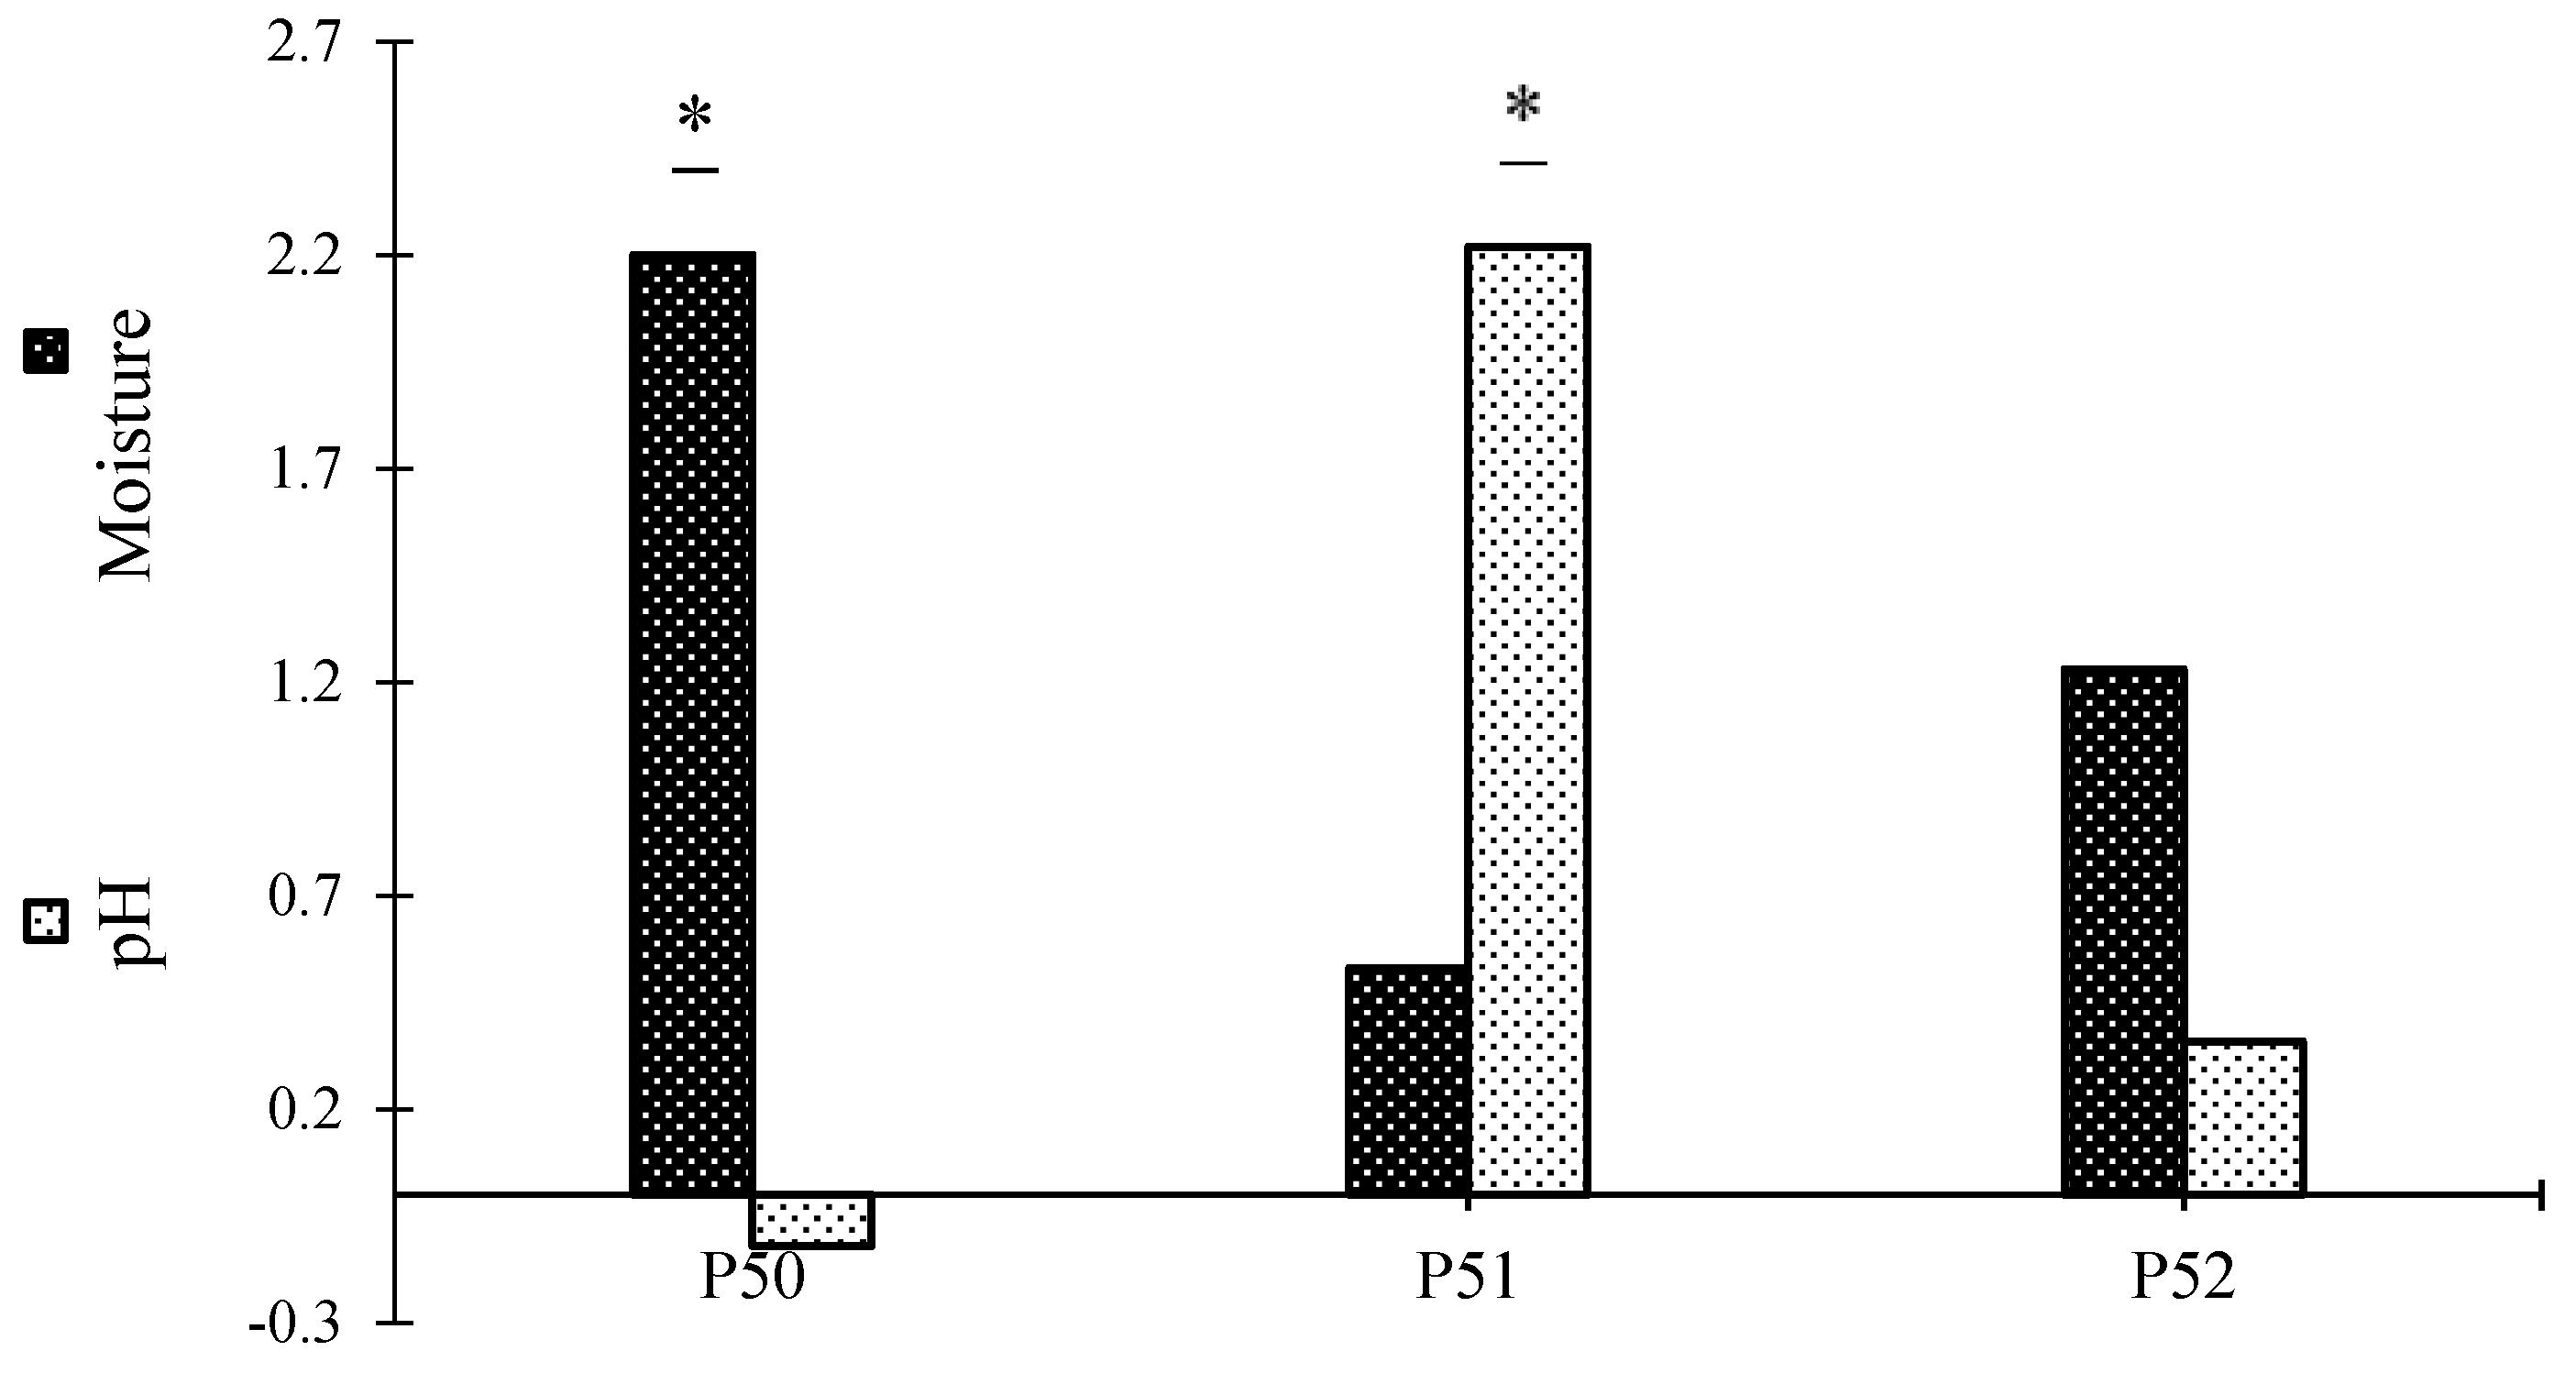
3.1. Effect of the Amendments on Soil Physical Properties

At this study initial time the textural class of the soil composite sample per plot was found to be sandy-loam according to the textural triangle of the official methods of soil analysis [14], naming clay (Cy), silt (St), and sand (Sd) content in weight percent.
After 14 months treatment the data registered in Table 2 shows that the cultivation fields were affected in several ways. The soils just slightly shifted characteristics, P50 increased its content of sand by more than 17%, but the silt content decreased 12% while clay remained almost the same. P51 increased the sand content by only 7.5% but the clay content diminished, 9.3%, while silt content was nearly the same. The lowest increase of sand belongs to P52 with only 1.4%, while the clay content decreased by nearly 5% and silt content increased only by 3.4%.
The sand content of each plot increased due to the effect of silicon dioxide content, 9–20% of dry filter cake, SC, as reported previously [19]. However, the sand content is clearly high in P50, since fertilizer and wastes were added to that plot, while P51 shows medium content of sand, since only wastes were added remaining uncultivated. The trend continues with P52 containing the lowest sand concentration due to cultivation in contrast to P51.
Such industrial by-products worked as soil conditioners since the porosity is expected to increase allowing better oxygen diffusion, facilitating microbial activity to finally improve the soil stability as already concluded by a meta-analysis in Europe on agronomic efficiency of P fertilizers derived from secondary raw materials that could also contribute to more circular nutrient cycles [20].
The bulk density of P52 increased notably in the opposite side to P50 remaining nearly the same. The organic soil material weighed less than mineral soil material lowering the bulk density of mineral soil by addition and reducing the overall soil weight. Our results suggest that longer time for by-products degradation is needed to become organic soil material, since incomplete degradation of the wastes was observed in the cultivation plot after 14 months of experimentation.
Figure 1 shows the change of moisture and pH with the treatment time. As-received plots showed low moisture percentage associated to its sandy loam texture. The humidity of the plots was registered first in November 2012 and after 14 months in January 2014, when the rain is scarce. The average annual rainfall, measured from 1951 to 2014, is about 2300 mm according to the National Water Commission [21].
The highest moisture variation was registered in P50, increased in 2.2 units due to its null slope, while P51 and P52 moisture increased just 0.5 and 1.2 units, respectively, due to their slopes being different to zero. Such results are signals of the enhanced ability of plots to develop plants even under null irrigation frequency. It should be noted that the difference between the moisture retention capacity and the permanent wilting point is the moisture that can be used by crops [11].
In this context, the greatest increase in the WP was registered in P51 with 4 units, while for P50 and P52 it was 1.9 and 2.8 units, respectively. Even when P52 showed the highest increment of FC with 3.8 units at treatment ending, the most significant difference was found in P51 with 5.4 units, since the soil was enriched only with by-products admixtures and uncultivated.
We designed this amendment fertilizer, purposely joining CR and SC, considering the characteristic high moisture of CR, 13.1% (see Table 1). Such high MT level should favor the development of fungi and the final degradation of CR enriching the soil however this study effort was not focused on the soil biota change, it is intended for the next study. Our results offer a non-expensive way for moisture improvement in sandy soils. However, the addition of by-products should be adjusted for every type of soil characteristics, environmental conditions, and crop selection.

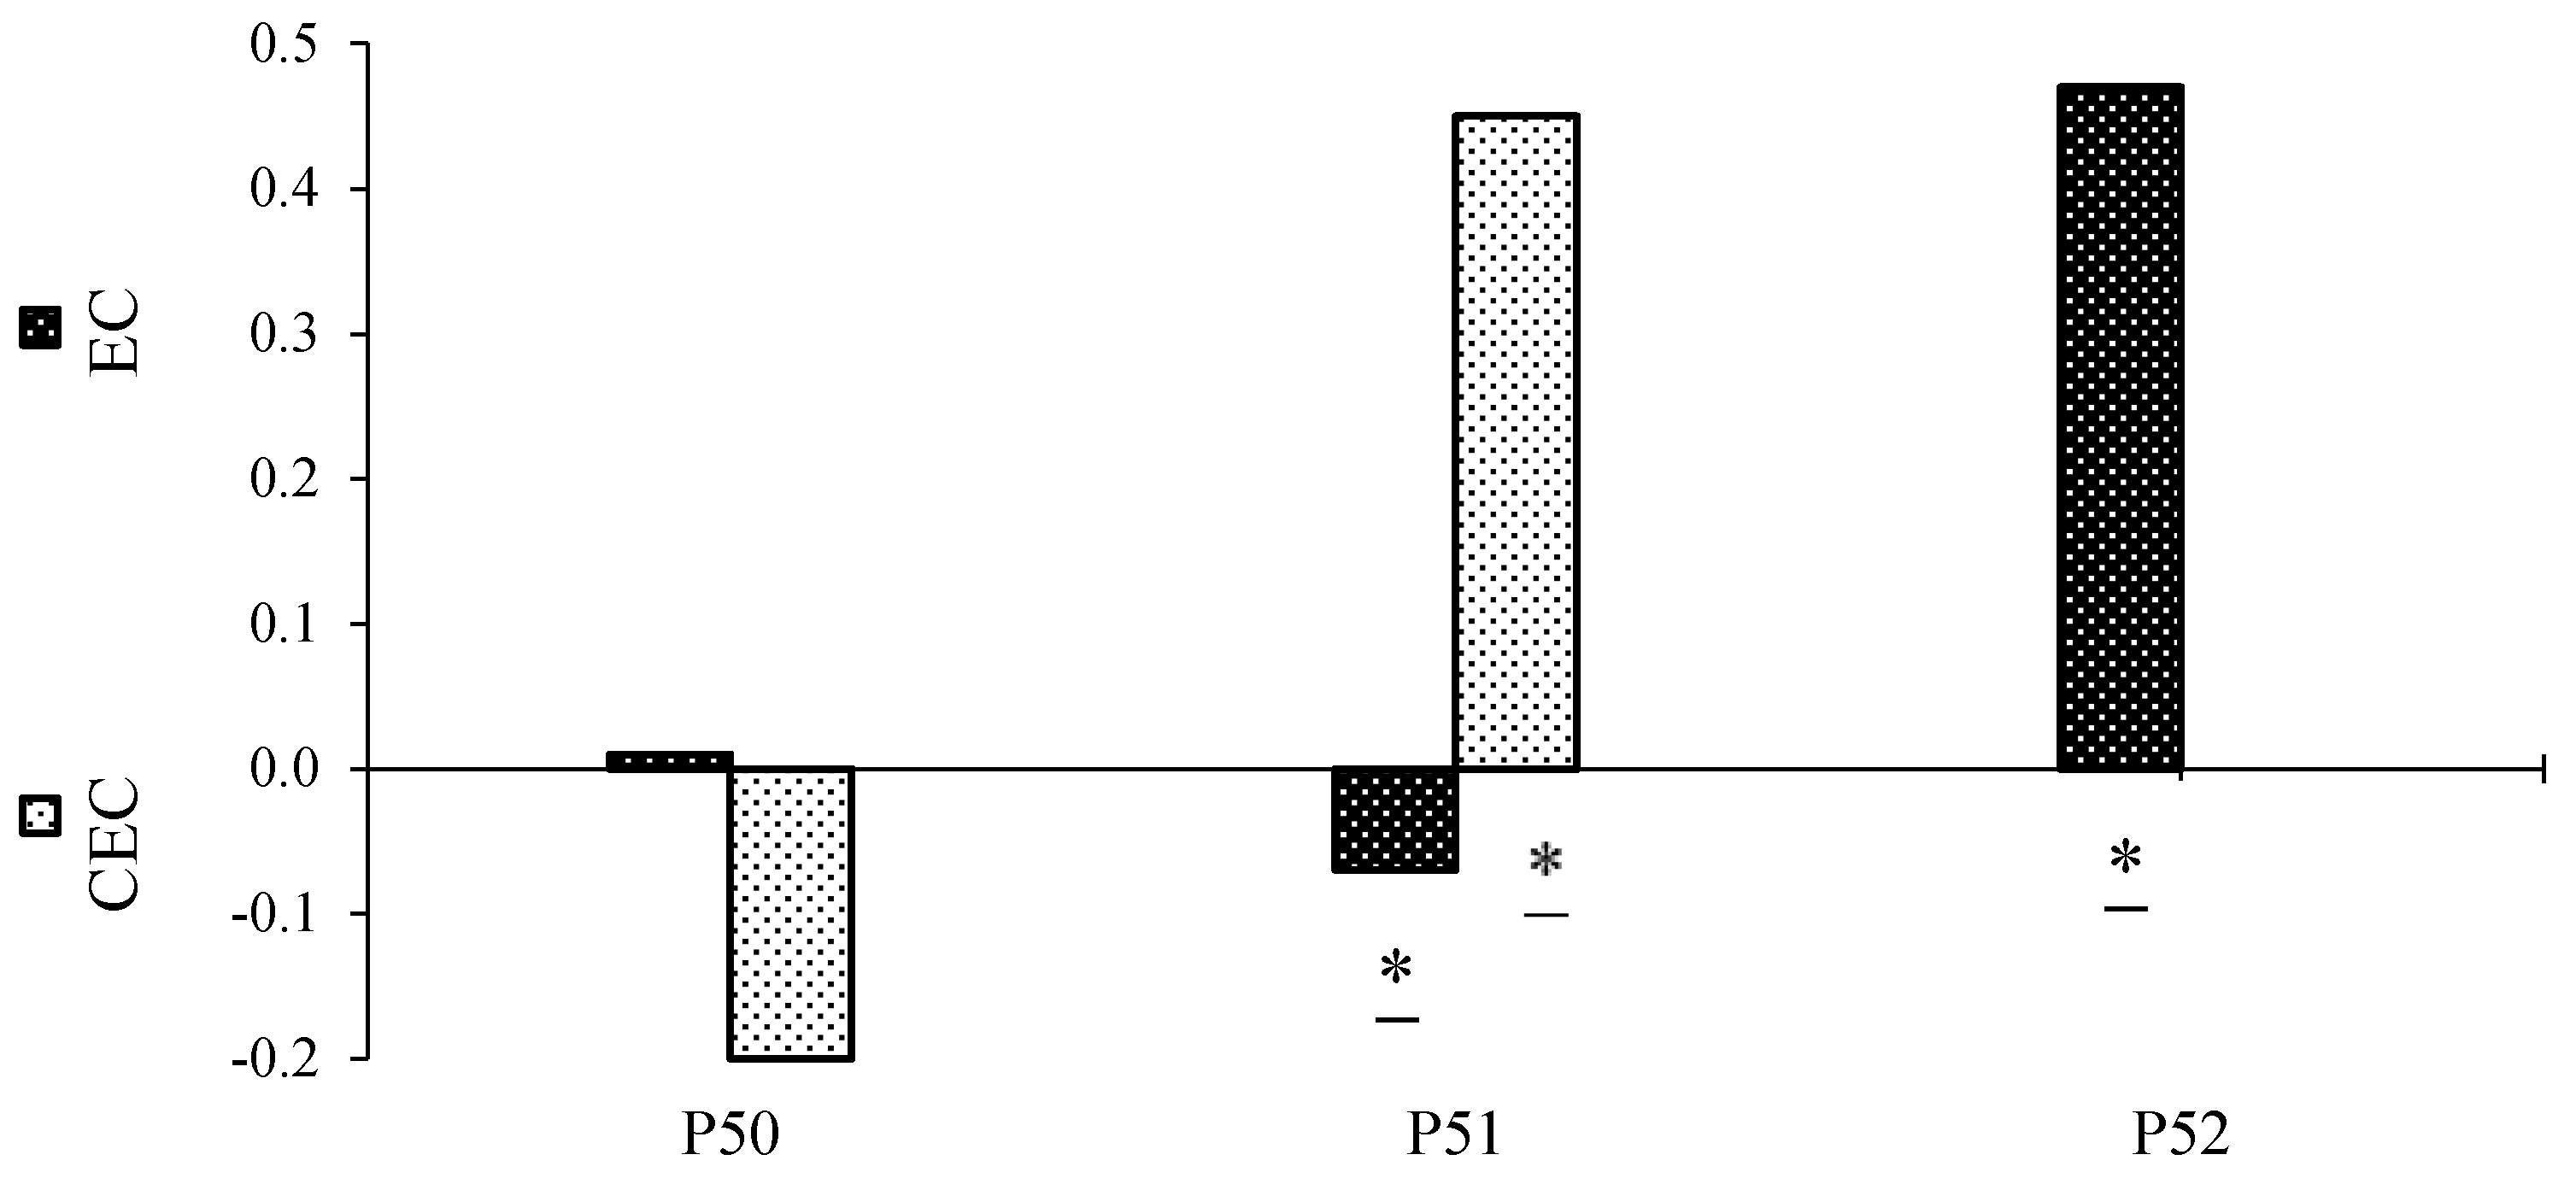
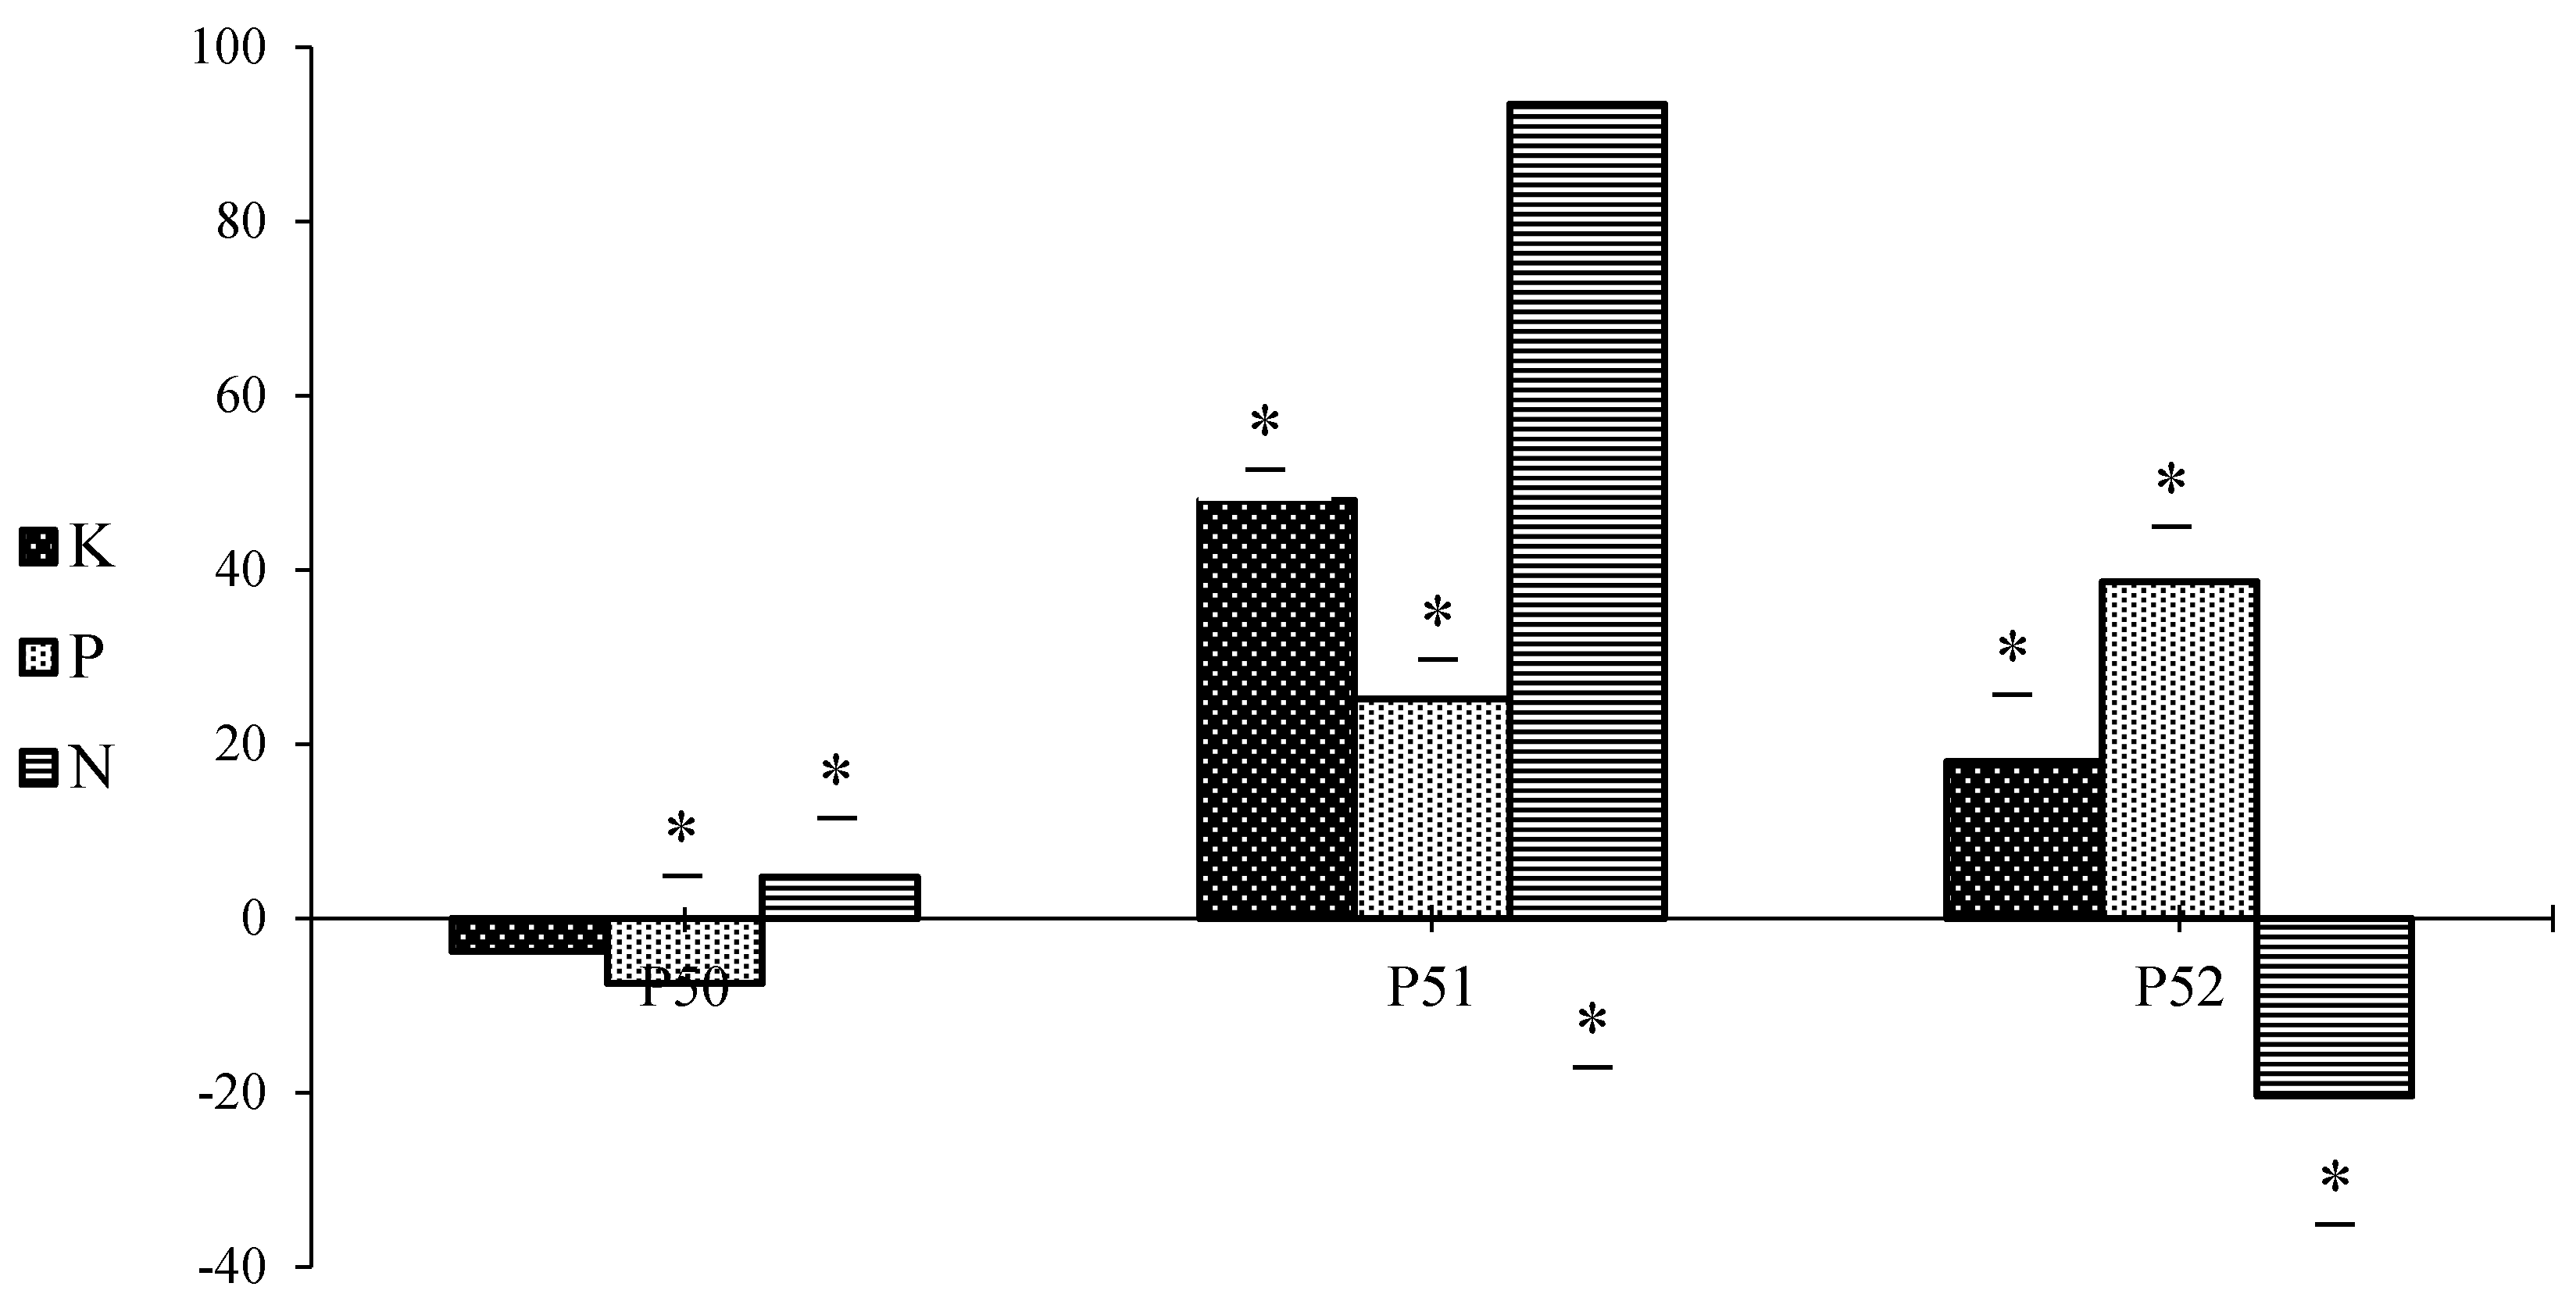
3.2. Effect of the Amendments on Soil Chemical Properties

The acidic feature of the farming land soils, average pH of 4.86, is suitable but not ideal for growing the representative crop of the lower region of the Papaloapan basin of Oaxaca, Mexico, the Ananas comosus or pineapple. However, high acidity hinders the assimilation of P due to competence with Fe2+,3+, Mg+2, and Ca2+, all found in high concentration in the plots but the electrical conductivity and cation exchange capacity registered were low [22].
In the tropic environments, pineapple farms that do not use agroindustrial amendments apply a neutralizing material for increasing pH of the soil, calcium carbonate (dolomite) is the amendment mainly used to generate buffer reaction in the soil, especially in the rainy season.
The relevance of the by-products’ chemical composition was the main reason to test the combination of both as soil amendment of specifically these long lasting pineapple fields. The pH of SC was nearly neutral while CR was alkaline (see Table 1); the combined addition of both to the cultivation fields driven near to neutrality in P51, uncultivated plot, after 14 months of treatment allowing the development of bacteria and fungi as reported in the literature [23].
The influence of only chemical fertilization in contrast to supplementary fertilization of the by-products added is registered on the acidity change of P50 and P52 (see Figure 1), the first became lightly more acidic while the second shifted away from acidity by 8%. We suggest that P50 nearly kept the same acidity as a consequence of ion filtration through this sandy soil, the plot with the largest amount of sand.
As observed in Figure 2, the addition of CR and SC to cultivation plots affected the EC and CEC in very different ways. The CEC of P50 decreased, while that of P51 increased, and that of P52 remained unchanged, indicating that the highest quantity of ion transfer to the soil took place in P51, an uncultivated plot.
Plot P51 shows the highest CEC, increased in 0.4 units, related to the highest content change of N, P, and K (see Figure 3) demonstrating effective soil enrichment, improving fertility under environmental conditions, not under laboratory-controlled conditions. The plot with highest EC is P52, 0.49 units, while the others remain mostly unchanged or even decreased, indicating that the saturation percentage of exchangeable cations different of H+ like Ca2+, Mg2+, Na+, K+ was not achieved, since below 0.35 the effect is negligible but between 0.65 and 1.15 it is significant according to the literature [24].
The case of plot P50 attracts attention particularly since even when CEC shows no important increase, the OM increased hugely. We must take into account that the very high CEC of organic matter is observed for humidified OM meaning that for OM comprising fresh fragments or debris, or residues poorly evolved, it would be possible that a significant increase in the soil organic matter content is not yet converted to any relevant increase in CEC. CR debris was observed in the fields at this study end.
Figure 3 illustrates the change of N, P, and K content in every plot when time changed. The N concentration was significantly modified: P51 showed an increment of 93.4 units while P52 even decreased this content, −20.4 units, and P50 just increased it by 4.7 units. The highest content of N in P51 indicates that effective cation exchange took place by addition of only the mixture of SC and CR when the plot was kept fallow. The behavior of P50 against that of P52 is relevant since the first increased by 127% while the second even decreased its N content. We must remember that both plots are cultivated but just P50 was only chemically fertilized delivering nitrogen in a faster way than the combination of both fertilization styles in P52.
Phosphorus concentration has shown a very different behavior since P52 increased by 38.7 units, while P51 increased it just 25.2 units and P50 even diminished its content, −7.4 units. K+ concentration shows again the highest increment in P51, 48 units, followed by P52, 18 units, while P50 decreased this ion content by −3.8 units.
The change in Ca2+ content against the initial time (see Table 2) is dramatically clear between the three plots: P51 showed an increment of 3958% while P52 incremented by 866% and again P50 decreased its content. Such a trend can be related to the by-products decomposition adding OM as recently stated by a work of straw incubation added to soil, suggesting that addition of organic materials to soil can increase the stability of soil aggregates, probably due to mineral-organic complexes generated and decreasing of net repulsive force between two adjacent particles within soil aggregates [25].
We must remember the high content of Ca2+ in CR that it is undoubtedly related to this huge change of Ca2+ content in the uncultivated plot, P51. The Mg2+ content changed in a very similar way, P51 by 641%, P52 by 202% while P50 decreased this ion content too. It seems that, rather than K+, Ca2+, Mg2+, etc., exchangeable cations, instead soluble cations probably coming from the mineral fertilizers aggregated are influencing the strange scarcity in CEC and huge amounts of exchangeable cations content. In plots P51 and P52 the high amount of Ca2+ probably reflects the addition of organic residues rich in Ca2+, like CaCO3 from CR, that can be released as calcium salt owing to the acidic pH of the soil. For clearing this acid soil effect over the CEC data determined it would be required to measure, in addition to an extraction for CEC, also an extraction with just water then the strictly exchangeable cations would be calculated by difference between both; as wisely suggested by a reviewer it will be done in the next study.
On the other hand, the changes registered in micronutrients concentration can be related to the changes of each soil texture, since P50 shows no real change in clay but high increase of sand that perhaps could retain the content of Mn2+, Fe2+,3+, Cu2+, and Zn2+ in that null slope plot. The opposite case is P51 with slight slope and high decrease of Fe2+,3+ content associated with the clear decrease of clay content, while P52 shows just the decrease of Fe2+,3+ content in half amount of P51 that is very similar to the amount decreased in its clay content.
Even when the organic matter (OM) of P51 and P52 plots did not increase dramatically, the nearly complete degradation of CR allowed soils to remain within the moderately rich category as indicated by the evaluation criteria reported in the literature [14]. In contrast, the OM of P50 increased dramatically resulting from the effect of chemical fertilizers.
It is known that the OM present in soil causes the formation of the humic-clay complex, increasing the sites of ionic fastening [26], and biological soil improvement should deliver vegetation cover facilitating the reactivity and absorption mechanisms of hazardous substances such as pesticides and other toxic agents [27].
In sum, these data trends show P51, the uncultivated plot, as the richest soil amended followed by P52, the plot cultivated with both fertilization styles as richer soil than P50, also cultivated but only chemically fertilized. As already said above, chemical fertilization delivers the nutrients in a faster way than the present supplementary method when the study plots were cultivated with pineapple plants. It is important to recognize that the combination of the selected wastes successfully amended the cultivation field when the plot was uncultivated demonstrating a synergy effect between CR and SC in the present fertilization method.
Recently, a work was published about the effect of soil improvements in a semi-arid climate ecosystem of Abu Dhabi. The landscape of highly degraded sandy and salty soil was divided into three zones due to addition of solutions A, B, and C, respectively. The effect of such solutions responds to their content: A, hydroretender polymer fertilizer + NPK + organic compost; B, soil conditioner organic fertilizer, and C, organic compost + NPK. They concluded that solution B optimized the soil water holding capacity and plant growth [28].
The present work demonstrated that adding just the selected industrial by-products improved the plots moisture up to nearly 30%. The CR and SC are affecting the soils as both soil conditioner and organic fertilizers with only the cost of transportation. These results are opposed to the idea of adding biochar, obtained by pyrolysis of paper fiber sludge + grain husks; 1:1 per weight, to silt-loam soil cultivated with maize in Slovakia as water holding enhancer. That study concluded that soil water content was higher in the control plot than in the plot enriched with that type of biochar [29].
Recent studies of greenhouse gas emissions from sugarcane cultivation soils in Brazil indicated that urea is subject to high volatilization losses when surface-applied to soils, also that crop trash accumulation may result in higher rates of N fertilizer application since it is retained in organic material decomposition [30,31]. Another Brazilian working group recently reported the OM content of filter cake in 22.6%, with pH about 7 and the C:N ratio of 27, while our results have registered OM higher than 40% and C:N ratio about 30 in pH nearly 7 [32].
Sugar mill filter cake has shown great potential for phosphate mineral fertilizer in field crop production of sugarcane. Already applied on cultivation soils has demonstrated great benefits [33], and it is also economically attractive since it avoids chemical fertilizers in addition to its environmental benefits [34].
As already stated from a working group in India, using sugar industry by-products like press mud or sugar mill filter cake will be the best option to minimize fertilizer shortage for crop production, especially heavy nutrient feeder crop like sugarcane, when packaging and marketing these residues into fine products such as biofertilizers becomes a reality all over the world [35].
It is well known that mineral fertilizers alone are not effective for crop development since organic matter is lacking. Unfortunately, organic matter returning to cultivation field is not delivering nutrients efficiently due to conventional tillage practices and environmental effects. The most sustainable nutrient recycling and reuse should use virgin and recycled nutrients, keeping it as simple as possible, and reducing the use of mineral fertilizers supplemented by organic or by-products fertilization practices will develop the named agro-residue processing and upcycling.

4. Conclusions

It is very important to consider the severe acidity of the sandy loam soils of the Papaloapan basin region of Mexico, which was the focus of this study, since it is related to the mobility of phosphorus of the non-mobile phase to the mobile phase. It was found that phosphorus can be transferred to the mobile phase even when cations of Fe2+,3+, Mg2+, and Ca2+ are present, due to the near neutral pH conditions that facilitated the activity of some microorganisms, even when this study was not focused on the soil biota.
We demonstrated for the first time that combining two industrial wastes from renewable resources (paper mill sludge from paper recycling mill and sugar mill filter cake) added to Ananas comosus cultivation sandy loam plots influenced the change of soil pH from acidic to rather neutral, facilitating the availability of phosphorus significantly, favoring the development of pineapple plants and increasing the fruit yield, according to the results in preparation for our next publication.
The availability of exchangeable bases from nutrients in the soil combined with the addition of nutrients contributed from the mixture of sugar mill filter cake and paper sludge delivered a high and economical soil amendment in P51.
The soil amendment registered in this study can be replicated in any other cultivation land with similar texture, when the by-products are at hand, delivering a sustainable method of fertilization aiding the reduction of crop costs and promoting food production all over the world.

Supplementary Materials

The following are available online at https://www.mdpi.com/2077-0472/10/5/173/s1.

Author Contributions

Conceptualization, M.P. and F.C.G.-M.; methodology, R.A.-G. and M.A.S.-H.; resources, P.P.-P. and M.A.G.-L.; data curation, L.N.-M.; writing—review and editing, M.P.; project administration, M.P.; funding acquisition, R.A.-G. All authors have read and agreed to the published version of the manuscript.

Funding

This research was funded by Fundacion Produce Oaxaca, A.C., grant number FPO/GG/739/12 and the APC was funded by the Mexican program PRODEP.

Acknowledgments

The authors acknowledge Fundacion Produce Oaxaca, A.C. for financial support provided by project grant FPO/GG/739/12 and to PRODEP for paying the APC. The authors wish to express gratitude to Lyn Fuchs for helpful style corrections, Jaime Lopez-Luna for fruitful discussions, and the reviewers for significant observations.

Conflicts of Interest

The authors declare no conflict of interest.

References

  1. Acharya, A.K.; Kafle, N. Land degradation issues in Nepal and its management through agroforestry. J. Agric. Environ. 2009, 10, 115–123. [Google Scholar] [CrossRef]
  2. FAO. World Fertilizer Trends and Outlook to 2020. Summary Report. Available online: www.fao.org/3/ai6895e.pdf (accessed on 2 October 2019).
  3. EC. European Commission Communication. Available online: http://ec.europa.eu/transparency/regdoc/rep/1/2017/EN/COM-2017-490-F1-EN-MAIN-PART-1.PDF (accessed on 7 February 2020).
  4. Semple, K.T.; Reid, B.J.; Fermor, T.R. Impact of composting strategies on the treatment of soils contaminated with organic pollutants. Environ. Pollution. 2001, 112, 269–283. [Google Scholar] [CrossRef]
  5. Gonfa, A.; Bedadi, B.; Argaw, A. Effect of bagasse ash and filter cake amendments on wheat (Triticum turgidum L.var. durum) yield and yield components in nitisol. Int. J. Recycl. Org. Waste Agric. 2018, 7, 231–240. [Google Scholar] [CrossRef] [Green Version]
  6. Carmo, J.B.; PiSColo, M.C.; Cristiano, A.A.; Cerri, C.E.P.; Feigl, J.B.; Neto, F.S.; Cerri, C.C. Short-term changes in nitrogen availability, gas fluxes (CO2, NO, N2O) and microbial biomass after tillage during pasture re-establishment in Rondônia, Brazil. Soil Tillage Res. 2007, 96, 250–259. [Google Scholar] [CrossRef]
  7. Davidson, D.W.; Verma, M.S.; Gu, F.X. Controlled root targeted delivery of fertilizer using an ionically crosslinked carboxymethyl cellulose hydrogel matrix. SpringerPlus 2013, 2, 318. [Google Scholar] [CrossRef] [PubMed] [Green Version]
  8. SEMARNAT. Norma Oficial Mexicana-021-Secretaria de Medio Ambiente y Recursos Naturales; Diario Oficial de la Federación: Mexico City, Mexico, 2002.
  9. SEMARNAT. Sitios Contaminados Prioritarios; Secretaria de Medio Ambiente y Recursos Naturales: Mexico City, Mexico, 2006. [Google Scholar]
  10. NOM-021-RECNAT-2000. Metodologías de análisis de Suelo en Mexico; Secretaria de Medio Ambiente y Recursos Naturales: Mexico City, Mexico, 2002. [Google Scholar]
  11. Richards, L.A. Porous plate apparatus for measuring moisture retention and transmission by soil. Soil Sci. 1948, 66, 105–110. [Google Scholar] [CrossRef]
  12. Olsen, S.R.; Sommers, L.E. Phosphorus. In Methods of Soil Analysis; Miller, R.H., Keeny, D.R., Eds.; American Society of Agronomy: Madison, WI, USA, 1982. [Google Scholar]
  13. Pansu, M.; Gautheyrou, J. Handbook of Soil Analysis; Springer: Dordrecht, The Netherlands, 2006. [Google Scholar]
  14. Soil Science Division Staff. Soil Survey Manual; Ditzler, C., Scheffe, K., Monger, H.C., Eds.; USDA Handbook 18: Washington DC, USA, 2017. [Google Scholar]
  15. AOAC. Official Method of Analysis, 11th ed.; Association of Official Agricultural Chemists: Washington, DC, USA, 2004. [Google Scholar]
  16. Prado, R.; Caione, G.; Campos, C. Filter cake and vinasse as fertilizers contributing to conservation agriculture. Appl. Environ. Soil Sci. 2013, 2013. [Google Scholar] [CrossRef]
  17. Rebolledo-Martínez, A.; Uriza-Ávila, D.A.; Pérez, L.A.; Rebolledo-Martínez, L.; Zetina-Lezama, R. La Piña y su Cultivo en México: Cayena Lisa y MD2; INIFAP: Veracruz, Mexico, 2011. [Google Scholar]
  18. SAS. Statistical Analysis System; SAS Institute: Cary, NC, USA, 2010. [Google Scholar]
  19. Van der Poel, P.W.; Schiweck, H.; Schwartz, T. Sugar Technology. Beet and Sugarcane Manufacture; Bartens: Berlin, Germany, 1997. [Google Scholar]
  20. Huygens, D.; Saveyn, H.G.M. Agronomic efficiency of selected phosphorus fertilizers derived from secondary raw materials for European agriculture. A meta-analysis. Agron. Sustain. Dev. 2018, 38, 52. [Google Scholar] [CrossRef] [Green Version]
  21. CONAGUA. Comisión Nacional del Agua. Cuadro 1.6.3. Available online: http://www.conagua.gob.mx/CONAGUA07/Publicaciones/Publicaciones/EAM2015.pdf (accessed on 1 October 2019).
  22. Swarup, A. Yield and nutrition of rice as influenced by Presubmergence and amendments in a highly sodic soil. J. lndian Soc. Soil Sci. 1985, 33, 352–357. [Google Scholar]
  23. Kabata-Pendias, A.; Pendias, H. Trace Elements in Soils and Plants; CRC Press: Boca Raton, FL, USA, 2000; ISBN 0-8493-6639-9. [Google Scholar]
  24. Rioja-Molina, A.E. Apuntes de Fitotecnia General; E.U.I.T.A: Ciudad Real, Spain, 2002. [Google Scholar]
  25. Yu, Z.; Zhang, J.; Zhang, C.; Xin, X.; Li, H. The coupling effects of soil organic matter and particle interaction forces on soil aggregate stability. Soil Tillage Res. 2017, 174, 251–260. [Google Scholar] [CrossRef]
  26. Cegarra, J.; Hernández, M.T.; Lax, A.; Costa, F. Adición de residuos vegetales a suelos calizos. II. influencia sobre la capacidad de retención hídrica y las propiedades de intercambio iónico. An. Edafol. Agrobiol. 1983, 42, 235–244. [Google Scholar]
  27. Caporale, A.G.; Violante, A. Chemical Processes Affecting the Mobility of Heavy Metals and Metalloids in Soil Environments. Curr. Pollut. Rep. 2016, 2, 15. [Google Scholar] [CrossRef] [Green Version]
  28. Seguela, G.; Littlewood, J.R.; Karani, G. Eco-engineering strategies for soil restoration and water conservation: Investigating the application of soil improvements in a semi-arid climate in a medical facility case study, Abu Dhabi. Ecol. Eng. 2018, 121, 53–64. [Google Scholar] [CrossRef]
  29. Vitkova, J.; Surda, P.; Brezianska, K. Soil Water Regime Evaluation after Biochar Amendment. IOP Conf. Ser. Earth Environ. Sci. 2019, 221, 012110. [Google Scholar] [CrossRef]
  30. Carmo, J.B.; Filoso, S.; Zotelli, L.C.; De Sousa, E.R.; Pitombo, L.M.; Duarte-Neto, P.J.; Martinelli, L.A. Infield greenhouse gas emissions from sugarcane soils in Brazil: Effects from synthetic and organic fertilizer application and crop trash accumulation. GCB Bioenergy 2013, 5, 267–280. [Google Scholar] [CrossRef]
  31. Vitti, A.C.; Trivelin, P.C.; Cantarella, H.; Junqueira, H.C.; Faroni, C.E.; Otto, R.; Trivelin, M.O.; Tovajar, J.G. Mineralização da palhada e crescimento de raízes de cana-de-açúcar relacionados com a adubação nitrogenada de plantio. Rev. Bras. Cienc. Solo. 2008, 32, 2757–2762. [Google Scholar] [CrossRef]
  32. Campiteli, L.L.; Santos, R.M.; Lazarovits, G.; Rigobelo, E.C. The impact of applications of sugar cane filter cake and vinasse on soil fertility factors in fields having four different crop rotations practices in Brazil. Científica 2018, 46, 42–48. [Google Scholar] [CrossRef] [Green Version]
  33. Gonçalvesa, J.C.; Caetano-Vasques, N.; Silvaa, C.N.; PaSColaa, E.A.S.; Schmidt, E.; Yamaguchia, N.U.; Andreazzia, M.A.; Gasparotto, F. Influence of the Application of Filter Cake on Soil Chemical Characteristics. Chem. Eng. Trans. 2018, 65, 775–780. [Google Scholar] [CrossRef]
  34. Yao, K.; Gala, B.T.J.; Messoum, F.G.; Yao-Kouamé, A. Soil cation exchange capacity and sugarcane yield as influenced by filter cake and mineral fertilizer in Borotou, Northwestern Côte d’Ivoire. Int. J. Agric. Pol. Res. 2018, 6, 1–6. [Google Scholar] [CrossRef]
  35. Dotaniya, M.L.; Datta, S.C.; Biswas, D.R.; Dotaniya, C.K.; Meena, B.L.; Rajendiran, S.; Regar, K.L.; Lata, M. Use of sugarcane industrial by-products for improving sugarcane productivity and soil health. Int. J. Recycl. Org. Waste Agric. 2016, 5, 185–194. [Google Scholar] [CrossRef] [Green Version]
Figure 1. Moisture (%) and pH. Difference of tf − t0. * Statistically significant difference.
Agriculture 10 00173 g001
Figure 2. Electrical conductivity (dS·m−1) and cation exchange capacity (cmol·kg−1). Difference tf − t0. * Statistically significant difference.
Agriculture 10 00173 g002
Figure 3. Plots content of N, P, and K (mg·kg−1). Difference of tf − t0. * Statistically significant difference.
Agriculture 10 00173 g003
Table 1. Industrial by-products’ characteristics at study initial time.
CR t0SC t0LSD
pH8.40 ± 0.04 *6.90 ± 0.05 *0.10
MT13.10 ± 0.18 *10.20 ± 0.06 *0.30
FC315.00 ± 5.5 *39.20 ± 1 *8.97
EC5.56 ± 0.35 *1.17 ± 0.16 *0.61
BD0.33 ± 0.07 0.27 ± 0.01 0.12
OM39.71 ± 1.4 40.77 ± 0.58 2.43
TOC23.09 ± 0.3 24.46 ± 0.35 1.67
C:N63.00 ± 1 *30.10 ± 0.15 *1.62
CEC 53.10 ± 1 *108.20 ± 1 *2.33
N 37.00 ± 3 *77.00 ± 1 *5.07
P8.00 ± 0.55 *75.00 ± 2 *3.32
K2.00 ± 0.2 *41.00 ± 2 *3.22
Ca40.87 ± 2.24 *22.70 ± 1.23 *4.09
Mg43.00 ± 2 *22.66 ± 2 *4.53
B58.80 ± 1.4 *108.20 ± 0.38 *2.86
Mn76.68 ± 1.4 *1086.40 ± 1.2 *2.98
Fe11.20 ± 1 *6.86 ± 0.35 *1.70
Cu221.60 ± 2.8 *62.67 ± 2.34 *5.84
Zn89.72 ± 1.5 *146.65 ± 5.99 *9.90
* Significantly different. MT (%), FC (%), EC (dS·m−1), BD (t·m−3), OM (%), TOC (%), C:N (%), CEC (cmol·kg−1). N, P, K, Ca, Mg, B, Mn, Fe, Cu, and Zn (mg·kg−1). LSD test, p ≤ 0.05.
Table 2. Soils amendment comparative features at study end.
P50 t0P50 tfLSDP51 t0P51 tfLSDP52 t0P52 tfLSD
Cy5.8 ± 0.16 ± 0.20.3716.5 ± 0.17.2 ± 0.1 *0.2914.0 ± 19.2 ± 0.1 *1.61
St26 ± 0.114 ± 1 *1.6031.3 ± 0.633.1 ± 0.1 *0.1829.8 ± 1.0633.2 ± 0.2 *1.73
Sd68.2 ± 0.180 ± 1 *1.6052.2 ± 259.7 ± 0.1 *3.2156.2 ± 3.9757.6 ± 0.86.50
pH5.3 ± 0.45.2 ± 0.4 0.574.5 ± 0.36.7 ± 0.06 *0.494.8 ± 0.335.2 ± 0.030.52
MT7.8 ± 0.710 ± 1 *1.9110.3 ± 0.210.8 ± 11.676 ± 0.867.2 ± 12.07
FC10.3 ± 1.112.8 ± 0.2 *1.8010.8 ± 1.216.2 ± 1.2 *2.6014.4 ± 0.218.2 ± 2.1 * 3.46
WP2.6 ± 0.14.5 ± 0.1 *1.303.0 ± 0.617.01 ± 0.77 * 1.935.7 ± 0.758.5 ± 1.6 *2.57
EC0.32 ± 0.030.3 ± 0.03 0.070.38 ± 0.020.31 ± 0.02 * 0.040.31 ± 0.040.8 ± 0.04 *0.08
BD1.21 ± 0.041.2 ± 0.0 0.071.27 ± 0.031.3 ± 0.070.111.2 ± 0.051.5 ± 0.04 * 0.09
OM0.81 ± 0.14.5 ± 0.1 *0.243.8 ± 0.194.4 ± 0.40.694.2 ± 0.135.2 ± 0.05 *0.22
TOC0.6 ± 0.23.2 ± 0.0 *0.272.6 ± 0.023.03 ± 0.2 * 0.402.8 ± 0.13.6 ± 0.01 *0.16
C:N3.3 ± 0.120.7 ± 0.0 *0.1911.8 ± 0.040.38 ± 0.01 *0.068.13 ± 1.070.5 ± 0.01 *1.71
CEC 3.2 ± 0.23.2 ± 0.04 0.333.4 ± 0.23.8 ± 0.1 *0.363.2 ± 0.23.2 ± 0.10.36
N 16.8 ± 1.121.5 ± 0.2 *1.7422.1 ± 0.18115.5 ± 3 *4.7334.4 ± 2.214 ± 3 *5.96
P57.9 ± 3.550.5 ± 0.6 * 5.7027.7 ± 0.3452.9 ± 0.9 *1.6213 ± 251.7 ± 1.3 *3.81
K56 ± 11.252.2 ± 1.618.246 ± 394 ± 2 *5.7854 ± 472 ± 3 *8.01
Ca141 ± 4.7135 ± 28.1180 ± 63167 ± 17 *28.9112 ± 7971 ± 11 *20.6
Mg67 ± 2.3163.3 ± 1.54.4317 ± 2.63109 ± 1 *4.5145 ± 391 ± 3.5 *7.41
B0.64 ± 0.020.5 ± 0.20.321.38 ± 0.024.4 ± 0.2 *0.321.2 ± 0.013.3 ± 0.13 *0.21
Mn10 ± 1.2411.2 ± 0.42.129.48 ± 0.254.7 ± 0.1 *0.4118.7 ± 1.5715.3 ± 1.43.41
Fe89.2 ± 3.2493.45 ± 3 7.15267.37 ± 322.1 ± 2 *5.7223.8 ± 2.686 ± 5 *9.07
Cu0.69 ± 0.060.4 ± 0.1 *0.190.72 ± 0.040.4 ± 0.03 *0.071.14 ± 0.040.5 ± 0.15 *0.25
Zn7.4 ± 0.135.2 ± 0.4 *0.692.06 ± 0.171.5 ± 0.1 *0.305.1 ± 0.142.1 ± 0.04 *0.24
* Significantly different. WP (%), MT (%), FC (%), EC (dS·m−1), BD (t·m−3), OM (%), TOC (%), C:N (%), CEC (cmol·kg−1). N, P, K, Ca, Mg, B, Mn, Fe, Cu, and Zn (mg·kg−1). Cy (clay), St (silt), Sd (sand). LSD test, p ≤ 0.05.

