Article

Has Rural Migration Weakened Agricultural Cultivation? Evidence from the Mountains of Southwest China

1
College of Geography and Resources Science, Sichuan Normal University, Chengdu 610101, China
2
Research Center for Mountain Development, Institute of Mountain Hazards and Environment, Chinese Academy of Sciences, Chengdu 610041, Sichuan, China
3
School of resources and environment, University of Chinese Academy of Sciences, Beijing 100049, China
*
Author to whom correspondence should be addressed.
Agriculture 2020, 10(3), 63; https://doi.org/10.3390/agriculture10030063
Submission received: 19 January 2020 / Revised: 3 March 2020 / Accepted: 3 March 2020 / Published: 5 March 2020
(This article belongs to the Special Issue Productivity, Efficiency, and Sustainability in Agriculture)

Abstract

:
Linkages between rural migration and agricultural restructuring have become a key aspect of rapid urbanization in developing countries and a research focus for optimizing rural–urban development and rural reconstruction. Using continuous statistical data from the mountains of Southwest China, we examined the structure, changes and regional differences in agricultural cultivation under urbanization, analyzed the reasons for the restructuring of agricultural cultivation, and revealed the adaptation linkages between the rural–urban transition and agricultural restructuring. The results showed that land-use changes and rural migration caused by urbanization significantly affected the cultivation structure and its change trends: the proportion of food crops decreased, while the proportion of vegetables and orchards increased. However, regional differences in the agricultural cultivation structure were significant in the various township zones. Rural migration weakened agricultural cultivation in the lake basin and nationality townships but enhanced agricultural cultivation in the river valley townships. On the basis of the adaptation linkages of urbanization, rural migration, agricultural intensification, cultivation structure and economic development, chain-type changes and adaptation processes between rural migration and agricultural restructuring were demonstrated. These findings indicate that favorable locations and appropriate policies can promote the integration and restructuring of smallholder agriculture for commercialization and intensification and vice versa.

1. Introduction

Rural–urban migration under the background of rapid urbanization has led farmers to gradually abandon agricultural cultivation, especially among young rural laborers. In developing countries, the main laborers participating in agricultural cultivation have gradually changed from young males to the elderly and women [1,2]. This impact of rural–urban migration on agricultural cultivation has two aspects: rural migration can change farmer household’s behaviors by labor and capital changes, while urbanization’s demand and supply to the agricultural sector can change the cost-benefit structure of agricultural cultivation by agricultural markets and technical efficiency changes [3]. Therefore, urbanization has become the main driver of rural social and cultivation restructuring. The linkages between rural migration and agricultural cultivation have become a key aspect of rapid urbanization in developing countries, affecting rural surplus labor release, food security, agricultural prices, rural construction, agricultural modernization, rural land use and environmental change, and even the prospects for urbanization [4]. Rural migration has become a key variable in this dynamic framework of rural–urban transitions and agricultural restructuring. Therefore, exploring the linkages between rural migration and agricultural restructuring in the context of urbanization has become a key research topic in developing countries to optimize rural–urban development and promote rural construction [5].
Smallholder agricultural cultivation is the core of the rural economy and the livelihood of farmers in mountainous areas of developing country, whose restructuring process are directly related to the development of the rural economy and the livelihood strategies of farmers [6]. In addition, agricultural restructuring also affects environmental changes, such as rural land use and biodiversity [7]. Rural migration is a dynamic variable of rural–urban transitions and is the driver of dynamic changes in regional urbanization and rural populations. Rural migration influences agricultural restructuring through changes in agricultural labor, and changes in rural populations lead to reconstruction and changes in rural society and culture. Moreover, rural migration remittances are also an important source of capital for agricultural cultivation and an important promoter of the intensification and scale of agriculture. However, there are still arguments regarding the role of migration remittances in promoting agricultural development [8]. In rural–urban transitions and agricultural restructuring, rural migration and agricultural cultivation have become the key drivers of the evolution of this system. Therefore, studying the linkages between rural labor migration and agricultural restructuring has become a breakthrough in the analysis of urban-rural transition evolution over a complex background.

2. Literature Review and Research Design

2.1. Literature Review

Rural–urban transitions triggered by large-scale rural labor migration over the background of urbanization have become the focus of rural research in developing countries. Current research studies have focused on three issues: (ⅰ) the relationships between rural migration and rural land-use change, with a focus on farmland; (ii) the relationships between rural migration and cultivation efficiency and agricultural investment; and (iii) the relationships between rural migration and farmers’ livelihoods.
Urbanization and rural migration have led to changes in rural land use, especially in farmland [7,9]. Studies on the impact of rural population decline on rural landscapes have shown that farmland abandonment has affected rural biodiversity and triggered the succession of ecological landscapes [10]. Labor outmigration has weakened agricultural cultivation and increased the areas and the possibility of farmland abandonment by farmers [3,11,12,13]. The fragmentation of land reduces the marginal productivity of agricultural labor and further promotes the migration of rural labor to the nonagricultural sector [14]. It has been widely argued that rural migration leads to farmland abandonment and the weakening of agricultural cultivation and that it is beneficial for biodiversity conservation [15]. However, an increasing number of microstudies have found that rural migration has complex and diverse impacts on agricultural farming. An empirical analysis in Ecuador showed that the impact of rural migration on land-use changes was negative, namely, the migration of agricultural labor was unlikely to lead to regional forest growth [16]. Evidence from Brazil also suggested that rural migration was not directly related to land-use changes and that migrant remittances increased the areas of pastures and the risk of deforestation [17]. An economic analysis of immigrants in Central America also showed that rural migrants’ remittances supported the expansion of farmland but did not effectively support agricultural intensification [18]. Based on the results of time series studies, rural migration has an inverted N-shaped relationship with farmland cultivation intensity, with increased agricultural investment and reduced agricultural labor. However, excessive rural migration and farmland cultivation are not conducive to rural development, food security and ecological welfare [19,20].
Migrants’ economic investments brought about by rural migration have an impact on agricultural cultivation efficiency and promote the development of agricultural mechanization and chemicalization via labor remittances [21,22]. In a similar vein, migrants bring back advanced agricultural management techniques and sales opportunities to promote agricultural commercialization and marketization [23,24]. Although large-scale labor migration reduces agricultural labor, an econometric analysis showed that rural migration did not impair the cultivation efficiency of food crops, or threaten food security [25], indicating that agricultural investment and intensification can fill the gap left by labor outmigration [13]. Studies in Vietnam have shown that migration economies have changed the cultivation structure of farmers, reduced staple food crops and increased the diversity of crops in rural households [5]. Additionally, remittances increase farmland productivity and the supply of nonagricultural labor [13]. However, the impacts of changes in agricultural labor on food yield differ regionally. At different stages of development and in different geographical environments, the relationships are nonlinear [26]. Similarly, an increase in agricultural input can promote agricultural cultivation efficiency and rural economic development; however, excessive dependence on agricultural inputs and high intensification do not completely alleviate the rural–urban gap and result in hidden environmental dangers [22]. Rural migration can also lead to the feminization of agricultural labor, which in turn has negative impacts on agricultural cultivation efficiency, but the impact is more complicated due to the improvement of mechanization [1].
Rural migration is often considered a vital approach to improve the livelihood of farmers and enhance the robustness of livelihood strategies [11,27,28]. These effects are reflected in the fact that migrants’ economies can significantly increase per capita incomes, increase the proportion of non-agricultural income in household incomes and expand non-agricultural employment [29]. Rural migration decisions may also come from changes in livelihood patterns caused by the natural environment, and these changes in turn affect or even change livelihood strategies [30,31]. The key variable affecting the livelihood of rural households is migrant remittances, which directly increase household incomes and are applied to agricultural investments to increase the scale and efficiency of agricultural cultivation and indirectly further improve the livelihoods of farmers [18]. However, some studies have shown that short-term, immature rural migrants are unlikely to make significant contributions to improving family livelihoods due to a lack of education and financial and social capital deficiencies [32]. Moreover, excessive rural migration damages the growth potential of the rural economy and reduces the expectation of continuous improvements to farmers’ livelihoods [19].

2.2. Research Design

Although the linkages between rural migration and land-use change, agricultural cultivation and farmers’ livelihoods have been studied, they are still insufficiently understood. Empirical analyses in various geographic regions have often led to inconsistent insights. At different stages of development, the role and impacts of rural migration on rural–urban transitions are not consistent and coherent. In terms of data, many research studies have analyzed survey data, and it is impossible to test the robustness of conclusions generated with panel data over long time periods. The linkages between rural–urban transition and rural reconstruction should be determined and developed under the unified rural–urban territory system. Land-use change, cultivation efficiency, cultivation restructuring, farmer livelihood and location differences play roles in rural migration and reconstruction in the context of urbanization. The current analytical framework of rural migration and reconstruction has failed to consider more detailed linkages and has lacked systematic analysis. For example, analyses of the relationships between rural migration and farmland changes have failed to fully consider changes in cultivation structure. In addition, studies on the relationships between rural migration and agricultural cultivation efficiency have failed to consider the influence of location differences. These defects affect the comprehensiveness and representativeness of empirical analytical conclusions.
Rural–urban transitions and rural reconstruction should be studied under the dynamic framework of territorial systems, and the adaptation linkages between rural migration and agricultural cultivation should be multivariate and multipath and not depend on a single impact relationship. Furthermore, studying the rural–urban system as a unified territory functional system, examining the linkages between rural migration and agricultural cultivation from the perspective of regional differences, will help enhance the comprehensiveness and representativeness of conclusions. As the largest developing country in the world, China is experiencing far-reaching urbanization and modernization. Its large rural population, rapid urbanization and significant regional differences have made rural–urban transitions and rural reconstruction in China more complicated and diversified [33]. This analysis of rural migration and agricultural cultivation will provide representative and useful insights for other developing countries. Therefore, this paper uses Xichang, a typical agricultural and urbanization center in the southwestern mountains of China, as a case study to explore the impact relationships between rural labor migration and agricultural restructuring under the background of urbanization. Furthermore, the adaptation linkages of rural–urban transitions and rural reconstruction are examined, and the results provide a scientific reference for more regionalized rural policy and food security (Figure 1).

3. Variables and Modeling

3.1. Case Study Area

Xichang is the capital of the Liangshan Yi Autonomous Prefecture in Sichuan Province and the political, economic, transportation, cultural and tourism center of the Panxi Economic Zone (Figure 2). The area is located in the Anning River valley in southwestern Sichuan Province, between 101°46′–102°25’ E and 27°32′–28°10 N’. The territory area is 2651 km2 and the average elevation is 2160 m. The mountainous area of Xichang accounts for 83.6% of the total territory area, and the river valley plains account for 16.4%. Xichang is located in the subtropical plateau monsoon climate zone; the rain and heat are consistent, and farmland is fertile with the largest cultivation area in southwestern Sichuan. Xichang grows many national food crops and is a major county for hog rearing, and this area is the main area for Chinese onion and winter strawberry. In recent years, Xichang has become an important supply base for vegetables, fruits and food grains in the southwestern region. Based on landforms, Xichang can be divided into three parts: the lake basin, the river valley and the nationality area. The lake basin area is adjacent to the downtown area of Xichang and is the frontier of urbanization development. The river valley area is located in the Anning River valley plain, which runs from north to south. This part is the main population gathering area and agricultural cultivation area of Xichang. The nationality area is located on both sides of the river valley area and is the main gathering area of ethnic minorities (Yi, Hui and Tibet) with rugged terrain and high altitude. In 2016, the resident population of Xichang was 775 thousand, and the urbanization rate reached 57.57%, with an annual growth rate of 1%. Xichang has six urban block zones and 37 townships, including 14 minority townships. Rapid urbanization in Xichang has led to a rapid increase in the proportion of the urban population and a decline in the proportion of agricultural labor, with significant changes in the agricultural cultivation structure, which provides an excellent case for exploring rural labor migration and regional agricultural structure changes.

3.2. Data Sources and Statistics

The indicator data employed in this research were from the Xichang Statistical Yearbook (2006–2016) and included statistics on farmland, sown area, yield, population, income, etc., in townships; the land-use data (1:100,000) (2005, 2010 and 2015), terrain data (digital elevation model, DEM) and administrative division data were from the Resource and Environment Data Cloud Platform (http://www.resdc.cn/). Twenty-two indicators were selected for research design, and descriptive statistical analyses were carried out in three township zones (Table 1). The urbanization rates of the townships were the ratios of the nonrural population to the total population in the townships; the agricultural labor ratio was the ratio of agricultural labor to rural labor; the multiple cropping index was calculated as the sown area to the farmland area; topographic relief was the difference between the highest altitude and the lowest altitude in each township; the farmland area and agricultural labor per household were determined by the ratio of farmland, agricultural labor to the number of rural households; farmland and sown areas per agricultural labor were identified by the farmland, sown areas within the agricultural laborers, respectively; and the remaining indicators were derived directly from the statistical yearbook.
The 37 agricultural townships in Xichang were divided into the lake basin (5), river valley (19) and nationality townships (13). Taking 2016 as an example, descriptive statistics for these three township categories were calculated (Table 1). There were significant differences in urbanization, labor, agricultural development and economic income between the lake basin, river valley and nationality townships. The lake basin townships had the highest urbanization rate, rural population and labor rate; however, the agricultural labor ratio was the lowest, and the multiple cropping index was the highest, indicating that urbanization promoted the migration of rural labor and improved agricultural intensification in the lake basin townships. Although the sown area, yield and agricultural output value of the river valley townships were highest, the per capita net income of farmers was lower than that of the lake basin townships. The lake basin townships had the highest multiple cropping index, but the farmland and sown area per agricultural labor were the lowest. The farmland, agricultural laborers per household and topographic relief were the highest in the nationality townships, but the multiple cropping index, farmland and sown area per agricultural laborers were lower. These findings indicated that agricultural labor was still concentrated on agricultural cultivation, and that there was little outmigration in the nationality townships; furthermore, agricultural intensification was lower in these townships.

3.3. Econometric Model

Because the linkages between rural migration and agricultural cultivation are indirect and occur via multiple paths, this study used structural equation modeling (SEM) to perform a confirmatory path analysis to better examine the impact relationships between the potential role variables. SEM can address causal relationships between multiple reasons and multiple results or variables that are not directly observable, allowing independent variables and dependent variables to contain measurement errors. SEM can also simultaneously estimate factor structure and factor paths, allowing for great flexibility in measuring models. This paper used the path model of SEM [34], and the mathematical expression was as follows:
𝓎 = 𝓎 + T 𝓍 + ξ
where y represents endogenous variable vectors; x represents exogenous vectors; B is the path coefficient matrix between the endogenous variables; T represents the path coefficient matrix between the exogenous and endogenous variables; and ξ represents the error term of the structural equation, representing the portion of y that is not interpreted by the model.

4. Empirical Results

4.1. Background: Urbanization and Rural Migration

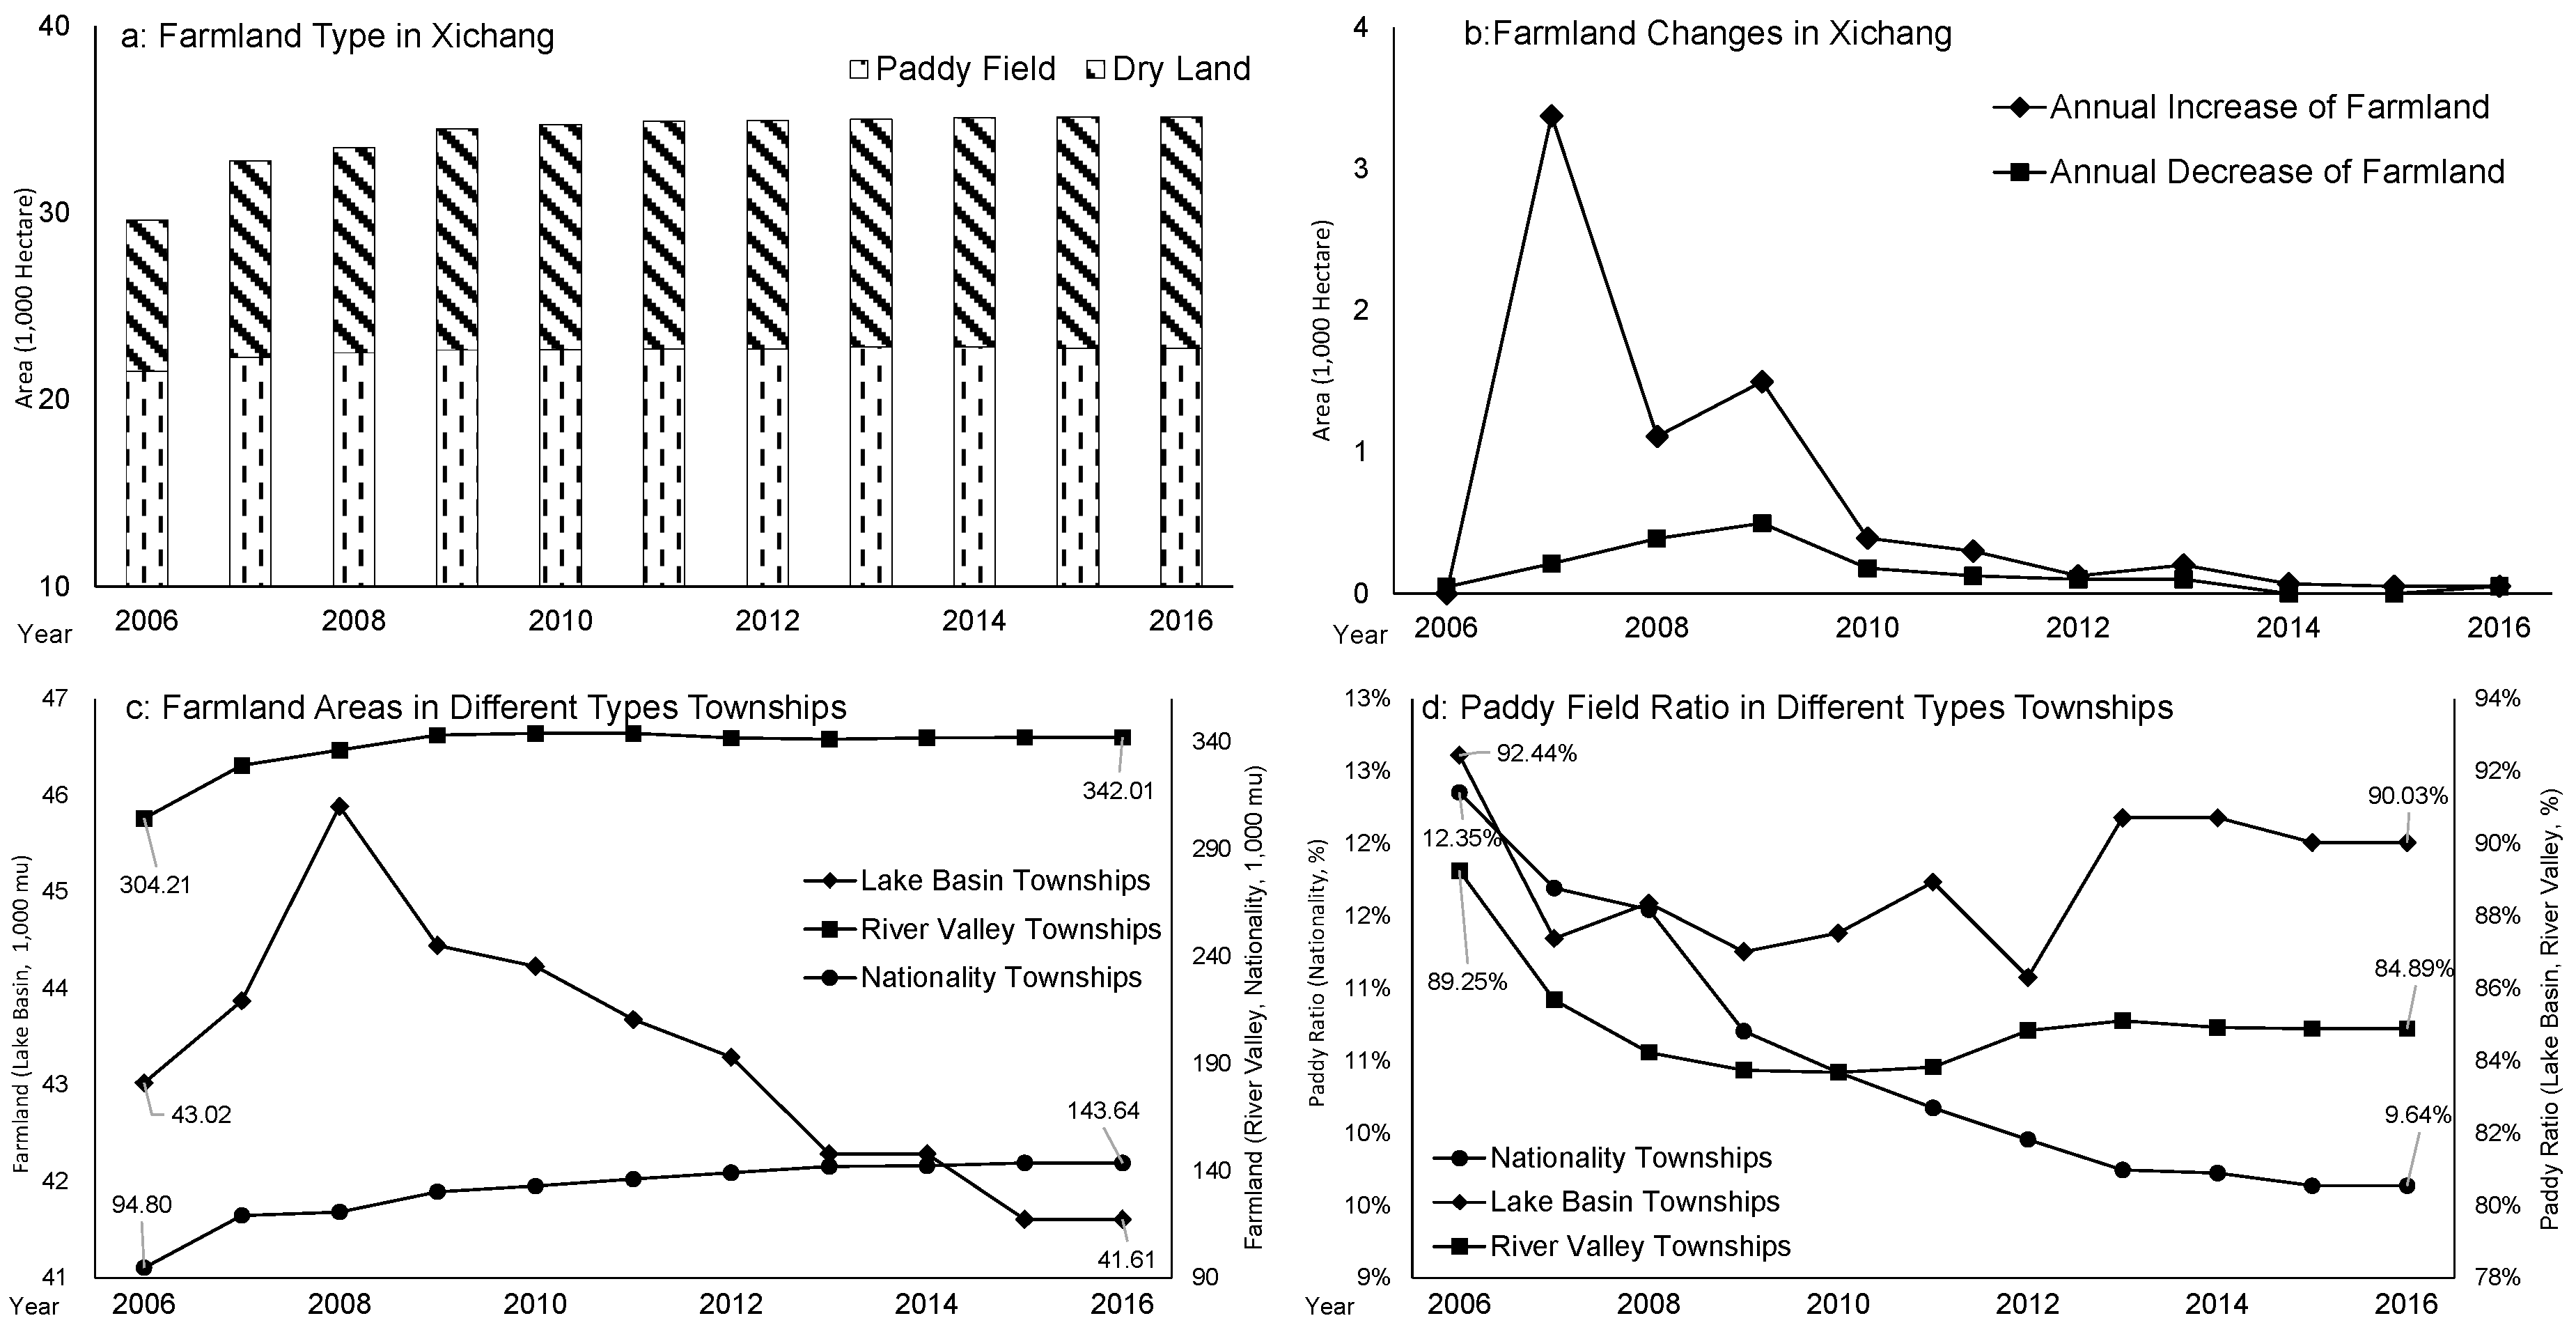
4.1.1. Urbanization of Land

Using Xichang land-use data from 2005, 2010 and 2015, the trends and characteristics of land-use change in the past 10 years are shown (Figure 3). During this period, urban construction land increased significantly, from 16.88 km2 to 32.66 km2, with an annual growth rate of 9.35%. The proportion of urban construction land to the territory area increased from 0.64% to 1.23%, with 8.8 km2 of forests and some grasslands and rural settlements converted into urban areas. At the same time, farmland also increased (18.43%), and neocultivated land was mainly concentrated on the sides of the Anning River valley due to the reclamation of sloped cropland and basic farmland improvement. Comparing yearly changes in farmland (Figure 4a,b), farmland increased rapidly from 2006 to 2010, and the trends became more stable after 2012. The increased farmland was mainly dry land, and paddy fields remained stable. Although the farmland was dominated by paddy fields, the proportion of dry land to farmland increased from 27.33% in 2006 to 35.21% in 2016. By township, the farmland of all townships showed a significant growth trend in 2006–8. After 2008, the farmland areas of the river valley townships remained stable, while the farmland areas of the nationality townships increased slowly year by year. In contrast, the farmland areas in the lake basin townships had fallen sharply. These changes show that urban expansion led to farmland reduction in the lake basin townships, while farmland reclamation in the nationality mountain areas was still active. The type of farmland was also changing. The ratio of paddy fields in all townships decreased, especially in the nationality mountain areas. Since the paddy fields were almost all planted with rice, this change can be understood as the proportion of food crops also decreasing. Overall, the area of urban construction land and farmland increased from 2005–16, while the area of ecological land such as forest and grasslands decreased, indicating that the urbanization of Xichang has obviously changed the land use and farmland structure in the region, and will further affect agricultural cultivation in the region.

4.1.2. Urbanization of the Population

In 2016, the resident population of Xichang was 775 thousand, an increase of 17.25% compared with the population in 2006. The rural population in 2016 was 452.6 thousand, an increase of 9.75% compared with that in 2006. From 2006–16, the urbanization rate of the resident population increased from 47.62% to 57.57%, an increase of 9.95% (Figure 5). From the perspective of change trends, the resident population growth rate was fastest from 2009–11 and 2015–16, but the rural population had a gradual growth rate. Rural labor increased, with a growth rate of 10.24%, which was higher than that of the rural population. However, agricultural labor increased with a gradual growth rate of only 3.5%, which was significantly lower than those of the rural population and labor. The ratio of agricultural labor to rural labor also decreased, from 81.68% in 2006 to 76.67% in 2016, a decrease of 5.01%. Overall, the urban population increased rapidly, with a large number of rural laborers migrating to urban and non-agricultural employment from 2006–16. At the same time, the proportion of agricultural labor continued to decline, indicating that urbanization caused rural laborers to switch from agricultural to non-agricultural employment. However, agriculture remained a major employment option for rural laborers.

4.2. Presentation: Agricultural Cultivation Restructuring

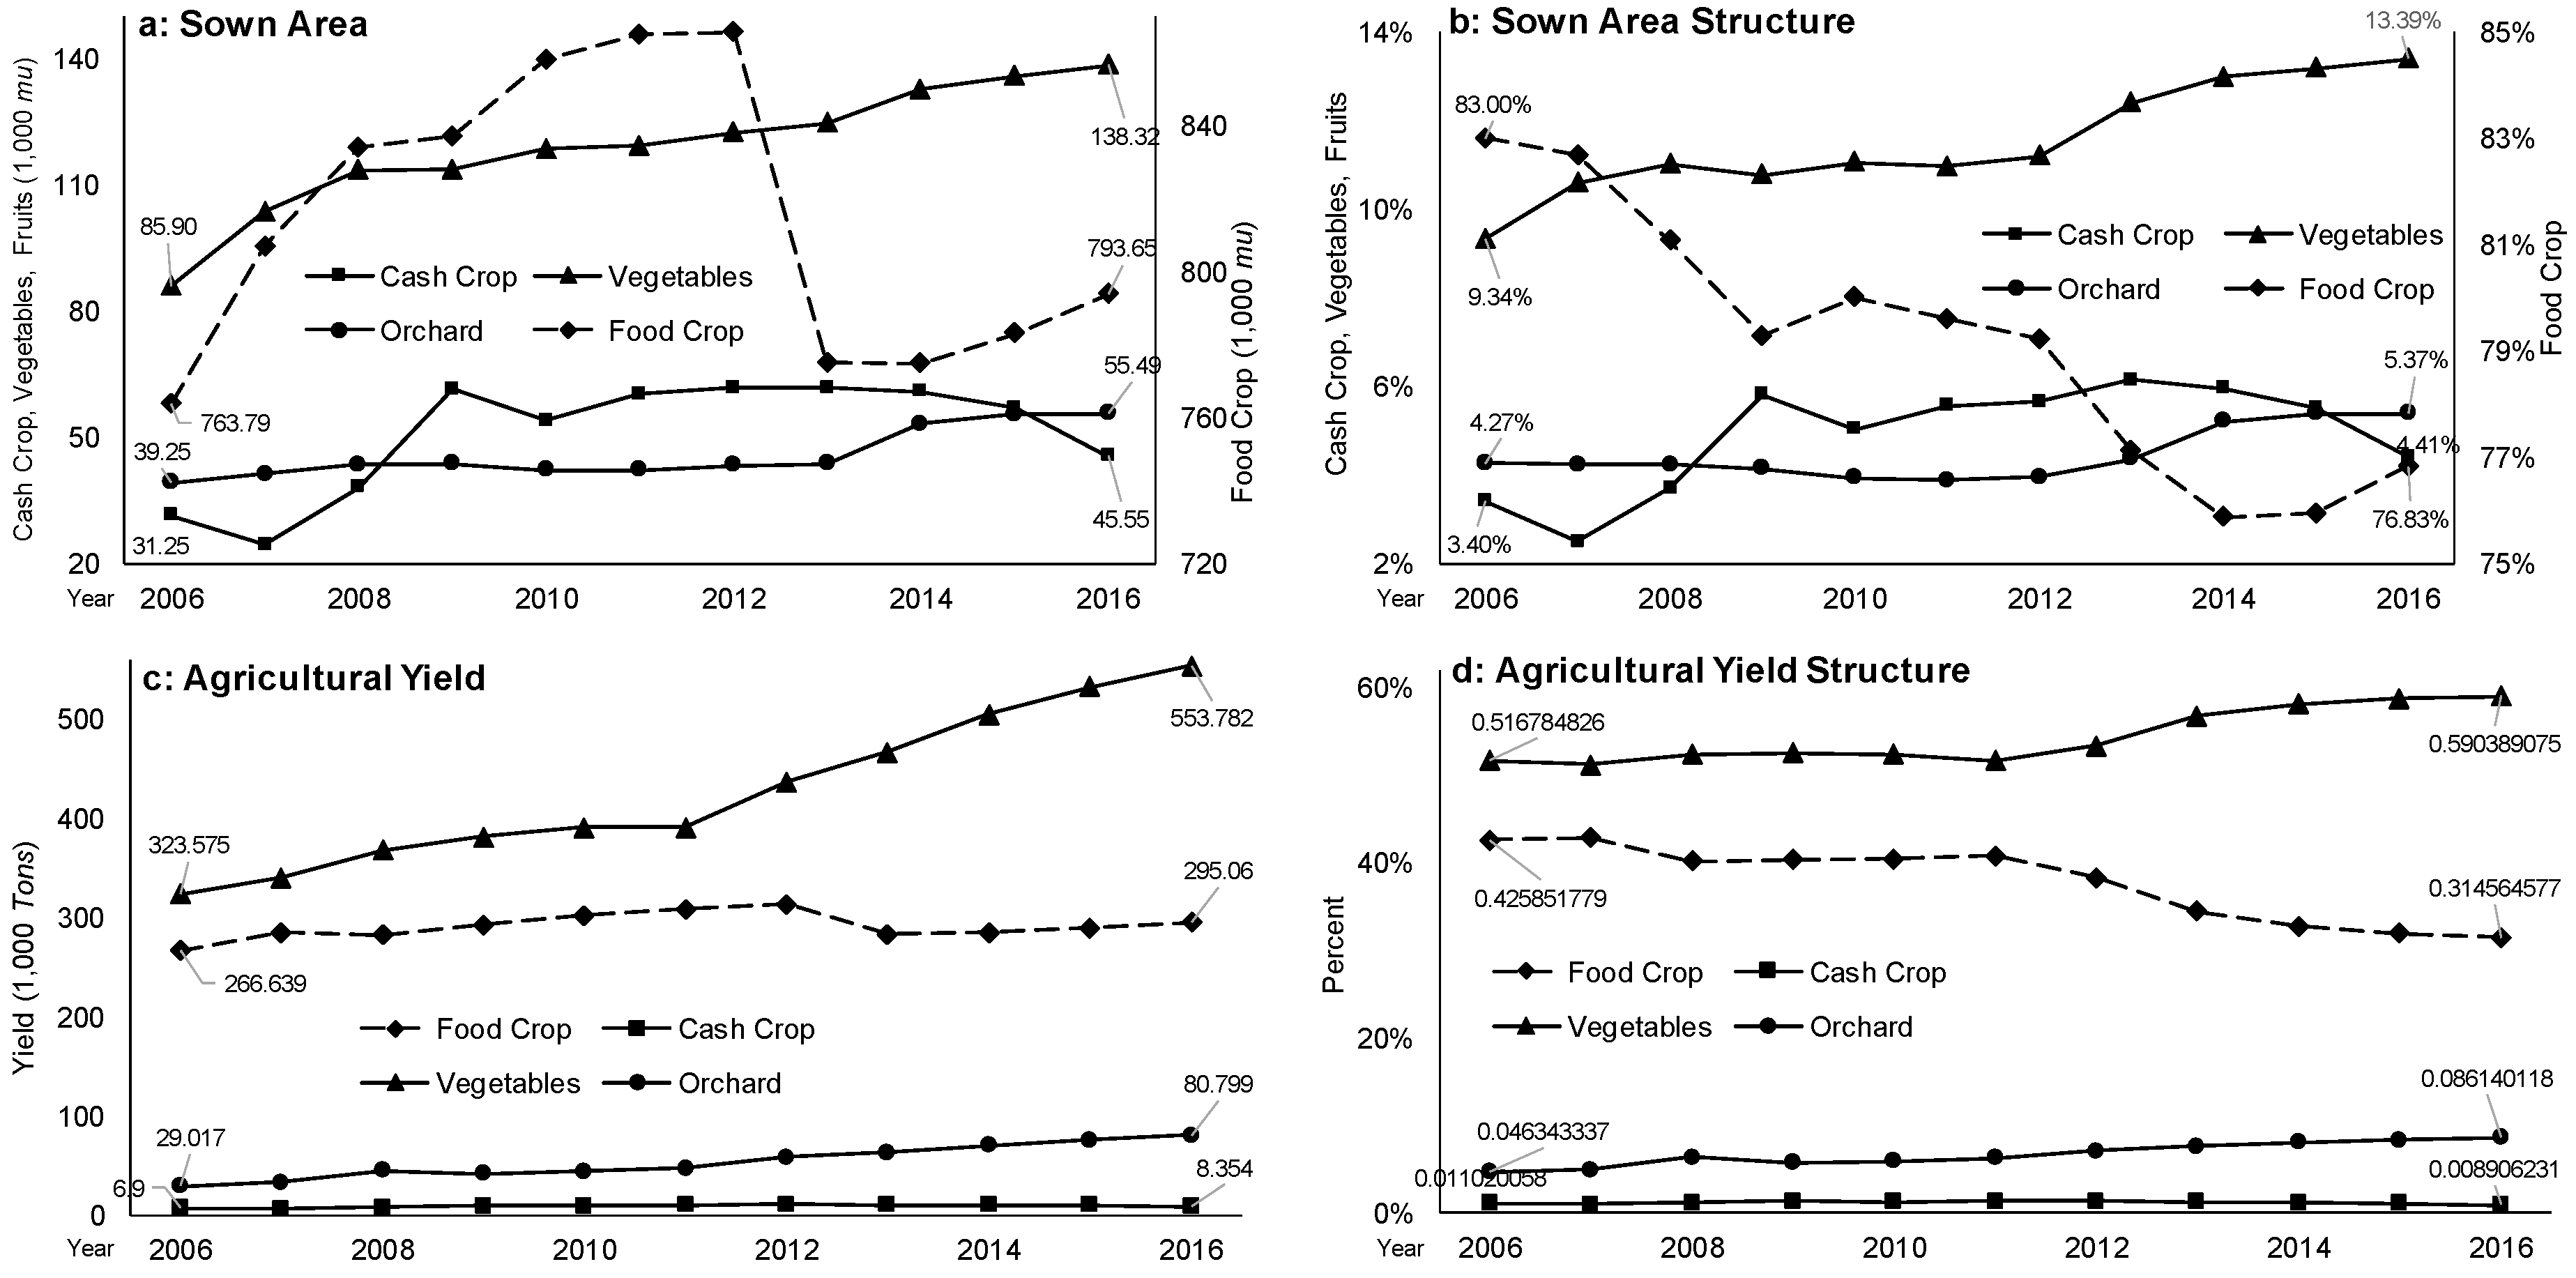
4.2.1. Changes in Agricultural Cultivation

The agricultural cultivation structure was dominated by food crops in Xichang, followed by vegetables, cash crops and orchards (Figure 6). From 2006 to 2016, the planting area of food crops first increased and then decreased, and the proportion of plantings decreased overall. At the same time, the area and proportion of vegetable planting steadily increased, and the proportion of the planted area to the total planted area increased from 9.34% to 13.39%. The planting area and proportion of cash crops fluctuated greatly, being fast in 2007–9 and declining slightly after 2010. From 2006–16, the orchard planting ratio increased by 1.1%. Comparatively, the growth rate of vegetables was the most significant, and the growth rate of economic crops and orchards was small and fluctuated; however, food crops increased slightly, but their proportion decreased significantly.
In 2006–16, the yields of food crops, cash crops, vegetables and orchards showed an increasing trend in Xichang, while the growth trend of vegetables and orchards was the most significant, with a slight increase in food and cash crops. In terms of yield structure, the vegetable yield accounted for the largest proportion, followed by food crops, orchards and cash crops. The yield structure trends for, food crops and vegetables changed significantly. In the past 10 years, the proportion of food crops decreased by 11.13%, while that of vegetables increased by 7.36%. In contrast, orchard yield increased by 3.98% in 10 years, while the yield of cash crops decreased by 0.21%. Although the sown area and crop yields were affected by the growing season, species differences, farming methods, climate, markets, etc., the changes in agricultural cultivation structure indicated that the proportion and importance of food crops decreased, while those of vegetables and orchards increased, especially for vegetables. This finding shows that agricultural cultivation has gradually changed from subsistence agriculture to commercial agriculture in Xichang.

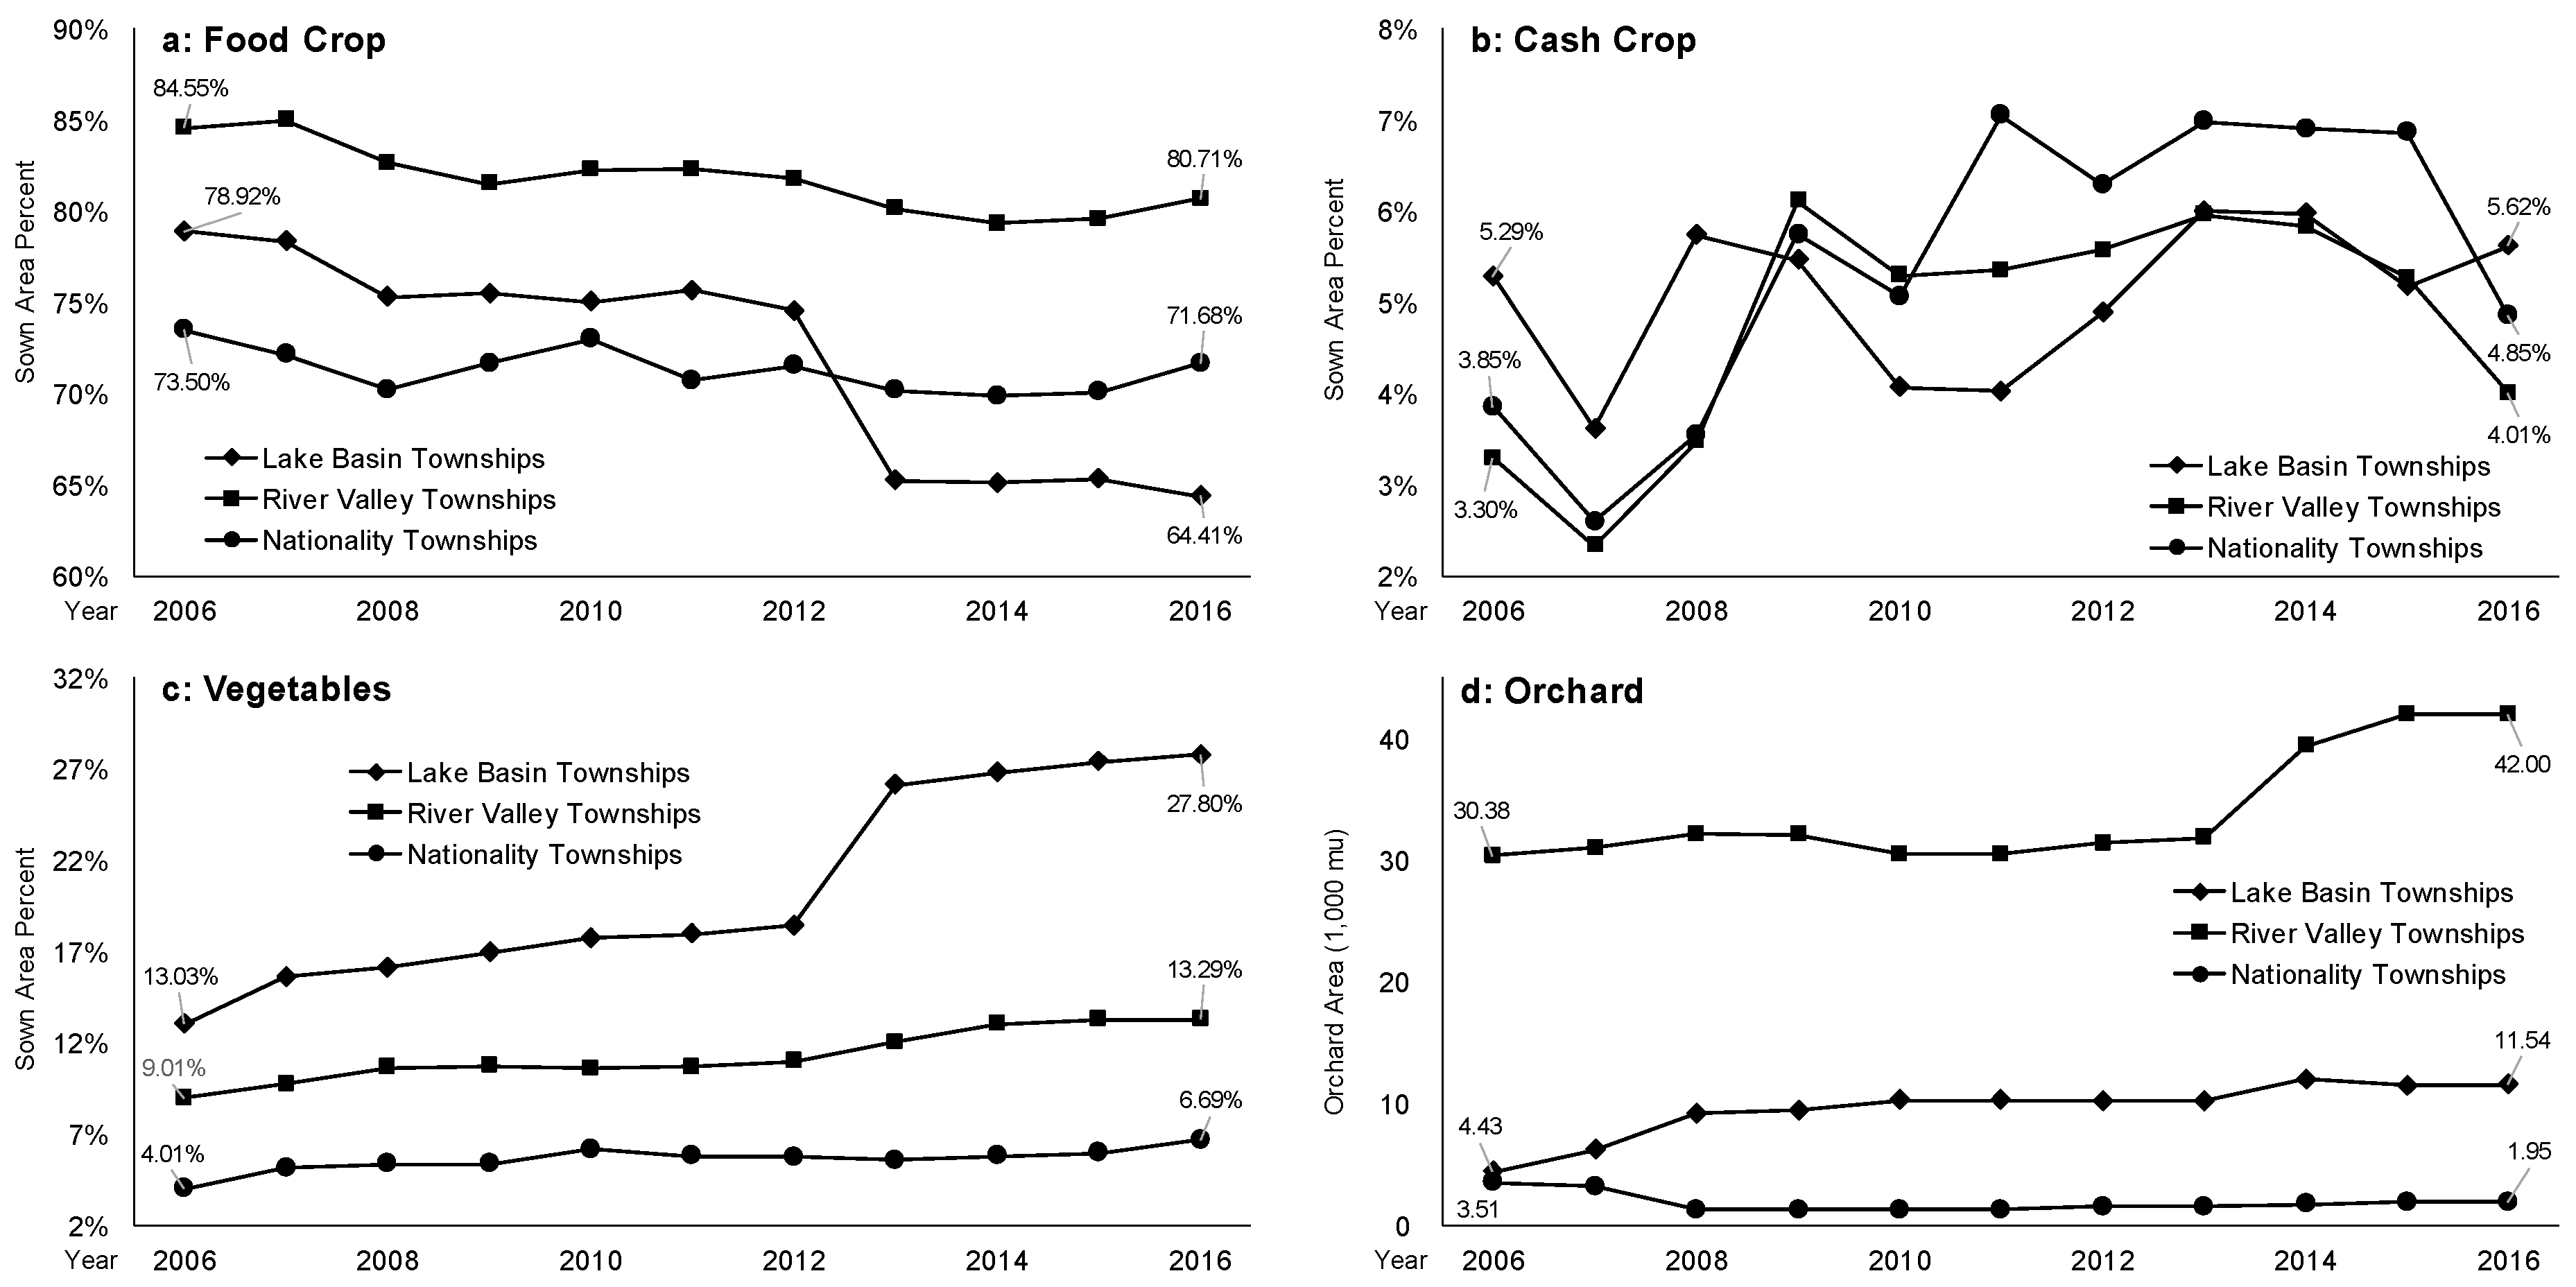
4.2.2. Regional Differences in Agricultural Cultivation

Based on the statistics of the yearly ratio of food crops, cash crops, vegetable sown area and orchard area in the various township zones (Figure 7), the changes to the agricultural cultivation structure significantly varied in the township zones. Specifically, the ratio of food crops decreased in all townships, while the lake basin townships had the largest decline, reaching 14.51%. Food crops accounted for the highest proportion in the river valley townships, and their decline rate was similar to that of the nationality townships. The proportion of cash crops was low, with similar fluctuation trends in all townships. As cash crops are vulnerable to market price fluctuations, their sown ratio was highly volatile. The sown ratio of vegetables was second only to that of food crops, and its yield was higher than that of food crops. The sown ratio of vegetables increased in all townships, and the lake basin townships had the largest increase, reaching 14.77%. In contrast, the river valley and nationality townships showed slight increases of only 4.28% and 2.58%, respectively. The orchard area varied greatly in the township zones. The orchard areas of the lake basin and river valley townships increased, especially the river valley townships, reaching 38.73%, but the nationality township decreased (44.44%). The lake basin townships had the most significant changes in food crops and vegetables, and the river valley townships had significant changes in orchards, indicating that the trends in food crops, vegetables and orchards were affected by structural factors with regular and regional differentiation. In summary, the agricultural cultivation structure showed a decline in food crops and an increase in vegetables and orchards in Xichang from 2006–16.
Figure 8 further compares the differences in crop yield share structures—the proportion of single crop yield (Kg) in total of all the crop yield (Kg)—in different township zones. Overall, the yield shares of food crops and cash crops decreased, the share of orchards increased significantly, and the yield share of vegetables increased slowly. Compared within township zones, the agricultural yield of the river valley townships occupied most of the agricultural yields of Xichang, especially those of food crops and vegetables. It can be seen that the river valley townships are the main agricultural cultivation areas in Xichang. Comparing the crop yield trends in different township zones, the crop yield share structure of the river valley and lake basin townships changed significantly. The yield shares of food crops and cash crops decreased significantly in the river valley townships, while the yield shares of orchards and vegetables increased. The trends in the lake basin townships were also similar to those in the river valley townships, but the changes were not as great. The yield share of food crops in the nationality townships decreased, the yield share of vegetables increased, and the yields of other crops changed little. In short, the change in yield structure is consistent with the crop sown area structure, indicating that Xichang was in the process of agricultural restructuring that affects planting scale and crop yield.

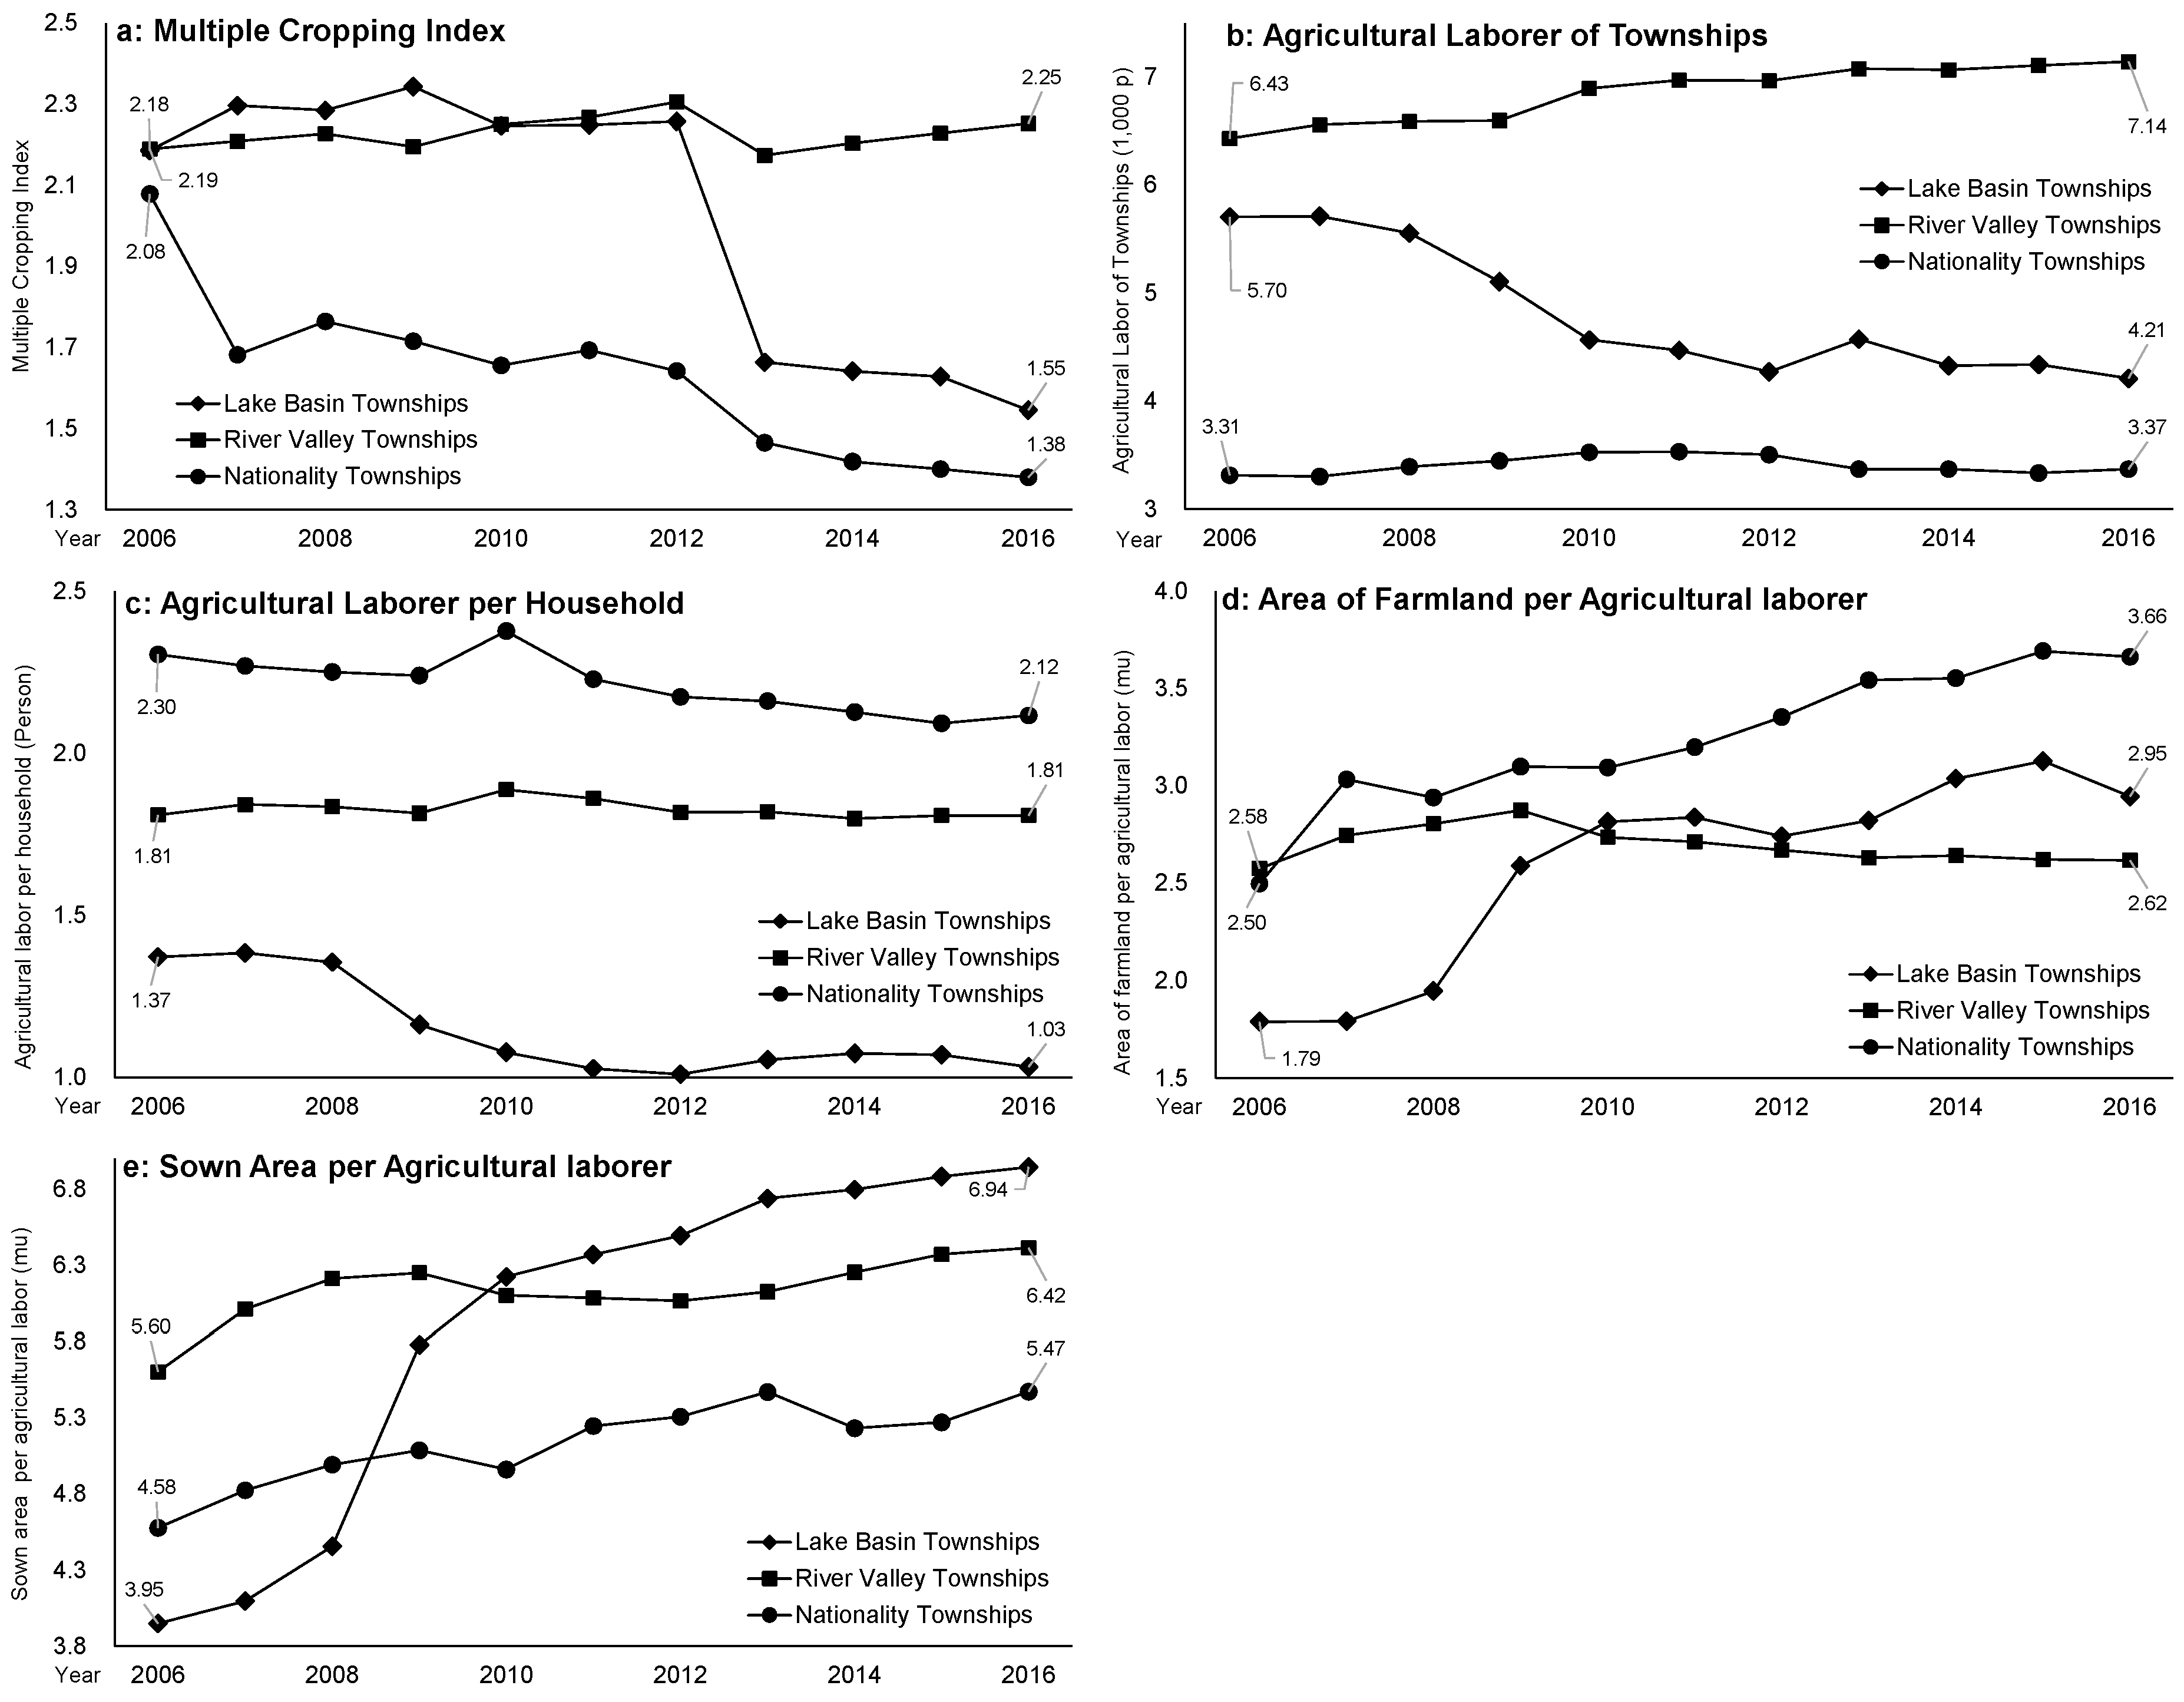
4.2.3. Agricultural Intensification

The multiple cropping indices of the nationality (33.65%) and lake basin (29.22%) townships showed significant downward trends, while those in the river valley townships rose steadily (Figure 9a). The multiple cropping indices, indicating the intensification of regional agricultural cultivation, of all townships were greater than 1, showing that farmland was cultivated with a certain degree of rotation. In terms of change trends, the river valley townships were the nesting zone for agricultural cultivation, with gradual increases in the intensification degree in Xichang, while intensification in the nationality and lake basin townships was significantly reduced. Overall, the number of agricultural laborers per household gradually decreased, while the farmland and sown area per agricultural laborers increased. By township zones, the total number and agricultural laborers per household in the lake basin townships showed the largest reduction, with the highest increments of farmland and sown area per agricultural laborer, followed by the nationality townships (Figure 9). From 2006–16, although the total number of laborers increased slightly, the number of agricultural laborers per rural household in the river valley townships remained stable, indicating that there was no large-scale agricultural labor outmigration. The farmland per agricultural laborer increased significantly, with only a slight increase in the sown area per agricultural laborer in the river valley townships. The sown area per agricultural laborer in the river valley townships was significantly greater than that in the nationality townships. The growth rate in the lake basin townships was the fastest, and the sown area per agricultural laborer in the lake basin townships was greater than that in the river valley and nationality townships by 2016. Although the total number of agricultural laborers of the nationality townships had increased, the agricultural laborers per household decreased slightly, suggesting that there was a small-scale rural labor outmigration.
To a certain extent, the sown area per agricultural laborer represents mechanization and the farming efficiency of agricultural labor, and the multiple cropping index represents the intensity of agricultural farming, and both can be regarded as a representation of agricultural intensification. By comparing the various township zones, the agricultural laborers in the nationality and lake basin townships largely out-migrated, and the intensity of agricultural development was gradually reduced; however, agricultural intensification slightly improved. Agricultural intensification in the river valley townships gradually increased due to stable agricultural farming intensity and labor. Overall, the migration of agricultural laborers affected agricultural intensification and the reclamation intensity to some extent.

4.3. Linkages: Rural Migration and Agricultural Restructuring

4.3.1. Explanation of Changes for Agricultural Cultivation

The determinants of agricultural cultivation structure changes under urbanization were further explored. This paper was based on panel data from 37 townships in Xichang from 2006–16; the sown area of food crops, cash crops, vegetables and orchard area were the dependent variables, and 12 indicators, including township zones, urbanization, labor, and agricultural intensification, were selected as the independent variables. Four multiple linear regression models were constructed to explain changes in crop sown area. Based on the F-test and Hausman test of the time series panel data, the fixed effects regression was used for the food crop, vegetables, and orchard models, and the random effects regression was used for the cash crop model. The results showed that all of the regression models were significant at the 0.05 confidence level (Table 2). The regression model for vegetables had the highest fitting degree (R2 = 0.939), while the regression model for orchards had a relatively low fitting degree. The regression models of food crops, cash crops, vegetables and orchards had ten, seven, ten, and eight independent variables, respectively, which were significant (p < 0.05).
The township location, agricultural labor, agricultural output value, and farmland per household variables had significant effects on the planting areas of food crops, cash crops, vegetables and orchards (p < 0.01), indicating that basic input factors, such as zones, labor and farmland, had key impacts on the agricultural cultivation structure. However, differences in the regression models of different types of crops were also significant. The impacts of urbanization and rural migration on cash crops were weak, while the impacts on food crops and vegetables were significant. The per capita net income of farmers had a significant impact on vegetables, and the regression coefficient of the agricultural output value in the vegetable model was also larger than those in the other three regression models, indicating that the significance of vegetable cultivation scale to regional economic development and farmers’ incomes was greater than the cultivation of other crops, and it stimulated the expansion of vegetables planting scale. Meanwhile, the lag of impacts of agricultural output value on sown area needs to be noted, especially in the process of agricultural restructuring and transformation. Topographic relief was only significant in the regression models of food crops, vegetables and orchards, indicating that cash crops have better topographical adaptability. Agricultural labor per household was only significant for vegetables, and farmland per agricultural laborers and multiple cropping index had no significant effect on vegetables; that is, the labor density of vegetable cultivation was greater than those of other crops. Overall, the basic input factors had significant impacts on the agricultural cultivation structure, but the input densities and sensitivities of different crops varied. However, there were clearly cross-relationships and multiway influences between different variables, and their linkages require further analysis.

4.3.2. Linkages of Rural–Urban Transition and Agricultural Restructuring

To further identify the impact linkages of rural–urban transitions and agricultural restructuring, this paper conducted an exploratory path analysis of rural migration and agricultural cultivation using SEM. Based on the above analysis, six latent variables in the path analysis were proposed: urbanization and rural migration, location, agricultural intensification, agricultural planting structure, agricultural yield and rural economic development. According to the meaning of each latent variable, observation variables (Table 1) were selected to represent the latent variables, to quantitatively express the path effect between the latent variables. Finally, Amos 24.0 was used to construct a linkage framework of rural–urban transition and agricultural restructuring (Figure 10). In the framework, the elliptic variables are the comprehensive latent variables, the rectangular box is the observation variable, and the circle is random error.
In Amos, the maximum likelihood (ML) method was used to estimate the coefficients of the latent variables in the structural equation model. The fitting index (Table 3) of the model was obtained and compared with its corresponding reference value. The results showed that the fit of the tested model was significant. It was possible to express the latent variables with various observed variables, and impact relationship evaluations were performed based on linkages of the latent variables.
As shown in Figure 11 and Table 3, the significance of the hypothetical causal linkages was tested. The direct effect of urbanization and rural migration on agricultural intensification was 0.33, indicating that rural migration was conducive to agricultural intensification and improving agricultural cultivation efficiency. For example, the migration of rural laborers increased the per capita farmland and further improved the multiple cropping index; immigrant remittances were conducive to the mechanization and chemicalization of agriculture. The direct effect of agricultural intensification on the agricultural planting structure was 0.11, and agricultural intensification improvements were beneficial to increase the yields of vegetables and orchards, which also reduced the proportion of food crops (Figure. 6). The path coefficient of location on agricultural intensification was −0.59, indicating that a rough terrain hindered agricultural intensification. Namely, agricultural intensification in the nationality townships was weaker than that in the river valley townships, and agricultural intensification in the townships located distant from the urban center was not as great as that in the townships located close to the urban center. However, the direct effect of location on the agricultural planting structure was 1.14, indicating the importance of basic location and geographical environment to agriculture. The direct effect of agricultural planting structure on the agricultural yield was 0.98, indicating that this effect was direct and decisive. The direct effect of agricultural yield on rural economic development was 0.62, indicating that an increase in agricultural yield could increase the agricultural output value and promote the per capita net income of farmers. Furthermore, rural economic development promoted the migration of rural labor and thus promoted regional urbanization (0.37).
The direct effects between the latent variables verified the complex and significant impact linkages between rural–urban transition and agricultural restructuring. In the linkages, urbanization and rural migration promoted changes in the agricultural planting structure through agricultural intensification improvement. Changes in the agricultural planting structure promote rural economic development through agricultural yield, thereby promoting the development of rural labor migration and urbanization. The circular linkages indicated that the influence of urbanization on regional agriculture was a chain-type linkage. By changing different economic and social elements, the various input factors of agriculture triggered extensive and profound changes in the agricultural cultivation system that further affected the rural economy and, in turn, affected urbanization and labor migration. In the cycle linkages, differences in zones made the change trend in the agricultural planting structure have regional characteristics and differences, indicating that the relationships between urbanization and agriculture were constrained by the geographical environment and resource endowments.

5. Discussion

5.1. Regionality of Linkages between Rural Migration and Agricultural Restructuring

The impact of zone differences on the linkages between rural migration and agricultural restructuring was significant. The lake basin townships were close to the downtown area, and as a result, although a large number of rural laborers out-migrated, the per capita farmland and sown area of the agricultural laborers increased rapidly from 2006–16. This result indicates that agricultural mechanization improved the agricultural cultivation efficiency in the lake basin townships. The influence of rural migration can be divided into two aspects. First, although urban expansion occupies some farmland, rural labor migration results in per capita farmland increases, and therefore, large-scale mechanical farming becomes possible. Second, migration remittances can support agricultural investment to provide capital for mechanization and chemicalization [13]. In this context, the agricultural cultivation structure was also significantly affected by urbanization in the lake basin townships, reflecting the demand for agricultural cultivation and the self-adaptation of commercialization agriculture in the market economy. Although the nationality townships were affected by urbanization, the impact was not as strong as that in the lake basin areas. Although the proportion of food crops grown in nationality townships decreased, the proportion of vegetables and orchards gradually increased. Similarly, the proportion of cash crops increased significantly, but volatility was extremely strong. This finding shows that urbanization and rural migration did not effectively promote the commercialization and marketization of agricultural cultivation in nationality townships but still improved agricultural cultivation efficiency to some extent. The lake basin and nationality townships differed from the river valley townships, although the river valley townships were affected by urbanization and rural migration, the increases in farmland and sown area per agricultural laborer in the river valley townships were small, indicating that rural migration not only failed to affect the agricultural labor supply in the river valley townships, but also expanded the cultivation scale. In terms of the agricultural cultivation structure, orchards in the river valley increased most, and vegetables and food crops also changed, but the changes were not as significant as those in the lake basin townships. This finding shows that rural migration significantly improved the agricultural cultivation efficiency in river valley townships and promoted agricultural restructuring.
Although the lake basin, river valley and nationality townships were all under the unified rural–urban system and had the same urbanization and rural migration challenges, the impacts on agricultural restructuring in these areas were not consistent. Geographical location differences determined the diversity of adaptation processes in the different types of townships in the face of urbanization and rural migration, including rural migration scale, market distance, farmland quality, and topography. Based on the distance between the townships and the downtown area, the cultivation scales of different types of crops changed gradually; vegetables were followed by orchards, food crops and cash crops (Figure 12). Vegetables have short growth cycles with high efficiencies and can quickly supply urban needs. Orchards and food crops need to be planted on large scales, and therefore, the scale of planting in the river valley was the highest. Cash crops require special geographic conditions and are highly affected by market fluctuations, and the planting scale in the nationality township was highest. This kind of Von Thünen’s agricultural pattern is an adaptive process of agricultural cultivation to rural migration and urbanization [35], and it is also the optimal allocation for agriculture commercialization under a market economy.

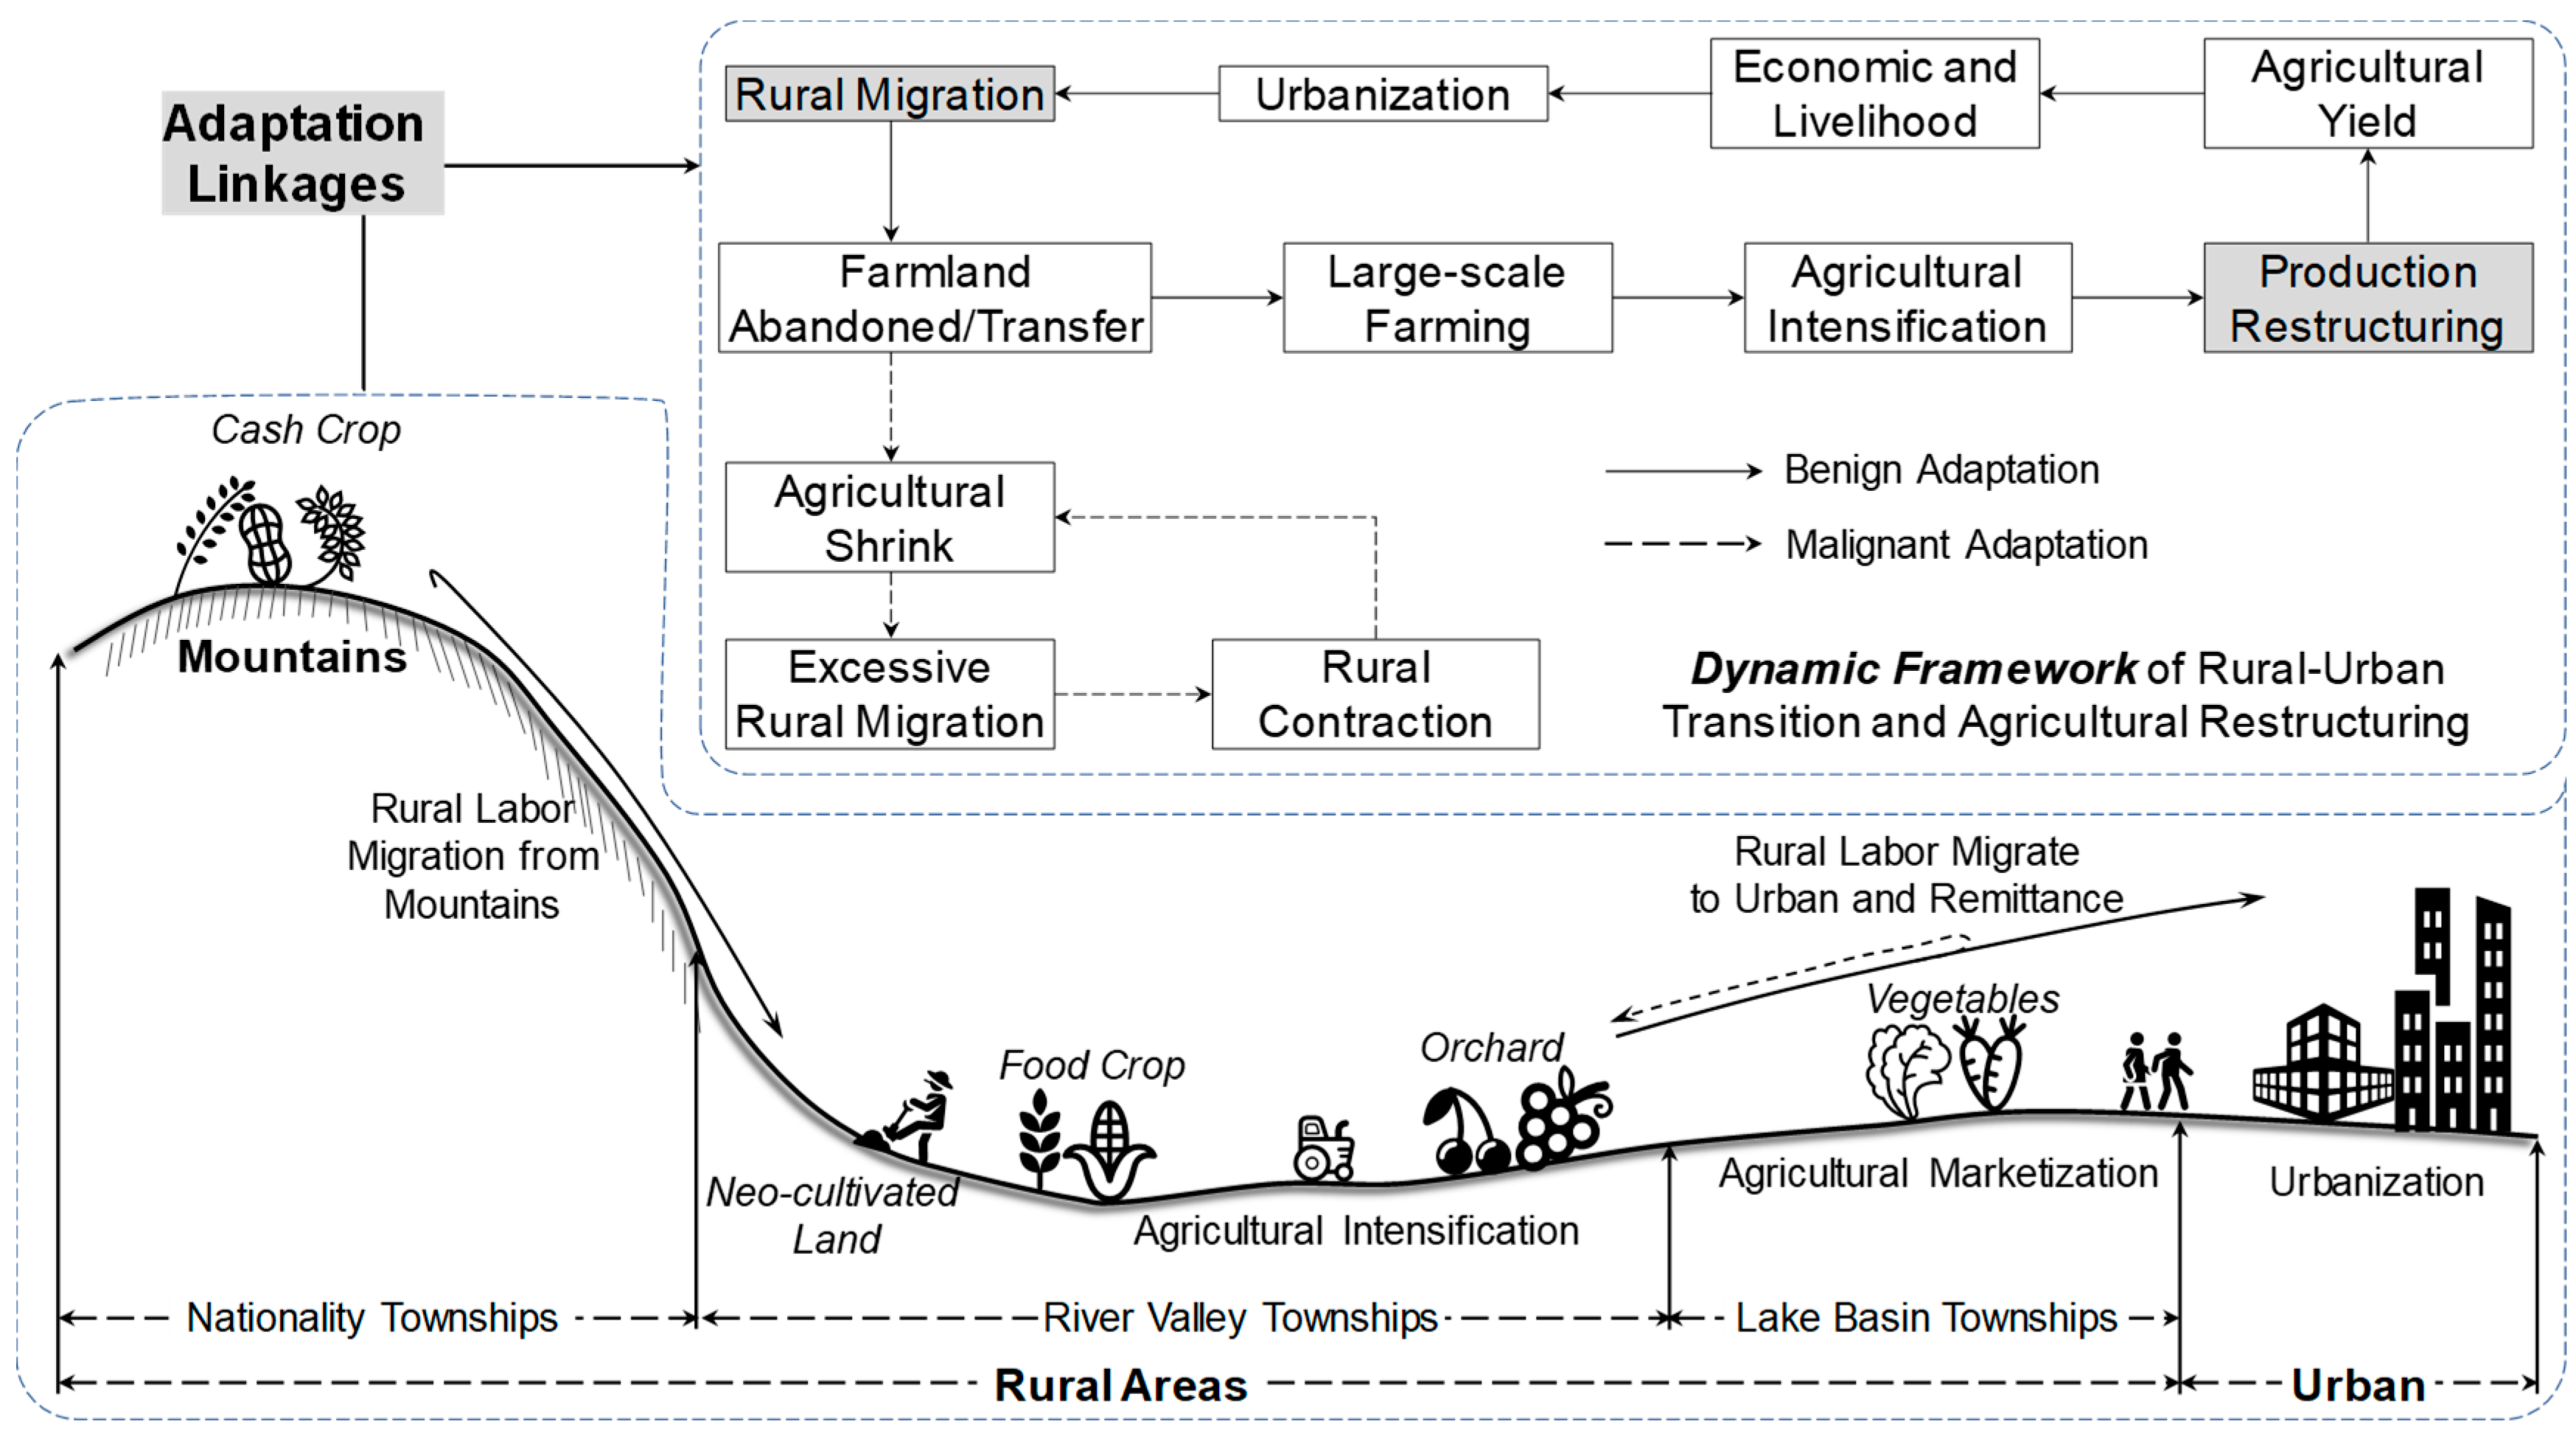
5.2. Rural-Urban Transition and Agricultural Restructuring: Adaptation Linkages

Although research studies on the impact of rural migration on rural–urban transitions and agricultural restructuring have reached a consensus regarding macro trends and general principles, many different conclusions in various microstudies have been drawn, mainly due to regional differences [11,20]. In different zones, the agricultural structure tends to exhibit different adaptation processes for urbanization and rural migration due to resource endowments, social culture, etc. [13]. In rural areas that are close to urban areas, urbanization and rural migration reduce farmland through farmland encroachment; similarly, faraway mountainous areas are reduced by farmland abandonment. However, rural migration supports the improvement of the agricultural cultivation scale and technological efficiency in agricultural agglomeration areas, thereby increasing the farmland area [17]. Although agricultural intensification and mechanization can compensate for the loss of farming productivity caused by labor outmigration to a certain extent, the compensation level varies in the different regions [1,18]. In the lake basin townships, rural migration led to a decline in the food yield, but these areas supplied large quantities of vegetables and rural laborers to the urban and nonagricultural sectors. In river valley townships, mountain migration and immigration remittances boost the food and orchard yields [13]. From a cross-regional perspective, rural migration indirectly coordinated agricultural cultivation in the different zones, thus ensuring food security throughout the region.
Therefore, under the dynamic framework of rural–urban transition and agricultural restructuring, agricultural cultivation showed diversified adaptation linkages for rural migration. Urbanization promoted rural migration, which led to farmland abandonment or transfer and in turn led to two distinct adaptation linkages (Figure 12). On the one hand, farmland transfer via rural migration made large-scale farming possible and promoted agricultural intensification and agricultural restructuring. As a result, agriculture was better adapted to the requirements of urbanization and a market economy, thus laying a foundation for farmers’ livelihoods and rural development. In turn, this foundation promoted urbanization and rural migration, and a benign adaptation circle formed under the dynamic framework. On the other hand, rural migration resulted in farmland abandonment, and reductions in labor and farmland led to the gradual shrinking of agricultural cultivation. As a result, more rural outmigration occurred, which further led to rural contraction; in turn, agricultural shrinkage was aggravated, and excessive labor losses were incurred. Ultimately, the process was caught in a malignant adaptation circle. However, this scenario is conducive to rural biodiversity and ecological welfare. In developing countries, smallholder agricultural business is still the foundation of the rural economy, but fragmented subsistence smallholder cultivation cannot meet the demands for agriculture in urbanization and a market economy [6,23,36]. Under the impetus of rural migration, fragmented smallholder agriculture can be integrated and restructured with appropriate rural policies. Moreover, agricultural cultivation will gradually shift to scale-planting, specialization and commodification, thereby releasing surplus rural laborers and promoting rural–urban transitions and coordination development. However, when zonal conditions and rural policies fail to meet agricultural restructuring requirements, rural migration will weaken agriculture and rural development.

6. Conclusions

Taking Xichang in the mountains of Southwest China as an example, this paper analyzed the background, presentation and linkages of rural migration and agricultural restructuring based on statistical data. The adaptation linkages and impact relationships between rural–urban transitions and agricultural restructuring were revealed using SEM with latent variables. Rural migration under urbanization led to changes in farmland, thereby promoting regional agricultural intensification and affecting agricultural cultivation restructuring; thus, agricultural yield and economic development improved and ultimately promoted urbanization and rural migration. In the cyclic adaptation linkages, zone differences had critical impacts on the relationships between rural migration and agricultural cultivation structures.
Studies have shown that rapid urbanization in Xichang triggered rural labor migration and the expansion of urban and the neocultivated land on both sides of the river valley from 2006–16. Although agriculture was still the main source of rural labor employment, many rural migrations caused the proportion of agricultural labor to the total rural labor to decline yearly, especially in the lake basin townships. In 2006–16, the proportion of food crops in Xichang declined, while the proportion of vegetables, orchards and cash crops increased, especially vegetables. The agricultural cultivation structure experienced the most significant change in the lake basin townships, while the river valley township had the greatest agricultural intensification. The regression analysis results of the agricultural cultivation structure showed that the basic input factors, such as farmland and labor, had significant impacts, but the intensity and sensitivity of agricultural cultivation varied for the different crops. A comprehensive analysis showed that rural migration weakened agricultural cultivation in the lake basin and nationality townships but enhanced agricultural cultivation in the river valley townships. Based on urbanization, rural migration, agricultural intensification, cultivation structure and economic development, the adaptation linkages between rural migration and agricultural restructuring were established. Chain-type changes and adaptation processes of rural–urban transition and rural reconstruction in developing countries along with linkage structures and regional differences were revealed, thus providing scientific references for regional rural policies and food security.

Author Contributions

Conceptualization, S.Z. and W.D.; Data curation, S.Z., L.P. and Y.L.; Formal analysis, S.Z. and P.Z.; Investigation, P.Z. and Y.L.; Methodology, S.Z.; Supervision, W.D.; Visualization, S.Z.; Writing—original draft, S.Z.; Writing—review & editing, S.Z., W.D., L.P., P.Z. and Y.L. All authors have read and agreed to the published version of the manuscript.

Funding

This research was funded by the National Natural Science Foundation of China (Grant No.41471469); the National Basic Research Program (973 Program) (Grant No. 2015CB452700).

Acknowledgments

We thanks to the anonymous reviewers for constructive comments leading to significant improvement of this article.

Conflicts of Interest

The authors declare no conflicts of interest.

References

  1. Liu, J.; Xu, Z.; Zheng, Q.; Hua, L. Is the feminization of labor harmful to agricultural production? The decision-making and production control perspective. J. Integr. Agric. 2019, 18, 1392–1401. [Google Scholar] [CrossRef]
  2. Chen, J.; Wang, Y.; Wen, J.; Fang, F.; Song, M. The influences of aging population and economic growth on Chinese rural poverty. J. Rural Stud. 2016, 47, 665–676. [Google Scholar] [CrossRef]
  3. Wang, S.X.; Yu Benjamin, F.U. Labor mobility barriers and rural-urban migration in transitional China. China Econ. Rev. 2019, 53, 211–224. [Google Scholar] [CrossRef]
  4. Chen, M.; Gong, Y.; Lu, D.; Ye, C. Build a people-oriented urbanization: China’s new-type urbanization dream and Anhui model. Land Use Policy 2019, 80, 1–9. [Google Scholar] [CrossRef]
  5. Nguyen, D.L.; Grote, U.; Nguyen, T.T. Migration, crop production and non-farm labor diversification in rural Vietnam. Econ. Anal. Policy 2019, 63, 175–187. [Google Scholar] [CrossRef]
  6. Samberg, L.H.; Gerber, J.S.; Ramankutty, N.; Herrero, M.; West, P.C. Subnational distribution of average farm size and smallholder contributions to global food production. Environ. Res. Lett. 2016, 11, 124010. [Google Scholar] [CrossRef]
  7. Chen, R.; Ye, C.; Cai, Y.; Xing, X.; Chen, Q. The impact of rural out-migration on land use transition in China: Past, present and trend. Land Use Policy 2014, 40, 101–110. [Google Scholar] [CrossRef]
  8. Qin, H.; Liao, T.F. Labor out-migration and agricultural change in rural China: A systematic review and meta-analysis. J. Rural Stud. 2016, 47, 533–541. [Google Scholar] [CrossRef] [Green Version]
  9. Siciliano, G. Urbanization strategies, rural development and land use changes in China: A multiple-level integrated assessment. Land Use Policy 2012, 29, 165–178. [Google Scholar] [CrossRef]
  10. Robson, J.P.; Berkes, F. Exploring some of the myths of land use change: Can rural to urban migration drive declines in biodiversity? Glob. Environ. Chang. 2011, 21, 844–854. [Google Scholar] [CrossRef]
  11. Xu, D.; Deng, X.; Guo, S.; Liu, S. Labor migration and farmland abandonment in rural China: Empirical results and policy implications. J. Environ. Manag. 2019, 232, 738–750. [Google Scholar] [CrossRef]
  12. Qian, W.; Wang, D.; Zheng, L. The impact of migration on agricultural restructuring: Evidence from Jiangxi Province in China. J. Rural Stud. 2016, 47, 542–551. [Google Scholar] [CrossRef]
  13. Zhang, S.Y.; Song, X.Q.; Wan, J.J.; Liu, Y.; Deng, W. The Features of Rural Labor Transfer and Cultural Differences: Evidence from China’s Southwest Mountainous Areas. Sustainabilaity 2019, 11, 1522. [Google Scholar] [CrossRef] [Green Version]
  14. Lu, H.; Xie, H.; Yao, G. Impact of land fragmentation on marginal productivity of agricultural labor and non-agricultural labor supply: A case study of Jiangsu, China. Habitat Int. 2019, 83, 65–72. [Google Scholar] [CrossRef]
  15. López-Carr, D.; Burgdorfer, J. Deforestation Drivers: Population, Migration, and Tropical Land Use. Environ. Sci. Policy Sustain. Dev. 2013, 55, 3–11. [Google Scholar] [CrossRef] [PubMed] [Green Version]
  16. Gray, C.L.; Bilsborrow, R.E. Consequences of out-migration for land use in rural Ecuador. Land Use Policy 2014, 36, 182–191. [Google Scholar] [CrossRef] [PubMed] [Green Version]
  17. VanWey, L.K.; Guedes, G.R.; D’Antona, Á.O. Out-migration and land-use change in agricultural frontiers: Insights from Altamira settlement project. Popul. Environ. 2012, 34, 44–68. [Google Scholar] [CrossRef] [Green Version]
  18. Davis, J.; Lopez-Carr, D. Migration, remittances and smallholder decision-making: Implications for land use and livelihood change in Central America. Land Use Policy 2014, 36, 319–329. [Google Scholar] [CrossRef] [Green Version]
  19. Liu, G.; Wang, H.; Cheng, Y.; Zheng, B.; Lu, Z. The impact of rural out-migration on arable land use intensity: Evidence from mountain areas in Guangdong, China. Land Use Policy 2016, 59, 569–579. [Google Scholar] [CrossRef]
  20. Xiao, W.; Zhao, G. Agricultural land and rural-urban migration in China: A new pattern. Land Use Policy 2018, 74, 142–150. [Google Scholar] [CrossRef]
  21. He, X. China’s electrification and rural labor: Analysis with fuzzy regression discontinuity. Energy Econ. 2019, 81, 650–660. [Google Scholar] [CrossRef]
  22. Wang, X.; Shao, S.; Li, L. Agricultural inputs, urbanization, and urban-rural income disparity: Evidence from China. China Econ. Rev. 2019, 55, 67–84. [Google Scholar] [CrossRef]
  23. Abdul-Rahaman, A.; Abdulai, A. Do farmer groups impact on farm yield and efficiency of smallholder farmers? Evidence from rice farmers in northern Ghana. Food Policy 2018, 81, 95–105. [Google Scholar] [CrossRef]
  24. Khan, M.F.; Nakano, Y.; Kurosaki, T. Impact of contract farming on land productivity and income of maize and potato growers in Pakistan. Food Policy 2019, 85, 28–39. [Google Scholar] [CrossRef]
  25. Yang, J.; Wang, H.; Jin, S.; Chen, K.; Riedinger, J.; Peng, C. Migration, local off-farm employment, and agricultural production efficiency: Evidence from China. J. Product. Anal. 2016, 45, 247–259. [Google Scholar] [CrossRef] [Green Version]
  26. Ge, D.Z.; Long, H.L.; Zhang, Y.N.; Tu, S.S. Analysis of the coupled relationship between grain yields and agricultural labor changes in China. J. Geogr. Sci. 2018, 28, 93–108. [Google Scholar] [CrossRef] [Green Version]
  27. McCabe, J.T.; Smith, N.M.; Leslie, P.W.; Telligman, A.L. Livelihood Diversification through Migration among a Pastoral People: Contrasting Case Studies of Maasai in Northern Tanzania. Hum. Organ. 2014, 73, 389–400. [Google Scholar] [CrossRef]
  28. Wan, J.J.; Deng, W.; Song, X.Q.; Liu, Y.; Zhang, S.Y.; Su, Y.; Lu, Y.F. Spatio-Temporal Impact of Rural Livelihood Capital on Labor Migration in Panxi, Southwestern Mountainous Region of China. Chin. Geogr. Sci. 2018, 28, 153–166. [Google Scholar] [CrossRef] [Green Version]
  29. Milan, A.; Ho, R. Livelihood and migration patterns at different altitudes in the Central Highlands of Peru. Clim. Dev. 2014, 6, 69–76. [Google Scholar] [CrossRef] [Green Version]
  30. Warner, K.; Afifi, T. Where the rain falls: Evidence from 8 countries on how vulnerable households use migration to manage the risk of rainfall variability and food insecurity. Clim. Dev. 2014, 6, 1–17. [Google Scholar] [CrossRef]
  31. Loebach, P. Household migration as a livelihood adaptation in response to a natural disaster: Nicaragua and Hurricane Mitch. Popul. Environ. 2016, 38, 185–206. [Google Scholar] [CrossRef]
  32. Gautam, Y. Seasonal Migration and Livelihood Resilience in the Face of Climate Change in Nepal. Mt. Res. Dev. 2017, 37, 436–445. [Google Scholar] [CrossRef] [Green Version]
  33. Zhang, R.; Jiang, G.; Zhang, Q. Does urbanization always lead to rural hollowing? Assessing the spatio-temporal variations in this relationship at the county level in China 2000–2015. J. Clean Prod. 2019, 220, 9–22. [Google Scholar] [CrossRef]
  34. Kline, R.B. Principles and Practice of Structural Equation Modeling; Guilford Publications: New York, NY, USA, 2015. [Google Scholar]
  35. Sinclair, R. VON THÜNEN AND URBAN SPRAWL. Ann. Assoc. Am. Geogr. 1967, 57, 72–87. [Google Scholar] [CrossRef]
  36. Jayne, T.S.; Mather, D.; Mghenyi, E. Principal Challenges Confronting Smallholder Agriculture in Sub-Saharan Africa. World Dev. 2010, 38, 1384–1398. [Google Scholar] [CrossRef]
Figure 1. Theoretical framework and research design.
Agriculture 10 00063 g001
Figure 2. Overview of the study area and township zones.
Agriculture 10 00063 g002
Figure 3. Urban Expansion and Farmland Reclamation in Xichang (2005–2015).
Agriculture 10 00063 g003
Figure 4. Farmland structure and its changes in Xichang from 2006–16.
Agriculture 10 00063 g004
Figure 5. Population (a) and labor (b) changes in Xichang from 2006–16.
Agriculture 10 00063 g005
Figure 6. Sown area and the yield and structure of crops in Xichang from 2006–16.
Agriculture 10 00063 g006
Figure 7. Agricultural sown area structure in the various township zones.
Agriculture 10 00063 g007
Figure 8. Agricultural yield structure in the various township zones.
Agriculture 10 00063 g008
Figure 9. Multiple cropping index, agricultural labor, farmland and sown area in the township zones.
Agriculture 10 00063 g009
Figure 10. Linkage analysis framework of rural–urban transition and agricultural restructuring.
Agriculture 10 00063 g010
Figure 11. Diagram of the direct effect (Standardized estimates) linkages between the latent variables.
Agriculture 10 00063 g011
Figure 12. The adaptation linkages of rural–urban transitions and agricultural restructuring.
Agriculture 10 00063 g012
Table 1. Selection of variables for rural migration and agricultural structure and their summary statistics (2016).
VariablesTotal
(37)
Lake Basin Townships
(5)
River Valley Townships
(19)
Nationality Townships
(13)
Statistical Test of Differences
MeanSDMeanSDMeanSDMeanSDANOVA (Sig.)
Urbanization Rate in Township (%)0.080.110.100.070.090.140.030.020.198
Rural Population (1000 pop)12.236.8817.5611.2614.405.487.012.410.001 **
Rural Laborer (1000 pop)7.073.899.275.638.753.183.771.19<0.001 **
Agricultural Laborer (1,000 pop)5.423.014.214.457.142.523.371.09<0.001 **
Agricultural Labor Ratio (%)0.800.190.470.320.820.070.900.09<0.001 **
Farmland Areas (1000 mu)14.255.808.324.6018.005.2011.052.27<0.001 **
Per Capita Net Income of Farmers (1000¥)12.843.7418.741.8814.141.448.661.21<0.001 **
Food Crop Areas (1000 mu)21.4513.088.404.9732.249.0010.711.74<0.001 **
Cash Crop Areas (1000 mu)1.231.211.022.011.550.960.841.170.251
Vegetables Areas (1000 mu)3.743.353.812.665.613.400.970.32<0.001 **
Orchard Areas (1000 mu)1.502.262.313.692.212.270.150.170.023 *
Multiple Cropping Index (/)0.370.370.540.560.440.370.190.230.085
Agricultural Output Value (million¥)10.757.9911.806.2316.604.961.800.59<0.001 **
Topographic Relief (m)152.5594.0579.5234.47105.0067.85250.1455.81<0.001 **
Farmland Areas per Household (mu)5.452.782.511.734.711.537.662.99<0.001 **
Agricultural Laborer per Household (pop)1.810.581.030.911.810.432.120.320.001 **
Farmland per Agricultural Laborer (mu)3.031.232.951.983.620.622.661.410.058
Sown Area per Agricultural Laborer (mu)5.381.834.693.325.821.164.991.930.317
Food Crop Yields (1000 t)7.975.714.622.8712.594.022.520.45<0.001 **
Cash Crop Yields (1000 t)0.230.190.370.290.250.150.130.180.035 *
Vegetables Yields (1000 t)14.9714.9316.8911.9023.0915.122.360.68<0.001 **
Orchard Yields (1000 t)2.183.203.705.693.182.920.140.070.012 *
Notes: the areas and yield data of the food crops (rice, maize, wheat, barley, potato, soybean, etc.), cash crops (rapeseed, peanut, sugarcane, flue-cured tobacco, etc.) and orchards (pomegranate, peach, pear, mango, etc.) were obtained from the Xichang Statistical Yearbook (2006–2016); *, **indicate statistical significance at the 5%, and 1% levels, respectively; 1 mu ≈ 667 m2 or 0.067 ha.
Table 2. The reports of multiple regression model of the different crops.
VariablesFood CropCash CropVegetablesOrchard
Standard
Coefficient
PStandard
Coefficient
PStandard
Coefficient
PStandard
Coefficient
P
Township zones0.220 **0.0000.061 **0.0030.297 **0.000−0.448 **0.000
urbanization rate in township−0.076 **0.000−0.0160.2720.030 *0.0380.0050.909
Agricultural labor ratio0.364 **0.0000.0470.1160.235 **0.0000.378 **0.000
Rural laborer0.612 **0.0000.165 **0.0000.352 **0.0000.437 **0.000
Per capita net income of farmers0.0190.459−0.0430.489−0.242 **0.000−0.0070.924
Agricultural output value0.104 **0.0010.128 **0.0000.361 **0.0000.244 **0.006
Topographic relief−0.412**0.000−0.0300.408−0.186 **0.0000.272 **0.005
Farmland areas per household0.240 **0.0000.257 **0.003−0.155 **0.001−0.354 **0.007
Agricultural laborer per household−0.0450.218−0.0620.4630.154 **0.0000.1450.155
Farmland per agricultural laborer−0.341 **0.000−0.232 **0.0000.0500.2960.455 **0.001
Sown areas per agricultural laborer0.639 **0.0000.292 **0.0000.329 **0.000−0.1370.155
Multiple Cropping Index0.027 *0.0460.039 **0.008−0.0130.3260.282 **0.000
Model Fitting Degree (R2)0.933 **0.0000.596 **0.0000.939 **0.0000.466 **0.000
F51.170.00017.640.00040.170.0007.220.000
Hausman chi (12)17.900.0573.650.962−186.79--29.490.001
ModelFixed effectRandom effectsFixed effectFixed effect
Notes: * Significant at the 5% level; ** Significant at the 1% level.
Table 3. Structural equation model fitting result in Amos.
Fitted IndexReference ValueFitted Value
  Degree of Freedom (DF) 163
  Minimum fit function Chi-Square6511.806
  P>0.050.310
  RMSEA (Root Mean Square Error of Approximation)<0.050.017
  GFI (Goodness of Fit Index)>0.900.913
  NNFI (Non-normal Fitting Index)>0.900.997
  SRMR (Standardized Root Mean Square Residual)<0.050.013

