Article

Soil and Water Quality Indicators of Diversified Farming Systems in a Saline Region of the Mekong Delta, Vietnam

1
Department of Soil Science, College of Agriculture, Can Tho University, 3/2 Street, Ninh Kieu District, Can Tho City 900000, Vietnam
2
NTT Hi-Tech Institute, Nguyen Tat Thanh University, 300A Nguyen Tat Thanh, Ward 13, District 4, Ho Chi Minh City 70000, Vietnam
3
National Institute of Education, Nanyang Technological University, Singapore 637616, Singapore
4
Faculty of Food and Environment Engineering, Nguyen Tat Thanh University, Ho Chi Minh City 70000, Vietnam
*
Author to whom correspondence should be addressed.
Agriculture 2020, 10(2), 38; https://doi.org/10.3390/agriculture10020038
Submission received: 12 December 2019 / Revised: 10 January 2020 / Accepted: 19 January 2020 / Published: 7 February 2020
(This article belongs to the Special Issue Agricultural Diversification)

Abstract

:
Saltwater intrusion, a consequence of climate change and decreased water levels, has been increasingly severe in the Mekong Delta region. Thanh Phu District, Ben Tre Province, Vietnam, is a coastal region where agricultural production and local livelihood have been impaired by saltwater intrusion, resulting in the adoption of multiple coping strategies, including rotations and intercropping. This study aims to measure and evaluate soil and water quality indicators of multiple farming systems in Thanh Phu district and contributes to developing suitable cropping patterns. Soil indicators were pH, electrical conductivity, and exchangeable Na+. Water quality characteristics include pH, salinity, dissolved N and P, alkalinity, H2S, and chemical oxygen demand (COD). The results indicated that water pH and salinity were at suitable levels to support the growth of prawn but were below the critical level required to grow black tiger shrimp and white-legged shrimp. Water alkalinity, dissolved N, P, and COD were not constraining for the growth of shrimps. However, a significant concentration of H2S may cause disadvantages for shrimp growth.

1. Introduction

Salinity intrusion represents a major concern for agricultural production in coastal regions. Saline water radically alters soil conditions [1,2,3], severely undermines freshwater reservoirs used for consumption and irrigation and threatens the survival of freshwater living organisms and livelihoods of inhabitants residing in the affected areas. In addition, numerous aspects of farming activities, including crop harvesting, farming systems, and more importantly, crop-livestock structure, are significantly hampered by sodicity (i.e., the amount of sodium held in a soil) -induced changes in chemical and physical properties and composition of soils [4,5,6,7,8].
Among coastal areas of the Mekong Delta, Ben Tre province of Vietnam is a diversely-farmed region that is under significant impacts of salinity intrusion. More specifically, a quarter of the total area for agricultural production of the province amounting to 181,252 hectares is constantly affected by saltwater intrusion [9]. Saline intrusion is greatly aggravated in dry seasons where salinity with the minimum concentration of 1‰ covers an overwhelming majority of the land of Ben Tre province. The extents to which saltwater intrudes inland at the 4‰ and 1‰ thresholds are 50 and 70 km, respectively [10], causing once-fertile soil to degrade rapidly and reducing the economic efficiency of rice farming in those areas.
In response to poor crop productivity that results from salinity intrusion and occasional disease outbreaks occurring in mono-cropping of rice, farmers in the Mekong Delta have resorted to other products and adopted various diversification strategies. Commonly-practiced alternative farming models included rotation of rice with fishes, shrimps, and subsidiary crops, the intensive monoculture of snakehead murrel fish and blue prawn, intercropping of blue prawn in rice paddy fields and intercropping of blue prawn in coconut irrigation channels. Among such models, rotation of rice with different shrimp species has been demonstrated to be economically successful [11,12,13] and ecologically sustainable, showing good adaptation to saline conditions and enabling farmers to overcome the white spot disease [14]. Phong et al. justified the rice-shrimp intercropping model in saline soil environments by elaborating that close proximity of rice-shrimp fields to water sources, which is required for periodic water exchanges, may facilitate the flushing of salts and salt leaching through rainfalls [15]. On the other hand, Penaeus species, in general, and P. monodon (black tiger shrimp), in particular, because of their active osmoregulation against high salinity, have shown to survive well in saline ponds with frequent occurrence of salinity shocks [16]. However, high mortalities were observed in black tiger shrimp ponds with very low salinity [17].
Despite that, current coconut and rice-based diversification strategies that have been practiced heavily rely on farmers’ experience, thus lacking a comprehensive scientific basis required for model refinement or extension. In addition, it is still unclear whether those farming systems will cope well with the increasing levels of salinity and not cause further degradation in soil and water quality in the coastal area in the future.
Driven by the aforementioned thrust, we conducted this study to evaluate the suitability of the popular farming models of Ben Tre with respect to the salinity intrusion. More specifically, we developed a novel set of soil and water indicators to investigate the commonly-practiced farming models in Thanh Phu district, Ben Tre province, Vietnam. The indicators were subsequently validated via comparing with the practical national standards. Methodological implication aside, the study sought to inform relevant decision-makers regarding the environmental qualities and crop suitability associated with the agricultural development of the study area.

2. Materials and Methods

2.1. Study Area

The study was carried out in Thanh Phu district, Ben Tre province, Vietnam. Meteorologically, the Thanh Phu district is a tropical monsoon climate area with two distinct seasons (dry and wet seasons). The temperature of the area is stable and averaged at around 26.6 °C annually. The maximum temperature peaks at 28.4 °C in April and falls as low as 24.3 °C in December. Temperature differences between months were minor, which is favorable for year-round cultivation. Rainfall characteristics of the district are typical to the littoral regions of the South China Sea, having the lowest annual rainfall in the Mekong Delta (1279 mm). Rainfall in the wet season (1218 mm) accounts for 95% of total annual rainfall and is starkly contrasted by that of the dry season (61 mm).
Being affected by mixed semidiurnal tides of the South China Sea, rivers in the Thanh Phu district have tidal amplitudes ranging from the maximum point of 4.1 m (from November to January) to a minimum of 2.6 m (from June to July). In the dry season, salinity intrusion occurs region-wide in which the intrusion around Ham Luong river is more severe than that around other rivers in the district. Areas that are far from the coast such as Phu Khanh and Thoi Thanh commune also suffer from salinity that lasts around 2–3 months a year. Monitoring data shows that water quality of Co Chien river is better than that of Ham Luong river. In addition, a mixed semidiurnal tidal pattern also facilitates irrigation and water supply for aquaculture in the riverbank regions.
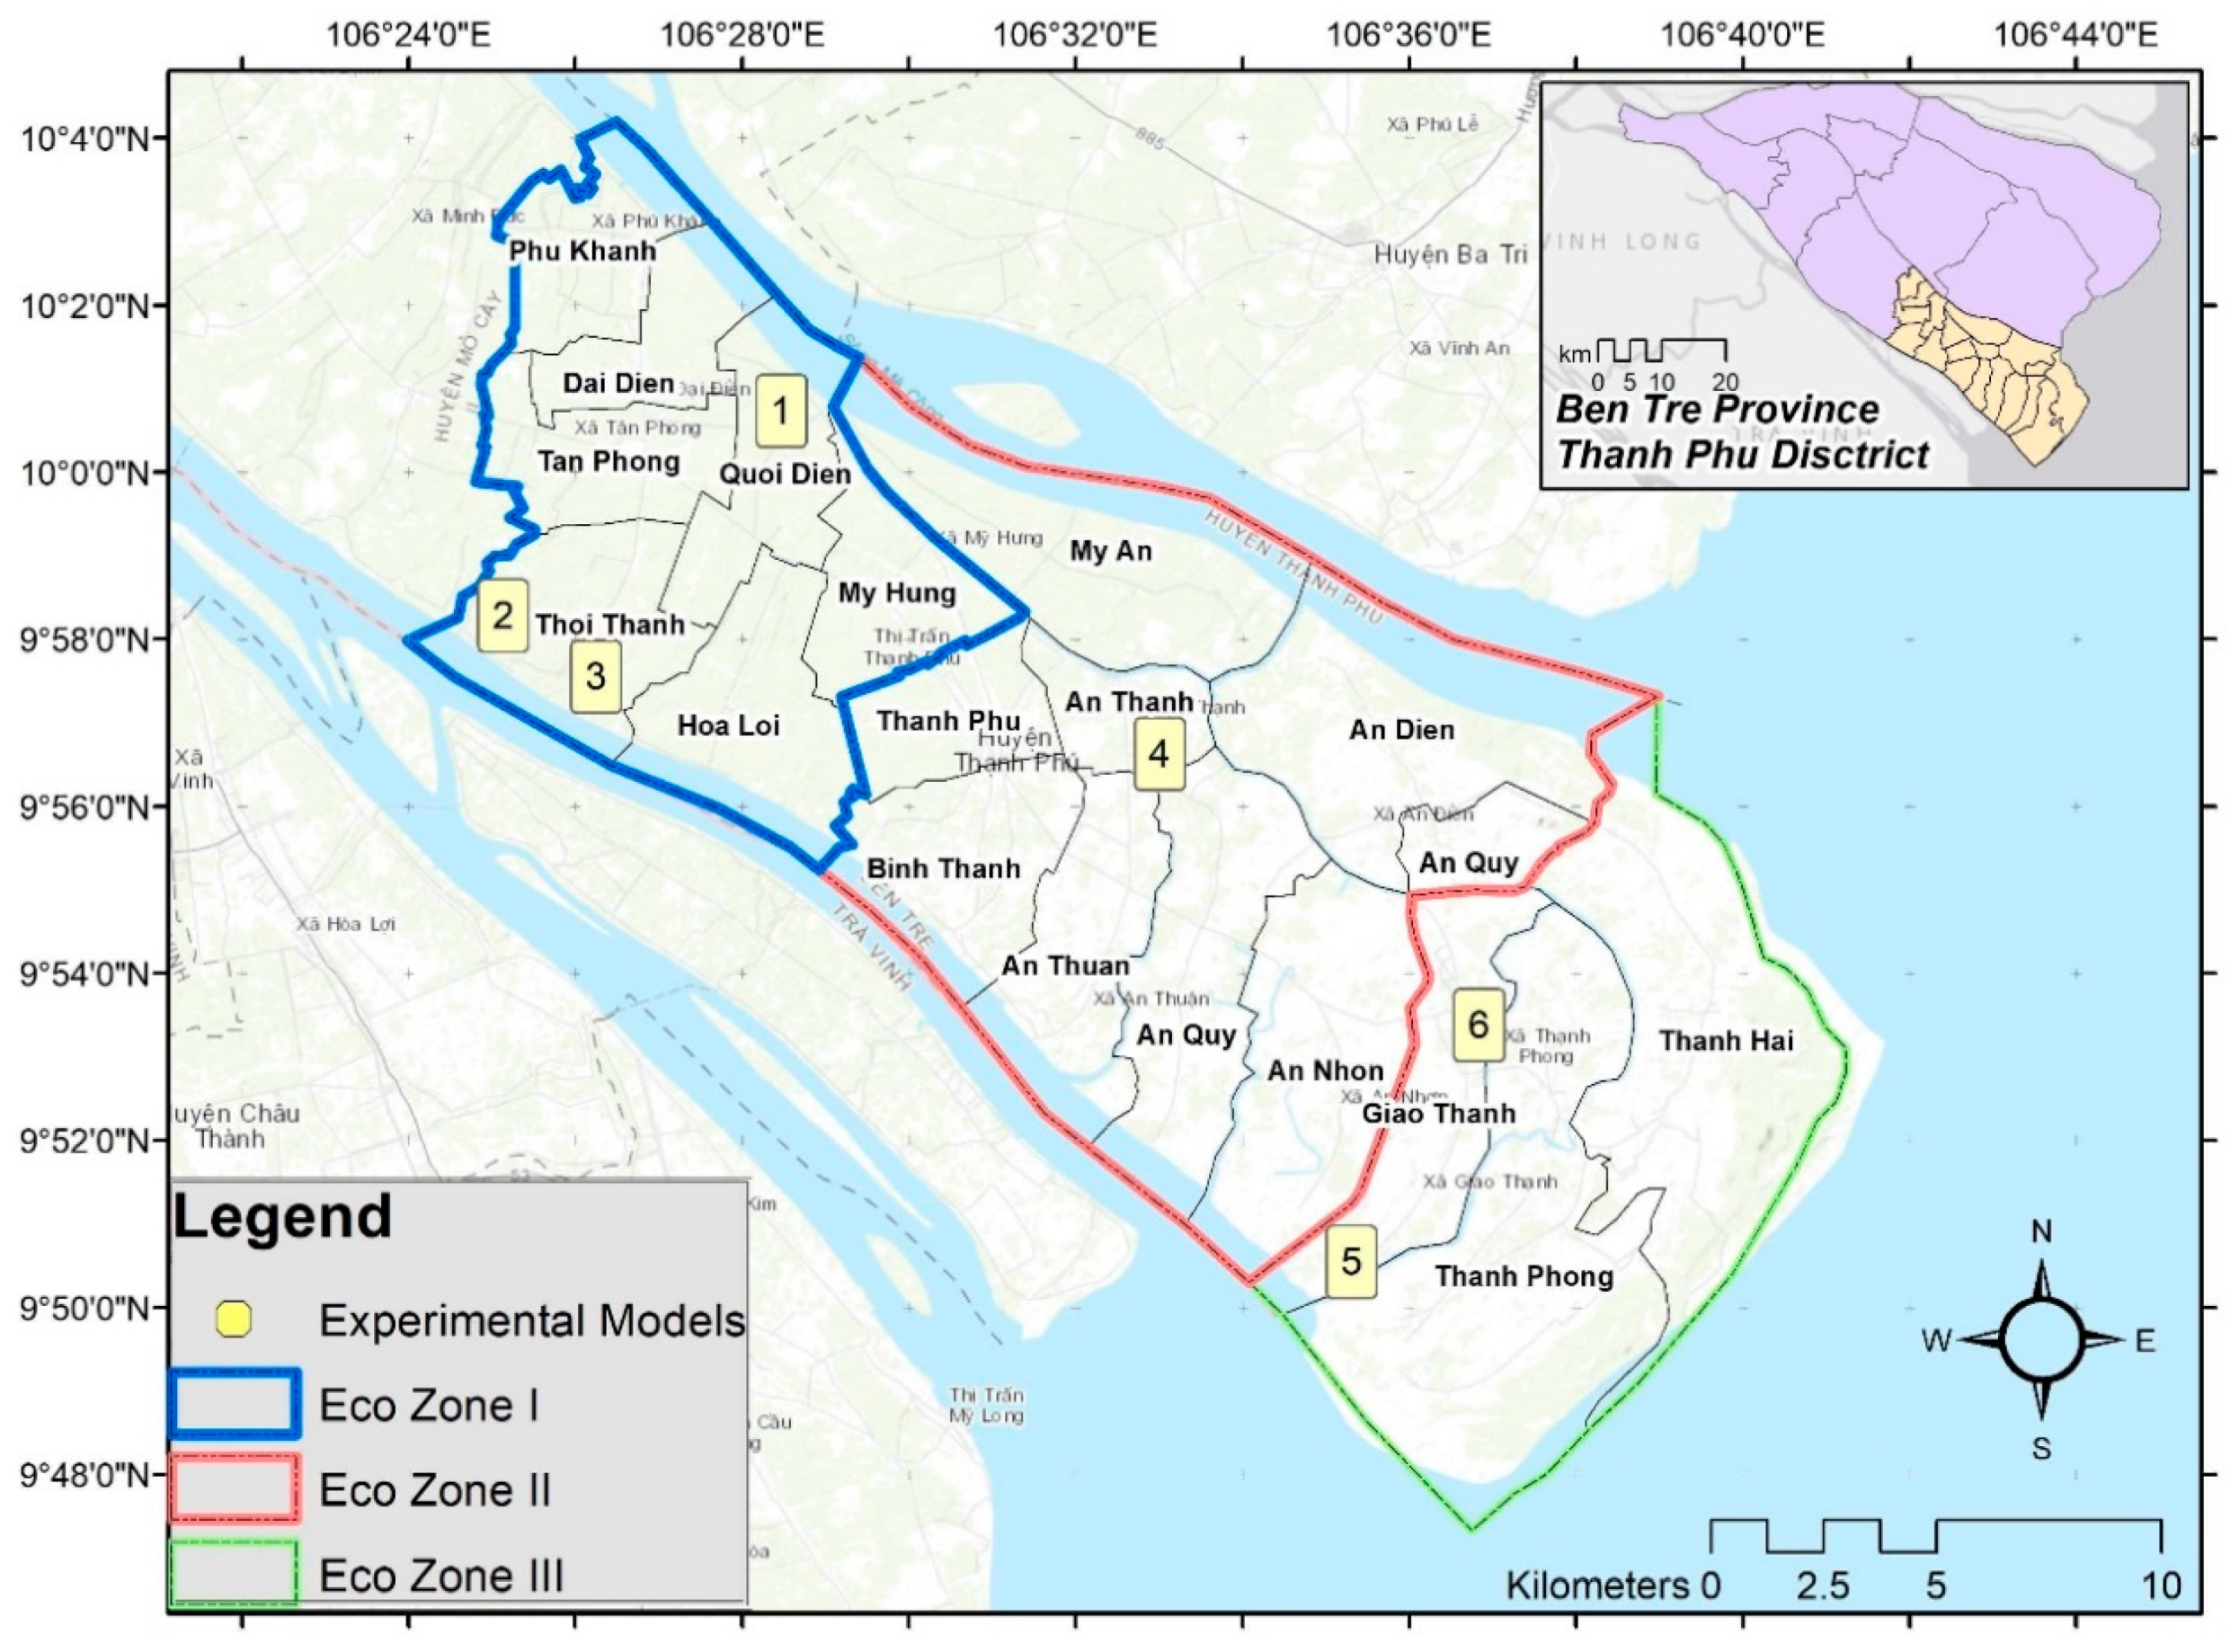
The district can be divided into three ecological sub-regions based on salinity levels: I, II, and III as shown in Figure 1. EcoZone I (freshwater area): This area is about 11,565 hectares ranging from Binh Thanh commune to Thanh Phu town. The region is a freshwater area where two (or even three in specific areas) crops of rice are harvested within one year and are also surrounded by an anti-salinity dike line that belongs to the Project 418 of the Government. Paddy fields in this region are irrigated with fresh water. EcoZone II (brackish water area): This region has an area of about 10,000 hectares ranging from Binh Thanh commune seaward to An Dien commune. This area achieved one rice harvest per year with black tiger shrimp and white-legged shrimp cultivated intermittently. EcoZone III (saline water area): This region has an area of about 21,000 ha and specializes in extensive aquaculture of shrimp, crab, and clam hosted in mangrove forests.
Six typical adaptive farming models were examined in this study and were described as follows Table 1:

2.2. Measurement of Soil Indicators

Soil samples were collected from the farming fields for model 1 and in pond bottom sediments at a depth of 0–20 cm for other models. All soil samples were collected at the end of April (middle of the dry season). The soil in the region was illuvial soil with potential acid sulfate soil appearing at a depth of around 60 cm. Sandy soil was also found at a depth of 120 cm. The soil classification according to FAO is Endo-protho thionic GLEYSOL. In each model, soil samples from different spots were collected and then mixed. The soil analysis methods are detailed as follows Table 2:

2.3. Assessment of Water Environment Characteristics

Model 1 was excluded from water analysis. Time points for water collection include at the beginning (April—middle of the dry season), the middle (May-end of the dry season), and the end (June—end of the dry season) of the shrimp aquaculture period. Water samples were collected in the pond at a depth of around 20–30 cm from the surface, nearby the places in which corresponding soil samples were collected. One-liter flasks were used to collect the water samples. Prior to sample collection, the flask was washed and rinsed with pond water. Water samples were preserved according to the requirements of the analysis technique. For the H2S indicator, water was collected close to the bottom of the pond and was added with 2 drops of zinc acetate 2N, followed by pH adjustment to 9 using NaOH [21]. Table 3 summarizes the analytical indicators of the water samples alongside the associated references.

2.4. Statistical Analysis

Microsoft Excel software is used to calculate the mean values and standard deviations between treatments (Stdev). Duncan test was used for evaluating the difference between soil and water indicators. Data were analyzed by SPSS 20.0 software.

3. Results and Discussion

3.1. Soil Characteristics in Farming Models

3.1.1. pH of Soil

The pH of soil in different farming systems is shown in Table 4 and the numbers in brackets signify the standard deviation of the measurement of each model. The differences in the standard deviations relate to various aspects in the farming practices, i.e., freshwater vs. saline water vs. brackish water; and the cropping system, i.e., shrimp, prawn, rice, or combined thereof.
Except for model 4, all pH values ranged from 5.6 to 6.6. This pH range falls into the category of medium acidity according to Brady (1990) and is suitable for growing different types of the crop [25]. However, the highly acidic soil of model 4 is unfavorable for intercropping of aquaculture and crops [26] and could be explained by the presence of sulfidic sediments that lowered the pH of soil samples collected in dry seasons [27]. Other aquaculture systems exhibited soil pH values close to the neutrality threshold. To be specific, aquaculture models situated in freshwater and saline areas have a pH range of 6.2 to 6.6 and the model located in the brackish area had a pH value of 5.6. These elevated values are possibly due to accelerated H+ ion exchange processes occurring in the pond environment and are in agreement with the suggested pH range (4–11) for the growth and development of cultured shrimp and aquatic organisms of Boyd (1998) [28].
In general, the pH values reported of the models are low and suitable for shrimp growth and the development of rice, corn, and coconut, albeit being slightly lower than the suggested pH range. Only model 4, which is a rotation of intercropping and extensive aquaculture, experienced a very low pH. This suggests that basal fertilization with lime should be performed before rice cultivation to improve soil pH.

3.1.2. Electrical Conductivity in Soil and Sodicity

The soil electrical conductivity (EC), a measure of salt quantity in soils, affects the growth of plants and animals. The difference in the salt concentration of the soil solution and the cell of the plant root leads to a restriction on water and nutrient uptake. Excessive soluble salts in saline soils are often associated with sodic properties, signified by high levels of sodium salt (mainly Na2CO3) on the absorption complex of soils. Continuous shrimp farming causes sodic soil phenomenon, hindering plant growth, disturbing the balance of water and nutrient uptake, and poses physical disadvantage [27,29]. On the other hand, EC was found to correlate strongly with ECe. To be specific, in a previously reported study analyzing 603 saline soil samples in the Mekong Delta, the ECe values were found to be strongly correlated with EC 1:2.5 (R2 = 0.89). In addition, in comparison with ECe, EC1:2.5 was 0.41 times lower and EC1:5 was 0.28 times lower.
Table 5, which summarizes EC in examined systems, indicates that systems in the freshwater area seemed to have low conductivity with EC values ranging from 1.08 to 1.27 mS·cm−1. This level is classified as low EC soil and is generally not detrimental to crop yields according to A&L Western Agricultural Laboratories guidelines. Mild salinity, as indicated by EC value of around 3.7 mS·cm−1, was observed in the rotation system of black tiger shrimp-rice intercropping and extensive blue prawn farming in the brackish area [30,31]. This is also similar to those of the models in the saline area that had mildly saline soils with conductivity of about 3.36–4.99 mS·cm−1 [31] and consistent with the seasonality of salinity in nearby rivers and canals, which tended to show an increasingly high salinity from 8.5 to 25‰ in around April because of climate change [32,33]. In general, figures measured at farming models in brackish and saline sub-areas indicated that crop yields are probably affected at this level of conductivity. Therefore, it is necessary to select plant and animal varieties that could adapt to the soil salinity level.

3.1.3. Exchangeable Na+ in Soil and Sodicity

The results in Table 6 showed the exchangeable Na+ content of soil samples in different models. Models situated in the freshwater area had Na+ values ranging from 1.08–1.37 cmol/kg. This result is higher than that of a previous study in Hau Giang province, Mekong delta, where different integrated models including shrimp-melon, shrimp-rice, and a shrimp monoculture model showed exchangeable Na+ in the soil of 0.67; 1.80; 1.93 cmol/kg, respectively [32]. However, the percentage of exchangeable sodium (ESP) on the uptake complex in soils of freshwater models is lower than saline-sodic soil threshold (ESP < 15%), ranging from 8.50 to 10.79%, in which the rice-corn rotation model exhibited an ESP value lower than those of two other models. This is possibly due to the low accumulation of salt during dry seasons and the long leaching period (about 6 months) in wet seasons.
In brackish areas, model 4 (rotation of tiger shrimp-rice intercropping and monoculture of blue prawn) has an average Na+ value of 4.22 cmol/kg, which is lower than that in the rotation aquaculture of tiger shrimp-white legged shrimp in the saline area, at 4.78 cmol/kg. The extensive aquaculture model in the saline area (model 6) exhibited a very high Na+ value, averaged at 5.13 cmol/kg. Regarding sodicization, ESP of models in the brackish and saltwater area exceeded sodicity threshold (ESP > 15%), ranging from 33.23 to 40.19%. The maximum ESP in the saltwater is of the extensive aquaculture model (model 6 at 40.19%). In brackish farming models, the water salinity in the ponds and rice fields are reduced in the rainy season, facilitating the rotation of rice with tiger shrimp [34]. However, because of the short period for salt leaching, usually about 3 months, the soil salinity is still higher than the sodicity threshold.
In summary, indicators of models in the brackish and saline region showed clear signs of soil sodicization (ESP > 15%, pH < 8.5, EC > 4 mS·cm−1) while the soil of systems in freshwater area is under sodicity threshold (ESP < 15%). Therefore, measures to leach the salt and reduce the Na+ content in the soil are advisable to achieve productive rice farming within shrimp-rice intercropping models.

3.2. Water Characteristics in Farming Models

Water samples were collected in five farming models (model 1 was excluded from water analysis), at the beginning (April), the middle (May), and the end (June) of the shrimp farming cycle. Water samples were collected to analyze the environmental parameters such as pH, EC, dissolved nitrogen, dissolved phosphorus, alkalinity, H2S, COD to assess the adaptability of cultured shrimp in farming models.

3.2.1. Water pH in Farming Models

pH values of water of different farming systems are presented in Figure 2. Generally, pH value is relatively high, ranging from 7.51 to 8.48 from the beginning to the end of the shrimp harvest. This pH range is in line with other pH ranges appropriate for shrimp farming, as suggested by several prior studies [35,36,37,38,39]. It is revealed that pH in farming systems tended to decline from the beginning to the middle of the harvest, and then rise at the end. This could be explained by the practice of applying lime at the beginning of shrimp aquaculture to rehabilitate the pond. It was reported that extreme and highly fluctuated pH might affect growth, survival, disease resistance, reproduction and nutrition of shrimps [28,40,41]. In particular, the pH of higher than 8 is reported to be highly toxic to shrimps [42].

3.2.2. Salinity of Water

The results presented in Figure 3 show that the salinity of water in the farming models varies from 2.76 to 17 mS·cm−1. Two models in the freshwater area had salinity ranging from 2.76 to 5.12 mS·cm−1. The rotation model of black tiger shrimp-rice intercropping and blue prawn (model 4—brackish area) had salinity ranging from 7.98 to 12.77 mS·cm−1. Model of tiger shrimp-white shrimp rotation and the model of extensive shrimp (saline area) had salinity ranging from 10.3–17 mS·cm−1. In general, the salinity thresholds of fresh, brackish, and saline area models are suitable for the development of blue prawn and black tiger shrimp. The salinity that is appropriate for the development of the black tiger shrimp ranges from 0 to 10 mS·cm−1 [34]. On the contrary, other studies suggested that the pH range for optimal growth of black tiger shrimp is 10–30 mS·cm−1 [40,42,43] or 15–35 mS·cm−1 [44].
Salinity seemed to be gradually increasing over the course of shrimp aquaculture, except for model 2 and 3 where the salinity increase was observable but statistically insignificant. The trend could be due to the time of sampling being at the end of the dry season, where general salinity is high. For model 3, since the model is situated in the area surrounded by anti-salinity dike, its salinity is clearly lower than those of models exposed to salinity in other subregions. It was found that salinity exceeding the tolerance limit of shrimp adversely affects the regulation, osmotic pressure, and molting of cultured shrimp, causing stunting, shell disease and resulting in low survival rate [39]. Shrimps, in general, thrive in low salinity environments yet susceptible to disease [37], which could be explained by salinity limiting the growth of some pathogenic microorganisms.

3.2.3. Soluble Nitrogen Content in Water in the Cultivation Model

The soluble protein content is another critical indicator representing nutrition in a farming pond. The excessive-high concentration of soluble protein may cause phytoplankton blooming, resulting in possible eutrophication. As suggested by Chanratchakool (2003), water with NH4+ nitrogen of higher than 4 mg/L is considered undesirable for shrimping farming [40]. The results presented in Figure 4 show that the content of soluble protein varied greatly from 0.30 to 0.79 mg/L. The models in the freshwater sub-region exhibited soluble protein content ranging from 0.24 to 0.65 mg/L. The content of models in brackish and saline areas ranged from 0.3 to 0.74 mg/L. This result is consistent with the threshold value of soluble protein for blue prawn, tiger shrimp, and white-legged shrimp. To be specific, Duong Nhat Long (2012) suggested the appropriate threshold for optimal development of blue prawn is NH4+ <1 mg/L [45]. Similarly, other studies suggested that the content of soluble nitrogen suitable for shrimp ponds could range from 0.2 to 2.0 mg/L [28,39].
For all farming systems, the content of soluble nitrogen showed a significant decline from the beginning to the end of the shrimp aquaculture. Reduced soluble protein content in the later stages could be due to the consumption of nitrogen of plants and microorganisms in the pond. In addition, submergence, waterlogging, and increased salinity could also reduce its mineralization capability and microbial activity of the soil, lowering dissolved nitrogen and soluble nitrogen. In general, the nitrogen content of the farming models is dissolved within the appropriate threshold of aquaculture ponds, not yet causing eutrophication. Since a majority (over 90%) of nitrogen content comes from shrimp feeding and metabolic products of shrimps [28], it is necessary to control protein content by observing the color and adjusting feeding to maintain the stability in water quality.

3.2.4. Soluble Phosphorus Content in Water in the Cultivation Model

The results presented in Figure 5 show that the dissolved phosphorus content ranged from 0.01 to 0.08 mg/L. The peak soluble phosphorus content was attained in the rotation aquaculture model of black tiger shrimp and white legged shrimp. Cultivation models in the fresh, brackish, and saline sub-areas all have low phosphorus content than the recommended values. To be specific, according to Nguyen Duc Hoi, the content of phosphorus dissolved in water suitable for shrimp and fish is recommended to be about 1.0 mg/L [46]. In another study, Boyd argues that the appropriate amount of dissolved phosphates in aquaculture ponds should be around 0.5 mg/L [28].
Overall, soluble phosphorus content is declining over time, and the differences are significant. This result is consistent with the study of Thai Truong Giang that the phosphorus content in pond water is low and is provided mainly through chemical fertilizers to stimulate phytoplankton to develop as a natural food source for shrimp [47]. In addition, dissolved phosphorus is also lost by uptake by phytoplankton and aquatic organisms and the phosphate uptake of the sediment sludge. As a result, it is necessary to supplement an additional amount of phosphorus to ensure the growth of shrimps in ponds [48].

3.2.5. Alkalinity of Water

The results presented in Figure 6 show that the alkalinity ranges from 36 to 89 mg/L. The alkalinity range of freshwater, brackish water, and saline water models was 36–88, 46–58, and 59–89 mg/L respectively. The alkalinity of water in the models is in a suitable range for aquaculture, especially blue prawn, tiger shrimp, white shrimp at the end of the crop. According to Chanratchakool et al. the alkalinity suitable for shrimp growth is in the range of 80–120 mg/L [40], which well agrees with the results of Mistein et al. obtained when monitoring the alkalinity of water in shrimp ponds in Bangladesh [49]. Studies performed in Vietnam also indicate optimal alkalinity for shrimp farming is >60 mg/L and 80–150 mg/L [50,51].
Similar to the results of soluble phosphorus content, alkalinity tended to increase over time. Alkalinity of all farming systems in the fresh, brackish, and saline areas was low at the beginning, the middle of the crop and was elevated at the end of the season. This may be due to the increase in alkalinity during the application of lime. In addition, the alkalinity of aquaculture ponds depends on the properties of pond substrate and water. For ponds in sandy soils, total alkalinity could be around 20 mg/L and ponds in limestone soils often have alkalinity above 100 mg/L [28]. Other possibilities could be due to low salinity, leading to low carbonate and bicarbonate, and underdeveloped phytoplankton, which hinders the primary production of the pond and lowers alkalinity. On the contrary, high alkalinity reduces pH fluctuations by HCO3 and CO32− buffer and contributes to the assessment of acid neutralization capacity of water, expressed by HCO3, CO32−, OH ions [52]. In general, in comparison with the optimal range for shrimp development, the alkalinity in the models is low at the beginning [53]. Therefore, to increase the alkalinity in the water, it is necessary to apply to add lime to the early stages of stocking and after rainfalls to maintain pond quality and pH stability [51].

3.2.6. Hydrogen Sulfide (H2S) Content in Pond Water

The results from Figure 7 show that the concentration of H2S in the farming models varies from 0.1 to 0.25 mg/L, and farming systems in the brackish subregion seemed to have higher H2S content (0.15 to 0.25 mg/L) compared to other subregions. Generally, H2S in farming models decreased in the middle of the season and rebounded at the end of the season. This may be due to the accumulation of organic matter under anaerobic conditions, resulting in an increase in H2S. The high concentrations of H2S are not necessarily fatal for the shrimps but will affect the lifecycle and susceptibility to environmental conditions and diseases. The conversion of organic matter in the pond increases the reduction process in the pond bottom soil. SO42−, derived from mineralized organic matter and from seawater, is reduced with the involvement of microorganisms to form S2−, which in turn becomes H2S [32].
The presence of H2S, even in a small amount, is harmful to the development of aquatic organisms [54,55,56]. Previous studies suggested that H2S concentration in shrimp pond water should not exceed 0.03 mg/L as H2S concentrations in the higher than 0.01 mg/L is undesirable [30] and H2S content in the range of 0.037–0.093 mg/L has been proved to be fatal on shrimps [57]. In general, through the analysis results, concentrations of H2S were above the appropriate threshold for the development of shrimps in all farming models, posing a high risk for most ponds in the study area. Therefore, it is necessary to prepare and rehabilitate the pond before seeding shrimps, and at the same time increase the ventilation in the pond through the implementation of the fan systems in the black tiger shrimp monoculture system.

3.2.7. Chemical Oxygen Demand (COD) in Water

Figure 8 showed that the content of COD in water in the farming models. COD ranged from 7.10 to 880 mg/L in which the highest values were achieved at the end of the shrimp harvest. In general, COD content in the models is lower than the recommended values. According to Boyd (1998) and Smith et al. (2002), the recommend COD in the pond was about 20 mg/L [28,58]. Other COD ranges suggested in previous studies were 5–10 mg/L, 20–30 mg/L, and 15–30 mg/L [59,60,61].
The trend of COD content was increasing during the stages of shrimp farming, albeit the differences were statistically insignificant in some models. In most farming systems, COD levels tended to rise at the end of the season. This result is also consistent with the research results of Tat Anh Thu (2009) confirming that the COD of water increases with the increase of organic matter since COD is an indicator of organic richness in pond water [62]. COD content also showed a positive relationship with regard to the salinity of the area. This result is also consistent with the research result of Sansanayuth, explaining that high salinity hinders the mineralization rate of organic minerals, usually leading to lower COD content [63].
Overall, COD values in the farming pond are at a low level in comparison with the recommended values, which is indicative of favorable development of blue prawn, black tiger shrimp, and white shrimp.

4. Conclusions

Many water and soil quality indicators were measured in different farming systems in a saline district in the Mekong Delta. Results showed that the water environment in aquaculture ponds is generally favorable for the development of the three shrimp species, reflected by suitable pH, nitrogen, phosphorous content, and COD. Salinity is optimal for the development of blue prawn but falls within lower thresholds for white legged and black tiger shrimps. In addition, water in the surveyed models has low alkalinity and excessively high H2S content. Both of which adversely affect the shrimp growth. Regarding soil quality, soil pH is suitable for shrimp aquaculture. However, exchangeable Na+ was high and soil in models in the brackish and saline region was sodicized. Key remediation strategies derived from these results should involve soil leaching, increasing the water alkalinity and lowering H2S content in aquaculture ponds.

Author Contributions

Investigation, L.V.T., T.T., and H.H.L.; writing—original draft, L.V.T. and T.T. All authors have read and agreed to the published version of the manuscript.

Funding

This research received no external funding.

Conflicts of Interest

The authors declare no conflict of interest.

References

  1. Cline, W.R. Global Warming and Agriculture: Impact Estimates by Country; Peterson Institute: Washington, DC, USA, 2007. [Google Scholar]
  2. Ministry of Natural Resource and Environment of Vietnam—MONRE. Scenarios for Climage Change and Sea Water Rise in Vietnam; Vietnam resource; Environment and Maps Publisher: Ha Noi, Vietnam, 2012.
  3. Solomon, S.; Manning, M.; Marquis, M.; Qin, D. Climate Change 2007-The Physical Science Basis: Working Group I Contribution to the Fourth Assessment Report of the IPCC; Cambridge University Press: Cambridge, UK; New York, NY, USA, 2007. [Google Scholar]
  4. Akter, M.; Oue, H. Effect of Saline Irrigation on Accumulation of Na+, K+, Ca2+, and Mg2+ Ions in Rice Plants. Agriculture 2018, 8, 164. [Google Scholar] [CrossRef] [Green Version]
  5. Mavi, M.S.; Marschner, P.; Chittleborough, D.J.; Cox, J.W.; Sanderman, J. Salinity and sodicity affect soil respiration and dissolved organic matter dynamics differentially in soils varying in texture. Soil Biol. Biochem. 2012, 45, 8–13. [Google Scholar] [CrossRef]
  6. Tripathi, S.; Kumari, S.; Chakraborty, A.; Gupta, A.; Chakrabarti, K.; Bandyapadhyay, B.K. Microbial biomass and its activities in salt-affected coastal soils. Biol. Fertil. Soils 2006, 42, 273–277. [Google Scholar] [CrossRef]
  7. Pan, C.; Liu, C.; Zhao, H.; Wang, Y. Changes of soil physico-chemical properties and enzyme activities in relation to grassland salinization. Eur. J. Soil Biol. 2013, 55, 13–19. [Google Scholar] [CrossRef]
  8. Hamdi, L.; Suleiman, A.; Hoogenboom, G.; Shelia, V. Response of the Durum Wheat Cultivar Um Qais (Triticum turgidum subsp. durum) to Salinity. Agriculture 2019, 9, 135. [Google Scholar] [CrossRef] [Green Version]
  9. Ben Tre People’s Committee. Report on Socio-Economic Situation, Security and Defense in 2012 and Directions for 2013; Ben Tre Statistical Office: Ben Tre, Vietnam, 2012.
  10. Ben Tre People’s Committee. Report on Actual State of Environment in Ben Tre province in 2011; Ben Tre Statistical Office: Ben Tre, Vietnam, 2011.
  11. Phuong, N.T.; Minh, T.H.; Tuan, N.A. Overall of Black Tiger Shrimp Farming Models in Mekong Delta. Conference on Development of Coastal Aquatic Resources. Master’s Thesis, Department of Environmental Management - Faculty of Environment and Natural Resources Nong Lam University, Ho Chi Minh City, Vietnam, 4 August 2008. [Google Scholar]
  12. Nguyen, H.Q.; Korbee, D.; Ho, H.L.; Weger, J.; Thi Thanh Hoa, P.; Thi Thanh Duyen, N.; Dang Manh Hong Luan, P.; Luu, T.T.; Ho Phuong Thao, D.; Thi Thu Trang, N.; et al. Farmer adoptability for livelihood transformations in the Mekong Delta: A case in Ben Tre province. J. Environ. Plan. Manag. 2019, 62, 1603–1618. [Google Scholar] [CrossRef]
  13. Ho, H.L.; Nguyen, T.H.D.; Nguyen, T.C.; Kim, N.I.; Shimizu, Y. Integrated evaluation of ecosystem services in prawn-rice rotational crops, Vietnam. Ecosyst. Serv. 2017, 26, 377–387. [Google Scholar]
  14. Srinivasan, M.; Khan, S.A.; Rajagopal, S. Culture of prawn in rotation with shrimp. NAGA 1997, 20, 21–23. [Google Scholar]
  15. Phong, N.D.; My, T.V.; Nang, N.D.; Tuong, T.P.; Phuoc, T.N.; Trung, N.H. Salinity Dynamics and its Implications for Cropping Patterns and Rice Performance in Rice-Shrimp Farming Systems in My Xuyen and Gia Rai; Sustainability of Rice-Shrimp Systems in the Mekong Delta, Vietnam, ACIAR Technical Report; University of Sydney: Sydney, Australia, 2002. [Google Scholar]
  16. Dall, W.H.B.J.; Hill, B.J.; Rothlisberg, P.C.; Sharples, D.J. The Biology of the Penaeidae; Academic Press Publisher: Cambridge, MA, USA, 1990. [Google Scholar]
  17. Minh, T.H.; Jackson, C.J.; Hoa, T.T.T.; Ngoc, L.B.; Preston, N. Growth and Survival of Penaeus Monodon in Relation to the Physical Conditions in Rice-Shrimp Ponds in the Mekong Delta; Sustainability of rice-shrimp systems in the Mekong Delta, Vietnam, ACIAR Technical Report; University of Sydney: Sydney, Australia, 2002. [Google Scholar]
  18. Gianello, C.; Bremner, J.M. Comparison of chemical methods of assessing potentially available organic nitrogen in soil. Commun. Soil Sci. Plant Anal. 1986, 17, 215–236. [Google Scholar] [CrossRef]
  19. Olsen, S.R. Estimation of Available Phosphorus in Soils by Extraction with Sodium Bicarbonate; U.S. Dept. of Agriculture: Washington, DC, USA, 1954.
  20. Nelson, D.W.; Sommers, L.E. Total Carbon, Organic Carbon, and Organic Matter 1. Methods of Soil Analysis. Part 2. Chemical and Microbiological Properties; Purdue University: West Lafayette, IN, USA, 1982; pp. 539–579. [Google Scholar]
  21. Houba, V.J.C.; Van Der Lee, J.J.; Novzamsky, I.; Walinga, I. Soil and Plant Analysis. Aseries of Syllabi, Part 5: Soil Analysis Procedures; Department of Soil Science and Plant Nutrition, Wageningen Agriicultural University: Gelderland, The Netherland, 1988. [Google Scholar]
  22. Clesceri, L.S.; Greenberg, A.E.; Eaton, A.D. Standard Methods for the Examination of Water and Wastewater; American Public Health Association: Washington, DC, USA, 1998; pp. 4–415. [Google Scholar]
  23. Hens, M. Aqueous Phase Speciation of Phosphorus in Sandy Soils. Ph.D. Thesis, Katholieke Universiteit Leuven, Leuven, Belgium, 1999. [Google Scholar]
  24. American Public Health Association. Standard Methodsfor the Examination of Water and Wastewter, 20th ed.; American Public Health Association, American Waterworks Association and Water Environment Federation: Washington, DC, USA, 1998. [Google Scholar]
  25. Brady, N.C. The Nature and Properties and Soils. AK Ghosh; Printing-Hall of India Pvt. Ltd.: New Delhi, India, 1990; p. 383. [Google Scholar]
  26. Avnimelech, Y.; Lacher, M. On the Role of Soil in the Maintenance of Fish Pond’s Fertility. In Hyperophic Ecosystems; Barica, J., Mur, L.R., Eds.; W. Junk BV Publisher: The Hague, The Netherland, 1980; pp. 251–255. [Google Scholar]
  27. Ngo-Hoang, D.L.; Thuy, N.T.T. Local Knowledge Ben Tre’s Coastal on Resilience to Climate Change Background Study (August 27, 2019). Available online: https://ssrn.com/abstract=3367754 (accessed on 13 November 2019). [CrossRef]
  28. James, E.M. Water Quality for Pond Aquaculture; Research and Development Series No.43; International Center for Aquaculture and Aquatic Environment, Alabama Agricultural Experiment Station, Auburn University: Auburn, AL, USA, 1998; pp. 789–811. [Google Scholar]
  29. Guong, V.T. Assessing Soil and Water Quality and Proposing Appropriate Use Measures for Shrimp Farming Models in My Xuyen District, Soc Trang Province (Vietnamese Version); Department of Science and Technology of Soc Trang Province: Soc Trang, Vietnam, 2003. [Google Scholar]
  30. Hung, N.N. Measurement of EC and conversion for salinity evaluation scale of saline soil of rice-shrimp farming in Mekong Delta (Vietnamese). J. Agric. Rural Dev. 2010, 5, 41–45. [Google Scholar]
  31. Lamond, R.E.; Whitney, D.A. Management of Saline and Sodic Soils; Retrieved 10.1; Kansas State University Agricultural Experiment Station and Cooperative Extension Service: Manhattan, KS, USA, 2020. [Google Scholar]
  32. Centre for Meteorological Forecast of Ben Tre. Report on Salinity Instrusion in Ben Tre Province to 2012; Centre for Meteorological Forecast of Ben Tre: Ben Tre, Vietnam, 2012. [Google Scholar]
  33. Ben Tre Department of Resources and Environment. Report on Environmental Context in 2011; Ben Tre Department of Resources and Environment: Ben Tre, Vietnam, 2011.
  34. Hoa, N.M. Additional sources of potassium into the soil in rice-intensive farming systems in the Mekong Delta. J. Soil Sci. 2006, 24, 62–65. [Google Scholar]
  35. Turnbull, P.C.J.; Funge-Smith, S.; Macrea, I.; Slimswan, C. Health Management in Shrimp Pond; Agricultural Publisher: Ho Chi Minh city, Vietnam, 2002. [Google Scholar]
  36. Long, D.N. Giant Freshwater Shrimp (Macrobrachium Rosenbergi) Farming Techniques in Coconut Garden Ditches and in Rice Fields in Ben Tre Province; Can Tho University, Department of Freshwater Aquaculture—Department of Fisheries: Can Tho, Vietnam, 2012. [Google Scholar]
  37. Nho, N.T.; Cuong, T.K.; Diep, L.M.; Ne, V.T.; Lien, N.T.; Hau, N.T.M. Questions About Black Tiger Shrimp; Publisher of Agriculture: Ho Chi Minh City, Vietnam, 2002. [Google Scholar]
  38. Hung, N.P. Cultivation Techniques of Shrimp—Rice Models; Bac Lieu Department of Agriculture and Rural Development, Center for Agriculture and Fishery Extension: Bac Lieu, Vietnam, 2012.
  39. Ayers, R.S.; Westcot, D.W. Water Quality for Agriculture; FAO Irrigation and Drainage Paper. No. 29. Rev. 1; FAO: La Jolla, CA, USA, 1985. [Google Scholar]
  40. Chanratchakool, P. Health Management in Shrimp Ponds; Aquatic Animal Health Research Institute: Bangkok, Thailand, 1998; ISBN 9789747604511. [Google Scholar]
  41. Thu, T.A. Surveying the Quality of Soil, Water Environment in Aquaculture and Nutrient Accumulation in Aquaculture Ponds in Two Districts of Vinh Chau and My Xuyen in Soc Trang Province. Master’s Thesis, Department of Soil Science, Faculty of Agriculture, Can Tho University, Can Tho, Vietnam, 2010. [Google Scholar]
  42. Hung, N.N. Evaluation on methods of phosphorus analysis on corn field in Mekong Delta. J. Soil Sci. 2009, 32, 62–66. (In Vietnamese) [Google Scholar]
  43. Kungvankij, P.; Chua, T.E.; Pudadera, B.J., Jr.; Corre, K.G.; Borlongan, E.; Tiro, L.B., Jr.; Talean, G.A. Shrimp Culture: Pond Design, Operation and Management. 1986. Available online: http://www.fao.org/3/AC210E/AC210E00.htm (accessed on 20 November 2019).
  44. Whetstone, J.M.; Treece, G.D.; Browdy, C.L.; Stokes, A.D. Opportunities and Constraints in Marine Shrimp Farming; Southern Regional Aquaculture Center: Washington, DC, USA, 2000. [Google Scholar]
  45. Long, D.N. Technique for Farming of Blue Prawn (Macrobrachium Rosenbergi) in Coconut Irrigation Canals and in Rice Paddy Fields in Ben Tre. Master’s Thesis, Aquaculture Department, Faculty of Agricuture, Can Tho University, Can Tho, Vietnam, 2012. [Google Scholar]
  46. Hoi, N.D. Management of Water Quality in Aquaculture Pond; Institute for Aquatic Farming: Bac Ninh, Vietnam, 2000. [Google Scholar]
  47. Giang, T.T. Survey on Some Chemical and Physical Properties of Soil and Water of Specialized Systems of Shrimp and Rice Shrimp on Acid Sulfate and Non-Alum Soil in Thoi Binh, Cai Nuoc and Dam Doi districts, Ca Mau. Master’s Thesis, Department of Soil Science, Faculty of Agriculture, Can Tho University, Can Tho, Vietnam, 2003. [Google Scholar]
  48. Te, B.Q. Intensive Shrimp Farming Ensures Food Hygiene and Safety Under the GAP Model; Ministry of Agriculture and Rural Development, Research Institute for Aquaculture 1: Ha Noi, Vietnam, 2009.
  49. Milstein, A.; Islam, M.S.; Wahab, M.A.; Kamal, A.H.M.; Dewan, S. Characterization of water quality in shrimp ponds of different sizes and with different management regimes using multivariate statistical analysis. Aquac. Int. 2005, 13, 501–518. [Google Scholar] [CrossRef]
  50. Hoa, T.V.; Dom, T.V.; Khiem, D.V. Technique for Intensive Farming of Black Tiger Shrimp in 101 Frequently Asked Questions in Aquacultural Production; Youth Publisher: Ho Chi Minh, Vietnam, 2002. [Google Scholar]
  51. Hung, N.P. Technique for Farming of Shrimp-Rice Integrated Model; Centre for Agricultural and Aquacultural Extension, Bac Lieu Department of Agricultural and Rural Development: Bac Lieu, Vietnam, 2012. [Google Scholar]
  52. Lazur, A. Growout Pond and Water Quality Management. JIFSAN (Joint Institute for Safety and Applied Nutrition) Good Aquacultural Practices Program; University of Maryland: College Park, MD, USA, 2007. [Google Scholar]
  53. Wurts, W.A.; Durborow, R.M. Interactions of pH, Carbon Dioxide, Alkalinity and Hardness in Fish Ponds. 1992. Available online: https://appliedecology.cals.ncsu.edu/wp-content/uploads/SRAC-0464.pdf (accessed on 25 November 2019).
  54. Schwedler, T.E.; Tucker, C.S.; Beleau, M.H. Non-infectious diseases. In Channel Catfish Culture; Tucker, C.S., Ed.; Elsevier: New York, NY, USA, 1985; Volume 15, pp. 497–541. [Google Scholar]
  55. Vismann, B. Sulfide species and total sulfide toxicity in the shrimp Crangon crangon. J. Exp. Mar. Biol. Ecol. 1996, 204, 141–154. [Google Scholar] [CrossRef]
  56. Gopakumar, G.; Kuttyamma, V.J. Effect of hydrogen sulphide on two species of penaeid prawns Penauesindicus (H. Milne Edwards) and Metapenauesdobsoni (Miers). Bull. Environ. Contam. Toxicol. 1996, 57, 824–828. [Google Scholar] [CrossRef] [PubMed]
  57. Kutty, M.N. Site Selection for Aquaculture: Chemical Features of Water; Lectures presented at ARAC [African Regional Aquaculture Centre] for the Senior Aquaculturists Course. Port Harcourt (Nigeria); Microfiche no: 297785. RAF/82/009 ARAC/87/WP/12(9); Establishment of African Regional Aquaculture Centre: Aluu, Nigeria, 1987; 40p. [Google Scholar]
  58. Smith, D.M.; Burford, M.A.; Tabrett, S.J.; Irvin, S.J.; Ward, L. The effect of feeding frequency on water quality and growth of the black tiger shrimp (Penaeus monodon). Aquaculture 2002, 207, 125–136. [Google Scholar] [CrossRef]
  59. Te, B.Q. Intensive Shrimp Farming to Ensure Food Safety Following GAP Model; Institute for Aquacultural Research, Vietnam Ministry for Agriculture and Rural Development: Ha Noi, Vietnam, 2009.
  60. Cat, L.V. Treatment of Nitrogen- and Phosphorus-Rich Wastewater; Institute of Science and Technology of Vietnam, Natural Science and Technology Publisher: Ha Noi, Vietnam, 2006. [Google Scholar]
  61. Phu, Q.T. Textbook on Analysis of Water Quality and Pond Environment; Department of Aquaculture, Can Tho University: Can Tho, Vietnam, 2004. [Google Scholar]
  62. Thu, T.A. Survey on Soil and Water Quality for Aquaculture and Nutrition Accumulation in Aquaculture Ponds in Vinh Chau and My Xuyen Dictrict, Soc Trang Province. Ph.D. Thesis, Can Tho University, Can Tho, Vietnam, 2009. [Google Scholar]
  63. Sansanayuth, P.; Phadungchep, A.; Ngammontha, S.; Ngdngam, S.; Sukasem, P.; Hoshino, H.; Ttabucanon, M.S. Shrimp pond effluent: Pollution problems and treatment by constructed wetlands. Water Sci. Technol. 1996, 34, 93–98. [Google Scholar] [CrossRef]
Figure 1. Administrative map of the Thanh Phu district with sampling points.
Agriculture 10 00038 g001
Figure 2. Variations of pH of water in examined farming systems. Notes: a and b are compared according to sampling time, the same letters within the same column or row have no significant difference. The symbols ‘, ‘’’ are used to distinguish different experimental or model areas. ns: no difference (compared at a significance level of 5%).
Agriculture 10 00038 g002
Figure 3. Variations of water salinity in farming models. Notes: a and b are compared according to sampling time, the same letters within the same column or row have no significant difference. The symbols ’, ’’, ’’’ are used to distinguish different experimental or model areas. ns: no difference (compared at a significance level of 5%).
Agriculture 10 00038 g003
Figure 4. Variations of soluble nitrogen in farming models. Notes: a and b are compared according to sampling time, the same letters within the same column or row have no significant difference. The symbols ’, ’’, ’’’, ’’’’ are used to distinguish different experimental or model areas. ns: no difference (compared at a significance level of 5%).
Agriculture 10 00038 g004
Figure 5. Variations of soluble phosphorus content in farming models. Notes: a and b are compared according to sampling time, the same letters within the same column or row have no significant difference. The symbols ’, ’’, ’’’ are used to distinguish different experimental or model areas. ns: no difference (compared at a significance level of 5%).
Agriculture 10 00038 g005
Figure 6. Variations of alkalinity in farming models. Notes: a and b are compared according to sampling time, the same letters within the same column or row have no significant difference. The symbols ’, ’’, ’’’ are used to distinguish different experimental or model areas. ns: no difference (compared at a significance level of 5%).
Agriculture 10 00038 g006
Figure 7. Fluctuations in H2S concentration in farming models.Notes: a and b are compared according to sampling time, the same letters within the same column or row have no significant difference. The symbol ’ is used to distinguish different experimental or model areas. ns: no difference (compared at a significance level of 5%).
Agriculture 10 00038 g007
Figure 8. Fluctuations in chemical oxygen demand (COD) content in farming models. Notes: a and b are compared according to sampling time, the same letters within the same column or row have no significant difference. The symbols ‘, ‘’’ are used to distinguish different experimental or model areas. ns: no difference (compared at a significance level of 5%).
Agriculture 10 00038 g008
Table 1. Sampling labels in arable areas.
ModelDescriptionRegionCommuneNo. of Households
1Rotation of rice (OM10252 salinity-tolerant variety) and corn (MX10 salinity-tolerant variety)FreshwaterQuoi Dien2
2Intercropping of blue prawn (Macrobrachium rosenbergii) in coconut irrigation channelsFreshwaterThoi Thanh6
3Rotation between intercropping of blue prawn in rice paddy fields (OM10252 variety) and blue prawn extensive farmingFreshwaterQuoi Dien2
4Rotation between intercropping of black tiger shrimp (Penaeus monodon) in rice paddy fields and blue prawn extensive farmingBrackishAn Thanh2
5Rotation between aquaculture of black tiger shrimp and white-legged shrimp (Litopenaeus vannamei)SalineGiao Thanh2
6Black tiger shrimp extensive farmingSalineGiao Thanh2
Table 2. Methods of analyzing parameters in the soil environment.
Analytical IndicatorReference Method
pH, ECExtracted with distilled water, extract ratio 1:2.5 (soil: water) and measured by pH, EC meter
NitrogenGianello and Bremner (1986) [18]
PhosphorusOlsen (1954) [19]
Na+, K+, Mg2+, Ca2+Atomic absorption spectrum (AAS)
TOC (total organic carbon)Walkley-Black (1934) [20].
CEC (cation exchange capacity)The measure is determined by a buffer of BaCl2 0.1 M [21]
ESP (Exchange Sodium Percentage)The method is based on the ratio of Na+ adsorbed and cation exchange capacity of the soil (CEC, cmol/kg):
E S P ( % ) = [ N a + ] C E C     ×   100
Table 3. The methods of analysis of indicators in water.
Analytical IndicatorReference Method
pH, ECHanna HI 98129
Dissolved nitrogenPhenate method [22]
Dissolved phosphorusMalachite Green method [23]
Total alkalinity (CaCO3)APHA (1998) method [24]
Hydrogen sulfide (H2S)Clesceri et al. 1998 [22]
CODOxidation method using permanganate kali [22]
Table 4. Value of soil pH in the farming models.
ModelspH
Model 15.90 ± 0.35
Model 26.24 ± 0.08
Model 36.68 ± 0.08
Model 43.82 ± 0.01
Model 55.65 ± 0.55
Model 66.39 ± 0.18
Table 5. Value of soil conductivity of the models.
ModelsEC (mS·cm−1)
Model 11.34 ± 0.36
Model 21.27 ± 0.03
Model 31.08 ± 0.24
Model 43.79 ± 0.15
Model 53.36 ± 0.18
Model 64.99 ± 0.31
Table 6. Value of Na+ exchanged and the percentage of exchangeable sodium (ESP) (%) of the models.
ModelsNa+ (cmol/kg)ESP (%)
Model 11.08 ± 0.238.50 ± 0.23
Model 21.37 ± 0.0510.79 ± 0.05
Model 31.14 ± 0.038.98 ± 0.03
Model 44.22 ± 0.0233.23 ± 0.02
Model 54.78 ± 0.0537.64 ± 0.05
Model 65.13 ± 0.4240.39 ± 0.42

