Article

The Evaluation of Growth Performance, Photosynthetic Capacity, and Primary and Secondary Metabolite Content of Leaf Lettuce Grown under Limited Irradiation of Blue and Red LED Light in an Urban Plant Factory

1
Department of Bio-Health Technology, College of Biomedical Science, Kangwon National University, Chuncheon 24341, Korea
2
Danish Technological Institute, Gregersensvej 7, DK-2630 Taastrup, Denmark
3
Department of Biosystems and Technology, Swedish University of Agricultural Sciences, Box 103, 23053 Alnarp, Sweden
4
Department of Herbal Medicine Resource, Kangwon National University, Samcheok 25949, Korea
*
Author to whom correspondence should be addressed.
Agriculture 2020, 10(2), 28; https://doi.org/10.3390/agriculture10020028
Submission received: 17 December 2019 / Revised: 16 January 2020 / Accepted: 19 January 2020 / Published: 21 January 2020

Abstract

:
Plant production in urban areas is receiving much attention due to its potential role in feeding the rapidly growing population of city dwellers. However, higher energy demands in urban plant factories are among the key challenges that need to be addressed. Artificial lighting is responsible for the most significant levels of energy consumption in plant factories; therefore, lighting systems must be modulated in consideration of the sustainable food–energy nexus. In this context, low light irradiation using blue (B) and red (R) LED was applied in a plant factory for the growth of red leaf lettuce (Lactuca sativa L. var Lollo rosso) to evaluate the growth performance and functional quality. The tested B (450 nm) and R (660 nm) light ratios were B/R = 5:1; 3:1; 1:1; 1:3, and 1:5, with a photosynthetic photon flux density (PPFD) of 90 ± 3 µmol m−2 s−1. In the plant factory, the photoperiod, temperature, RH, and CO2 conditions were 16 h d−1, 20 ± 0.5 °C, 65% ± 5%, and 360 ± 10 μL L−1, respectively. The lettuce was harvested 10 and 20 days after the commencement of LED light treatment (DAT). In this study, normal photosynthetic activity and good visual quality of the lettuce were observed. The results show that a higher fraction of R (B/R = 1:5) significantly increased plant growth parameters such as plant height, leaf area, specific leaf area, plant fresh and dry weight, and carbohydrate content. By contrast, a higher fraction of B (B/R = 5:1) significantly increased the photosynthetic parameters and contents of pigment and phenolic compounds. The rate of photosynthetic performance, carbohydrates (except starch), and content of phenolic compounds were highest after 10 DAT, whereas the pigment contents did not significantly differ at the different growth stages. It is concluded that high R fractions favor plant growth and carbohydrate content, while high B fractions favor photosynthetic performance and the accumulation of pigments and phenolic compounds in red leaf lettuce under limited lighting conditions. This study will help in designing artificial lighting conditions for plant factory production to reduce energy demands.

1. Introduction

Artificial light emitting diodes (LED) have been strategically used for several decades in plant food production in urban plant factories to grow customized functional food. However, the major obstacle for growing plants in a plant factory is the high energy requirements. Therefore, the selection of low-light-adapted plant species and the reduction of energy costs are crucially important in achieving a sustainable urban food supply. In plant factories, most of the energy is consumed by the light sources, heating/cooling, and pump motors for nutrient supply; among these elements, 75% of the energy is consumed by artificial lighting [1]. To reduce light irradiation without hampering plant growth performance represents one of the vital strategies by which to reduce the energy costs of plant factories.
Lettuce is the best-suited candidate crop species to grow in a plant factory due to its low light adaptability. Lettuce leaves are considered as a highly nutritious food source, providing all the recommended macro- and micronutrients for a healthy diet [2]. The nutritional constituents and bioactive compounds of lettuce are customized through the tuning of environmental factors such as light irradiation, light spectra, temperature, relative humidity, and CO2 [3,4].
It has been observed that a customized artificial LED light spectrum has a positive effect on enhancing plant growth in a controlled environment. In the artificial light spectrum, blue (B) (420–450 nm) and red (R) (600–700 nm) light and their combinations are the most operative in terms of encouraging plant growth and development, and in influencing their architecture [5,6,7]. It has previously been reported that considering the total light that plants receive from natural sunlight, 90% of the absorbed light is B and R light [8]. Monochromatic light alone cannot meet the light energy demands for optimal plant growth [9]. B light is associated with physiological responses such as plant phototropism and stomatal opening, and is also absorbed by pigments, thus initiating the photosynthetic process. By contrast, R light regulates photomorphogenesis, energy distribution, and the photosynthetic apparatus [10,11]. Studies show that the phytochemical accumulation in vegetables is affected by genotype and environmental factors, including light [12]. Subsequent studies have shown that the ratio of B and R light is crucial for the accumulation of pigments and phenolic compounds in plants grown in a closed environment [13,14]. Extensive research has been carried out to evaluate the effect of B/R light ratios on lettuce plant growth and development, and has proven to be a useful lighting source for producing many plant species in a controlled environment [15,16,17].
The light spectrum and intensity are the main crucial triggers for plant growth and development; however, light intensity plays a significant role in stimulating the biosynthesis of secondary metabolites [18]. Previously, Urrestarazu et al. [19] stated that leaf lettuce showed high energy efficiency and sufficient morphological response when grown under very low light (e.g., 85 µmol m−2 s−1) irradiation; therefore, lettuce may be considered a low-light-adapted crop species [20]. A recent report by Rouphael et al. [21] stated that lettuce growth parameters were accelerated when grown under more intense light (420 µmol m−2 s−1) compared to lower light irradiation (210 µmol m−2 s−1), and, at the same time, that bioactive compounds and mineral contents were increased under lower light irradiation compared to higher levels. Under a low light regime, the plant tends to accumulate micronutrients in its sink, resulting in lower plant growth rates as well as lower biomass accumulation.
Plant production in plant factories under different combinations of BR light under a higher light regime has been well studied, and extensive research reports have already been published [15,21]. However, achieving a sustainable food–energy nexus through the reduction of lighting energy expenses by using low levels of light irradiation while maintaining effective production is of great interest for urban plant factory systems [22]. Previously, very low levels of LED light irradiation were applied to successfully grow leaf lettuce [19]; however, the B and R light ratios need to be optimized in order to determine the lowest effective intensity.
On a larger scale, plant factories typically produce more plants per unit area compared to conventional field cultivation; however, energy consumption is higher in the former. Therefore, the optimization of customized proprieties for plant production is a decisive strategy by which to improve the efficiency of resource use [23]. Moreover, many research strategies are being developed to grow plant foods in extreme environments, such as in the arctic region and even space farming [24]. Given these backgrounds, the design and development of species-specific factors is a crucial in establishing the sustainability of food–energy nexus. Artificial LED provides a means by which to control the light intensity according to precise spectrum with lower energy demand. The required electricity demand per kg vegetable production is approximately 10–17.5 kW∙h/kg in plant factories [22,25]. This electricity consumption could be reduced by decreasing the lighting quantity per unit area and shortening the photoperiod in a plant factory [26].
Artificial LED lighting has the capability to regulate the light quality and quantity, thus enabling the required lighting for a precise crop according to its developmental stage [27]. It is hypothesized that an optimal combination of B/R light under low light irradiation will improve plant production while reducing energy expenses. Therefore, the objective of this study was to determine the optimal B/R light ratios under a low light regime by assessing growth characteristics, net photosynthetic rate, stomatal conductance, chlorophyll fluorescence, carbohydrates, pigments, and phenolic contents in leaf lettuce cultured in a plant factory toward achieving sustainability in urban food production systems.

2. Materials and Methods

2.1. Plant Materials and Growth Conditions

Seeds of red leaf lettuce (Lactuca sativa L. var Lollo rosso) were sown in a 60-cell substrate plug tray ‘Ellepress’ (Ellegaard A/S, Viborg, Denmark) and placed in a climate chamber. The photosynthetic photon flux density (PPFD) in the climate chamber was 150 ± 5 µmol m−2 s−1 at the plant canopy level (30 cm from the light source) from LED lamps with a B/R ratio of 3:5 (Green Power LED Production module deep red/blue 150. Philips, Pila, Poland). During lettuce seedling production, the PPFD was fixed at 150 ± 5 µmol m−2 s−1 as this intensity corresponds to what is used in commercial practice and has been demonstrated as the ideal irradiation for obtaining viable lettuce seedlings. Other environmental factors of the climate chamber such as temperature, photoperiod, and relative humidity were maintained at 20 ± 0.5 °C, 16 h/d, and 75% ± 5% RH, respectively.
After growing for 15 days, the seedlings were moved to the plant factory equipped with artificial B and R LED light. A plate type B and R light emitting diode (LED) light (APL 0018-A, Stanley Electric Co., Ltd., Tokyo, Japan) was used as a sole lighting source. The spectral energy distribution of B (peak at 450 nm) and R (peak at 660 nm) LED lights were determined using a calibrated spectrometer (Jazz, Ocean Optics Inc., Florida, USA). Five different B/R light ratios were adjusted for this study, namely, B/R = 5:1; 3:1; 1:1; 1:3, and 1:5 (Figure 1). The photosynthetic photon flux density (PPFD), photoperiod, temperature, and relative humidity were maintained and monitored at 90 ± 3 µmol m−2 s−1, 16 h d−1, 20 ± 0.5 °C, and 65% ± 5%, respectively, at the plant canopy level (35 cm below the light panel). The lettuce was harvested 10 and 20 days after the onset of LED light treatment (DAT). Plants were watered as required using the ebb and flow method with a nutrient solution.

2.2. Leaf Photosynthesis and Chlorophyll Fluorescence

The net photosynthetic rate (Pn) and stomatal conductance (gs) were measured on well-developed leaves (third leaf from the top) for six plants under each treatment using an open system infrared gas analyzer (CIRAS-2, PP Systems, Hitchin, Herts, UK) with a PLC6 (U) Automatic Universal Leaf Cuvette (1.7 cm2). The measuring conditions were as follows: 400 µmol mol−1 CO2, airflow 200 mL min−1, temperature 20 ± 1 °C, vapor pressure deficit (VPD) 10 ± 3 mbar, and 50% ± 10% RH during measurement. The maximum photochemical efficiency of PSII (Fv/Fm) was measured on fully expanded leaves (second/third leaf from the top) with a miniaturized pulse-amplitude-modulated photosynthesis yield analyzer, MINI-PAM (Walz, Effeltrich, Germany). Before measuring the chlorophyll fluorescence, the selected leaves were adapted in the dark for 30 min by leaf clips (DLC-8, Walz, Effeltrich, Germany) to obtain the maximum oxidized state of PSII–PSI electron transport carriers. The Fv/Fm was calculated according to Maxwell and Johnson [28].

2.3. Growth Analysis

Ten plants from each treatment were selected for growth analysis. Plant height was measured from base to shoot tip using a ruler, and the leaf number was counted. Plant fresh weight (FW) and dry weight (DW) were measured using an electric balance (PG 5002 Delta range, Mettler Toledo, Hampton, USA). The DW was determined after drying in an oven for 24 h at 50 °C (Heraeus, D-63450, Hanau, Germany). Leaf area was measured using a leaf area meter (LI-3100, LI-COR, Inc., Lincoln, Nebraska, USA). Specific leaf area (SLA) was calculated according to the following equation: SLA (cm2 g−1) = leaf area/leaf DW.

2.4. Extraction for Polyphenol Analysis

Six samples (approximately 5–10 g) from six plants of each treatment were collected and wrapped with aluminum foil. The collected samples were immediately plunged in liquid nitrogen and stored at −80 °C until extraction. The protocol described by Ferreres et al. [29] was followed to extract the polyphenol compounds. Five grams of frozen plant material was homogenized with 5 mL of MeOH/AcOH/H2O (25:4:21) using Ultra-turrax homogenizer at 13,500 rpm for approximately 1 min. Aliquot and plant particles were separated through a filter paper (00H, Munktell filter AB, Delsjofors, Sweden). Prior to HPLC analysis, an aliquot was filtered through a 0.45 µm syringe filter (Q-Max syringe filters, Frisenette Aps, Knebel, Denmark).

2.5. Estimation of Flavonoid, Anthocyanin, and Chlorogenic Acid by HPLC

High-performance liquid chromatography (Ultimate 3000, Dionex, Midland, ON, Canada) was used to analyze flavonoid, anthocyanin, and chlorogenic acid content. Chromatographic separation was performed using a Hypersil GOLD RP-18 column (250 mm × 4.00 mm, 5 µm) equipped with a photodiode array detector (Dionex Ultimate PDA-3000) at a flow rate of 1 mL min−1 at 30 °C with an injection volume of 30 µL. Eluent A contained 0.05% trifluoroacetic acid (TFA) in MeOH and eluent B contained 0.05% TFA in H2O. A linear gradient was used, starting with 5% B in A to reach 40% B in A in 25 min. Chromatograms for chlorogenic acid and flavonoid were recorded at 330 nm and for anthocyanin at 520 nm wavelength. Chlorogenic acid, flavonoid, and anthocyanin were quantified against chlorogenic acid, quercetin 3-glucoside, and cyanidin 3-glucoside standard, respectively. The results were expressed as µg g−1 FW.

2.6. Carbohydrate and Pigments Analysis

Six samples (each sample contained two leaf disks, 7 mm diameter) from a fully developed leaf (second/third leaf from the top) in each treatment were collected. The leaf disks were placed in a pre-weighed tube (Eppendorf 1.5 mL) and then immediately plunged in liquid nitrogen and stored at −80 °C until freeze-drying. Before extraction, all frozen samples were freeze-dried, weighed, and ground in a mixer mill (MM200; Retsch, Haan, Germany). Carbohydrates were extracted using the method described by Kjaer et al. [30]. In brief, 3–7 mg of freeze-dried sample was placed in an Eppendorf tube, and 400 µL of 80% ethanol (96% ethanol/10 mM HEPES = 80:20 (v/v)) was added followed by vortexing. The samples were shaken by a hot mixer (Eppendorf Thermomixer Comfort) at 1300 rpm at 80 °C for 15 min and then centrifuged at 14,000 rpm for 4 min. The supernatant was collected in a 2 mL Eppendorf vial and kept on ice in the dark. The remaining pellet was again extracted with 400 µlL of 50% ethanol (96% ethanol/10 mM HEPES/ddH2O = 50:20:30 (v/v)) and the supernatant was collected. The pale-colored pellet was kept in a fume hood overnight to allow the evaporation of ethanol. The supernatant was analyzed for pigments and soluble sugars, whereas the pellet was analyzed for glucose residues enzymatically reduced from starch.
Pigments were analyzed using a Spectrophotometer (UV–VIS Spectrophotometer, SHIMADZU) at different wavelengths: 470, 648.6, and 664.2 nm. The content of chlorophyll (chl) a, chl b, total chl and carotenoid were calculated according to Lichtenthaler [31] and expressed as mg g−1 DW. After pigment analysis, the remaining extract was analyzed for soluble sugars.
The pellet was prepared for starch analysis as described by Kjaer et al. [30]. In brief, 1000 µL of distilled water was added to the Eppendorf tube and vortexed. The samples were autoclaved at 120 °C for 90 min. The samples were then vortexed, and 100 µL of the sample was added to 400 µL enzyme buffer solution (385 µL Na-acetate/4 µL amyloglucosidase/0.16 µL α-amylase, pH 4.9). The samples were shaken with 800 rpm at 37 °C for 16 h (Eppendorf Thermomixer Comfort, Hamburg, Germany). After centrifuging at 13,000 rpm for 5 min, the supernatant was collected and filtered through a 0.45 µm syringe filter. The starch and soluble sugar concentration were analyzed by ion chromatography using a Dionex ICS-3000 (Dionex, Sunnywale, CA, Sunnyvale, USA) according to Kjaer et al. [30].

2.7. Statistical Analysis

Data were analyzed by one-way ANOVA using the R version 3.0.1 (The R Foundation for Statistical Computing, 2019). All data were expressed as mean ± SD of multiple measurements. The obtained results were compared among the different B/R light ratios using a paired t-test in order to observe the significant differences at the level of 5%.

3. Results and Discussion

3.1. Lettuce Plants Adapt Their Photosynthetic Apparatus to the Light Conditions

As light intensity increases, plants use the absorbed light less efficiently for photosynthesis while the rest of the absorbed light energy is dissipated as heat or chlorophyll fluorescence [32]. Therefore, lower light intensity is expected to be relatively more efficiently used in the photosynthesis process [33]. Lettuce seedlings were grown under B/R ratio = 3:5 with relatively higher intensity (PPFD) compared to treatment to obtain uniform seedlings as this ratio and PPFD correspond with what is commercially used for the production of leaf lettuce seedlings.
Lettuce plants grown under different B/R light ratios had substantially different leaf net photosynthetic rate (Pn), stomatal conductance (gs), and chlorophyll fluorescence (Fv/Fm) (Figure 2), especially after 10 DAT. It was observed that a higher fraction of B light (B/R = 5:1) significantly increased Pn, and that increasing B/R ratios had a continuous increasing effect on gs and Fv/Fm in young lettuce plants after 10 DAT. This effect disappeared for Pn and Fv/Fm after 20 DAT, whereas increasing B light still seemed to have some effect on gs. The results demonstrate that the plants were adapting to the new light conditions after they were placed in the light treatments with both different B/R light ratios and lower light intensity, and they were close to being fully adapted after 20 DAT.
Our results show that when increasing the B light fraction in B/R light combinations, the plants responded by increasing the capacity of their photosynthetic apparatus as reflected by increased Fv/Fm ratio and chl a content, with a direct effect on Pn. The same trend of increasing Pn in response to higher B light was also observed in rice plants [34] and in cucumber [9]. B light has earlier been shown to increase the total chl content of lettuce leaves [35]. Wang et al. [36] reported that lettuce plants grown under enriched B light led to increased gs, resulting in higher Pn. In our study, gs of 200–400 µmol m−2 s−1 in the 1:5, 1:3, 1:1, and 3:1 treatments was probably not low enough to limit CO2 for photosynthesis compared with the 5:1 treatment, where gs was 500 µmol m−2 s−1 after 10 DAT.
It is known that stomatal regulation is a B light-mediated response regulated by phototropin receptors [37] and controlled by a negative electrical gradient potential in the plasma membrane, which increases the potassium content in the guard cell and drives stomatal opening [38]. The B light response of improved stomatal regulation was confirmed by Shimazaki [39], who noted that a higher B/R ratio improved the stomatal regulation by activating a signaling cascade of phototropins.
In our study, the Fv/Fm ratio was significantly increased by higher B/R light for the young lettuce plants after 10 DAT. Similar results were also shown by Son et al. [15], who demonstrated that the Fv/Fm ratio decreased when the fraction of R light increased in leaf lettuce. However, higher Fv/Fm ratios are also seen as a response to low light intensities, which is part of a common shade adaptation strategy [40]. It was noted that the Fv/Fm ratio is aligned with the photochemical efficiency of PSII, and that low Fv/Fm values may indicate plant stress [28]. The high values of Fv/Fm in the present study displayed that the plants were not stressed. Overall, the results demonstrate that the lettuce plants had increased maximum photochemical efficiency of PSII and had acclimated to the different light conditions after being exposed to the different B/R ratios for approximately 20 DAT.

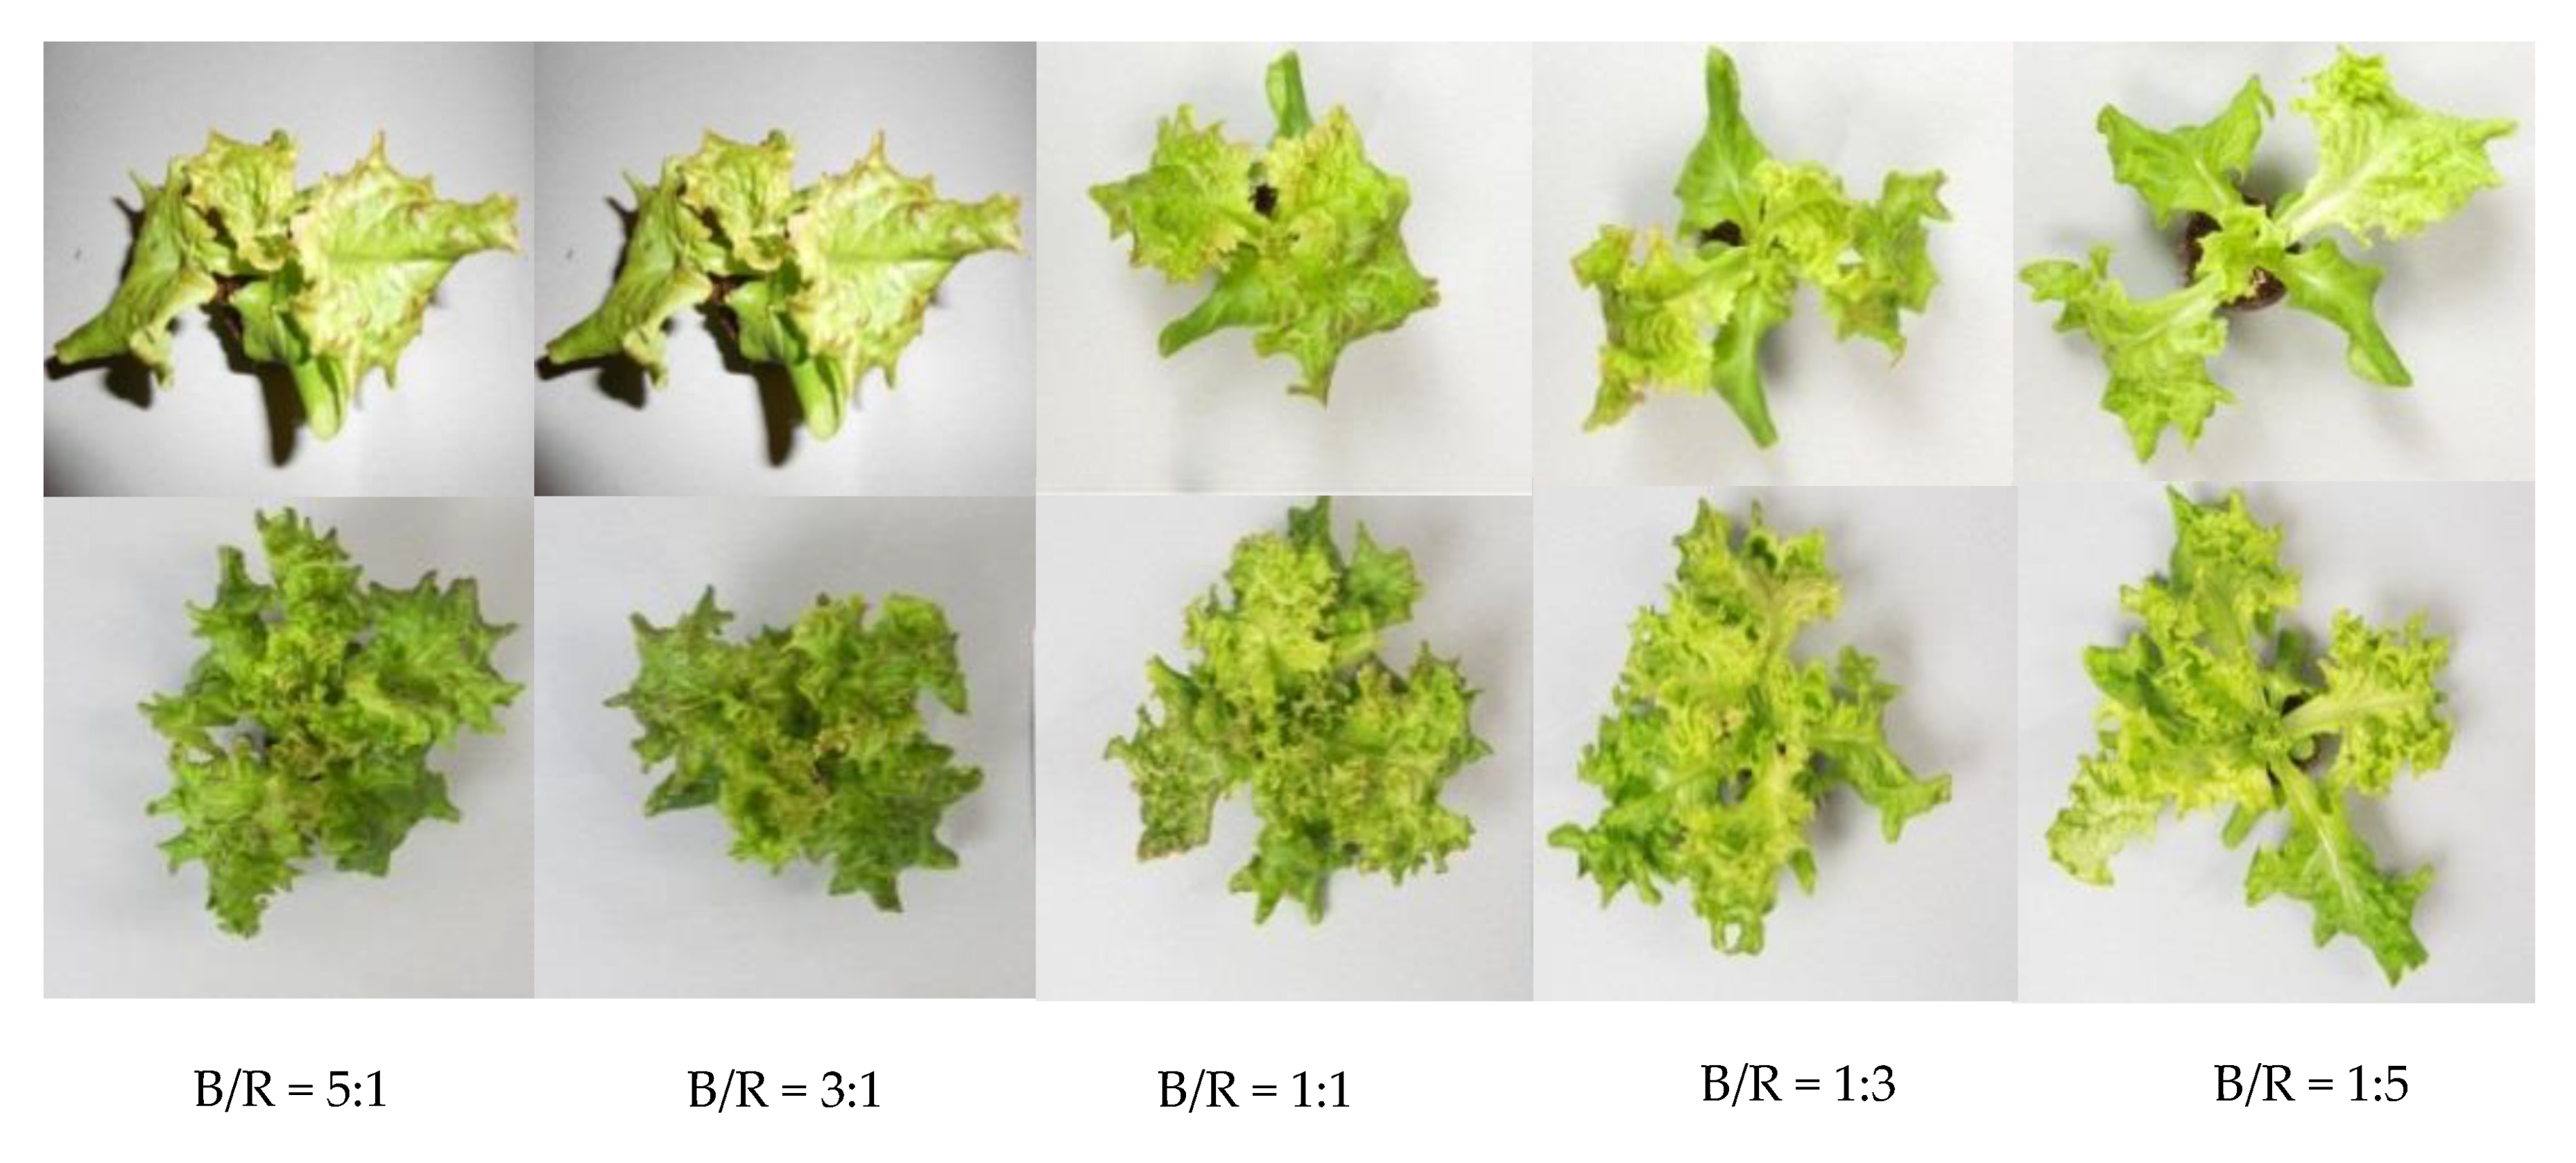
3.2. Lettuce Morphology Characteristics Are Affected by the B/R Light Ratio

The different B/R light ratios had significant effects on the growth and morphology characteristics of lettuce at both harvesting stages (Table 1 and Table 2). From our study, it was observed that an overall increasing fraction of R light (B/R = 1:5) increased plant height, leaf area (LA), specific leaf area (SLA), fresh weight (FW), and dry weight (DW) at both harvesting days (10 and 20 DAT).
Lettuce plants have earlier been shown to have a higher growth rate, i.e., plant height, LA, SLA, FW, and DW, when they were exposed to a high portion of R light [15]. The constructive effect of R light on the growth of various herbs has previously been studied [17,41]. It is understood that R light stimulates phytochrome photoreceptors (PPs) through activation of the HY5 gene, which regulates plant growth [42,43]. Martinez-Garcia et al. [44] also exemplified that R light activates PPs, which induces relocalization to the nucleus and modulates gene expression. In the present study, plant height, LA, and SLA were significantly increased by a higher R light fraction in BR light ratios. These results support earlier evidence that increasing the ratio of R to B light increases the hypocotyl length in lettuce [45]. The lower leaf LA and plant height in treatments with high B/R light ratios may be associated with a B light-mediated inhibition of cell expansion [46]. A similar result was reported by Samuoliene et al. [47], who showed that an optimal combination of B/R light ratios enhances the plant growth rate in controlled conditions. However, the optimal B/R ratio differed according to plant species, growth periods, and the targeted qualities [48].
Lettuce plants had a compact leaf arrangement with dark green color and small petioles when grown under a higher B light fraction (B/R = 5:1), whereas plants grown under a lower B light fraction had a pale green color and leaves that were more spread out and with long petioles (Figure 3). Kang et al. [49] also reported that lettuce plants had compact leaves and short petioles under higher B/R light ratios.
Johkan et al. [35] showed that compact growth and reduced height of lettuce is typical when a plant is exposed to B light. Chatterjee et al. [50] reported that B light was intercepted via cryptochrome photoreceptors (CRY1) to upregulate gene expression within the gibberellic acid biosynthetic pathway. As a result, B light caused short stems and compact growth. Similar effects of B and R light on lettuce morphology were observed by Metallo et al. [51]. They found kale to be short and compact when grown under higher B/R light ratios. Previous researchers described that varying the fraction of R and B light is a useful tool to obtain the desired morphological shape of targeted plants [52,53].

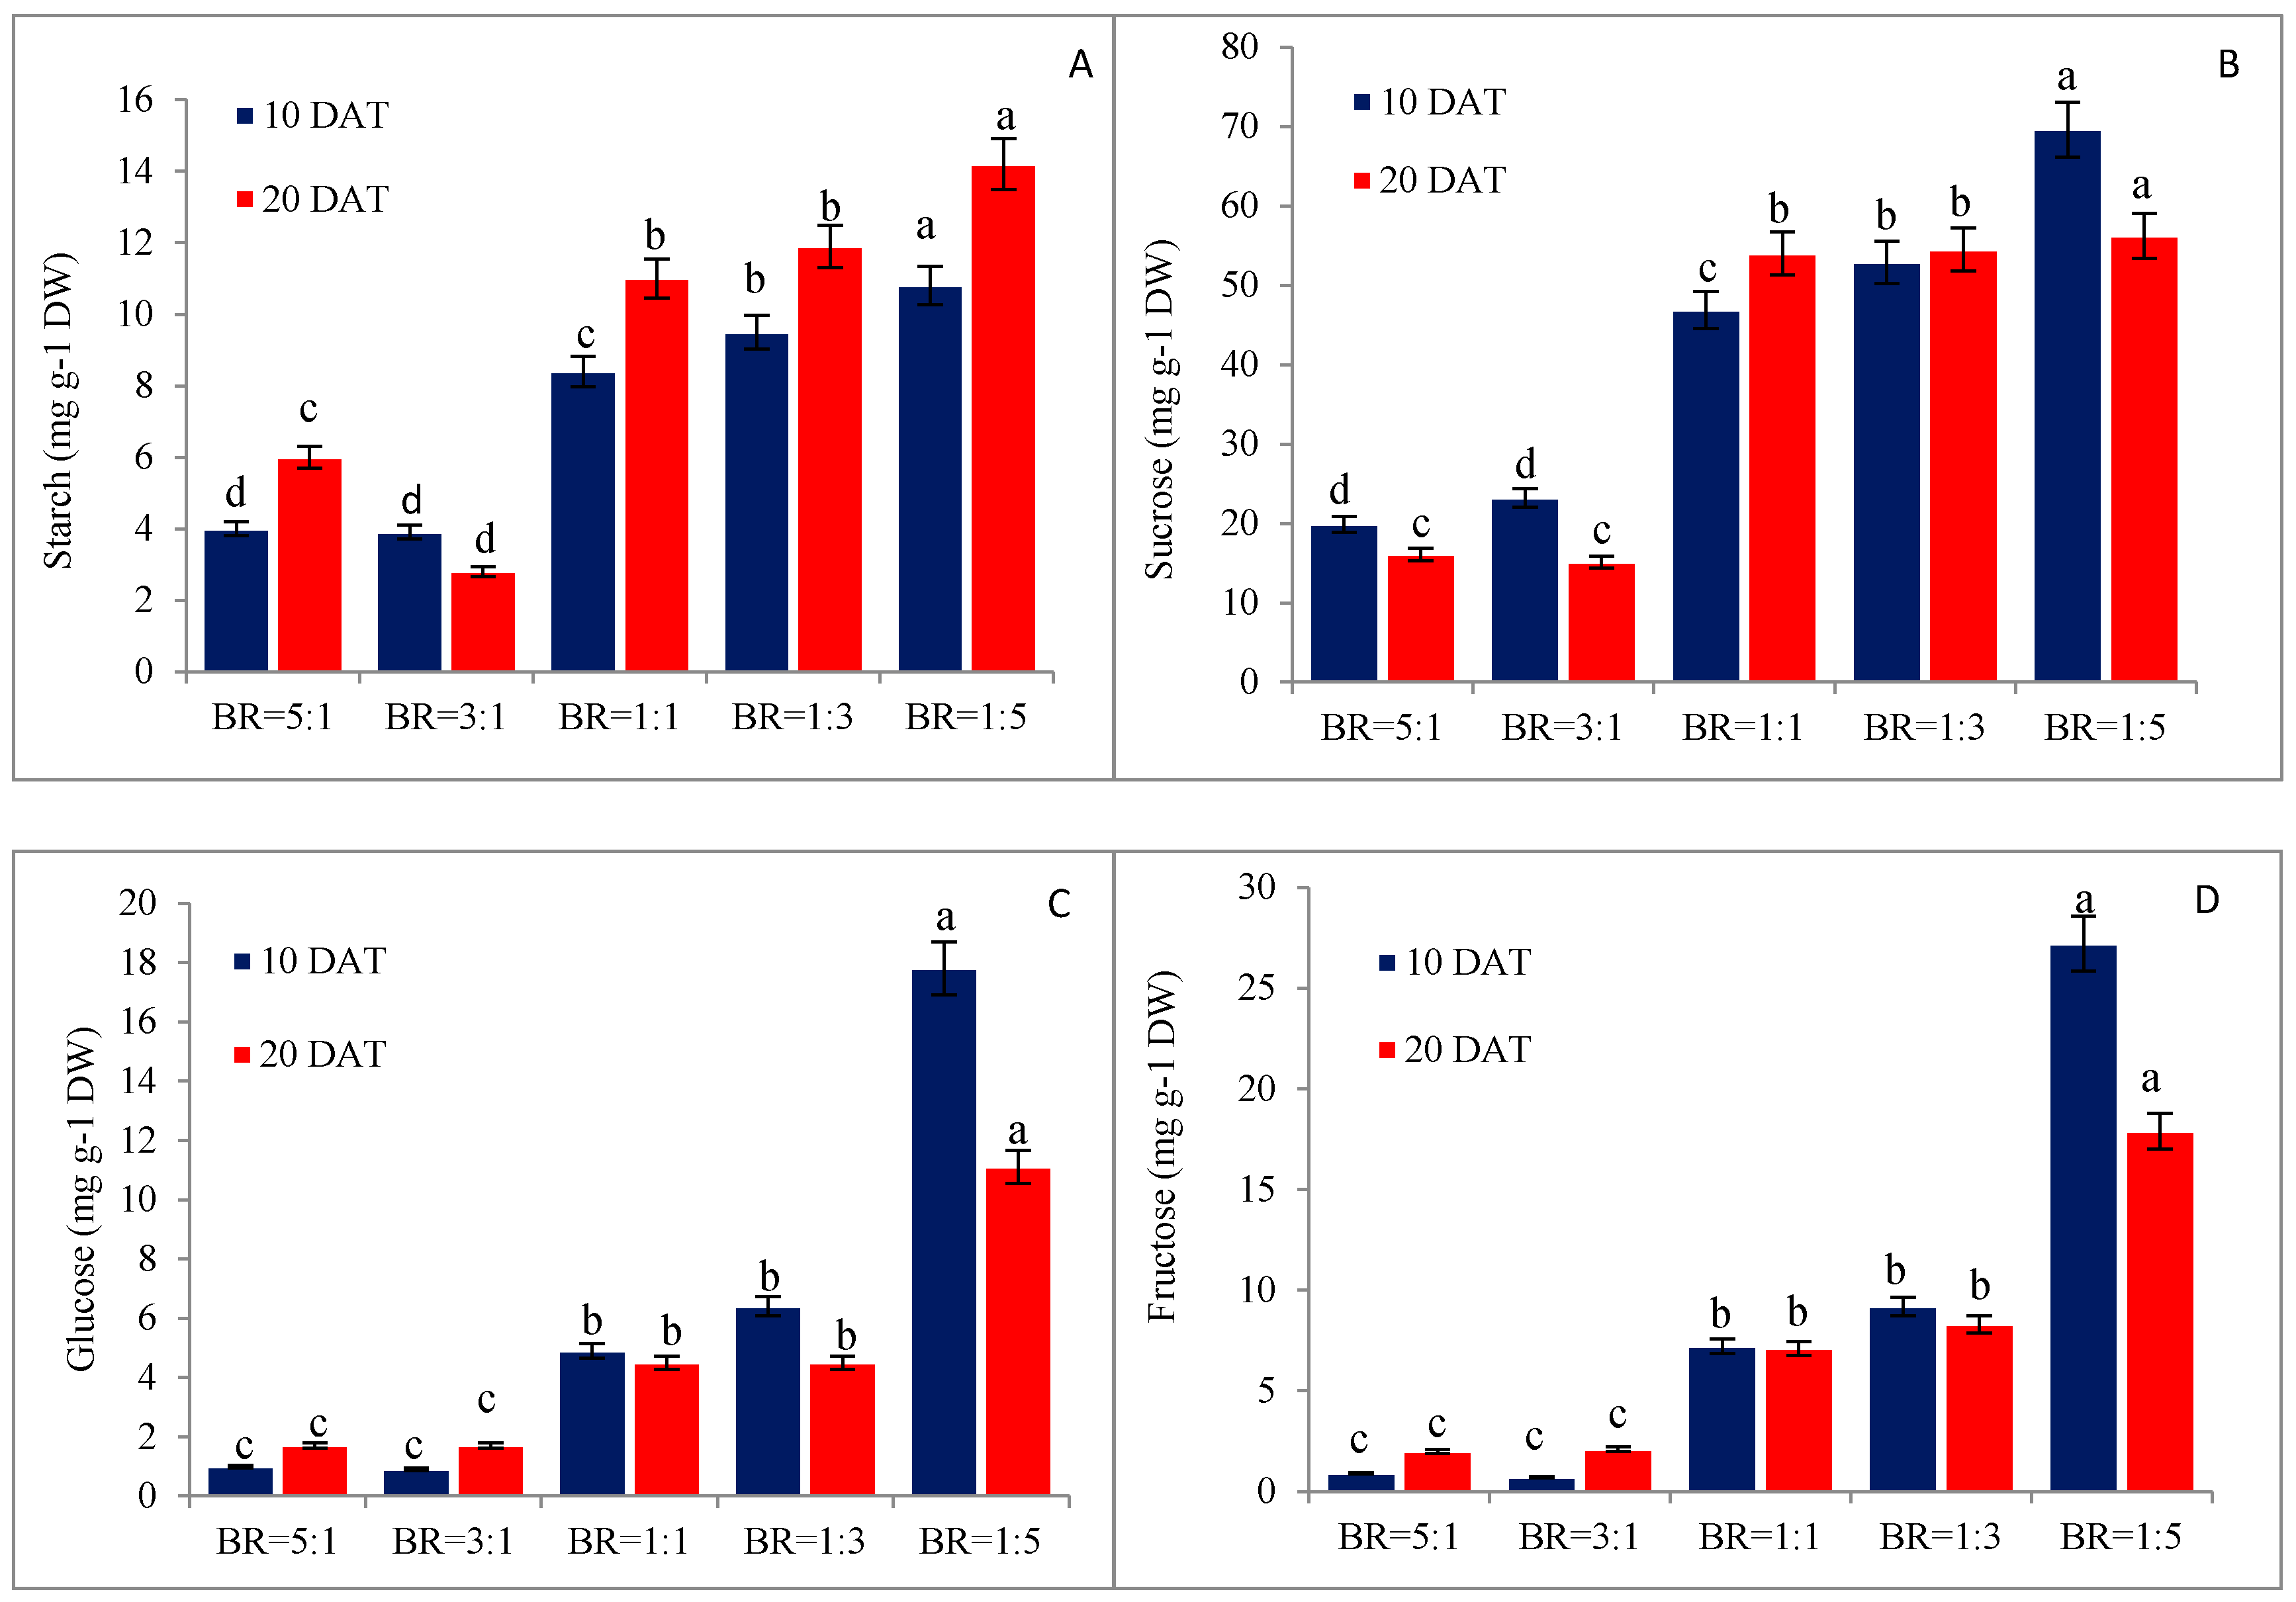
3.3. Red Light Increase Carbohydrate Contents

Glucose, fructose, sucrose, and starch contents in lettuce were significantly increased under lower B/R light ratios (1:1, 1:3, 1:5) at both growing stages (Figure 4A–D). Carbohydrates are the final product of photosynthesis and an important parameter to assess the nutritional quality of lettuce [54]. Generally, high soluble sugars such as glucose, fructose, and sucrose content in lettuce resulted in a more pleasant taste [54]. According to our data, glucose, fructose, and sucrose increased with an increasing portion of R light. Previously, it was reported that R light is the most effective light source for accumulating starch in many plant species, including Chinese cabbage, soybean, and sorghum [55]. R light prevents the translocation of photosynthates and, thus, enhances starch accumulation [56]. The present results also demonstrate that a high portion of R light promoted the starch content in lettuce, whereas the starch content was lower in high B light treatments, consistent with a previous study [57]. Poffenroth et al. [58] demonstrated that B light degrades starch to sucrose but, on the other hand, sucrose was converted to starch by red light in the presence of KCl. Yagi et al. [59] also described that R light stimulated starch accumulation by increasing the abundance of a number of enzymes related to carbon fixation in the Calvin cycle. Li et al. [55] found higher soluble sugar concentrations under R light compared to B light in pea sprouts and Chinese cabbage.
In the current study, the starch concentration was higher at 20 DAT, whilst the concentration of soluble sugars had a declining trend at 20 DAT (Figure 4). Cheng et al. [60] noticed that plant source–sink relationships influence the carbohydrate allocation during plant growth. Sucrose is the primary carbohydrate that is translocated from source to sink tissues. Lettuce plants might have low sink demand owing to low developmental progress at later growth stages. This hypothesis is supported by Cheng et al. [60], who found lower carbohydrate contents at later growth stages in peach.

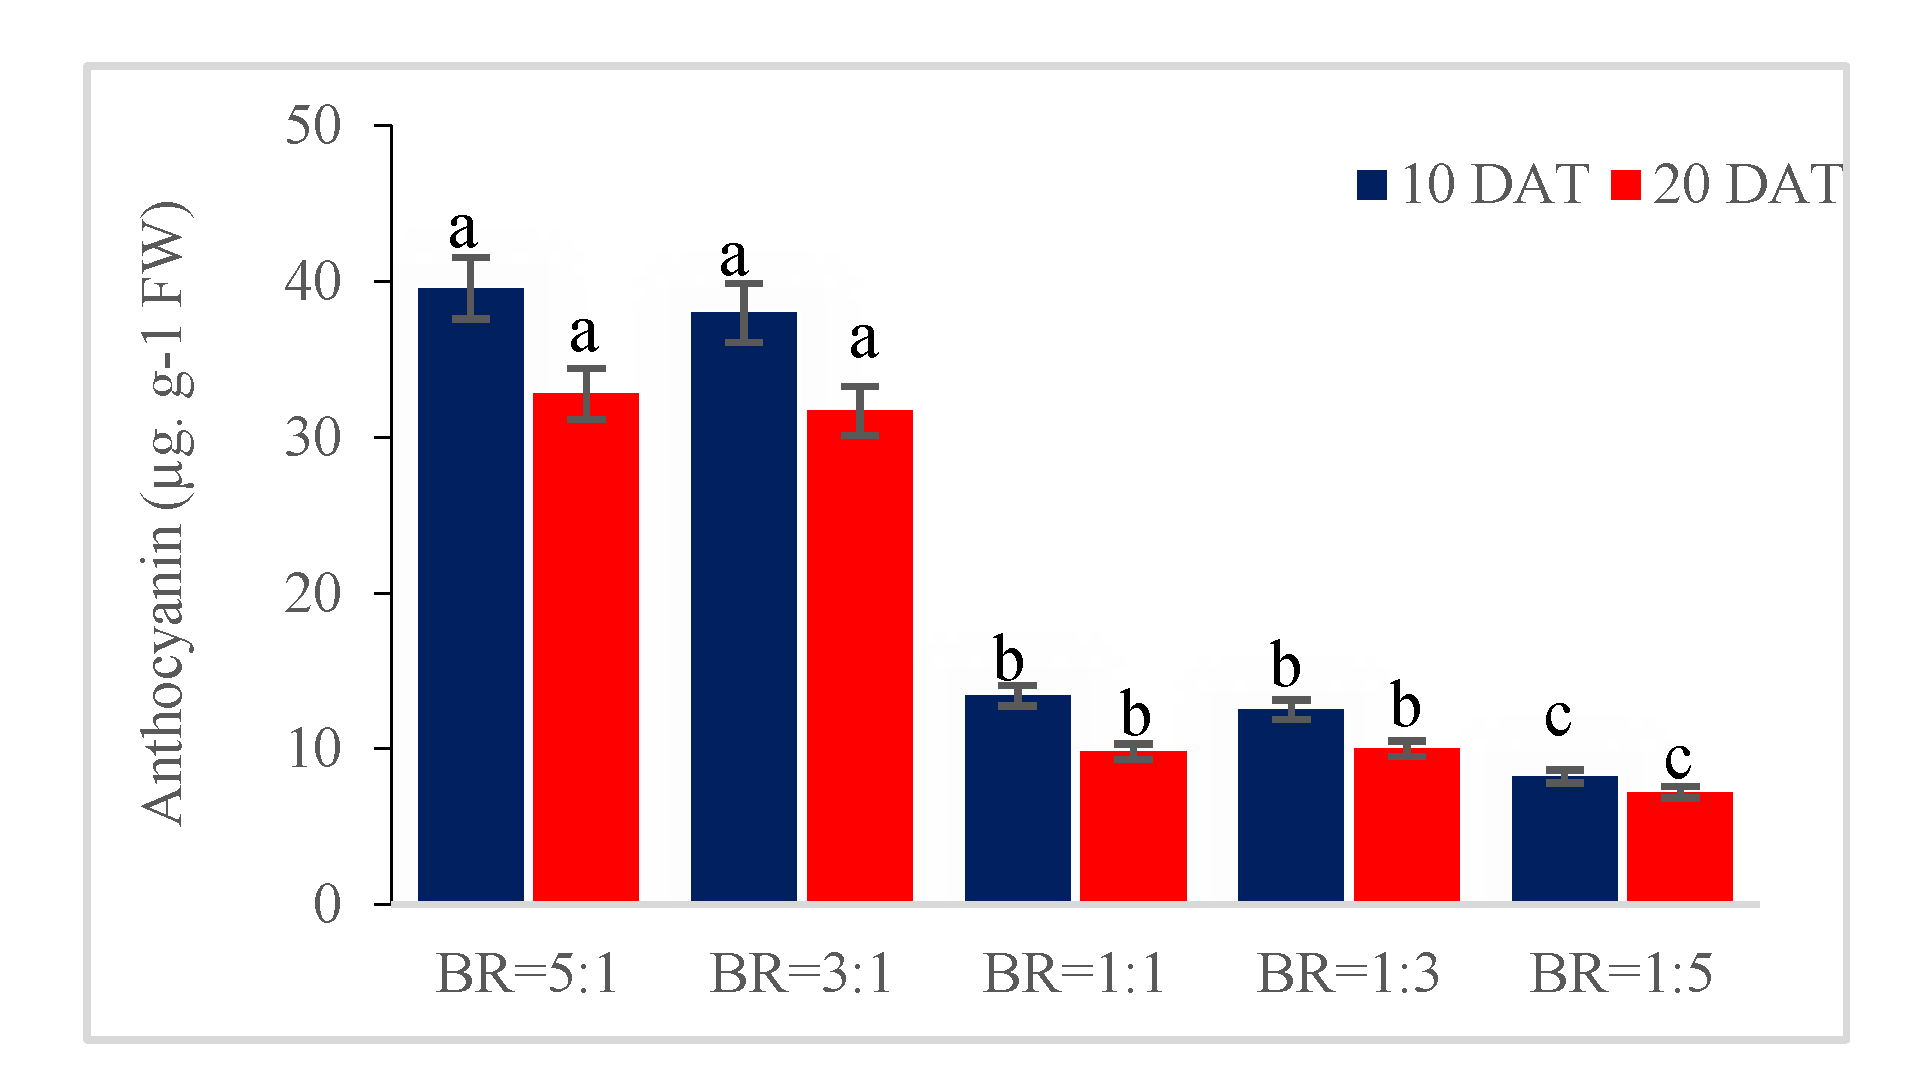
3.4. Blue Light Increases the Leaf Content of Pigments

In our study, the chlorophyll (chl) a, chl b, chl a/b ratio, total chl, and carotenoids were significantly increased in lettuce grown under higher B/R ratios at both harvesting times (Table 3). It is well established that plant pigments receive a very specific light spectrum through their light harvesting antenna, i.e., chlorophyll and carotenoid pigment absorb at wavelengths 400–500 nm and 630–680 nm of the light spectrum [44,54].
B light is profusely absorbed by the photosynthetic antenna of plant pigment, which works as a catalytic agent to accumulate the pigment including chl and carotenoid content in plant leaves [9,57].
In our current study, it is demonstrated that higher B/R light enhanced the chl and carotenoid content in leaf lettuce. This finding is consistent with the previous reports of Li et al. [55] and Son et al. [15]. The enhanced chl and carotenoid content of lettuce under B light treatment are due to the stimulation, induction, and synthesis of the principal gene (PAL gene activity) in chl and carotenoid by B light [61,62]. Earlier Johkan et al. [35] stated that chl molecules and pn have a linear relationship in which a higher chl could increase the rate of pn. In the current study, it is shown that higher chl molecules increased the rate of pn (Table 3 and Figure 2). Plants were grown under higher B/R light ratios had a higher chl a/b ratio. A higher chl a/b indicates a high-light-adapted photosynthetic apparatus and a higher capacity for electron transport in the Calvin cycle [63]. Enhanced chl content under higher B light treatment is associated with pn activities. Yu et al. [64] stated that the enhancement of carotenoid under higher B/R ratio is due to the stimulation of cryptochrome activity.

3.5. Blue Light Increases the Content of Phenolic Compounds

Anthocyanin, flavonoids, and chlorogenic acids significantly increased when B light was favored in the balance between B and R (Figure 5 and Figure 6). High B/R light ratios have also earlier been shown to be vital for the accumulation of bioactive compounds such as anthocyanin, chlorogenic acid, and flavonoids in lettuce [15,35]. Furthermore, in our study, all phenolic compounds were higher after 10 DAT than 20 DAT (Figure 5, Figure 6 and Figure 7). It has earlier been reported that the accumulation of bioactive compounds depends on the plant growth stage [65]. In previous reports, the levels of anthocyanin, chlorogenic acid, and flavonoid were found to be higher in developing leaves than the comparatively matured leaves in leaf lettuce [35].
Bian et al. [66] noted that a higher B/R light fraction led to increased anthocyanin content in leaf lettuce. The previous report revealed that B light is the most operative light spectrum for the synthesis of anthocyanin and flavonoid compounds by stimulating PAL (phenylalanine ammonia-lyase), CHS (chalcone synthesis), and DFR (dihydroflavonol-4-reductase) gene expression [67]. B light has also been shown to be the most effective light for promoting chlorogenic acid synthesis [68]. Giliberto et al. [69] reported that B light photoreceptors, such as cryptochromes, are involved in chlorogenic acid synthesis. The study showed that B light stimulated PAL (phenylalanine) activity in phenylpropanoid pathways, which promotes chlorogenic acid accumulation [70].

4. Conclusions

In this study, we have demonstrated that lettuce plant exhibits normal growth and metabolic activity when grown under comparatively limited BR light irradiation. Overall, the results show that the lettuce plants appeared more compact when grown under higher B light fraction, with smaller leaves at an early stage. It was also observed that higher B light fraction increased the content of pigments and phenolic compounds while higher R light fraction increased the carbohydrate contents. This knowledge can be used to select the most appropriate B/R light ratio for lettuce production under low light regimes in urban plant factories and under extreme conditions, such as in arctic regions or even in space farming.

Author Contributions

M.O.K.A. performed the experiment, analyzed the data, and drafted the manuscript, K.H.K. assisted performing the experiment, and the analysis of the data, and critically reviewed the manuscript, M.A., M.T.N., C.H.P., I.J.S., J.D.L. and Y.S.L. revised and improved the manuscript. All authors have read and agreed to the published version of the manuscript.

Funding

This research was funded by the Aarhus University, Denmark.

Acknowledgments

We highly acknowledge the Department of Food Science, Aarhus University, Denmark, for their kind cooperation in performing this experiment.

Conflicts of Interest

The authors declare no conflict of interest.

References

  1. Kozai, T. Smart Plant Factory—The Next Generation Indoor Vertical Farms; Springer: Berlin, Germany, 2018. [Google Scholar]
  2. Mou, B. Nutritional quality of lettuce. Curr. Nutr. Food Sci. 2012, 8, 177–187. [Google Scholar] [CrossRef]
  3. Konstantopoulou, E.; Kapotis, G.; Salachas, G.; Petropoulos, S.A.; Karapanos, I.C.; Passam, H.C. Nutritional quality of greenhouse lettuce at harvest and after storage in relation to N application and cultivation season. Sci. Hortic. 2010, 125, 93–94. [Google Scholar] [CrossRef]
  4. Park, Y.G.; Park, J.E.; Hwang, S.J.; Jeong, B.R. Light source and CO2 concentration affect growth and anthocyanin content of lettuce under controlled environment. Hortic. Environ. Biotechnol. 2012, 53, 460–466. [Google Scholar] [CrossRef]
  5. Naznin, M.T.; Lefsrud, M.; Gravel, V.; Azad, M.O.K. Blue light added with red LEDs enhance growth characteristics, pigments content, and antioxidant capacity in lettuce, spinach, kale, basil, and sweet pepper in a controlled environment. Plants 2019, 8, 93. [Google Scholar] [CrossRef] [PubMed] [Green Version]
  6. Naznin, M.T.; Lefsrud, M.; Azad, M.O.K.; Park, C.H. Effect of different combinations of red and blue LED light on growth characteristics and pigment content of in vitro tomato plantlets. Agriculture 2019, 9, 196. [Google Scholar] [CrossRef] [Green Version]
  7. Chen, X.L.; Yang, Q.C.; Song, W.P.; Wang, L.C.; Go, W.Z. Growth and nutritional properties of lettuce affected by different alternating intervals of red and blue LED irradiation. Sci. Hortic. 2017, 223, 4–52. [Google Scholar] [CrossRef]
  8. Terashima, I.; Fujita, T.; Inoue, T.; Chow, W.S.; Oguchi, R. Green light drives leaf photosynthesis more efficiently than red light in strong white light: Revisiting the enigmatic question of why leaves are green. J. Plant Cell Physiol. 2009, 50, 684–697. [Google Scholar] [CrossRef] [Green Version]
  9. Hogewoning, S.W.; Trouwborst, G.; Maljiaars, H.; Poorter, H.; Van leperen, W.; Harbinson, J. Blue light dose-responses of leaf photosynthesis, morphology, and chemical composition of cucumis sativus grown under different combinations of red and blue light. J. Exp. Bot. 2010, 61, 3107–3117. [Google Scholar] [CrossRef]
  10. Abidi, F.; Girault, T.; Douillet, O.; Guillemain, G.; Sintes, G.; Laffaire, M.; Leduc, N. Blue light effects on rose photosynthesis and photomorphogenesis. Plant Biol. 2013, 15, 67–74. [Google Scholar] [CrossRef]
  11. Ouzounis, T.; Rosenqvist, E.; Ottosen, C.O. Spectral effects of artificial light on plant physiology and secondary metabolism: A review. Hortscience 2015, 50, 1128–1135. [Google Scholar] [CrossRef] [Green Version]
  12. Perez-Balibrea, S.; Moreno, D.A.; Garcia- Viguera, C. Influence of light on health-promoting phytochemicals of broccoli sprouts. J. Sci. Food Agric. 2008, 88, 904–910. [Google Scholar] [CrossRef]
  13. Kim, S.J.; Hahn, E.J.; Heo, J.W.; Paek, K.Y. Effects of LEDs on net photosynthetic rate, growth and leaf stomata of chrysanthemum plantlets in vitro. Sci. Hortic. 2004, 101, 143–151. [Google Scholar] [CrossRef]
  14. Wu, M.C.; Hou, C.Y.; Jiang, C.M.; Wang, C.Y.; Chen, H.H.; Chang, H.M. A novel approach of LED light radiation improves the antioxidant activity of pea seedlings. Food Chem. 2007, 101, 1753–1758. [Google Scholar] [CrossRef]
  15. Son, K.H.; Oh, M.M. Leaf shape, growth and antioxidant, phenolic compounds of two lettuce cultivars grown under various combinations of blue and red light-emitting diodes. HortScience 2013, 48, 988–995. [Google Scholar] [CrossRef]
  16. Shin, K.S.; Mrthy, H.N.; Heo, J.W.; Hahn, E.J.; Paek, K.Y. The effect of light quality on the growth and development of in vitro cultured doritaenopsis plants. Acta Physiol. Plant. 2008, 30, 339–343. [Google Scholar] [CrossRef]
  17. Lee, J.G.; Oh, S.S.; Cha, S.H.; Jang, Y.A.; Kim, S.Y.; Um, Y.C.; Cheong, S.R. Effects of red/blue light ratio and short-term light quality conversion on growth and anthocyanin contents of baby leaf lettuce. Prot. Hortic. Plant Fact. 2010, 19, 351–359. [Google Scholar]
  18. Becker, C.; Klaering, H.P.; Schreiner, M.; Kroh, L.W.; Krumbein, A. Unlike quercetin glycosides, cyanidin glycoside in red leaf lettuce responds more sensitively to increasing low radiation intensity before than after head formation has started. J. Agric. Food Chem. 2014, 62, 6911–6917. [Google Scholar] [CrossRef]
  19. Urrestarazu, M.; Najera, C.; del Mar Gea, M. Effect of the spectral quality and intensity of light-emitting diodes on several horticultural crops. HortScience 2016, 51, 268–271. [Google Scholar] [CrossRef] [Green Version]
  20. Zhen, S.; van Iersel, M.W. Photochemical acclimation of three contrasting species to different light levels: Implications for optimizing supplemental lighting. J. Am. Soc. Hort. Sci. 2017, 142, 346–354. [Google Scholar] [CrossRef] [Green Version]
  21. Rouphael, Y.; Petropoulos, S.A.; El-Nakhel, C.; Pannico, A.; Kyriacou, M.C.; Giordano, M.; Troise, A.D.; Vitaglione, P.; De Pascale, S. Reducing energy requirements in future bioregenerative life support systems (blsss): Performance and bioactive composition of diverse lettuce genotypes grown under optimal and suboptimal light conditions. Front. Plant Sci. 2019, 10, 1305. [Google Scholar] [CrossRef]
  22. Huang, L.C.; Chen, Y.H.; Chen, Y.H.; Wang, C.F.; Hu, M.C. Food-energy interactive tradeoff analysis of sustainable urban plant factory production systems. Sustainability 2018, 10, 446. [Google Scholar] [CrossRef] [Green Version]
  23. Kikuchi, Y.; Kanematsu, Y.; Yoshikawa, N.; Okubo, T.; Takagaki, M. Environmental and resource use analysis of plant factories with energy technology options: A case study in Japan. J. Clean. Prod. 2018, 186, 703–717. [Google Scholar] [CrossRef]
  24. Yeh, N.; Chung, J.P. High-brightness LEDs—Energy efficient lighting sources and their potential in indoor plant cultivation. Renew. Sustain. Energy 2009, 13, 2175–2180. [Google Scholar] [CrossRef]
  25. Perez, V.M. Study of the Sustainability Issues of Food Production Using Vertical Farm Methods in an Urban Environment Within the State of Indiana. Master’s Thesis, Purdue University, West Lafayette, IN, USA, 2014. [Google Scholar]
  26. Loconsole, D.; Cocetta, G.; Santoro, P.; Ferrante, A. Optimization of led lighting and quality evaluation of romaine lettuce grown in an innovative indoor cultivation system. Sustainability 2019, 11, 841. [Google Scholar] [CrossRef] [Green Version]
  27. Han, T.; Vaganov, V.; Cao, S.; Li, Q.; Ling, L.; Cheng, X.; Peng, L.; Zhang, C.; Yakovlev, A.N.; Zhong, Y.; et al. Improving “color rendering” of LED lighting for the growth of lettuce. Sci. Rep. 2017, 7, 45944. [Google Scholar] [CrossRef]
  28. Maxwell, K.; Johnson, G.N. Chlorophyll fluorescence—A practical guide. J. Exp. Bot. 2000, 51, 659–668. [Google Scholar] [CrossRef]
  29. Ferreres, F.; Gil, M.I.; Castaner, M.; Tomas-Barberan, F.A. Phenolic metabolites in red pigmented lettuce (Lactuca sativa L.) changes with minimal processing and cold Storage. J. Agric. Food Chem. 1997, 45, 4249–4254. [Google Scholar] [CrossRef]
  30. Kjaer, K.H.; Ottosen, C.O. Growth of chrysanthemum in response to supplemental light provided by irregular light breaks during the night. J. Am. Soc. Hort. Sci. 2011, 136, 3–9. [Google Scholar] [CrossRef] [Green Version]
  31. Lichtenthaler, H.K. Chlorophylls and carotenoids: Pigments of photosynthetic biomembranes. Methods Enzymol. 1987, 148, 350–382. [Google Scholar]
  32. Van Iersel, M.W.; Weaver, G.; Martin, M.T.; Ferrarezi, R.S.; Mattos, E.; Haidekker, M. A chlorophyll fluorescence-based biofeedback system to control photosynthetic lighting in controlled environment agriculture. J. Am. Soc. Hort. Sci. 2016, 141, 169–176. [Google Scholar] [CrossRef] [Green Version]
  33. Van Iersel, M.W.; Gianino, D. An adaptive control approach for LED lights can reduce the energy costs of supplemental lighting in greenhouses. HortScience 2017, 52, 72–77. [Google Scholar] [CrossRef]
  34. Matsuda, R.; Ohashi-kaneko, K.; Fujiwara, K.; Goto, E.; Kurata, K. Photosyntehtic characteristics of rice leaves grown under red light with or without supplemental blue light. Plant Cell Physiol. 2004, 45, 1870–1874. [Google Scholar] [CrossRef] [PubMed]
  35. Johkan, M.; Shoji, K.; Goto, F.; Hahida, S.; Yoshihara, T. Blue light emitting diode light irradiation of seedlings improves seedling quality and growth after transplanting in red leaf lettuce. HortScience 2010, 45, 1809–1814. [Google Scholar] [CrossRef] [Green Version]
  36. Wang, J.; Lu, W.; Tong, Y.; Yang, Q. Leaf morphology, photosynthetic performance, chlorophyll fluorescence, stomatal development of lettuce (Lactuca sativa L.) exposed to different ratios of red light to blue light. Front. Plant Sci. 2016, 7, 250. [Google Scholar] [CrossRef] [PubMed] [Green Version]
  37. Lin, C. Phototropin blue light receptors and light—induced movement response in plants. Sci. Stke 2002, 118, pe5. [Google Scholar] [CrossRef] [PubMed]
  38. Schroeder, J.I.; Allen, G.J.; Hugouvieux, V.; Kwak, J.M.; Waner, D. Guard cell signal transduction. Annu. Rev. Plant Physiol. Plant Mol. Biol. 2001, 52, 627–658. [Google Scholar] [CrossRef] [PubMed] [Green Version]
  39. Shimazaki, K.I.; Doi, M.; Assmann, S.M.; Kinoshita, T. Light regulation of stomatal movement. Annu. Rev. Plant Biol. 2007, 58, 219–247. [Google Scholar] [CrossRef] [Green Version]
  40. Rosenqvist, E. Light acclimation maintains the redox state of the PS II electron accepter QA within a narrow range over a broad range of light intensities. Photosynth. Res. 2002, 70, 299–310. [Google Scholar] [CrossRef]
  41. Heo, J.W.; Kang, D.H.; Bang, H.S.; Hong, S.G.; Chun, C.; Kang, K.K. Early growth, pigmentation, protein content, and phenylalanine ammonia-lyase activity of red colored lettuces grown under different lighting condition. Korean J. Hort. Sci. Technol. 2012, 30, 6–12. [Google Scholar]
  42. Quail, P.H. Photosensory perception and signaling in plant cells: New paradigms. Curr. Opin. Cell Biol. 2002, 14, 180–188. [Google Scholar] [CrossRef]
  43. Wang, H.; Ma, L.G.; Li, J.M.; Zhao, H.Y.; Deng, X.W. Direct interaction of Arabidopsis cryptochromes with COP1 in light control development. Science 2001, 294, 154–158. [Google Scholar] [CrossRef] [PubMed] [Green Version]
  44. Martinez-Garcia, J.F.; Huq, E.; Quail, P.H. Direct targeting of light signals to a promoter element-bound transcription factor. Science 2000, 288, 859–863. [Google Scholar] [PubMed] [Green Version]
  45. Hoenecke, M.E.; Bula, R.J.; Tibbitts, T.W. Importance of blue photon levels for lettuce seedlings grown under red light emitting diodes. HortScience 1992, 27, 427–430. [Google Scholar] [CrossRef] [PubMed] [Green Version]
  46. Dougher, T.A.O.; Bugbee, B. Long term blue light effects on the histology of lettuce and soybean leaves and stem. J. Am. Soc. Hort. Sci. 2004, 129, 467–472. [Google Scholar] [CrossRef] [Green Version]
  47. Samuoliene, G.; Sirtautas, R.; Brazaityte, A.; Sakalauskaite, J.; Sakalauskiene, S.; Duchovskis, P. The impact of red and blue light-emitting diode illumination on radish physiological indices. Cent. Eur. J. Biol. 2011, 6, 821–828. [Google Scholar] [CrossRef]
  48. Hernandez, R.; Kubota, C. Physiological responses of cucumber seedlings under different blue and red photon flux ratios using LEDs. Environ. Exp. Bot. 2016, 121, 66–74. [Google Scholar] [CrossRef]
  49. Kang, W.H.; Park, J.S.; Park, K.S.; Son, J.E. Leaf photosynthetic rate, growth, and morphology of lettuce under different fractions of red, blue, and green light from light-emitting diodes (LEDs). Hortic. Environ. Biotechnol. 2016, 57, 573. [Google Scholar] [CrossRef]
  50. Chatterjee, M.; Sharma, P.; Khurana, J.P. Cryptochrome 1 from Brassica napus is up-regulated by blue light and controls hypocotyl/stem growth and anthocyanin accumulation. Plant Physiol. 2006, 141, 61–74. [Google Scholar] [CrossRef] [PubMed] [Green Version]
  51. Metallo, R.M.; Kopsell, D.A.; Sams, C.E.; Bumgarner, N.R. Influence of blue/red vs. white LED light treatments on biomass, shoot morphology, and quality parameters of hydroponically grown kale. Sci. Hortic. 2018, 235, 189–197. [Google Scholar] [CrossRef]
  52. Ouzounis, T.; Frette, X.; Rosenqvist, E.; Ottosen, C.O. Spectral effects of supplementary lighting on the secondary metabolites in roses, chrysanthemums, and campanulas. J. Plant Physiol. 2014, 171, 1491–1499. [Google Scholar] [CrossRef] [PubMed]
  53. Kim, H.M.; Kang, J.H.; Jeong, B.R.; Hwang, S.J. Light quality and photoperiod affect growth of sowthistle (Ixeris dentata Nakai) in a closed-type plant production system. Korean J. Hort. Sci. Technol. 2016, 34, 67–76. [Google Scholar] [CrossRef] [Green Version]
  54. Lin, K.H.; Huang, M.Y.; Huang, W.D.; Hsu, M.H.; Yang, Z.W.; Yang, C.M. The effect of red, blue and white light emitting diodes on the growth, development and edible quality of hydroponically grown lettuce (Lactusa sativa L. var. capitata). Sci. Hortic. 2013, 150, 86–91. [Google Scholar] [CrossRef]
  55. Li, H.; Tang, C.; Xu, Z.; Liu, X.; Han, X. Effect of different light sources on the growth of non-heading Chinese cabbage (Brassica campestris L.). J. Agr. Sci. 2012, 4, 262–273. [Google Scholar] [CrossRef] [Green Version]
  56. Saebo, A.; Krekling, T.; Appelgren, M. Light quality affects photosynthesis and leaf anatomy of brich plantlets in vitro. Plant Cell Tiss. Organ Cult. 1995, 41, 177–185. [Google Scholar] [CrossRef]
  57. Li, H.; Tang, C.; Xu, Z. The effect of different light qualities on rape seed (Bassica napus L.) plantlet growth and morphogenesis in vitro. Sci. Hortic. 2013, 150, 117–124. [Google Scholar] [CrossRef]
  58. Poffenroth, M.; Green, D.B.; Tallman, G. Sugar concentration in guard cells of Vicia faba illuminated with red or blue light. Plant Physiol. 1992, 98, 1460–1471. [Google Scholar] [CrossRef] [Green Version]
  59. Yagi, K.; Hamada, K.; Hirata, K.; Miyamoto, K.; Miura, Y.; Akano, T.; Fukatu, K.; Ikuta, Y.; Nakamura, H.K. Stimulatory effect of red light on starch accumulation in a marine green alga, Chlamydomonas sp. strain MGA161. Appl. Biochem. Biotech. 1994, 45, 225–232. [Google Scholar] [CrossRef]
  60. Cheng, J.; Fan, P.; Liang, Z.; Wang, Y.; Nie, N.; Li, W.; Li, S. Accumulation of end products in source leaves affects photosynthetic rate in peach via alteration of stomatal conductance and photosynthetic efficiency. J. Am. Soc. Hort. Sci. 2009, 134, 667–676. [Google Scholar] [CrossRef] [Green Version]
  61. Ma, G.; Zang, L.; Kato, M.; Yamawaki, K.; Kiriiwa, Y.; Yahata, M.; Ikoma, Y.; Matsumoto, H. Effect of blue light and red LED light irradiation on β-cryptoxanthin accumulation in the flavedo of citrus fruits. J. Agr. Food Chem. 2012, 60, 197–201. [Google Scholar] [CrossRef]
  62. Bukhov, N.G.; Drozdova, I.S.; Bondar, V.V.; Mokronosov, A.T. Blue, red and blueplus red light control of chlorophyll content and CO2gas exchange in barleyleaves: Quantitative description of the effects of light quality and fluence rate. Physiol. Plant. 1992, 85, 632–638. [Google Scholar] [CrossRef]
  63. Evans, J.R. Acclimation by the thylakoid membranes to growth irradiance and the partitioning of nitrogen between soluble and thylakoid proteins. Aust. J. Plant Physiol. 1988, 15, 93–106. [Google Scholar] [CrossRef]
  64. Yu, X.; Liu, H.; Klejnot, J.; Lin, C. The Cryptochrome Blue Light Receptors; The Arabidopsis Book; ASPB: Rockville, MD, USA, 2010. [Google Scholar]
  65. Stutte, G.W.; Edney, S.L.; Newsham, G.J. Photoregulation of Anthoycyanin Production in Red Leaf Lettuce with Blue LEDs is Affected by Timing and Leaf Age. In Proceedings of the 36th Annual Meeting of the Plant Growth Regulation Society of America, North Carolina, CA, USA, 2–6 August 2009; pp. 125–130. [Google Scholar]
  66. Bian, Z.H.; Yang, Q.C.; Liu, W.K. Effect of light quality on the accumulation of phytochemcials in vegetables produced in controlled environments: A review. J. Sci. Food Agric. 2013, 95, 869–877. [Google Scholar] [CrossRef] [PubMed]
  67. Park, J.S.; Chung, M.G.; Kim, J.B.; Hahn, B.S.; Kim, J.B.; Bae, S.C.; Roh, K.H.; Kim, Y.H.; Cheon, C.I.; Sung, M.K.; et al. Genes up—regulated during red coloration in UVB irradiated lettuce leaves. Plant Cell Rep. 2007, 26, 507–516. [Google Scholar] [CrossRef] [PubMed]
  68. Awad, M.A.; Patricia, S.; Wagenmakers, P.S.; de Jager, A. Effects of light on flavonoid and chlorogenic acid levels in the skin of Jona gold apples. Sci. Hortic. 2001, 88, 289–298. [Google Scholar] [CrossRef]
  69. Giliberto, L.; Perrotta, G.; Pallara, P.; Weller, J.L.; Fraser, P.D.; Bramley, P.M.; Fiore, A.; Tavazza, M.; Giuliano, G. Manipulation of the blue light photoreceptor cryptochrome-2 in tomato affects vegetative development, flowering time and fruit antioxidant content. Plant Physiol. 2005, 137, 199–208. [Google Scholar] [CrossRef] [PubMed] [Green Version]
  70. Narukawa, M.; Watanable, K.; Inoue, Y. Light-induced root hair formation in lettuce (Lactusasativa L.cv. Grand Rapids) roots at low PH is brought by chlorogenic acid synthesis and sugar. J. Plant Res. 2010, 123, 789–799. [Google Scholar] [CrossRef]
Figure 1. Spectral photon flux energy distribution of different blue (B)/red (R) light ratios.
Agriculture 10 00028 g001
Figure 2. Net photosynthetic rate, stomatal conductance and chlorophyll fluorescence of leaf lettuce grown under different BR light treatments. Values are the means of three separate measurements. Bars indicate SD. Letters indicate mean separation by Duncan’s multiple range test (p < 0.05). Means with the same letter in each column are not significantly different. DAT = days after the commencement of LED light treatment.
Agriculture 10 00028 g002
Figure 3. Lettuce plant shape and size at 10 (first row) and 20 DAT (second row) under different BR light ratios.
Agriculture 10 00028 g003
Figure 4. Starch (A), sucrose (B), glucose (C), and fructose (D) contents in leaf lettuce grown under different ratios of BR light ratios. Bars indicate SD of eight separate measurements. Values are the means of three separate measurements. Bars indicate SD. Letters indicate mean separation by Duncan’s multiple range test (p < 0.05). Means with the same letter in each column are not significantly different. DAT = days after the onset of light treatments.
Agriculture 10 00028 g004
Figure 5. Anthocyanin content of lettuce grown under different ratios of BR light treatments. Bars indicate SD of six separate measurements. Letters indicate mean separation by Duncan’s multiple range test (p < 0.05). Means with the same letter in each column are not significantly different. DAT = days after the onset of light treatments.
Agriculture 10 00028 g005
Figure 6. Flavonoid content of lettuce grown under different ratios of BR light treatments. Bars indicate SD of six separate measurements. Letters indicate mean separation by Duncan’s multiple range test (p < 0.05). Means with the same letter in each column are not significantly different. DAT = days after the onset of light treatments.
Agriculture 10 00028 g006
Figure 7. The chlorogenic acid content of lettuce grown under different ratios of BR light treatments. Bars indicate SD of six separate measurements. Values are the means of three separate measurements. Bars indicate SD. Letters indicate mean separation by Duncan’s multiple range test (p < 0.05). Means with the same in each column letter are not significantly different. DAT = days after the onset of light treatments.
Agriculture 10 00028 g007
Table 1. Growth characteristics of lettuce grown under different ratios of B/R light treatments at 10 DAT.
TreatmentsPlant Height (cm)Leaf Number Plant−1LA Plant−1 (cm2)SLA Plant−1 (cm2 g−1)FW Plant−1 (g)DW Plant−1 (g)
B/R = 5:17.10 ± 0.96d y6± 0.69a87 ± 25.5d473 ± 102b3.0 ± 1.00b0.18 ± 0.06ab
B/R = 3:18.3 ± 0.94c6± 0.48a119 ±21.4 bc469 ± 85b4.0 ± 0.89a0.26 ±0.07a
B/R = 1:19.7 ± 0.63b6± 0.42a111 ± 12.6c602 ± 108a4.2 ± 0.70b0.19 ± 0.05ab
B/R = 1:310.0 ± 0.55b6± 0.56a137± 14.2ab546 ± 69ab5.0 ± 0.74a0.25 ±0.04a
B/R = 1:511.0 ± 0.62a6 ± 0.31a149 ± 15.9a632 ± 75a4.6 ± 0.74a0.24 ±0.03a
y Mean separation within columns by DMRT test at 5% significant level. The values are means ± SE of ten separate measurements. Means with the same letter in a column are not significantly different.
Table 2. Growth parameters and biomass of lettuce grown under different ratios of B/R light treatments at 20 DAT.
TreatmentsPlant Height (cm)Leaf Number Plant−1LA Plant−1 (cm2)SLA Plant−1 (cm2g−1)FW Plant−1 (g)DW Plant−1 (g)
B/R = 5:19.7 ± 0.58d y10 ± 1.0a234 ± 35.1c539 ± 58b9.4 ± 1.6a0.44 ± 0.08a
B/R = 3:110.1 ± 0.41d10± 0.66a255 ± 34.0bc580 ± 181b10.6 ± 1.4a0.46 ± 0.10a
B/R = 1:111.0 ± 0.82c9 ± 0.82ab243 ± 20.4bc485 ± 218b10.3 ± 1.1a0.55 ± 0.15a
B/R = 1:311.9 ± 0.56b10 ± 0.69ab271 ± 21.9ab1044 ± 175a10.7 ± 0.8a0.26 ± 0.04b
B/R = 1:512.7 ± 0.92a9 ± 0.63ab295 ± 32.9a1275 ± 399a10.9 ± 1.6a0.25 ± 0.09b
y Mean separation within columns by DMRT test at 5% significant level. The values are means ± SE of ten separate measurements. Means with the same letter in a column are not significantly different.
Table 3. Pigments content of lettuce grown under different ratios of B/R light treatments.
TreatmentsChl a mg g−1 DWChl b mg g−1 DWTotal Chl mg g−1 DWChl a/b RatioCarotenoid mg g−1 DW
10 DAT 20 DAT10 DAT20 DAT10 DAT20 DAT10 DAT20 DAT10 DAT20 DAT
B/R = 5:19.2 ± 2.0a y9.6 ± 2.5a2.9 ± 0.7a4.1 ± 0.5a12.0 ± 2.7a13.7 ± 2.9a3.2 ± 0.2a2.3 ± 0.5b3.1 ± 0.4a3.8 ± 0.8a
B/R = 3:16.3 ± 1.3b6.2 ± 2.1b2.4 ± 0.5a2.4 ± 0.9b8.7 ± 1.4b8.6 ± 3.0b2.8 ± 0.9a2.6 ± 0.3ab2.5 ± 0.6b2.0 ± 0.7b
B/R = 1:14.7 ± 0.7bc5.8 ± 1.5b2.4 ± 0.5a2.1 ± 0.8b7.2 ± 1.1b7.9 ± 2.2b1.9 ± 0.2b2.8 ± 0.6ab1.8 ± 0.3c2.0 ± 0.7b
B/R = 1:34.6 ± 0.9c6.0 ± 0.9b2.5 ± 0.5a2.0 ± 0.5b7.1 ± 1.3b8.1 ± 1.4b1.8 ± 0.2b3.0 ± 0.4a1.9 ± 0.4c1.5 ± 0.2b
B/R = 1:54.5 ± 0.4c4.8 ± 1.5b2.3 ± 0.4a1.8 ± 0.9b6.8 ± 0.7b6.6 ± 2.4b1.9 ± 0.b2.8 ± 0.6ab1.7 ± 0.2c1.6 ± 0.9b
y Mean separation within columns by DMRT test at 5% significant level. The values are means ± SE of eight separate measurements. Means with the same letter in column are not significantly different. DAT = days after the onset of light treatments.

