Article

Planting Density Effects on Grow Rate, Biometric Parameters, and Biomass Calorific Value of Selected Trees Cultivated as SRC

by
Adam Kleofas Berbeć
* and
Mariusz Matyka
Department of Systems and Economics of Crop Production, Institute of Soil Science and Plant Cultivation-State Research Institute, Czartoryskich 8, 24-100 Puławy, Poland
*
Author to whom correspondence should be addressed.
Agriculture 2020, 10(12), 583; https://doi.org/10.3390/agriculture10120583
Submission received: 7 October 2020 / Revised: 7 November 2020 / Accepted: 25 November 2020 / Published: 26 November 2020

Abstract

:
Agricultural land is mostly devoted to food production. Production of biomass is limited, as it competes for land with basic food production. To reduce land loss for growing food, biomass can be grown on marginal lands that are not usable for food production. The density of plantings have to be optimized to maximize yield potential. The presented study compares yield parameters end energy potential of six species of biomass plants (poplar, Siberian elm, black alder, white birch, boxelder maple, silver maple) cultivated in 18 planting densities from 3448 to 51,282 plants per hectare as short rotation coppice (SRC). Biomass yield parameters depended on both cultivated species and planting density. Green mass, dry mass, and shoot diameter was dropping with the increasing planting density for most tested species. Calculated yield of dry mass was dropping with increasing planting density for black alder, increasing for Siberian elm and boxelder maple. White birch and silver maple yields were optimal at moderate planting densities (25,000–30,000). White birch and boxelder maple had the highest average higher heating value (HHV). The optimal density of plantings should be chosen to best suit both the needs of cultivated species and to optimize the most important parameters of produced biomass.

1. Introduction

Although the main role of agriculture is food production, a part of agricultural land has always been devoted to non-food products, mainly within the framework of emerging technologies. Such uses include the production of bioenergy and various biomaterials [1]. The application of biomass for energy generation and for industry is of great importance and brings benefits to: (i) energy independence, (ii) environmental protection, (iii) economy, and (iv) society [2,3]. Non-food crops cultivation should not compete with food and fodder cultivation on high-yielding, fertile soils of good agricultural quality. On the other hand, the number of available food and fodder species able to produce a satisfactory yield on light, sandy soils of rather poor agricultural quality is not wide [4,5]. The cultivation of tree species using the short rotation coppice technique of lignocellulose biomass production had spread following the first oil crisis. Plants cultivated as short rotation coppices (SRCs) are characterized by a high growth rate, adequate sprouting of the stool bed, and an adaptation to sub-optimal environmental conditions [6]. Plantations for woody biomass production can be adapted depending on planting density and rotation length. Available experimental results indicate that a decrease in stem circumference is a commonly observed response to increasing planting density in poplar. However, studies also showed fast growing hardwoods tree height can increase, decrease, or remain unchanged with increasing planting density [7,8].
Agricultural biodiversity is of great importance nowadays. Plants of different genotype (species, varieties) including those cultivated as SRC, differ in habitat requirements for optimal growth and development and create different habitats for wildlife. Production conditions such as soil quality, water availability, harvest cycle, and technology (i.e., planting density) have an impact on biomass production, but the strength and direction of this impact could vary between species.
The goal of this study was to the determine the grow rate, biometric parameters, and biomass caloric value of six trees species cultivated as SRC depending on planting density.

2. Materials and Methods

2.1. Site Characteristics and Experimental Design

The experiment was conducted in the experimental farm of Institute of Soil Science and Plant Cultivation—State Research Institute in Osiny, Poland (N: 51°28′16.37″, E: 22°3′5.11″). The experiment was established in spring 2010 on heavy black soil with a heavy clay granulometric composition. The following trees were included in the experiment:
  • Poplar (Populs L.), AF2 variety;
  • Siberian elm (Ulmus pumila);
  • Black alder (Alnus glutinosa);
  • White birch (Betula pubecsens);
  • Boxelder maple (Acer negundo);
  • Silver maple (Acer saccharinum L.).
Trees were planted in April 2010 at 18 ranges of density in a “Nelder wheel design” [9] (see Figure 1). Eighteen concentric rings of trees were planted at radii ranging from 1.5 to 11 m as indicated in Table 1. An additional outer ring was planted as a guard ring to minimize the edge effect. The center of the circle was planted with a small ring to also form a guard. Each of the experimental rings contained 24 trees (six tested species in four replications) planted et equal distances around the circumference, giving a range from 3448 to 51,282 trees per hectare in equivalent planting density (Table 1). Those 24 trees planted as a concentric ring of increasing diameter formed 24 rows of experiment. Each tested species was represented in four rows (replications). Two rows of the same species were always adjacent to each other, while the other two were on the opposite side of the circle—creating an experimental arrangement in the form of a mirror reflection (see Figure 1).

2.2. Biomass Analyses

Trees were harvested after 7 years of growth in February 2017. The harvest was made by hand. Shoot diameter at a height of 15 cm was determined using an electronic caliper with an accuracy of 0.1 mm. Each plant was cut at a height of 5 cm above the ground level. Plant height was determined from the cut place to the top of the plant with the accuracy of 1 cm. Yield of green mass was determined by weighing whole plants immediately after harvesting (green mass included limbs and/or barks). Whole plants were chipped and carefully mixed. Representative biomass samples (in 5 replications) were taken to determine the share of dry mass. In the laboratory, biomass moisture was determined by a drying method at a temperature of 80 °C for a period of 14 days. The dry mass yield was determined from the ratio of the green mass yield and its moisture content. Dried samples of trees were burned in calorimeter (KL-12Mn calorimeter, Precyzja-Bit, Bydgoszcz, Poland) in order to assess the higher heating value—HHV (or gross calorific value) of the biomass.

2.3. Statistical Analyses

Statistical analysis of results was performed using Statistica 10.0 software (StatSoft Polska, Krakow, Poland)). Few clear extreme outliers (observations located outside upper or lower quartile) were removed from the dataset according to the software manual. The level of significance for analysis was set to p = 0.05.
Subsequently, the normality of the distribution was tested using the Shapiro–Wilk and Kolmogorow–Smirnow tests. The vast majority of the examined features were characterized by a non-normal distribution. Data transformation attempts have not changed the data distribution. Therefore, nonparametric Kruskal–Wallis tests for comparison of many groups of independent variables were used to assess the significance of differences. Because of data distribution, all average values presented in the study are medians.
The green mass, the share of dry mass, dry mass, and the biometric features of the examined trees, depending on the plant density, were characterized by using the trend equation. The criterion for selecting the trend equation was the highest value of the determination coefficient.
In addition, for each tree species correlation coefficient for the tested parameters relationship was calculated.
Woody plants intended for industry are, by definition, grown in long cycles, and therefore, their growth in subsequent years was not studied. Annual yields were not assessed as experimental design was not adapted to it (it would result in a complete failure of the basic methodological assumptions due to invasive nature of such measurements (annual harvesting)). However, potential annual biomass of dry mass was calculated Ydm (t ha−1 year−1). To calculate the potential annual biomass yield of dry mass at given (chosen) density, the measured average dry mass of a single plant (Pdm) (kg) was multiplied by actual density of plantings (plants per hectare) (Dact). The obtained result (t ha −1) was divided by the number of years of cultivation, which was 7.
Potential annual biomass yield of dry mass:
Y d m = P d m D a c t   7

3. Results and Discussion

3.1. Green Mass

The highest green mass of plants (GM) were observed in poplar AF2. On average, a single plant of poplar weighted 29.1 kg (median). Boxelder maple green mass was on average at a level of 9.3 kg per plant. Black alder, white birch, silver maple, and Siberian elm had a GM on a similar level (Table 2). Nevertheless, the lowest GM was recorded for silver maple, and it was only 2.6 kg per plant. GM was positively correlated with plant height and shoot diameter for all tested plants. For Polar AF2 and Siberian elm, a negative correlation between the green mass of the plants and the share of dry mass was noted. The GM was dropping significantly with the increasing planting density for all tested species. The strength of response of species to the increasing stand density showed some differences. The strongest negative response was observed in black alder, while white birch and silver maple were the least sensitive species to increasing planting density. In the case of other species, the strength of dependence was at a similar level (Figure 2, Table 3). Wilkinson et al. [10] showed that yield of green matter of 1-year-old and 3-year-old willow (Salix ssp.) was increasing significantly with increasing plant density (density from 10,000 to 25,000 of plants per hectare).

3.2. Dry Mass

Very similar relationships were found for the dry mass (DM) of plants as for green matter. This shows that the dry mass/green mass ratio (or in other words—moisture content) is at constant level at different plating densities and, therefore, have little or no effect on yields. The highest dry mass (DM) of plants were observed in poplar AF2. On average, a plant of poplar weighted 13.1 kg (median). Boxelder maple green mass was on average at a level of 4.7 kg per plant. Black alder, white birch, silver maple, and Siberian elm had a dry mass of plant on a similar level (Table 2). Nevertheless, the lowest dry mass of plants was recorded for silver maple, and it was only 1.4 kg per plant. Walle et al. [11] compared the dry mass of 4-year-old SRC of poplar (Populus trichocarpa × deltoids), birch (Betula pendula Roth), and maple (Acer pseudoplatanus L.) cultivated with a density of 20,000, 6667, and 6667 plants per hectare, respectively. The authors found that the average dry mass of plants grown under these conditions was 831, 2007, and 738 g, respectively, which was a noticeably different result than in presented study; however, the growing conditions were also different to the plants tested by Walle et al. [11], which were also about 3 years younger than in the presented study. DM in the presented study was positively correlated with plant height and shoot diameter for all tested plants. For Siberian elm, a negative correlation between the dry mass of the plants and the share of dry mass was noted. The dry mass of plants dropped significantly with the increasing planting density for all tested species. The strength of response of species to the increasing stand density showed some differences. The strongest negative response was observed for black alder, while white birch and silver maple were the least sensitive species to increasing plant density. In the case of other species, the strength of dependence was at a similar level (Figure 3, Table 3). Other authors investigated the response of dry mass of plants to increasing density and found out that it was also dropping for willow (Salix ssp.) [12] and for oak (Quercus robur) [13].

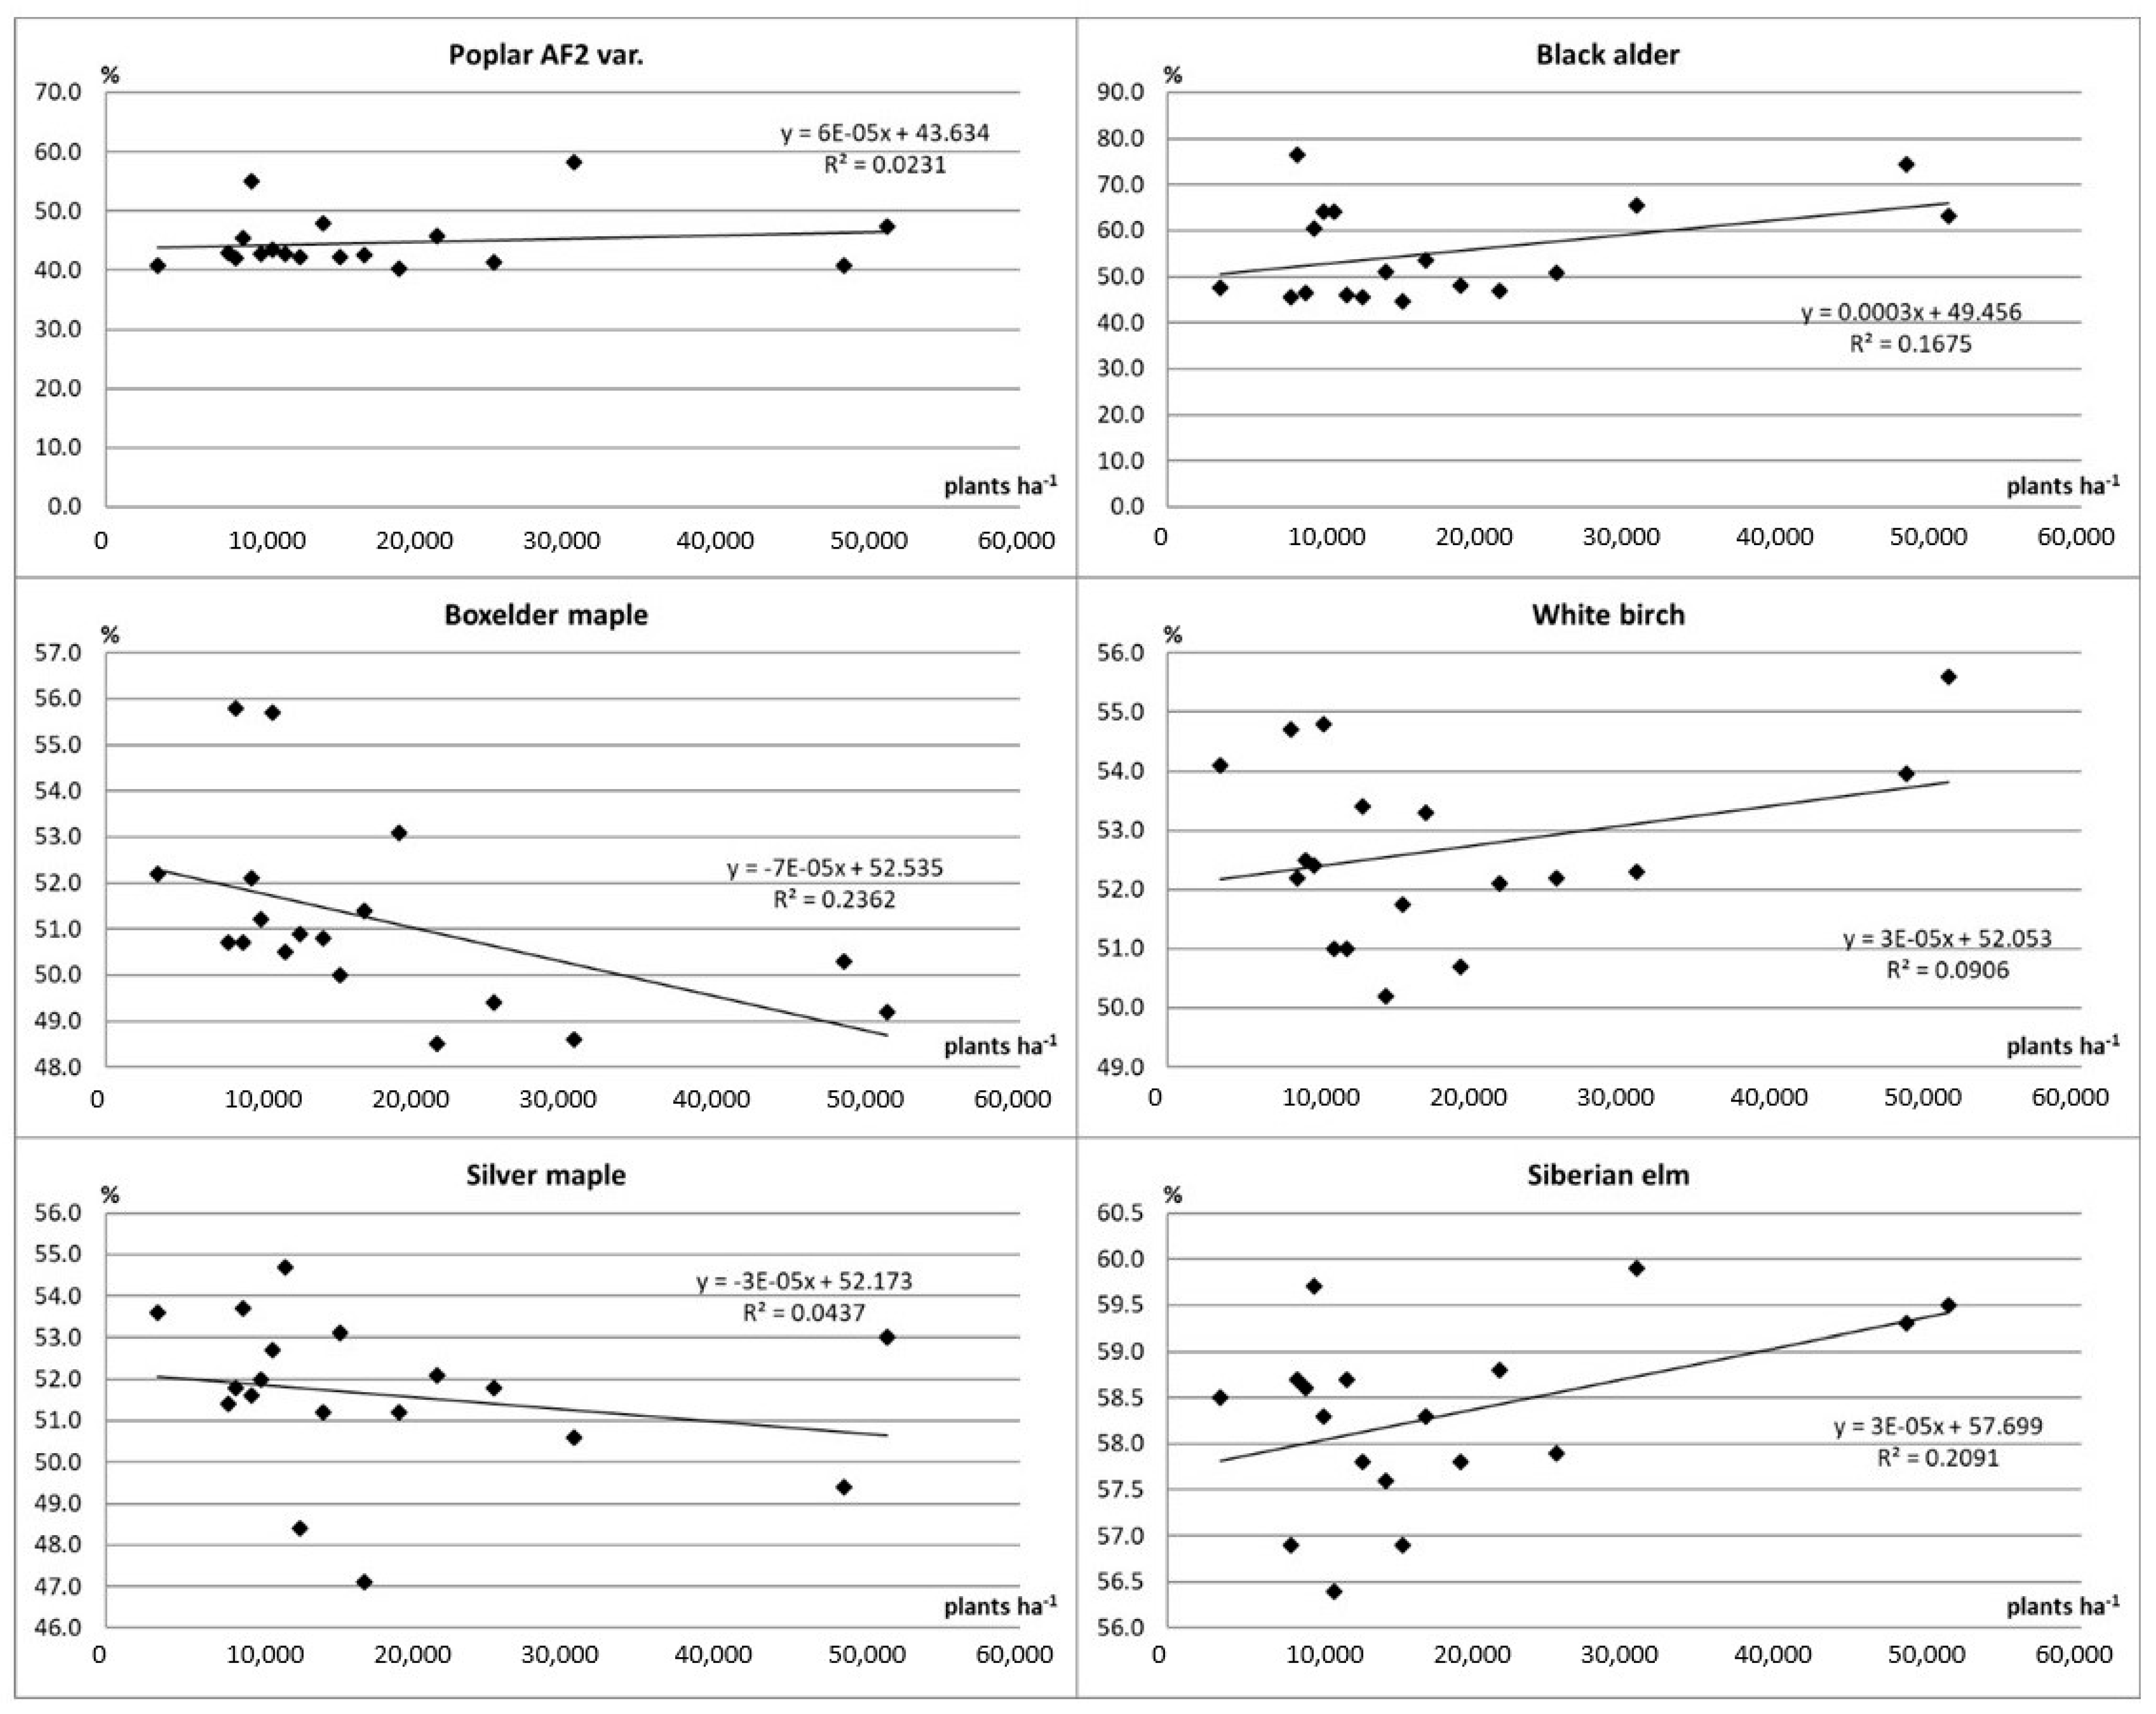
3.3. Share of Dry Mass

The highest dry to green mass (DM to GM) ratio was observed for Siberian elm (58.5%), while the lowest was observed for poplar AF2 (42.8%). White birch, silver maple, boxelder maple, and black alder DM to GM ratio was on a similar level (52.4, 51.8, 50.8, and 48.2%, respectively) (Table 2). DM to GM ratio varied depending on the stand density, but also on the tested species. Share of dry mass was negatively correlated with green mass of plants for three tested species (poplar AF2, Siberian elm and boxelder maple). Share of dry mass also negatively correlated with plant height for poplar AF2 and with higher heating value for white birch (Table 3). Poplar AF2 and silver maple showed no reaction of DM to GM ratio to increasing density of plants, while Siberian elm, black alder, and white birch showed moderately positive increase in DM to GM ratio with increasing plant density. Boxelder maple showed negative response of DM to GM ratio to increasing plant density (Figure 4). Wilkinson et al. [10] found dry mass of 1-year-old and 3-year-old willow (Salix ssp.) not dependent on density of plantings (similar to poplar AF2 and silver maple reaction in presented study). In addition, Stolarski et al. [14] and Kulig et al. [15] found no effect of planting density on the fresh–dry matter ratio of willow. This was also confirmed by Elfeel and Elmagboul [16] for other woody species—leucaena leucocephala. On the other hand, Achinelli et al. [17] found that dry to fresh matter content ratio in willow was higher in more dense stands (similar effect to Siberian elm, black alder, and white birch in the discussed study).

3.4. Potential Yield of Dry Mass

Poplar AF2 had the highest calculated potential of dry mass yield (after 7 years) of about 15 t ha−1 for all tested planting densities. Boxelder maple was able to match yielding potential that AF2 poplar only at planting density of about 40,000 plants per hectare. Silver maple reached about 50% of this potential (about 7.5–8 t ha−1), while other tested species reached about 5 t ha−1 of dry mass yield. (Figure 3). The calculated annual yield of dry mass was positively correlated with plant height for poplar AF2, Siberian elm, and silver maple. There was also a positive correlation with plant density for boxelder maple and negative for black alder. In the case of white birch, a strong positive correlation was found with green and dry mass of plants (Table 3). Despite the fact that the dry mass of individual trees decreased with increasing density, the calculated annual yield of dry matter of Siberian elm, boxelder maple, and silver maple was increasing with increasing density of planting (Figure 5). The same was also observed by Geyer, Argent, and Walawender [18] for 7-year-old Siberian elm. Authors found that annual yields of dry matter of Siberian elm were at a level of 4.7 t ha−1 with stand density of 1400 plants per hectare, while they increased significantly to 9.8 t ha−1 with stand density of 7000 plants per hectare. In the presented study, calculated annual dry mass yields of Siberian elm varied between 1.8 t ha−1 for the lowest density and 7.4 t ha−1 for the highest density. Geyer and Walawender [19] reported that annual dry mass yield of 7-year-old silver maple was increasing from 5.3 t ha −1 at 1400 plants per hectare to 11.2 t ha−1 at 7000 plants per hectare. In addition, other authors found that for some species such as willow (Salix L.) [10] and black locust (Robinia pseudoacacia) [20] annual yield of dry mass was increasing with increasing planting density. Niemczyk et al. [21] found that annual yields of a 7-year-old poplar can reach up to 8 t ha−1. Truax et al. [22] also found a positive correlation of planting density and yield of 8-year-old hybrid poplar. Stolarski et al. [23] found that annual dry mass yield of willow planted with densities from 12,000 to 96,000 was increasing from 12,000 to 24,000 (optimal density) and decreasing with increasing density from 24,000 to 96,000. Similar reaction was found in presented study silver maple (optimal planting density of about 25,000–30,000 plants per hectare).

3.5. Height of Plants

Plants of poplar AF2 were, on average, the highest of all tested species (10.6 m). Black alder, boxelder maple, and white birch’s height was on a similar level of 6.6–7.0 m. Silver maple and Siberian elm had, on average, the lowest plants of both 5.2 and 4.7 m, respectively (Table 2). Siberian elm plants in Geyer, Argent, and Walawender [18] were, on average, higher (6.3 m) than in presented study (4.7 m). Geyer, Barden, and Preece [24] found that 6-year-old silver maple clones of dense stands (no accurate data available) were 7.3 m high. Plant height for all tested species was positively correlated with their green and dry mass and shoot diameter. In addition, for poplar AF2, plant height was negatively correlated with share of dry mass, and, for black alder, with plant density (Table 3). Height of tested plants varied on planting density. In most cases, the decrease in plant height with increasing density of planting started from the very begging—from about 3500 plants per hectare (poplar AF2, black alder, boxelder maple, and Siberian elm) (Figure 6). Geyer, Argent, and Walawender [18] also found this relationship for the 7-year-old Siberian elm, whose height was, on average, 6.4 m for the stand density of 1400 plants per hectare and was dropping to 6.2 m for the density of 7000 plants per hectare. A similar relationship was presented by Perez et al. [25] for a 3-year-old Siberian elm. In addition, it was confirmed by Geyer and Walawender for silver maple [19] and black locust [20]. On the other hand, Toillon et al. [8] found that height of poplar increases with increased planting density in favorable site conditions (as an effect of increased competition for light), while in less favorable conditions, height of plants remained unaffected by increasing planting density. Benomar et al. [7] showed that the relationship between the density and height of plants is also strongly influenced by the genotype.

3.6. Shoots Diameter

Plants of poplar AF2 were, on average, of the greatest shoot diameter (113.5 mm). Boxelder maple, black alder, and white birch’s shoot diameter was on similar level (63.8, 604, 59.4 mm, respectively). Siberian elm and silver maple had the lowest shoot diameter of 41.8 mm both (Table 2). Geyer, Argent, and Walawender [18] found 7-year-old Siberian elm to have, on average, stems of diameter of 109 mm at 10 cm. Walle et al. [11] found that shoots diameter (at 30 cm) of 4-year-old poplar (Populus trichocarpa × deltoids) (336 mm) and maple (Acer pseudoplatanus L.) (310 mm) were lower than shoot diameter of birch (Betula pendula Roth) (493 mm). These authors conducted research on other clones/species of trees in different habitat conditions than in presented study; however, differences in results show the importance of the selection of appropriate species/cultivars and proper density of planting to make the best use of habitat conditions ensuring high biomass accumulation.
Shoot diameter for all tested species was positively correlated with their green and dry mass and shoot diameter. For all tested species, a negative correlation with the planting density was found (Table 3). Shoot diameter of all tested plant species were decreasing with increasing planting density, but the strength of this reaction varied between species (Figure 7). The decrease in stem diameter is a common response to increasing planting density [18,26,27,28], which can also be modified by species genotype (clone) [29].

3.7. Higher Heating Value
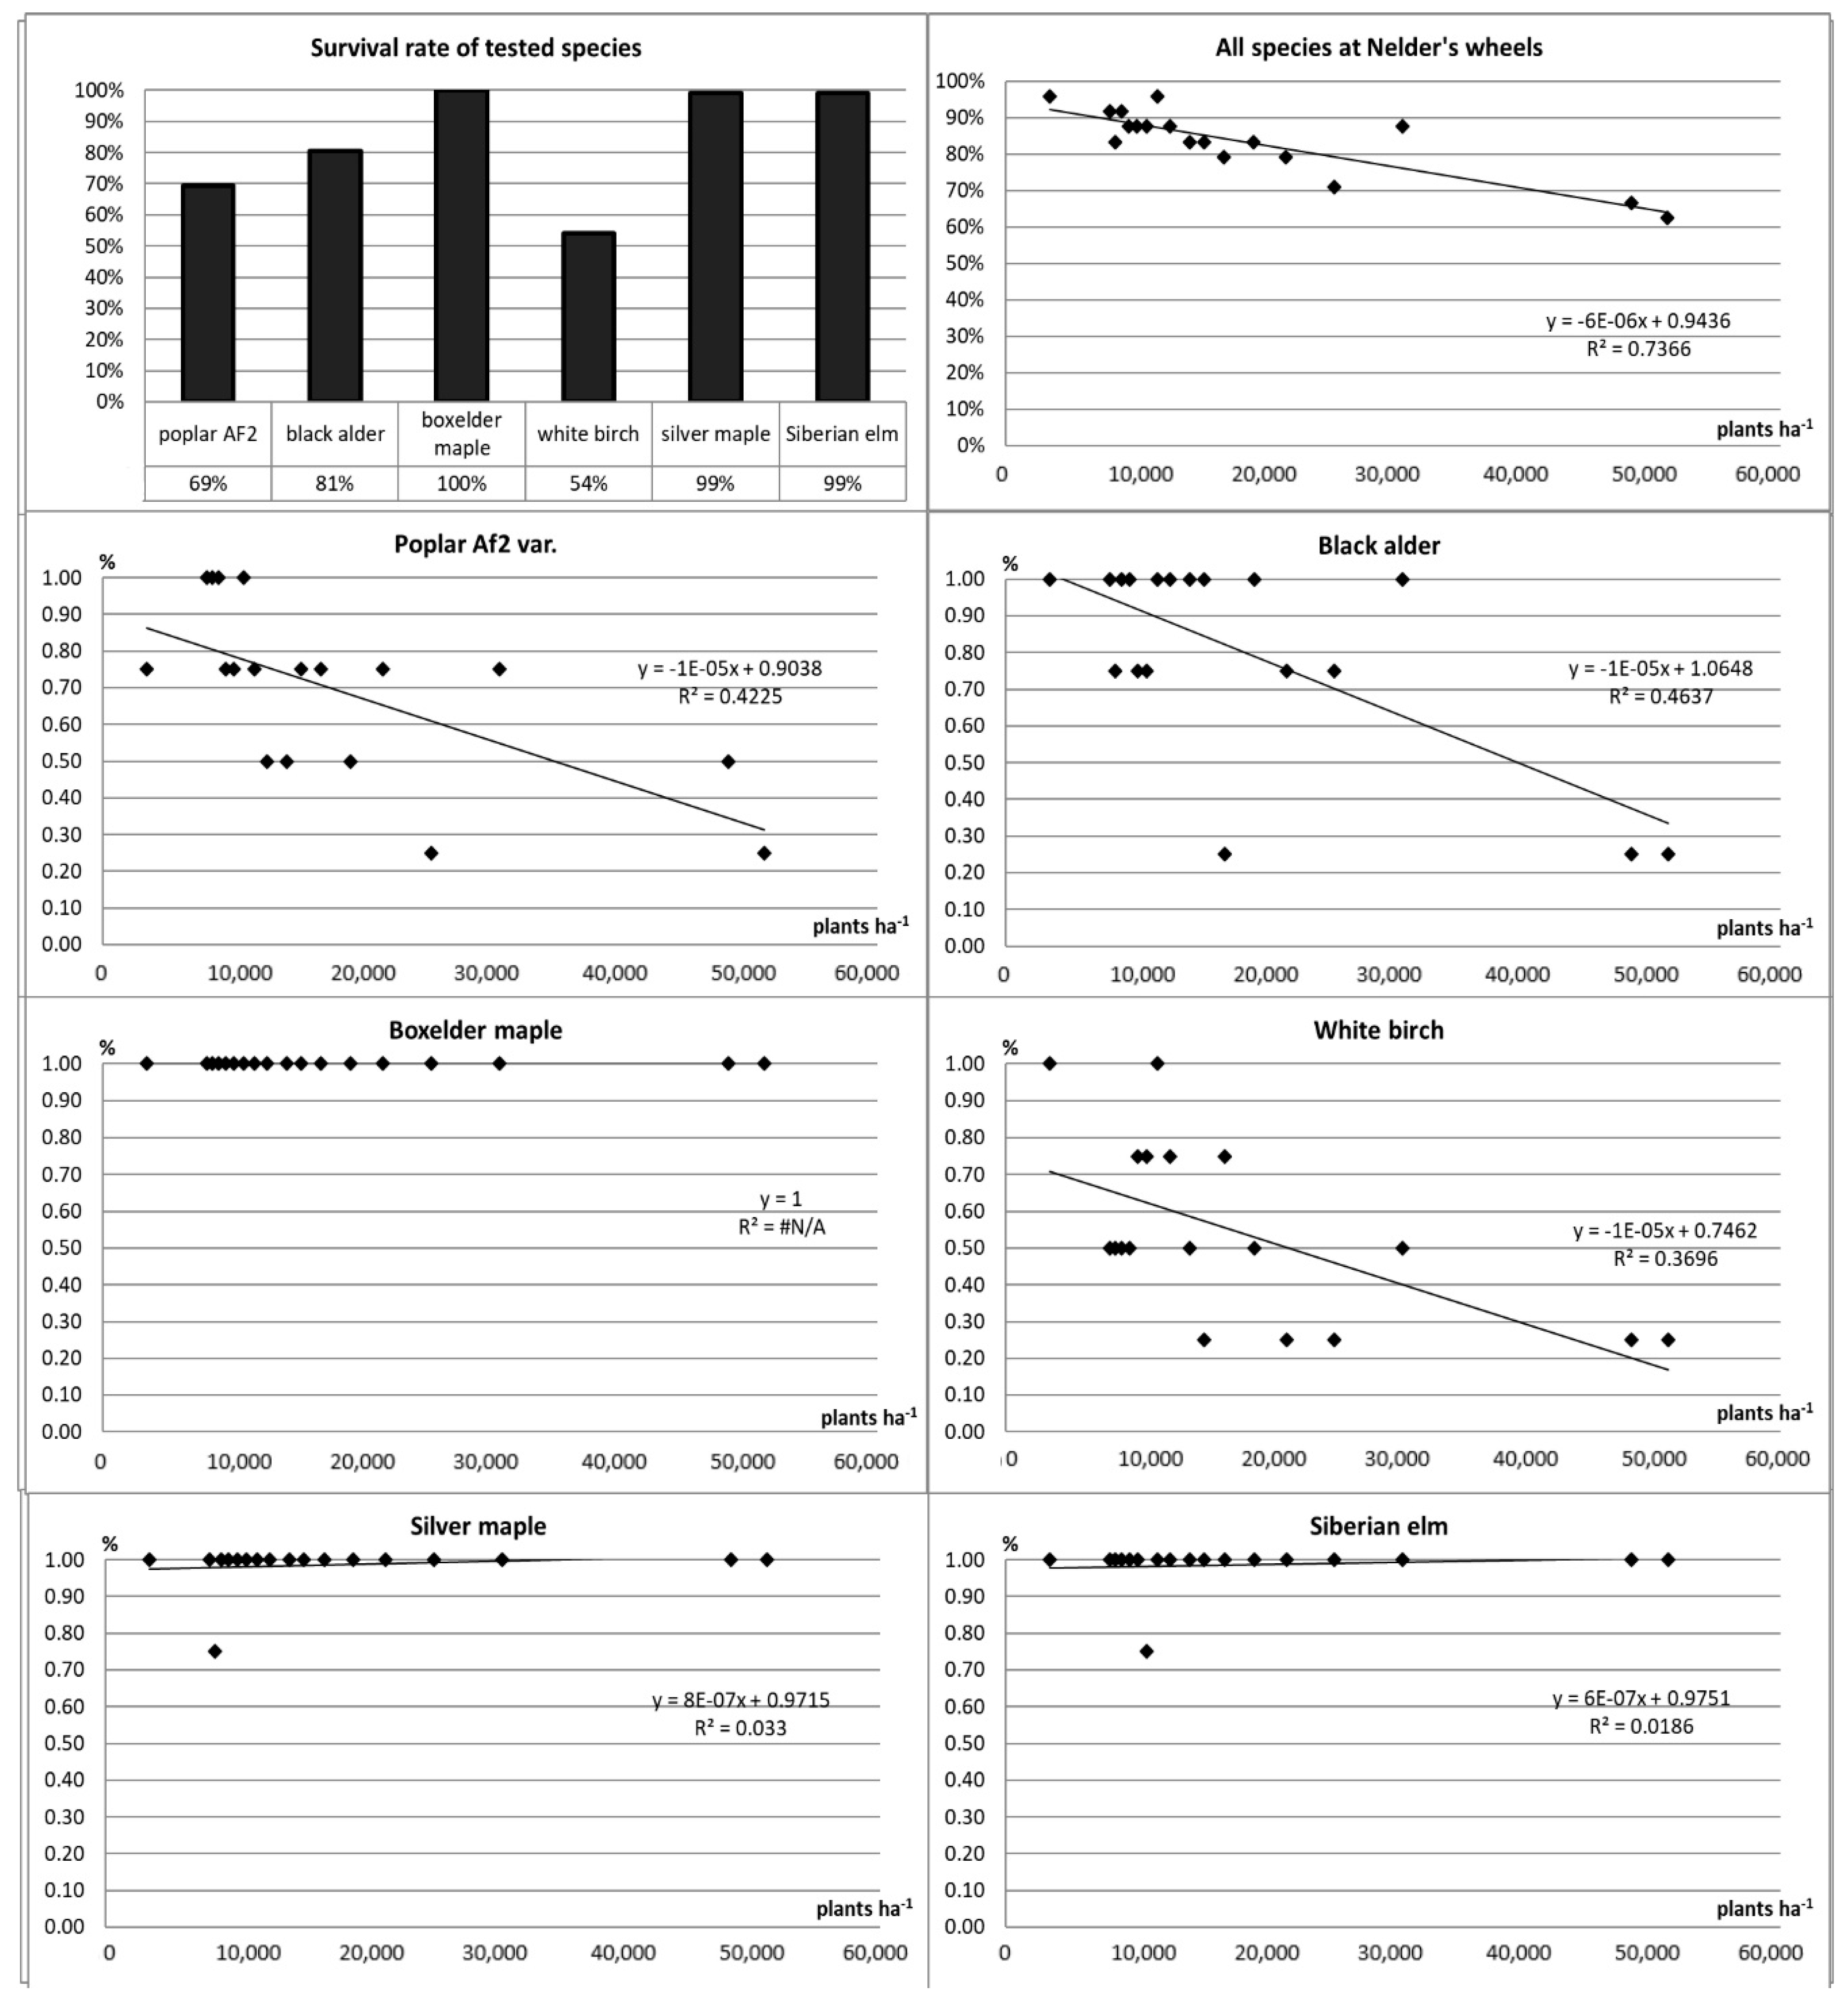
Tested energy sources differed significantly in higher heating value (HHV). White birch and boxelder maple had the highest average HHV value (19,509 and 19,158 J g−1 o, respectively). The lowest HHV was observed for poplar AF2 (17,908 J g−1 o). Dry mass of Siberian elm, black alder, and silver maple had a similar HHV value of around 18,500 J g−1 o (Table 2). Geyer, Argent, and Walawender [18] found that HHV of 7-year-old Siberian was between 18,900 and 20,200 J g−1 (19,700 J g−1 on average), which is a higher HHV value than in the presented. Study stand density had no effect on most species’ HHV. A statistically significant negative correlation of HHV with the plant density was found only for poplar AF2 and white birch (Table 3, Figure 8). In the case of other species, no relationship between HHV and planting density was found. Literature study shows that HHV is highly variable and depends on both genetic factors (species, cultivars) [15,30,31] and cultivation conditions (soil quality, management methods) [30,32] or even plant age [33].

3.8. Survival Rate

The highest survival rate after 7 years was observed for boxelder maple (100%), silver maple, and Siberian elm (both 99%). Black alder survival rate was also at moderately good level (81%), while poplar AF2 and white birch survival rate was the lowest (69% and 54%, respectively). Survival rate in the presented study was dropping with increasing planting densities (for whole experimental design), but some species were unaffected by increasing density (boxelder and silver maple, Siberian elm), while white birch, poplar AF2, and black alder survival rates were dropping with increasing densities (Figure 9). According to Trnka et al. (2008) [34], survival rate of 6-year-old poplar at dense stand (10,000 plants per hectare) varied between 37% and 73% depending on the genotype. Geyer et al. (1987) [18] found that survival rate of 7-year-old Siberian elm was “almost perfect” and did not vary on planting densities from 1400 to 7000 plants per hectare (stands of lower densities than in presented study). Moreover, Geyer (2006) [35] found that survival rate decreases substantially for most tested species at spacing distances less than 1 m (more than 10,000 plants per hectare), while 2 m spacing (2500 plants per hectare) was found optimal for high biomass production and high longevity of plantation. Authors also found that silver maple survival after five years of cultivation was at a level of 97%.

4. Conclusions

Biomass yield parameters of six tested SRC plants strongly depended on both genotype (species) and planting density. The strength and direction of reaction of plants to increasing planting density varied between species. The green mass, dry mass, and shoot diameter of plants was dropping with the increasing planting density for almost all tested species (insignificant negative correlation of shoot diameter and planting density of poplar AF2). At the same time, function curve of calculated potential yield of dry mass and planting density was dropping with increasing planting density for black alder, increasing for Siberian elm and boxelder maple, and was concave for white birch and silver maple (with optimal planting density of about 25,000–30,000 plants per hectare). Planting density seemed to have no effect on calculated potential yield of dry mass for AF2 poplar.
White birch and boxelder maple had the highest average higher heating value (HHV) (19,509 and 19,158 J g−1, respectively). The lowest HHV was observed for poplar AF2 (17,908 J g−1). Dry mass of all other species had similar HHV value of around 18,500 J g−1. A tendency towards reduced higher heating value of plants in more dense stands was observed, but it was confirmed only for AF2 poplar.
Presented study showed that, in the study conditions, poplar AF2 was the most promising SRC plant, with calculated potential dry mass yield of about 15 t ha−1 at wide range of planting densities, with boxelder maple being the only species able to match AF2 poplar’s yielding performance (at 40,000 plants per hectare). The study showed the importance of testing and selection of best-performing species, to maximize biomass accumulation at local site conditions. The optimal density of plantings should be chosen to best suit the needs of cultivated species but also to meet the needs of the industry by optimizing the most important (for the industry) parameters of produced biomass. Cultivation of renewable resources, such as energy crops, must be optimized to site-specific conditions. This includes cultivation on poor soils or marginal soils to minimize their competitiveness against food crops. Optimization of energy crop yields can contribute to the goals of bioeconomy and sustainable development.

Author Contributions

Conceptualization, M.M.; methodology, M.M.; software, A.K.B. and M.M.; investigation, M.M. and A.K.B.; data curation, A.K.B. and M.M.; writing—original draft preparation, A.K.B.; writing—review and editing, M.M. and A.K.B.; visualization, M.M. and A.K.B. All authors have read and agreed to the published version of the manuscript.

Funding

This paper is the result of a long-term study carried out at the Institute of Soil Science and Plant Cultivation, State Research Institute in Pulawy, and it was co-financed by the National (Polish) Centre for Research and Development (NCBiR), project: BIOproducts from lignocellulosic biomass derived from MArginal land to fill the Gap in Current national bioeconomy, No. BIOSTRATEG3/344253/2/NCBR/2017. This research acknowledges financial support from the Widening Program ERA Chair: project BioEcon (H2020), contract number: 669062.

Conflicts of Interest

The authors declare no conflict of interest.

References

  1. Diamantidis, N.D.; Koukis, E.G. Agricultural crops and residues as feedstock for non-food products in Western Europe. Ind. Crops Prod. 2000, 11, 97–106. [Google Scholar] [CrossRef]
  2. El Kasmioui, O.; Ceulemans, R. Financial analysis of the cultivation of poplar and willow for bioenergy. Biomass Bioenergy 2012, 43, 52–64. [Google Scholar] [CrossRef]
  3. Stolarski, M.J.; Śnieg, M.; Krzyżaniak, M.; Tworkowski, J.; Szczukowski, S. Short rotation coppices, grasses and other herbaceous crops: Productivity and yield energy value versus 26 genotypes (2018). Biomass Bioenergy 2018, 119, 109–120. [Google Scholar] [CrossRef]
  4. Nabel, M.; Barbosa, D.B.P.; Horsch, D.; Jablonowski, N.D. Energy crop (Sida hermaphrodita) fertilization using digestate under marginal conditions: A dose-response experiment. Energy Procedia 2014, 54, 127–133. [Google Scholar] [CrossRef] [Green Version]
  5. Matyka, M.; Kuś, J. Influence of soil quality for yield and biometric features of Sida hermaphrodita L. Rusby. Pol. J. Environ. Stud. 2018, 27, 2669–2675. [Google Scholar] [CrossRef]
  6. Navarro, A.; Facciotto, G.; Campi, P.; Mastrorilli, M. Physiological adaptations of five poplar genotypes grown under SRC in the semi-arid Mediterranean environment. Trees 2014, 28, 983–994. [Google Scholar] [CrossRef]
  7. Benomar, L.; DesRochers, A.; Larocque, G. The effects of spacing on growth, morphology and biomass production and allocation in two hybrid poplar clones growing in the boreal region of Canada. Trees 2012, 26, 939–949. [Google Scholar] [CrossRef]
  8. Toillon, J.; Fichot, R.; Dallé, E.; Berthelot, A.; Brignolas, F.; Marron, N. Planting density affects growth and water-use efficiency depending on site in Populus deltoids x P. nigra. For. Ecol. Manag. 2013, 304, 345–354. [Google Scholar] [CrossRef]
  9. Nelder, J.A. New kinds of systematic design for spacing experiments. Biometrics 1962, 18, 283–307. [Google Scholar] [CrossRef]
  10. Wilkinson, J.M.; Evans, E.J.; Bilsborrow, P.E.; Wright, C.; Hewison, W.O.; Pilbeam, D.J. Yield of willow cultivars at different planting densities in a commercial short rotation coppice in the north of England. Biomass Bioenergy 2007, 31, 469–474. [Google Scholar] [CrossRef]
  11. Walle, I.V.; Van Camp, N.; Van de Casteele, L.; Verheyen, K.; Lemeur, R. Short-rotation forestry of birch, maple, poplar and willow in Flanders (Belgium) I—Biomass production after 4 years of tree growth. Biomass Bioenergy 2007, 31, 267–275. [Google Scholar] [CrossRef]
  12. Bullard, M.J.; Mustill, S.J.; McMillan, S.D.; Nixon, P.M.; Carver, P.; Britt, C.P. Yield improvements through modification of planting density and harvest frequency in short rotation coppice Salix spp.—1. Yield response in two morphologically diverse varieties. Biomass Bioenergy 2002, 22, 15–25. [Google Scholar] [CrossRef]
  13. Dahlhausen, J.; Uhl, E.; Heym, M.; Biber, P.; Ventura, M.; Panzacchi, P.; Tonon, G.; Horváth, T.; Pretzsch, H. Stand density sensitive biomass functions for young oak trees at four different European sites. Trees 2017, 31, 1811–1826. [Google Scholar] [CrossRef]
  14. Stolarski, M.J.; Szczukowski, S.; Tworkowski, J.; Wróblewska, H.; Krzyżaniak, M. Short rotation willow coppice biomass as an industrial and energy feedstock. Ind. Crops Prod. 2011, 33, 217–223. [Google Scholar] [CrossRef]
  15. Kulig, B.; Gacek, E.; Wojciechowski, R.; Oleksy, A.; Kołodziejczyk, M.; Szewczyk, W.; Klimek-Kopyra, A. Biomass yield and energy efficiency of willow depending on cultivar, harvesting frequency and planting density. Plant. Soil Environ. 2019, 65, 377–386. [Google Scholar] [CrossRef] [Green Version]
  16. Elfeel, A.A.; Elmagboul, A.H. Effect of planting density on eucaena leucocephala forage and Woody stems production under arid dry climate. Int. J. Agric. Res. 2016, 2, 7–11. [Google Scholar]
  17. Achinelli, F.G.; Doffo, G.; Barotto, A.J.; Luquez, V.; Monteoliva, S. Effects of irrigation, plantation density and clonal composition on woody biomass quality for bioenergy in a short rotation culture system with willows (Salix spp.). Rev. Árvore 2018, 42, 1–8. [Google Scholar] [CrossRef]
  18. Geyer, W.A.; Argent, R.M.; Walawender, W.P. Biomass properties and gasification behavior of 7-year-old Siberian elm. Wood Fiber Sci. 1987, 19, 176–182. [Google Scholar]
  19. Geyer, W.A.; Walawender, W.P. Biomass properties and gasification behavior of young silver maple trees. Wood Fiber Sci. 1997, 29, 85–90. [Google Scholar]
  20. Geyer, W.A.; Walawender, W.P. Biomass properties and gasification behavior of young black locust. Wood Fiber Sci. 1994, 26, 354–359. [Google Scholar]
  21. Niemczyk, M.; Kaliszewski, A.; Jewiarz, M.; Wróbel, M.; Mudryk, K. Productivity and biomass characteristics of selected poplar (Populus spp.) cultivars under the climatic conditions of northern Poland. Biomass Bioenergy 2018, 111, 46–51. [Google Scholar] [CrossRef]
  22. Truax, B.; Fortier, J.; Gagnon, D.; Lambert, F. Planting density and site effects on stem dimensions, stand productivity, biomass partitioning, carbon stocks and soil nutrient supply in hybrid poplar plantations. Forests 2018, 9, 293. [Google Scholar] [CrossRef] [Green Version]
  23. Stolarski, M.J.; Szczukowski, S.; Tworkowski, J.; Krzyżaniak, M.; Załuski, D. Willow production during 12 consecutive years—The effects of harvest rotation, planting density and cultivar on biomass yield. Glob. Chang. Biol. Bioenergy 2019, 11, 635–656. [Google Scholar] [CrossRef]
  24. Geyer, W.A.; Barden, C.; Preece, J.E. Biomass and wood properties of young silver maple clones. Wood Fiber Sci. 2008, 40, 23–28. [Google Scholar]
  25. Perez, I.; Perez, J.; Carrasco, J.; Ciria, P. Siberian elm responses to different culture conditions under short rotation forestry in Mediterranean areas. Turk. J. Agric. For. 2014, 38, 652–662. [Google Scholar] [CrossRef]
  26. Di Matteo, G.; Sperandio, G.; Verani, S. Field performance of poplar for bioenergy in southern Europe after two coppicing rotations: Effects of clone and planting density. iForest Biogeosci. For. 2012, 5, 224. [Google Scholar] [CrossRef] [Green Version]
  27. Hummel, S. Height, diameter and crown dimensions of Cordia alliodora associated with tree density. For. Ecol. Manag. 2000, 127, 31–40. [Google Scholar] [CrossRef]
  28. Mehtätalo, L.; de-Miguel, S.; Gregoire, T.G. Modeling height-diameter curves for prediction. Can. J. For. Res. 2015, 45, 826–837. [Google Scholar] [CrossRef] [Green Version]
  29. Castaño-Díaz, M.; Barrio-Anta, M.; Afif-Khouri, E.; Cámara-Obregón, A. Willow short rotation coppice trial in a former mining area in northern Spain: Effects of clone, fertilization and planting density on yield after five years. Forests 2018, 9, 154. [Google Scholar] [CrossRef] [Green Version]
  30. Sabatti, M.; Fabbrini, F.; Harfouche, A.; Beritognolo, I.; Mareschi, L.; Carlini, M.; Paris, P.; Scarascia-Mugnozza, G. Evaluation of biomass production potential and heating value of hybrid poplar genotypes in a short-rotation culture in Italy. Ind. Crops Prod. 2014, 61, 62–73. [Google Scholar] [CrossRef]
  31. Navarro, A.; Stellacci, A.M.; Campi, P.; Vitti, C.; Modugno, F.; Mastrorilli, M. Feasibility of SRC species for growing in Mediterranean conditions. Bioenergy Res. 2016, 9, 208–223. [Google Scholar] [CrossRef]
  32. Nebeská, D.; Trögl, J.; Žofková, D.; Voslařová, A.; Štojdl, J.; Pidlisnyuk, V. Calorific values of miscanthus x giganteus biomass cultivated under suboptimal conditions in marginal soils. Stud. Oecol. 2019, 13, 61–67. [Google Scholar] [CrossRef]
  33. Kumar, R.; Pandey, K.K.; Chandrashekar, N.; Mohan, S. Study of age and height wise variability on calorific value and other fuel properties of Eucalyptus hybrid, Acacia auriculaeformis and Casuarina equisetifolia. Biomass Bioenergy 2011, 35, 1339–1344. [Google Scholar] [CrossRef]
  34. Trnka, M.; Trnka, M.; Fialová, J.; Koutecky, V.; Fajman, M.; Zalud, Z.; Hejduk, S. Biomass production and survival rates of selected poplar clones grown under a short-rotation system on arable land. Plant Soil Environ. 2008, 54, 78–88. [Google Scholar] [CrossRef] [Green Version]
  35. Geyer, W.A. Biomass production in the central great plains USA under various coppice regimes. Biomass Bioenergy 2006, 30, 778–783. [Google Scholar] [CrossRef]
Figure 1. Distribution of species in the experiment design according to Nelder (1962) design (dots of different color represents trees of different species).
Agriculture 10 00583 g001
Figure 2. Relationship between green mass of plants (kg plant−1) and planting density (plants ha−1).
Agriculture 10 00583 g002
Figure 3. Relationship between dry mass of plant biomass (kg plant−1) and planting density (plants ha−1).
Agriculture 10 00583 g003
Figure 4. Relationship between dry mass share (%) and planting density (plants ha−1).
Agriculture 10 00583 g004
Figure 5. Relationship between potential yield of dry mass per year (t ha−1 r−1) and planting density (plants ha−1).
Agriculture 10 00583 g005
Figure 6. Relationship between plant height (m) and planting density (plants ha−1).
Agriculture 10 00583 g006
Figure 7. Relationship between plants shoot diameter (mm) and planting density (plants ha−1).
Agriculture 10 00583 g007
Figure 8. Relation of higher heating value (J g−1) and planting density (plants ha−1).
Agriculture 10 00583 g008
Figure 9. Survival rate after 7 years for different species and different planting densities.
Agriculture 10 00583 g009
Table 1. Planting distances and tree densities.
Ring No.Distance to the Center [m]Distance to Previous Ring [m]Density [Plants ha−1]
11.0Guard ring
21.50.551,282
32.00.548,462
42.50.530,769
53.00.525,477
63.50.521,739
74.00.519,231
84.50.516,949
95.00.515,384
105.50.514,286
116.00.512,739
126.50.511,764
137.00.510,929
147.50.510,204
158.00.59569
168.50.59009
179.00.58510
189.50.58064
1910.0Guard ring
2011.01.03448
2112.0Guard ring
Table 2. Median values of tested plants and their biometric features.
SpecificationGreen Mass
[kg]
Share of Dry Mass
[%]
Dry Mass
[kg]
Plant Height
[m]
Shoot Diameter
[mm]
Higher Heating Value
[J g−1]
Potential Yield of Dry Mass [t ha−1 yr−1]
Poplar AF2 var.29.1 a *42.8 a13.1 a10.6 a113.5 a17,908 a15.8 a
Siberian elm2.8 b58.5 b1.7 b4.7 d41.8 b18,664 bc5.2 b
Black alder5.3 bc48.2 c2.5 bc6.6 bc60.4 c18,366 ab3.9 b
White birch5.5 bc52.4 c2.9 bc7.0 b59.4 bc19,509 c2.2 b
Boxelder maple9.3 c50.8 c4.7 c6.8 b63.8 c19,158 c9.8 c
Silver maple2.6 b51.8 c1.4 b5.2 cd39.2 b18,726 bc4.7 b
* Data marked with the same letter do not differ significantly between species (α = 0.05).
Table 3. Correlation matrix for the studied features.
PlantSpecificationGreen Mass
[kg Plant −1]
Share of Dry
Mass
[%]
Dry Mass
[kg Plant −1]
Plant Height
[m]
Shoot Diameter
[mm]
Higher Heating Value
[J g−1]
Potential Yield of Dry Mass [t ha−1 yr−1]
Poplar AF2 var.Plant density [plants ha−1]−0.619 *0.152−0.651−0.384−0.367−0.4850.025
Green mass [kg] −0.5420.9930.8220.8150.4350.377
Share of dry matter [%] −0.454−0.650−0.389−0.350−0.131
Dry mass [kg plant −1] 0.7970.7960.4280.399
Plant height [m] 0.6760.4430.525
Shoot diameter [mm] 0.3460.130
Higher heating value [J g−1] 0.086
Siberian elmPlant density [plants ha−1]−0.6600.457−0.663−0.402−0.6280.2480.414
Green mass [kg] −0.5041.0000.7740.923−0.0650.309
Share of dry matter [%] −0.479−0.376−0.4390.356−0.087
Dry mass [kg plants −1] 0.7770.925−0.0610.306
Plant height [m] 0.793−0.0230.518
Shoot diameter [mm] −0.1240.234
Higher heating value [J g−1] 0.235
Black alderPlant density [plants ha−1]−0.8330.409−0.804−0.775−0.8740.115−0.539
Green mass [kg] −0.3570.9290.6160.884−0.1660.437
Share of dry matter [%] −0.025−0.257−0.293−0.317−0.257
Dry mass [kg plant −1] 0.6030.850−0.3040.437
Plant height [m] 0.841−0.1290.346
Shoot diameter [mm] −0.1290.280
Higher heating value [J g−1] −0.149
White birchPlant density [plants ha−1]−0.5890.301−0.589−0.188−0.639−0.095−0.175
Green mass [kg] −0.2780.9980.5980.679−0.1390.728
Share of dry matter [%] −0.227−0.457−0.175−0.520−0.185
Dry mass [kg plant −1] 0.5880.684−0.1700.727
Plant height [m] 0.5630.0620.434
Shoot diameter [mm] 0.1690.233
Higher heating value [J g−1] −0.288
Boxelder maplePlant density [plants ha−1]−0.684−0.486−0.670−0.642−0.7060.3210.493
Green mass [kg] 0.1851.0000.5870.956−0.388−0.068
Share of dry matter [%] 0.2450.1190.229−0.109−0.360
Dry mass [kg plant −1] 0.5800.957−0.395−0.095
Plant height [m] 0.630−0.1630.121
Shoot diameter [mm] −0.313−0.130
Higher heating value [J g−1] 0.196
Silver maplePlant density [plants ha−1]−0.590−0.209−0.601−0.124−0.621−0.0640.378
Green mass [kg] 0.0410.9940.5670.865−0.1120.326
Share of dry matter [%] 0.144−0.450−0.140−0.172−0.281
Dry mass [kg plant −1] 0.5180.839−0.1210.295
Plant height [m] 0.668−0.0870.549
Shoot diameter [mm] −0.0130.197
Higher heating value [J g−1] −0.539
* Significant correlations are in bold (α = 0.05).
Publisher’s Note: MDPI stays neutral with regard to jurisdictional claims in published maps and institutional affiliations.

