Article

Effect of Crop Residue Decomposition on Soil Aggregate Stability

1
Institute of Agricultural and Environmental Sciences, Estonian University of Life Sciences, 51006 Tartu, Estonia
2
Department of Geography, Institute of Ecology and Earth Sciences, University of Tartu, 50090 Tartu, Estonia
*
Author to whom correspondence should be addressed.
Agriculture 2020, 10(11), 527; https://doi.org/10.3390/agriculture10110527
Submission received: 13 October 2020 / Revised: 31 October 2020 / Accepted: 3 November 2020 / Published: 5 November 2020

Abstract

:
The decomposition of fresh crop residues added to soil for agricultural purposes is complex. This is due to different factors that influence the decomposition process. In field conditions, the incorporation of crop residues into soil does not always have a positive effect on aggregate stability. The aim of this study was to investigate the decomposition effects of residues from two different cover crops (Brassica napus var. oleifera and Secale cereale) and one main crop (wheat straw) on soil aggregate stability. A 105-day incubation experiment was conducted in which crop residues were mixed with sandy loam soil at a rate of 6 g C kg−1 of soil. During the incubation, there were five water additions. The decomposition effects of organic matter on soil conditions during incubation were evaluated by determining the soil functional groups; carbon dioxide (CO2), nitrous oxide (N2O), and methane (CH4) emissions; soil microbial biomass carbon (MBC); and water-stable aggregates (WSA). The functional groups of the plant residues and the soil were analyzed using Fourier transform infrared spectroscopy (FTIR) and a double exponential model was used to estimate the decomposition rates. The results show that the decomposition rate of fresh organic materials was correlated with the soil functional groups and the C/N ratio. Oilseed rape and rye, with lower C/N ratios than wheat straw residues, had faster decomposition rates and higher CO2 and N2O emissions than wheat straw. The CO2 and N2O flush at the start of the experiment corresponded to a decrease of soil aggregate stability (from Day 3 to Day 10 for CO2 and from Day 19 to Day 28 for N2O emissions), which was linked to higher decomposition rates of the labile fraction. The lower decomposition rates contributed to higher remaining C (carbon) and higher soil aggregate stability. The results also show that changes in the soil functional groups due to crop residue incorporation did not significantly influence aggregate stability. Soil moisture (SM) negatively influenced the aggregate stability and greenhouse gas emissions (GHG) in all treatments (oilseed rape, rye, wheat straw, and control). Irrespective of the water addition procedure, rye and wheat straw residues had a positive effect on water-stable aggregates more frequently than oilseed rape during the incubation period. The results presented here may contribute to a better understanding of decomposition processes after the incorporation of fresh crop residues from cover crops. A future field study investigating the influence of incorporation rates of different crop residues on soil aggregate stability would be of great interest.

1. Introduction

Crop residue incorporation in the soil such as cover crops and cash crops can improve soil quality in organic farming and conservation agriculture. A previous study observed that freshly added organic matter (crop residues) has a temporary effect on soil aggregate stability [1]. Abiven et al. [2] found that the efficiency of crop residue applications on soil aggregate stability depended on their initial chemical (carbon to nitrogen ratio (C/N)) and biochemical composition. Liu et al. [3] also showed that the effectiveness of the crop residues on soil aggregate stability depended on the addition rates, composition, and decomposability. In terms of the biochemical composition of crop residues, Angst et al. [4] observed that crop residues with a higher concentration of recalcitrant (lignin, lipids, cellulose, etc.) material had lower decomposition rates and longer-term effects on the aggregate stability. Apart from these examples, Abiven et al. [5] noted that few studies have linked soil aggregate stability with the biochemical composition of crop residues. A recent study showed that with the incorporation of fresh crop residues in the soil, the microorganisms concentrate their energy on the decomposition of easily decomposable compounds (sugars, proteins, etc.) [6]. In exchange, soil aggregate-binding agents are liberated from microorganisms (fungal hyphae and polysaccharides). Thus, crop residues improve the soil aggregate stability during their decomposition by soil bacteria and fungi. However, the more advanced the decomposition stage, the lower the microbial activity and aggregate stability [7]. The decomposition study of Mizuta et al. [8] showed that decomposition rates of pure compounds such as starch and cellulose influence aggregate formation but not soil aggregate stability.
The decomposition rates of the crop residues are influenced by the type of incorporated crop residues, soil water content, aeration regime and plant water content [9,10]. The results of Cosentino et al. [11] showed that crop residues could increase the microbial biomass and soil aggregate stability, but these effects were diminished by frequent soil drying and wetting cycles. Additionally, another past study observed that not all crop residues incorporated in the soil increased the soil aggregate stability [12] and that the effect of crop residues on soil aggregate stability is influenced by the soil type, climate zone, and agricultural management. A meta-analysis by Blanco-Canqui et al. [13] also found that not all studies that involved cover crops as crop residues affect the soil aggregate stability. Previous and recent studies have found that the location of crop residues (crop residues left on the surface or incorporated into the soil) can influence decomposition rates as well as soil biological properties and soil aggregate stability [14,15,16]. Thus, the crop residues left on the surface will decompose much more slowly than incorporated crop residues. Another study based on two years of data from a humid temperate zone showed a decrease in soil aggregate stability after crop residue incorporation by tillage [17]. Balesdent et al. [18] reported that in conventional tillage, the amount of decomposed fresh organic matter was much higher than in a no-till system. The incorporation of crop residues by tillage increases the access of microorganisms to fresh organic materials, leading to fast decomposition and creating a transient effect on soil aggregate stability.
At present, the literature still does not fully cover the extent of the beneficial effects of the decomposition rate of incorporated crop residues on soil aggregate stability since many interfering factors can influence crop residue decomposition. Additionally, in most previous studies of aggregate stability, the experiments conducted in a laboratory studied the effects using only oven-dried material from crop residues or post-harvest crop residues with a high content of dry matter [2,7,19]. The focus of our paper was to study the effect of the decomposition rate on soil aggregate stability when incorporating fresh crop residues from two cover crops widely used in Nordic climate conditions and wheat straw. We suppose that by incorporating cover crop residues into the soil, the destabilizing effect on soil structural stability is related to unstable and rapid decomposition rates associated with ‘young’ organic matter. In this case, the ‘young’ organic matter refers to freshly incorporated crop residues.

2. Materials and Methods

2.1. Soil and Crop Residue Preparation

The incubation experiment comprised four treatments, each containing four replications. Three of the treatments consisted of soil mixed with either fresh green crop residues of oilseed rape (OR), fresh green residues of rye (Rye), or dry wheat straw (WS). Pots filled with soil without any added organic matter comprised a control treatment (Control). The field soil used for the pot experiment was sampled from the top 0–20 cm layer, dried at room temperature, and sieved through a 10 mm sieve. The soil had a sandy loam texture with the following characteristics: 57.4% sand, 32.3% silt, and 10.3% clay. According to the World Reference Base for Soil Resources (IUSS Working Group WRB 2006), the soil can be described as an Albic Stagnic Luvisol. The dry soil was placed in 4000 mL pots (Ø = 21 cm, h = 19.3 cm) at a rate of 3000 g per pot. The chemical characteristics of the soil are shown in Table 1.
Two of the most common cover crop residues in the Nordic region were selected, oilseed rape (Brassica napus var. oleifera) and cereal rye (Secale cereale) as well as wheat straw residue. The shoots and leaves of oilseed rape and rye were collected from the field at the tillering stage. From the collected plant material, a subsample was used to determine the initial total carbon (TC) and total nitrogen (TN) (Table 2). The TC and TN were determined in a total elemental analyzer (VarioMAX CNS, elementar Analysensysteme GmbH, Langenselbold, Germany). Plant functional groups were analyzed using FTIR according to the procedure described below (Section 2.3.4).

2.2. Experiment Design

Fresh crop residues were chopped into small pieces (about 4 cm long) and evenly incorporated into the dry soil in the pots at a rate of 6 g C kg−1 of soil before water addition (considered as Day 0). This quantity is equivalent to 22.5 Mg C ha−1 in field conditions, given a 25 cm soil depth and a bulk density of 1500 kg m−3. All four treatments were brought up to the field capacity for water (24% gravimetric) by adding distilled water 24 h after mixing dry soil with crop residues; in total, five wetting procedures were applied at 1, 11, 26, 46, and 75 days. The treatments were incubated for 105 days at a room temperature of 23 °C (±0.8) and covered with a dark plastic film to allow some gas exchange. The experiment was conducted in two phases: the oilseed rape, wheat straw, and control treatments first, followed by rye.

2.3. Sampling and Analysis

2.3.1. Water-Stable Aggregates

The sampling for water-stable aggregates, FTIR analyses, and soil total carbon and nitrogen was done at Day 0 before residue addition, then again at 3, 10, 13, 19, 25, 28, 45, 48, 74, 77, and 105 days. The soil was sampled from every pot at a 0–5 cm depth. The sampled soil was dried at room temperature and sieved through a 2 mm sieve. The aggregate stability was determined based on the method of Kemper and Rosenau [20]. Firstly, 4 g of dry soil from each sample (aggregates ≤ 2 mm) were placed in a set of sieves with 0.25 mm openings and shaken in cans with 100 mL of distilled water for 3 min on the wet sieving apparatus (Eijkelkamp, Giesbeek, The Netherlands). The distilled water cans were replaced by cans with a 0.4% NaOH solution and then shaken in continuous mode until all aggregates were dissolved. Finally, both types of cans were dried in a water bath at 95 °C for 12 h and then in a drying oven at 105 °C for 1 h. The percentage of stable aggregates was obtained by dividing the weight of soil remaining in the NaOH solution cans by the sum of the soil weight from the distilled water can and the weight of the soil from the NaOH solution can. Each sample from every single pot was measured with four repetitions (n = 16).

2.3.2. Gas Emissions Analysis

Gas emissions were measured using the closed chamber method [21]. Gas samples from each treatment were taken at Day 0, on the first day after residue incorporation, and then at Days 3, 5, 10, 13, 19, 25, 28, 45, 48, 74, 77, and 105. Three-liter pots were used as chambers, each with a diameter of 17 cm and height of 15.6 cm. The pots were inserted upside down into the soil pots to a depth of approximately 1 cm, achieving hermetic closing of the neck. Two holes were made in each chamber, one for a gas collection pipe and the other for a temperature sensor. Gas samples were taken over a one-hour period, at regular intervals of 20 min (i.e., at 0, 20, 40, and 60 min), using 12 mL pre-evacuated (0.3 mbar) bottles [22]. The CO2, N2O, and CH4 concentrations of samples were determined using a GC-2014 gas chromatography system (Shimadzu Corporation, Kyoto, Japan equipped with ECD, TCD, and FID sensors as described by Loftfield et al. [23]. Soil conditions, such as soil temperature, electrical conductivity (EC), and soil moisture (SM), were simultaneously measured using an electronic tensiometer sensor (Procheck GS3, Decagon Devices, MeterGroup, Pullman, WA, USA).

2.3.3. Microbial Biomass Carbon

Sampling for microbial biomass was performed separately at Days 3, 10, 13, 19, 25, 28, 45, 48, 74, 77, and 105. Samples were taken from every pot, and analyses immediately performed once for each sample. Microbial biomass carbon was determined according to the modified method of Flieβbach and Mäder [24]. Each analysis was performed with a 20 g chloroform-fumigated and unfumigated fresh soil sample over 24 h. Extraction was performed using 80 mL of a 0.01 M CaCl2 solution. To determine C in the fumigated and non-fumigated samples, a total elemental analyzer was used (VarioMAX CNS, Elementar Analysensysteme GmbH, Langenselbold, Germany). The concentration was displayed as mg C kg−1 of dry soil.

2.3.4. Fourier Transform Infrared Spectroscopy (FTIR) Analysis

After drying, the soil samples were crushed by hand between 1 and 5 min in an agate mortar. The soil functional groups were determined by Thermo-Nicolet iS10 Fourier Transform Infrared Spectrophotometer (FTIR, Thermo Fisher Scientific, Waltham, MA, USA). The data was collected at a 4 cm−1 resolution over a range of 4000 to 400 cm−1. For each sample, 32 scans were performed in three repetitions. Spectra replicates were corrected against the spectrum for ambient air as background, and the automatic baseline correction was applied. Peak heights were obtained using OMNIC software (Nicolet Instruments Corp., Madison, WI, USA). Relative absorbance was measured following the procedure described in Gerzabek et al. [25]. The parameters (base1/peak/base2) chosen for each peak were as follows: 3000/2920/2800, 1740/1630/1495, 1495/1410/1320, and 1320/1005/825. The relative absorbance was calculated by dividing the height of a distinct peak by the total sum of all peak heights. The soil spectra from the FTIR analyses are represented in Figure 1. The results show two peaks, at 3694 and 3617 cm−1, which are associated with O–H stretching in kaolinite [26]. The same O–H bond specific for carboxyl and hydroxyl groups was also found in this region, at 3400 cm−1 [27]. The peak at 2920 cm−1 is due to the asymmetric C–H vibration of aliphatic compounds, also known as the hydrophobic component [28]. Further along the soil spectra, the hydrophilic component at 1630 cm−1 can be seen, which represents the aromatic C = C and C = O vibrations of amide I groups [29]. The next band, at 1410 cm−1, is characteristic of C–O bond vibrations as well as vibrations in C–N (amide III) [30,31]. The sharp peak at 1005 cm−1 corresponds to the Si–O–Si stretching of silicates and clay minerals as well as the C–O–C stretching of polysaccharides [32]. Three other peaks in the soil samples were found at 795, 775, and 695 cm−1, which are due to Si–O bonds in quartz material [26].

2.4. Decomposition Rates

The C decomposition of crop residues was estimated based on the initial input of carbon into the soil [33] and expressed as:
n e t C e v o l v e d = C a m e n d e d   C c o n t r o l
In Equation (1), netCevolved is the difference between amended carbon (Camended) as plant residues and carbon flushed from the control treatment (Ccontrol). The percentage of remaining C (%Cremaining) was estimated as a function of:
% C r e m a i n i n g = ( ( C i n i t i a l C e v o l v e d ) / C i n i t i a l ) ×   100
Cinitial is the C concentration of the added residue, and Cevolved is the C emitted as CO2 during incubation. A double exponential model was used to calculate the decomposition rate:
C t = C a ( e k a t ) + C p ( e k p t ) .
The model divides the incorporated fresh organic matter from oilseed rape, wheat straw, and rye treatments into two pools of rapidly decomposing Ca and slow decomposing Cp. In the model, Ct is the percentage of remaining C from the residue at time t, ka is the decomposition rate of the rapidly decomposing pool, and kp is the decomposition rate of the stable fraction Cp. The percentage of remaining C should be between 0 and 100. The model does not consider the transformation of labile material into more recalcitrant material, which can occur during microbial activity.

2.5. Statistical Analysis

Two-way ANOVA was used to estimate the variation across all parameters using time and treatment factors as well as their interaction. One-way ANOVA was applied to determine the treatment effect for each parameter on a specific day. One-way ANOVA followed by post hoc Tukey’s HSD was used to study the differences between treatments for the final cumulative gas fluxes. The daily gas emissions between measurement points were estimated by linear interpolation [34]. The interpolation was performed to obtain a more realistic value of the percentage of remaining C in the soil, which was calculated from the cumulative CO2. Pearson correlation and stepwise regression analysis was performed for all data to identify the relationships between parameters. R programming language (R core team, Vienna, Austria, 2019) was used for all statistical analyses. To fit the double exponential model, the ‘nlxb’ function from the ‘nlsr’ package was used.

3. Results

3.1. Soil Aggregate Stability

Dry soil at Day 0, before crop residue addition and wetting, had high aggregate stability across all treatments: there were no significant differences between them (Figure 2). However, after water addition on Day 3, the stability decreased significantly with reductions of 25% in the control and rye treatments, 19% in the oilseed rape treatment, and 29% in the wheat straw treatment. Until Day 19, aggregate stability only significantly increased within wheat straw and rye treatments compared to Day 3, reaching a value of 39.36% (±1.35) and 32.26% (±0.72) stable aggregates, respectively. Nevertheless, this growth was 10% and 15% lower in wheat straw and rye, respectively, compared to Day 0. In both treatments, aggregate stability further decreased between Days 19 and 28. Afterwards, aggregate stability did not change significantly in wheat straw treatment. In the rye treatment, stability increased continuously between Days 28 and 77. In the oilseed rape treatment, aggregate stability decreased progressively until Day 28. Oilseed rape treatment resulted in a significant increase in aggregate stability at Day 45, and at the end of incubation at Day 105. In the control treatment, a significant decrease also happened on Day 74, followed by an increase at Day 105.
Comparing the percentage of water-stable aggregates (WSA) on Day 3 of the experiment and after Day 105, there was a higher overall rate of stable aggregates in the rye (>21%) and wheat straw (>14%) treatments. The WSA showed significant variability between and within the treatments during the incubation period (Table 3).
There were significant differences between the control and other treatments on Day 10 of the incubation (Figure 2). On Days 10 and 19, a significant increase occurred in wheat straw as compared to other treatments. A significant growth of aggregate stability with respect to other treatments was found in the rye and wheat straw treatments on Days 74 and 77.

3.2. Gas Emissions

The treatments had a significant effect on the evolution of greenhouse gases (Table 3). Oilseed rape and rye treatments had significantly higher CO2 emissions than other treatments (p < 0.05). In both cases, the emissions were highest in the first 25 days of the incubation, after which the emissions stabilized (Figure 3A). The highest peak of emissions in oilseed rape treatment was observed immediately after the addition of the residue, at Day 0, until Day 3, in which there was a decrease from 827.2 (±30.27) mg to 795.08 (±59.98) mg C m−2 h−1, respectively. For the rye treatment, the maximum CO2 emissions value was reached on the third day, at 927.06 (±35.41) mg C m−2 h−1. Wheat straw-treated soil yielded lower emissions than soil with fresh residues, but significantly higher emissions than those of the control treatment. In the oilseed rape and rye treatments, the CO2 fluxes stabilized after Day 45, whereas in the wheat straw treatment, CO2 emissions were significantly higher in the last 60 days of the experiment. The cumulative CO2 emissions in the oilseed rape treatment were 8% higher than in the rye treatment (Figure 3D), 76% higher than in the wheat straw treatment, and 95% higher than in the control treatment.
During the incubation, oilseed rape and rye treatments showed significantly higher N2O emissions (Figure 3B) than the other treatments. The emissions in oilseed rape and rye began to increase three days after the addition of water, reaching 1.65 (±0.22) mg N m−2 h−1 in the rye treatment and 0.41 (±0.05) mg N m−2 h−1 in the oilseed rape treatment. Whilst the N2O emissions continued to rise in the oilseed rape treatment, for rye treatment, the emissions decreased on Days 5 and 10. After the second water addition, the emissions in both rye and oilseed rape treatments increased and only stabilized after Day 74. Rye emissions peaked between Days 25 and 28 at a maximum of 5.15 (±0.42) mg N m−2 h−1.
By contrast, oilseed rape peak N2O emissions values were maintained for a more extended period, although the maximum value was significantly lower than for the rye treatment at 2.97 (±0.2) mg N m−2 h−1. The highest cumulative N2O emissions were registered in the rye treatment, at 18.79 (±0.48) mg N m−2 h−1 (Figure 3E). The oilseed rape treatment showed 19% lower cumulative emissions as compared with rye treatment, and 98% higher as compared with control and wheat straw treatments. In both control and wheat straw treatments, the N2O emissions were not significantly different from each other after 105 days of incubation.
Methane (CH4) fluxes varied significantly throughout the incubation experiment across all treatments (Figure 3C). Negative CH4 fluxes were detected in all treatments at specific sampling dates during the experiment. Notably, in the control treatment, negative emissions were registered on 71% of the measured days, and on 80%, 28%, and 35% of the measured days in the wheat straw, oil rapeseed, and rye treatments, respectively. Positive cumulative fluxes were only observed in the rye treatment (11.04 µg C m−2 h−1, ±4.38) (Figure 3F). In all other treatments, cumulative fluxes were negative.

3.3. Microbial Biomass Carbon

The plant residues incorporated into the soil influenced the microbial biomass carbon (MBC) in different ways (Figure 4). The concentration of MBC varied significantly for time (days) and treatment (Table 3), although higher variability was noted between the treatments. In the rye and oilseed rape treatments, MBC was significantly increased on the third day after the first water addition, at 982.7 (±49.73) and 415.98 (±84.16) mg C kg−1 of dry soil, respectively (Figure 4). In both treatments with fresh residues, MBC dropped significantly on Day 10. After that, it remained relatively stable until Day 25. Between Days 28 and 48, the MBC decreased substantially in the oilseed rape treatment. By contrast, the rye treatment recorded a gradual increase in MBC, starting after 48 days and continuing until the end of the experiment. The wheat straw soil treatment reached its peak more gradually, and only after Day 25. With every water addition, the MBC in the wheat straw decreased until Day 77, which was followed by an increase.

3.4. Soil Functional Groups

The treatment and incubation period did not have a significant effect on all identified peaks from the FTIR spectra (Table 3). Overall, the addition of rye plant residues had the greatest effect on the relative absorbance of the aromatic (1630 cm−1) and C–O compounds (1410 cm−1) (Table 4). At Day 105, the rye treatment showed a 25% and a 63% increase in relative absorbance at the peaks of 1630 cm−1 and 1410 cm−1, respectively. The mineral compound at the 1005 cm−1 peak decreased by 2% in relative absorbance at Day 105 compared to Day 0. The initial biochemical state of the wheat straw treatment did not change significantly after 105 days of incubation, nor were significant changes recorded in the control treatment after Day 105. In the oilseed rape treatment, a 44% increase in relative absorbance was observed at the 1410 cm−1 peak (corresponding to C–O and amide (III) compounds). None of the aliphatic compounds in any of the treatments underwent significant changes as reflected in their peak at 2920 cm−1 (Table 4).

4. Discussion

After 105 days of incubation, there was a total of 58.04% and 60.77% remaining C in the oilseed rape and rye treatments, respectively, and 71.19% in the wheat straw treatment (Table 5). Based on the percentage of remaining C, the double exponential model was applied, which divides the incorporated organic material into labile and stable fractions. Ca, which is initial labile C content in the crop residues, was between 38% and 40% in the rye and oilseed rape treatments, respectively.
The decomposition rates for the labile fraction ka in the rye and oilseed rape treatments were 12.7 × 10² and 13.7 × 10² %C d−1, respectively. The stable fraction kp registered a slower decomposition rate in rye residues, of 4.3 × 10⁴ %C d−1, compared to oilseed rape, at 5.7 × 10⁴ %C d−1. However, in the case of wheat straw, a negative result was observed for the decomposition rate of stable fraction kp (−32.9 × 10⁴, %C d−1). The negative decomposition rate is the result of compounds in the labile fraction that are less readily decomposed, taking a longer time to decompose and delaying the start of the decomposition of the stable fraction. Furthermore, in terms of the labile fraction, wheat straw had a much lower positive decomposition rate of the labile fraction ka compared to other residues (0.7 × 10², %C d−1). Generally, these findings are consistent with the findings of Johnson et al. [33] and Barel et al. [35], who found that crop residues with lower C/N have higher decomposition rates. Jama and Nair [36] also found, in a decomposition study, that the decomposition speed of the labile fraction is more strongly correlated to the C/N ratio than that of the stable fraction. Additionally, Ajwa and Tabatai [37] noticed that decomposition rates increase with the higher total N of crop residues. It is worth noting that the dry matter in crop residues decreases in the following order: wheat straw > rye > oilseed rape. Consequently, the decomposition rates were inversely proportional to the dry matter content in the crop residues. This means that at lower dry matter content, the decomposition rates are higher (oilseed rape < rye < wheat straw).
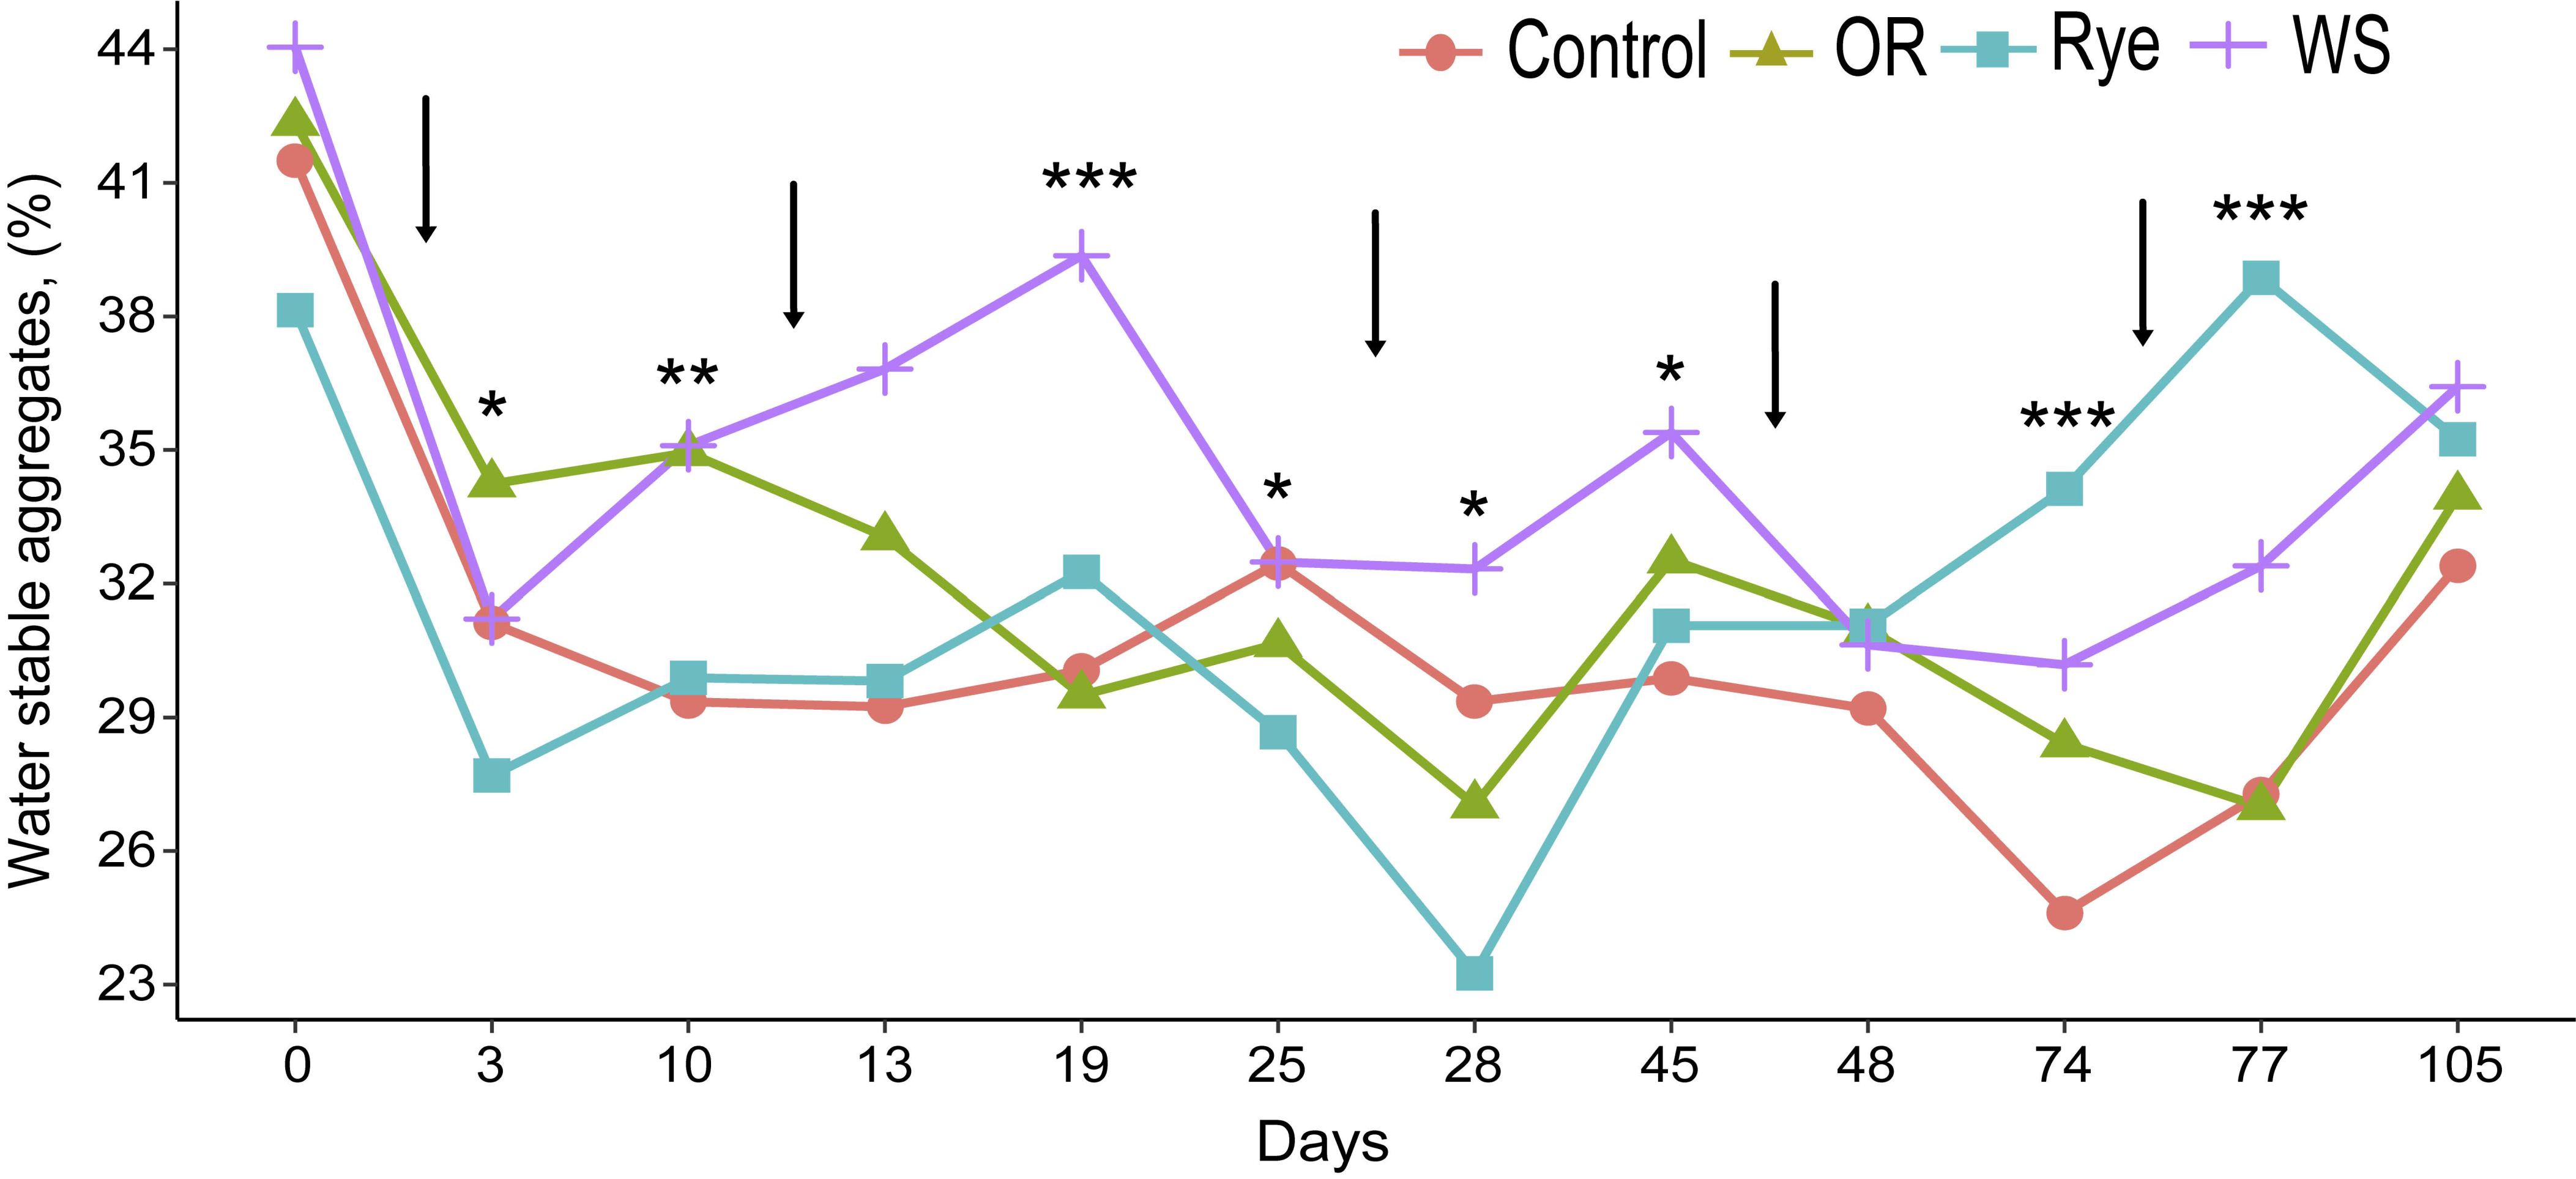
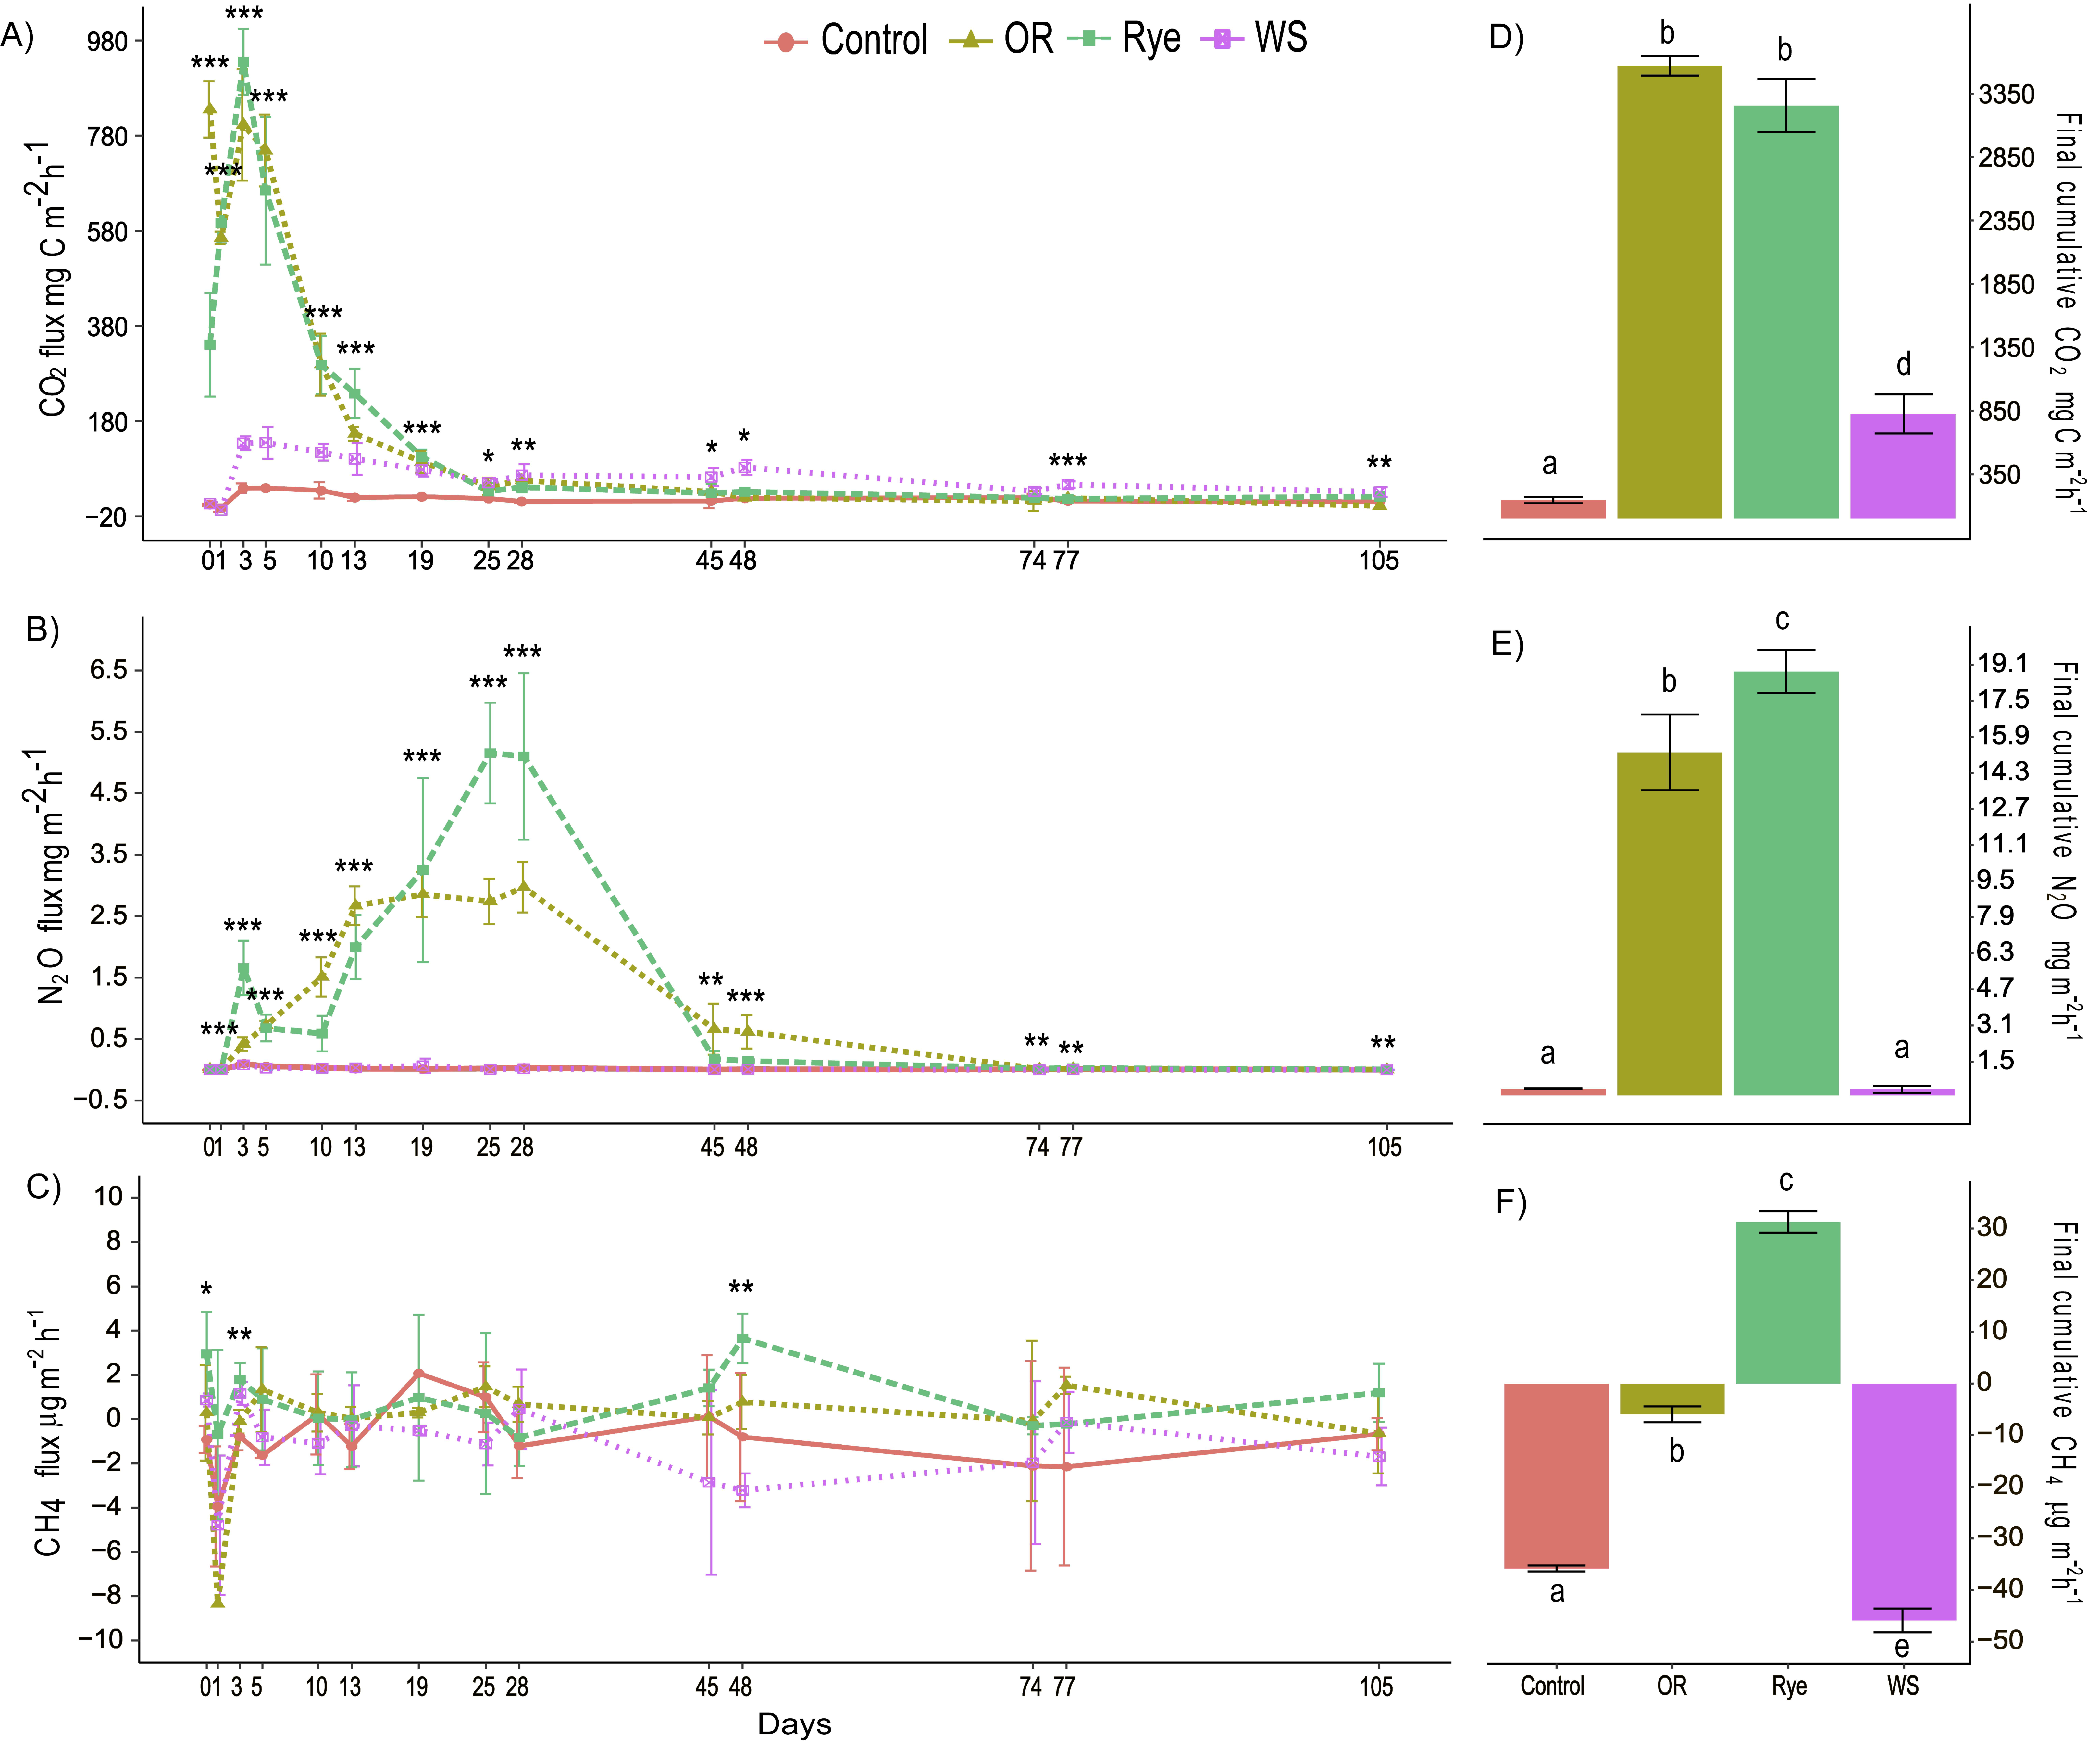
In this study, it was hypothesized that low aggregate stability is related to the high decomposition rates of ‘young’ organic matter. Both rye and oilseed rape had high decomposition rates at the beginning of incubation, which resulted in a flush of CO2 and N2O emission, even before water addition (on the first day) (Figure 3A,B). The high CO2 emissions and decomposition rates in rye and oilseed rape treatments are in agreement with Ghimire et al. [38], who showed that crop residues with a higher labile fraction generate a higher CO2 efflux. The period of the highest CO2 emissions rate occurred during the first 10 days of incubation (Figure 3A). After Day 10, the CO2 emissions started to slow down in all the treatments with crop residues. Thus, starting from Day 10, the aggregate stability in the rye and wheat straw treatments increased for a short period. In the oilseed rape treatment, the aggregate stability declined after 10 days. Furthermore, wheat straw with a lower decomposition rate and CO2 emissions had higher aggregate stability from Day 10 to 19 compared with rye and oilseed rape treatments. In this study, no significant correlation between the soil aggregate stability and CO2 emissions was found. However, other studies suggest that the higher the aggregate stability is, the higher the CO2 emissions might be [39,40]. That can happen due to higher C concentrations inside the stable aggregates. The increase in N2O emissions was significantly influenced by the decrease in aggregate stability (Table 6). The result is in line with previous literature [41] showing that aggregates disruption can serve as spots of N2O emissions. In the rye treatment, the highest N2O fluxes were observed from Day 19 to Day 28 of the incubation period (Figure 3B).
Meanwhile, the aggregate stability in this treatment decreased starting from Day 25 (Figure 2). In the oilseed rape treatment, the highest N2O emissions correspond to the period between Days 13 and 28 (Figure 3B). By contrast, aggregate stability for this period, compared with Day 10, decreased to even lower values (Figure 2). The more advanced the decomposition stage, the more organic matter is decomposed, which makes the organic matter become more porous and retain more water [42]. During the 28 days of incubation, three water additions were made according to the gravimetric field capacity of the soil and the weight of the pots after the first water addition. The decomposed organic matter increased the retention capacity of the soil mass. Additionally, this influenced the high amount of N2O emissions because conditions favorable for the denitrification process were created by increasing the water content. Kravchenko et al. [43] confirmed that crop residues tend to increase water content by absorbing water from the soil and increasing N2O emissions.
Overall, the observed remaining C in the soil proved to have a significant positive influence on soil aggregate stability (Table 6). After 28 days of incubation, the decomposition rates slowed down; consequently, less carbon was flushed from the soil leaving, in turn, a more stable fraction in the soil, which resulted in an increase in aggregate stability after 28 days of incubation for the rye and wheat straw treatments.
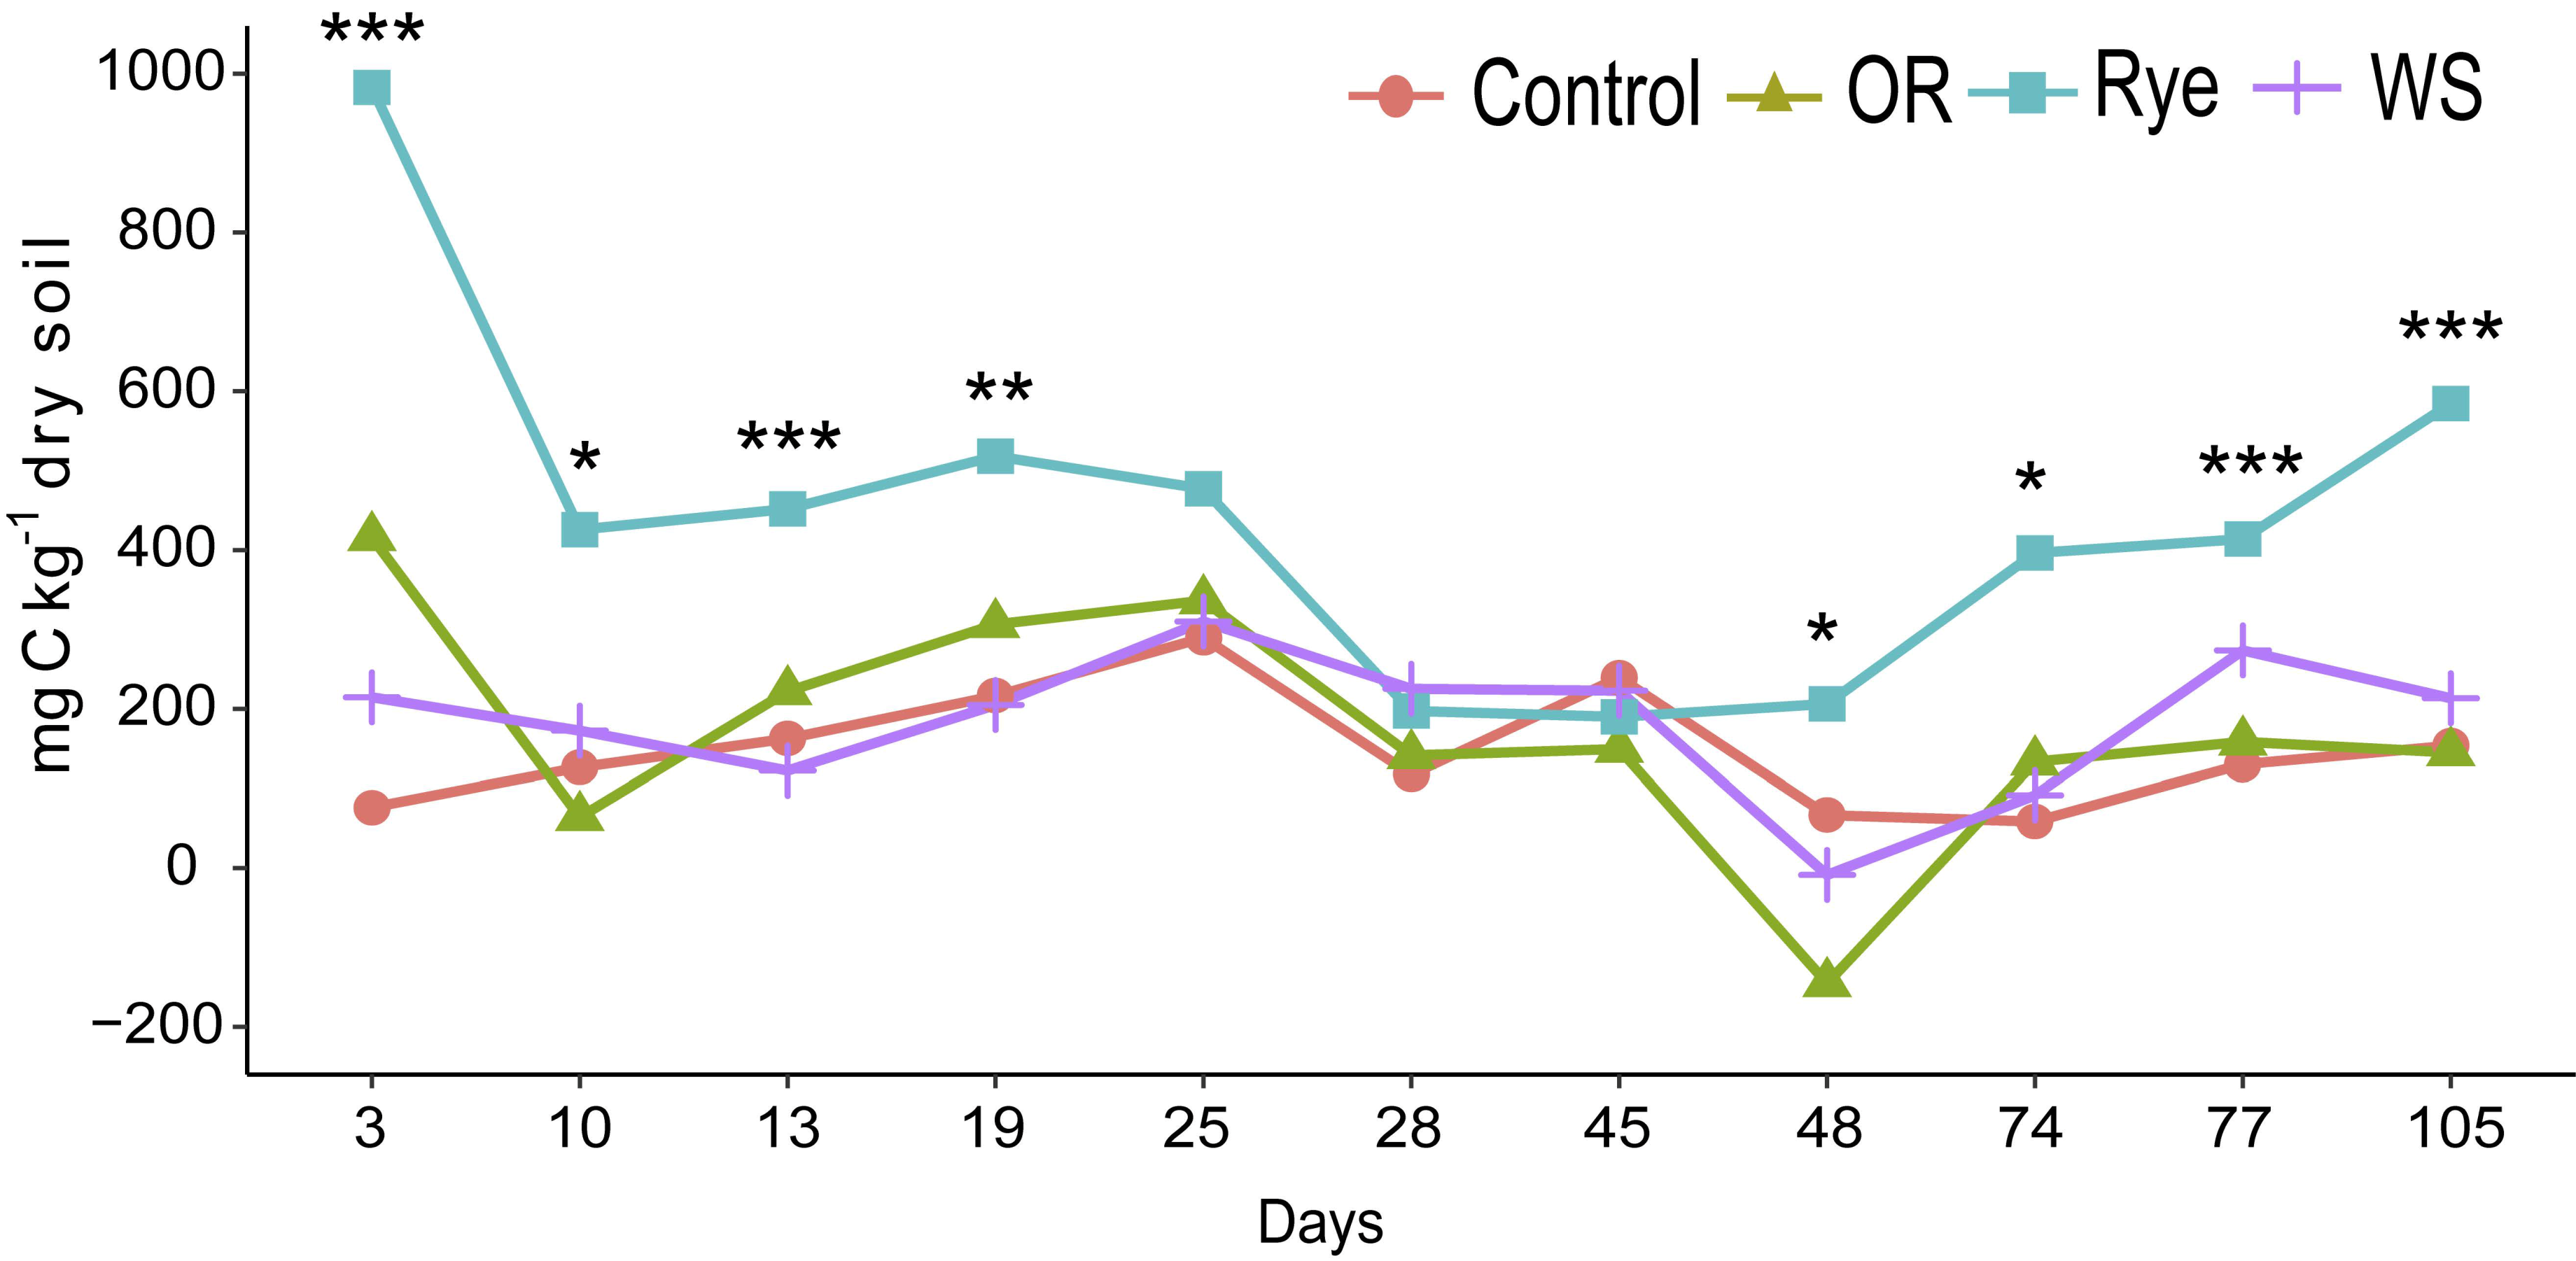
Slower decomposition rates generate slower microbial activity which, in the long term, stabilizes the soil organic matter inside the aggregates [44]. At the same time, a slower decomposition rate occurs with less decomposable compounds (cellulose, lignin, lipids, etc.). This could explain the increase in MBC (Figure 4) and aggregate stability (Figure 2) after 48 days of rye and wheat straw treatment. Besides the chemical composition of crop residues, which influences the decomposition rates, the soil moisture and temperature are two important factors that can speed up decomposition [45]. Soil moisture positively influenced the N2O emissions and CH4. The present finding also supports Schaufler et al. [46], who concluded that soil moisture positively influences nitrous oxide and methane emissions. In our research, the link between soil moisture and CO2 emissions was negative.
Schaufler et al. found that CO2 emissions are higher at an intermediate soil moisture content, which is in agreement with our findings showing that CO2 emissions are lower at higher moisture contents and lower temperatures. Regarding methane emissions, only the rye treatment had positive cumulative emissions, which could be explained by the creation of anaerobic hotspots by microorganisms that consume oxygen during intense activity.
In this study, soil moisture served as a trigger for the decrease in soil aggregate stability (Table 6). The disruption of aggregates occurs as a result of the water addition procedure. The results from stepwise regression analysis show that soil moisture or soil electric conductivity can serve as significant predictor variables for soil aggregate stability in all treatments. Both rye and oilseed rape treatments had higher soil electric conductivity (see Figure S1) and higher crop residue TN (Table 2). Soil electric conductivity was also positively correlated with N2O emissions and soil moisture (Table 6). Thus, it can be concluded that a higher soil moisture content increases the soil electrical conductivity and N2O emissions, and indirectly influences soil aggregate stability. The negative correlation between aggregate stability and soil moisture was previously confirmed by Perfect et al. [47]. The decrease of aggregate stability after wetting may be related to the presence of entrapped air inside the aggregates, which triggers aggregate slaking [48].
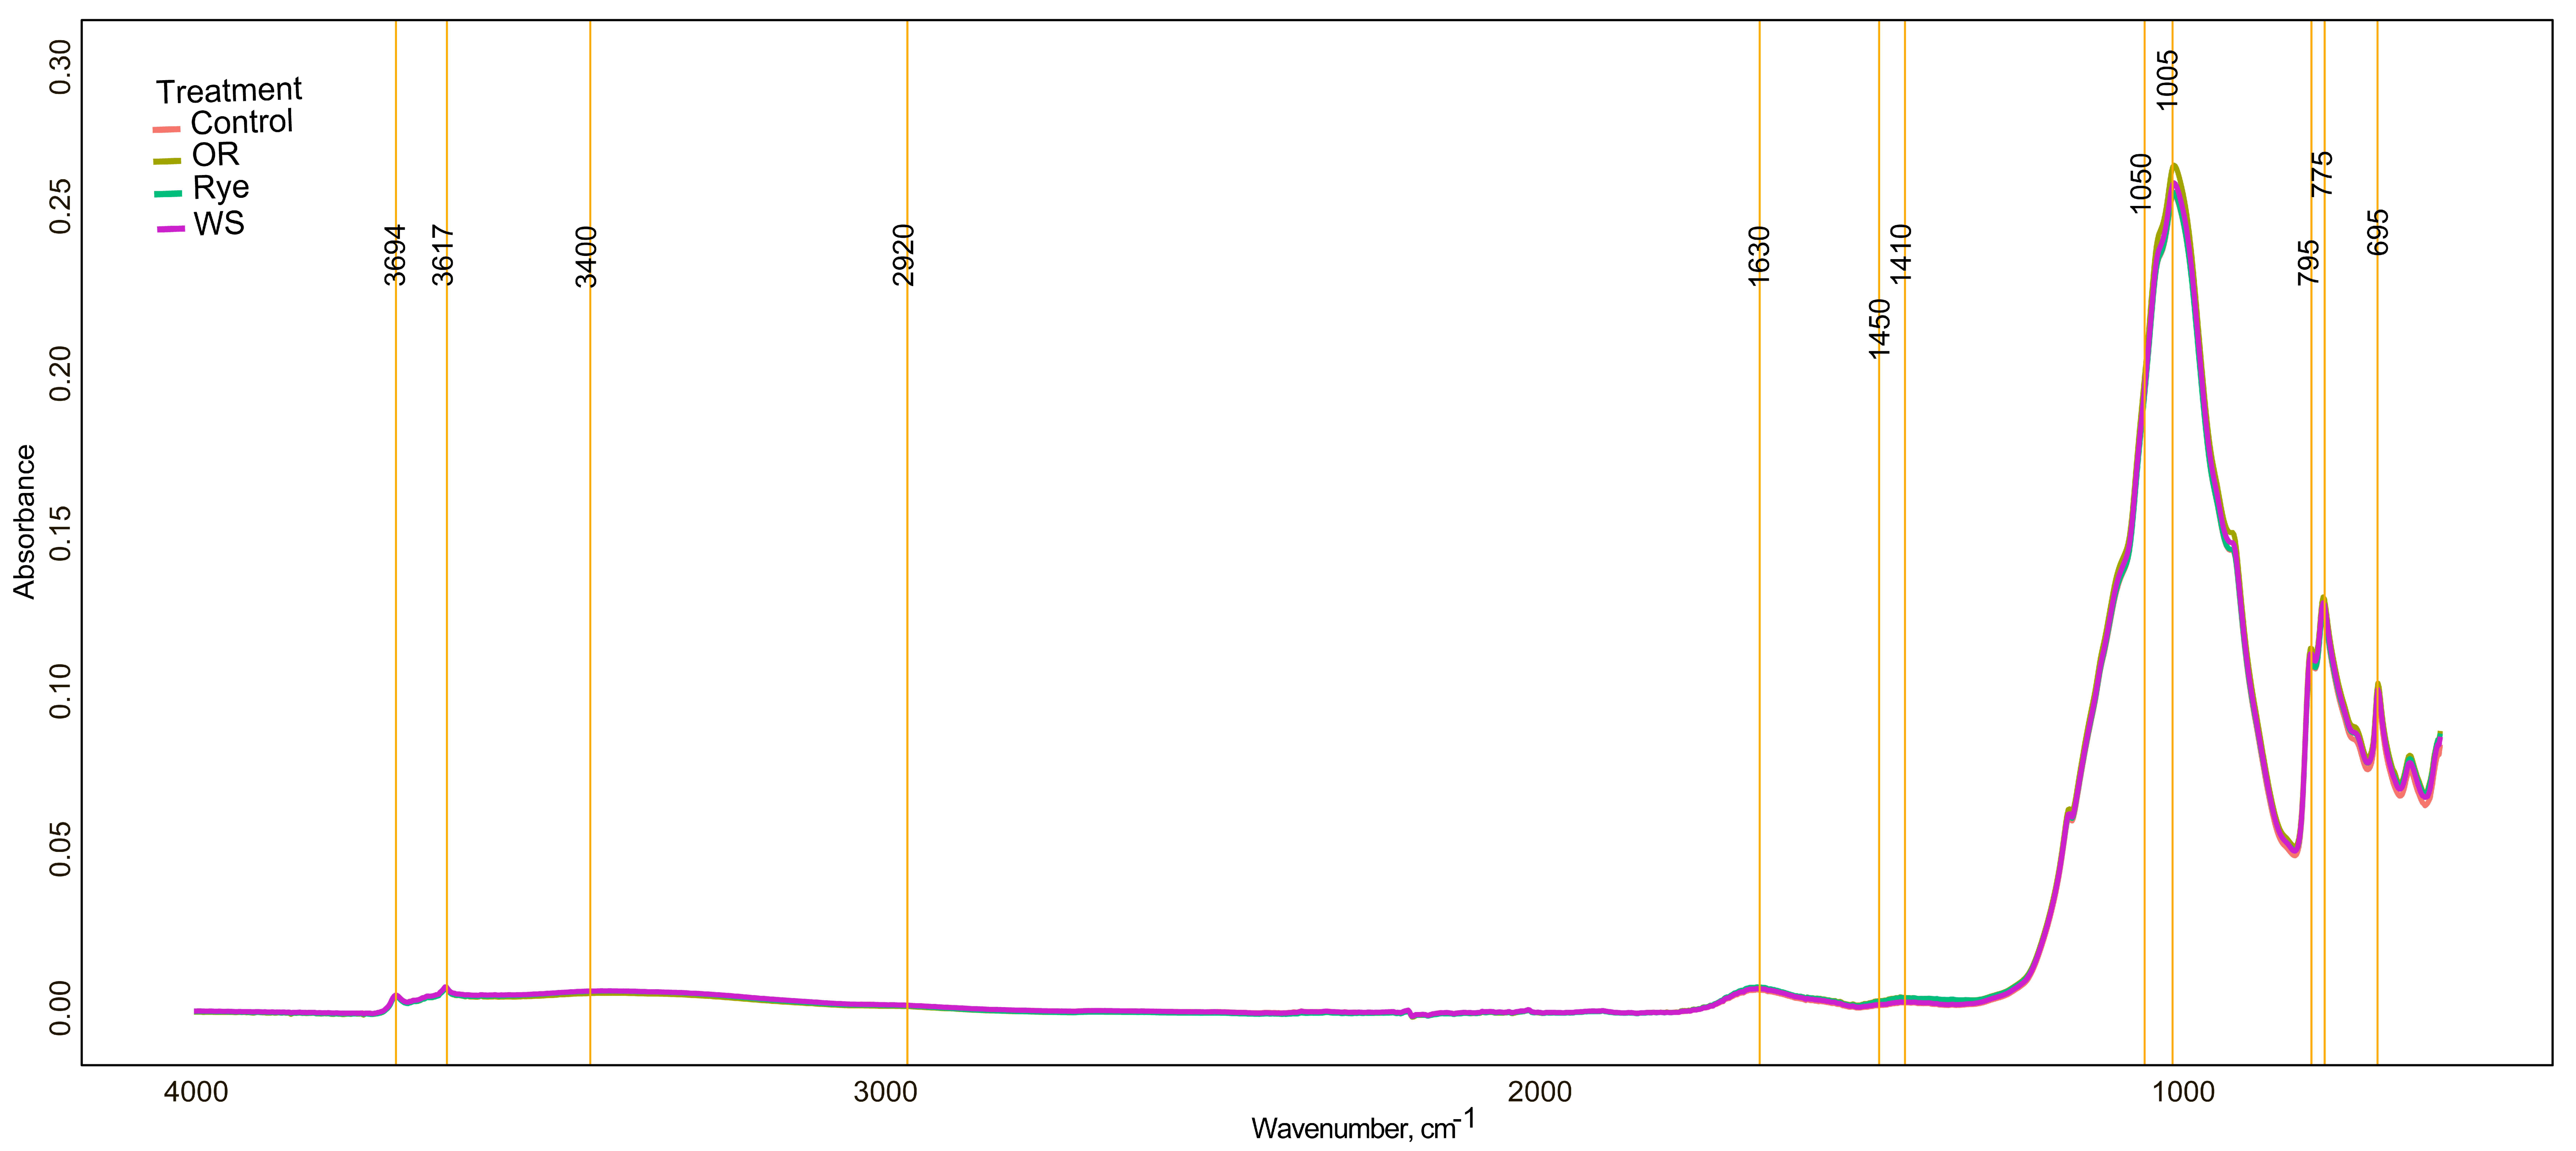
The incorporation of crop residues had a significant effect on the soil functional groups (Table 3). This is the result of differences in the functional groups of crop residues analyzed by FTIR (see Figure S2). Thus, the incorporation of crop residues in soil increased the levels of amide I group or protein compounds (1630 cm−1) in the soil mixed with rye residues (Table 4). The peak responsible for carbohydrates and the amide III group at 1410 cm−1 also showed an increase due to the incorporation of rye and oilseed rape residues. Only wheat straw treatment did not have a significant effect on soil functional groups. This was probably due to the duration of the experiment, since the biochemical compounds in the wheat require a longer time to decompose.
The small changes in the relative absorbance of peaks at 1630 and 1410 cm−1 in the rye and oilseed rape treatments did not appear to have any effect on aggregate stability as no significant correlation was found (Table 6). Stepwise regression analysis identified two treatments (rye and wheat straw) in which soil functional group changes influenced aggregate stability (Table 7). In the wheat straw treatment, the aliphatic group (2920 cm−1) had a positive influence on the soil aggregate stability. This can be directly correlated with the decomposition of the labile fraction from wheat straw at the beginning of the experiment and the high total carbon content of the crop residue. Demyan et al. [27] specified that the aliphatic group could result from the increase in labile organic matter.
Meanwhile, in the rye treatment, the aggregate stability was significantly influenced by the carbohydrates/amide III group represented by the 1410 cm−1 peak (Table 7). This is based on the significantly higher relative absorbance of this peak (Table 4) in the rye treatment. However, this compound is also influenced considerably by the TN and TC content in soil (Table 6), which proved to be significantly higher in the rye treatment compared to other treatments.

5. Conclusions

This study examined the short-term effects of cover crop residue addition on water-stable aggregates in soil. The chemical composition of organic matter was demonstrated to play an essential role in increasing the levels of water-stable aggregates. The decomposition rates of different types of organic matter were highly dependent on their C/N ratio. The lower C/N ratio in rye and oilseed rape residues resulted in higher decomposition rates. Residues with a low C/N ratio were associated with higher CO2 and N2O emissions. The high decomposition rates of crop residues and water addition in the early stages of incubation each led to a significant decrease in aggregate stability. The addition of the crop residues had a short transient effect on the soil aggregate stability. The degree of soil moisture negatively affected aggregate stability in untreated field soil as well as in soil with added rye, oilseed rape, or wheat straw. The results also show that a higher amount of remaining C in the soil can positively influence soil aggregate stability. General correlation analysis between soil biochemical compounds and soil aggregate stability did not show any significant relationships, although stepwise regression analysis showed that aliphatic compounds (2920 cm−1) and the carbohydrates/amide III group (1410 cm−1) from the wheat straw and rye treatments, respectively, can significantly influence the aggregate stability.
Further study is needed to fully understand the relationship between soil moisture and the water retention capacity of crop residues and influence on aggregate stability. However, it is also essential that future studies characterize the addition rates of crop residue that can improve aggregate stability, irrespective of soil moisture content and decomposition rates.

Supplementary Materials

The following are available online at https://www.mdpi.com/2077-0472/10/11/527/s1, Figure S1: The evolution of soil moisture (a), electrical conductivity (b) and soil temperature (c) (mean and ± standard error) in each of four treatment conditions: soil only (Control), soil mixed with oilseed rape residues (OR), soil mixed with rye residues (Rye), soil mixed with wheat straw (WS), over a 105-day incubation period. Stars indicate significant differences between treatments within the same day according to one-way ANOVA (* p < 0.05, ** p < 0.01, and *** p < 0.001), Figure S2: FT-IR spectra of the crop residues incorporated in the soil.

Author Contributions

Conceptualization, E.R. and T.T.; methodology, E.R., G.S., J.E.-G. and T.T.; validation, E.R.; formal analysis, G.S., K.K. and K.S.; resources, E.R. and A.A.; data curation, J.E.-G. and G.S.; writing—original draft, G.S.; writing—review and editing, J.E.-G., K.S., K.K., E.R. and A.A.; visualization, G.S.; supervision, E.R. and T.T.; project administration, E.R.; funding acquisition, E.R. and A.A. All authors have read and agreed to the published version of the manuscript.

Funding

The research was funded by the European Union’s European Regional Development Fund (Estonian University of Life Sciences ASTRA project [2014-2020.4.01.16-0036] “Value-chain based bio-economy”) and the Horizon 2020 project iSQAPER [project number 635750].

Acknowledgments

We would like to thank our colleagues Imbi Albre and Raja Kährik for analyzing the initial soil chemical properties.

Conflicts of Interest

The authors declare no conflict of interest.

References

  1. Tisdall, J.M.; Oades, J.M. Organic matter and water-stable aggregates in soils. J. Soil Sci. 1982, 33, 141–163. [Google Scholar] [CrossRef]
  2. Abiven, S.; Menasseri, S.; Angers, D.A.; Leterme, P. Dynamics of aggregate stability and biological binding agents during decomposition of organic materials. Eur. J. Soil Sci. 2007, 58, 239–247. [Google Scholar] [CrossRef]
  3. Liu, A.; Ma, B.L.; Bomke, A.A. Effects of Cover Crops on Soil Aggregate Stability, Total Organic Carbon, and Polysaccharides. Soil Sci. Soc. Am. J. 2005, 69, 2041–2048. [Google Scholar] [CrossRef]
  4. Angst, G.; Mueller, K.E.; Kögel-Knabner, I.; Freeman, K.H.; Mueller, C.W. Aggregation controls the stability of lignin and lipids in clay-sized particulate and mineral associated organic matter. Biogeochemistry 2017, 132, 307–324. [Google Scholar] [CrossRef]
  5. Abiven, S.; Menasseri, S.; Chenu, C. The effects of organic inputs over time on soil aggregate stability-A literature analysis. Soil Biol. Biochem. 2009, 41, 1–12. [Google Scholar] [CrossRef]
  6. Shahbaz, M.; Kuzyakov, Y.; Sanaullah, M.; Heitkamp, F.; Zelenev, V.; Kumar, A.; Blagodatskaya, E. Microbial decomposition of soil organic matter is mediated by quality and quantity of crop residues: Mechanisms and thresholds. Biol. Fertil. Soils 2017, 53, 287–301. [Google Scholar] [CrossRef]
  7. Sarker, T.C.; Incerti, G.; Spaccini, R.; Piccolo, A.; Mazzoleni, S.; Bonanomi, G. Linking organic matter chemistry with soil aggregate stability: Insight from13C NMR spectroscopy. Soil Biol. Biochem. 2018, 117, 175–184. [Google Scholar] [CrossRef]
  8. Mizuta, K.; Taguchi, S.; Sato, S. Soil aggregate formation and stability induced by starch and cellulose. Soil Biol. Biochem. 2015, 87, 90–96. [Google Scholar] [CrossRef]
  9. Dungait, J.A.J.; Hopkins, D.W.; Gregory, A.S.; Whitmore, A.P. Soil organic matter turnover is governed by accessibility not recalcitrance. Glob. Chang. Biol. 2012, 18, 1781–1796. [Google Scholar] [CrossRef]
  10. Parr, J.F.; Papendick, R.I. Factors Affecting the Decomposition of Crop Residues by Microorganisms. Crop Residue Manag. Syst. 2015, 31, 101–129. [Google Scholar]
  11. Cosentino, D.; Chenu, C.; Le Bissonnais, Y. Aggregate stability and microbial community dynamics under drying-wetting cycles in a silt loam soil. Soil Biol. Biochem. 2006, 38, 2053–2062. [Google Scholar] [CrossRef]
  12. Macrae, R.J.; Mehuys, G.R. The effect of green manuring on the physical properties of temperate-area soils. Adv. Soil Sci. 1985, 3, 71–94. [Google Scholar] [CrossRef]
  13. Blanco-Canqui, H.; Shaver, T.M.; Lindquist, J.L.; Shapiro, C.A.; Elmore, R.W.; Francis, C.A.; Hergert, G.W. Cover Crops and Ecosystem Services: Insights from Studies in Temperate Soils. Agron. J. 2015, 107, 2449. [Google Scholar] [CrossRef] [Green Version]
  14. Coppens, F.; Garnier, P.; De Gryze, S.; Merckx, R.; Recous, S. Soil moisture, carbon and nitrogen dynamics following incorporation and surface application of labelled crop residues in soil columns. Eur. J. Soil Sci. 2006, 57, 894–905. [Google Scholar] [CrossRef]
  15. Chahal, I.; Van Eerd, L.L. Cover crop and crop residue removal effects on temporal dynamics of soil carbon and nitrogen in a temperate, humid climate. PLoS ONE 2020, 15, e0235665. [Google Scholar] [CrossRef]
  16. Muhammad, I.; Wang, J.; Sainju, U.M.; Zhang, S.; Zhao, F.; Khan, A. Cover cropping enhances soil microbial biomass and affects microbial community structure: A meta-analysis. Geoderma 2021, 381, 114696. [Google Scholar] [CrossRef]
  17. Sánchez de Cima, D.; Tein, B.; Eremeev, V.; Luik, A.; Kauer, K.; Reintam, E.; Kahu, G. Winter cover crop effects on soil structural stability and microbiological activity in organic farming. Biol. Agric. Hortic. 2015, 8765, 1–12. [Google Scholar] [CrossRef]
  18. Balesdent, J.; Chenu, C.; Balabane, M. Relationship of soil organic matter dynamics to physical protection and tillage. Soil Tillage Res. 2000, 53, 215–230. [Google Scholar] [CrossRef]
  19. Denef, K.; Six, J.; Bossuyt, H.; Frey, S.D.; Elliott, E.T.; Merckx, R.; Paustian, K. In fluence of dry-wet cycles on the interrelationship between aggregate, particulate organic matter, and microbial community dynamics. Soil Tillage Res. 2001, 33, 1599–1611. [Google Scholar] [CrossRef]
  20. Kemper, W.D.; Rosenau, R.C. Aggregate Stability and Size Distribution. In Methods of Soil Analysis, Part 1—Physical and Mineralogical Methods; Wiley Online Library: Hoboken, NJ, USA, 1986; Volume 9, pp. 425–442. ISBN 978-0891188414. [Google Scholar]
  21. Hutchinson, G.L.; Livingston, G.P. Use of chamber sytems to measure trace gas fluxes. Agric. Ecosyst. Eff. Trace Gases Glob. Clim. Chang. 1993, 55, 63–78. [Google Scholar]
  22. Escuer-Gatius, J.; Shanskiy, M.; Soosaar, K.; Astover, A.; Raave, H. High-temperature hay biochar application into soil increases N2O fluxes. Agronomy 2020, 10, 109. [Google Scholar] [CrossRef] [Green Version]
  23. Loftfield, N.; Flessa, H.; Augustin, J.; Beese, F. Automated Gas Chromatographic System for Rapid Analysis of the Atmospheric Trace Gases Methane, Carbon Dioxide, and Nitrous Oxide. J. Environ. Qual. 1997, 26, 560–564. [Google Scholar] [CrossRef]
  24. Fließbach, A.; Mäder, P. Microbial biomass and size-density fractions differ between soils of organic and conventional agricultural systems. Soil Biol. Biochem. 2000, 32, 757–768. [Google Scholar] [CrossRef]
  25. Gerzabek, M.H.; Antil, R.S.; Kögel-Knabner, I.; Knicker, H.; Kirchmann, H.; Haberhauer, G. How are soil use and management reflected by soil organic matter characteristics: A spectroscopic approach. Eur. J. Soil Sci. 2006, 57, 485–494. [Google Scholar] [CrossRef] [Green Version]
  26. Bernier, M.H.; Levy, G.J.; Fine, P.; Borisover, M. Organic matter composition in soils irrigated with treated wastewater: FT-IR spectroscopic analysis of bulk soil samples. Geoderma 2013, 209, 233–240. [Google Scholar] [CrossRef]
  27. Demyan, M.S.; Rasche, F.; Schulz, E.; Breulmann, M.; Müller, T.; Cadisch, G. Use of specific peaks obtained by diffuse reflectance Fourier transform mid-infrared spectroscopy to study the composition of organic matter in a Haplic Chernozem. Eur. J. Soil Sci. 2012, 63, 189–199. [Google Scholar] [CrossRef]
  28. Parolo, M.E.; Savini, M.C.; Loewy, R.M. Characterization of soil organic matter by FT-IR spectroscopy and its relationship with chlorpyrifos sorption. J. Environ. Manag. 2017, 196, 316–322. [Google Scholar] [CrossRef]
  29. Toosi, E.R.; Kravchenko, A.N.; Mao, J.; Quigley, M.Y.; Rivers, M.L. Effects of management and pore characteristics on organic matter composition of macroaggregates: Evidence from characterization of organic matter and imaging. Eur. J. Soil Sci. 2017, 68, 200–211. [Google Scholar] [CrossRef]
  30. Baumann, K.; Schöning, I.; Schrumpf, M.; Ellerbrock, R.H.; Leinweber, P. Rapid assessment of soil organic matter: Soil color analysis and Fourier transform infrared spectroscopy. Geoderma 2016, 278, 49–57. [Google Scholar] [CrossRef]
  31. Tatzber, M.; Mutsch, F.; Mentler, A.; Leitgeb, E.; Englisch, M.; Zehetner, F.; Djukic, I.; Gerzabek, M.H. Mid-infrared spectroscopy for topsoil layer identification according to litter type and decompositional stage demonstrated on a large sample set of Austrian forest soils. Geoderma 2011, 166, 162–170. [Google Scholar] [CrossRef]
  32. Poirier, N.; Sohi, S.P.; Gaunt, J.L.; Mahieu, N.; Randall, E.W.; Powlson, D.S.; Evershed, R.P. The chemical composition of measurable soil organic matter pools. Org. Geochem. 2005, 36, 1174–1189. [Google Scholar] [CrossRef]
  33. Johnson, J.M.F.; Barbour, N.W.; Weyers, S.L. Chemical composition of crop biomass impacts its decomposition. Soil Sci. Soc. Am. J. 2007, 71, 155–162. [Google Scholar] [CrossRef] [Green Version]
  34. Vinzent, B.; Fuß, R.; Maidl, F.X.; Hülsbergen, K.J. N2O emissions and nitrogen dynamics of winter rapeseed fertilized with different N forms and a nitrification inhibitor. Agric. Ecosyst. Environ. 2018, 259, 86–97. [Google Scholar] [CrossRef]
  35. Barel, J.M.; Kuyper, T.W.; Paul, J.; de Boer, W.; Cornelissen, J.H.C.; De Deyn, G.B. Winter cover crop legacy effects on litter decomposition act through litter quality and microbial community changes. J. Appl. Ecol. 2019, 56, 132–143. [Google Scholar] [CrossRef]
  36. Jama, B.A.; Nair, P.K.R. Decomposition- and nitrogen-mineralization patterns of Leucaena leucocephala and Cassia siamea mulch under tropical semiarid conditions in Kenya. Plant Soil 1996, 179, 275–285. [Google Scholar] [CrossRef]
  37. Ajwa, H.A.; Tabatabai, M.A. Decomposition of different organic materials in soils. Biol. Fertil. Soils 1994, 18, 175–182. [Google Scholar] [CrossRef]
  38. Ghimire, B.; Ghimire, R.; VanLeeuwen, D.; Mesbah, A. Cover Crop Residue Amount and Quality Effects on Soil Organic Carbon Mineralization. Sustainability 2017, 9, 2316. [Google Scholar] [CrossRef] [Green Version]
  39. Chaplot, V.; Cooper, M. Soil aggregate stability to predict organic carbon outputs from soils. Geoderma 2015, 243, 205–213. [Google Scholar] [CrossRef]
  40. Gispert, M.; Emran, M.; Pardini, G.; Doni, S.; Ceccanti, B. The impact of land management and abandonment on soil enzymatic activity, glomalin content and aggregate stability. Geoderma 2013, 202, 51–61. [Google Scholar] [CrossRef]
  41. Ball, B.C. Soil structure and greenhouse gas emissions: A synthesis of 20 years of experimentation. Eur. J. Soil Sci. 2013, 64, 357–373. [Google Scholar] [CrossRef]
  42. Iqbal, A.; Beaugrand, J.; Garnier, P.; Recous, S. Tissue density determines the water storage characteristics of crop residues. Plant Soil 2013, 367, 285–299. [Google Scholar] [CrossRef] [Green Version]
  43. Kravchenko, A.N.; Toosi, E.R.; Guber, A.K.; Ostrom, N.E.; Yu, J.; Azeem, K.; Rivers, M.L.; Robertson, G.P. Hotspots of soil N2O emission enhanced through water absorption by plant residue. Nat. Geosci. 2017, 10, 496–500. [Google Scholar] [CrossRef]
  44. Golchin, A.; Oades, J.M.; Skjemstad, J.O.; Clarke, P. Soil structure and carbon cycling. Soil Res. 1994, 32, 1043–1068. [Google Scholar] [CrossRef]
  45. Kauer, K.; Raave, H.; Köster, T.; Viiralt, R.; Noormets, M.; Keres, I.; Laidna, T.; Parol, A.; Selge, A. The decomposition of turfgrass clippings is fast at high air humidity and moderate temperature. Acta Agric. Scand. Sect. B Soil Plant Sci. 2012, 62, 224–234. [Google Scholar] [CrossRef]
  46. Schaufler, G.; Schindlbacher, A.; Skiba, U.; Kitzler, B.; Zechmeister-Boltenstern, S.; Sutton, M.A. Greenhouse gas emissions from European soils under different land use: Effects of soil moisture and temperature. Eur. J. Soil Sci. 2010, 61, 683–696. [Google Scholar] [CrossRef]
  47. Perfect, E.; Kay, B.D.; Van Loon, W.K.P.; Sheard, R.W.; Pojasok, T. Factors influencing soil structural stability within a growing season. Soil Sci. Soc. Am. J. 1990, 54, 173–179. [Google Scholar] [CrossRef]
  48. Hillel, D. Soil Physical Attributes. Soil Environ. 2008, 55–77. [Google Scholar] [CrossRef]
Figure 1. Average FTIR spectra obtained from analyses of the soil in each of four treatment conditions over a 105-day incubation period: soil only (Control), soil mixed with oilseed rape residues (OR), soil mixed with rye residues (Rye), and soil mixed with wheat straw (WS).
Agriculture 10 00527 g001
Figure 2. The evolution of water-stable aggregates in each of four treatment conditions over a 105-day incubation period: soil only (Control), soil mixed with oilseed rape residues (OR), soil mixed with rye residues (Rye), and soil mixed with wheat straw (WS). Arrows indicate the water addition events. Stars indicate significant differences between treatments within the same day according to one-way ANOVA (* p < 0.05, ** p < 0.01, and *** p < 0.001).
Agriculture 10 00527 g002
Figure 3. Evolution of CO2 (A), N2O (B), and CH4 (C) flux (mean ± standard error) and average final cumulative flux in each of four treatment conditions over a 105-day incubation period (D), (E), (F): soil only (Control), soil mixed with oilseed rape residues (OR), soil mixed with rye residues (Rye), and soil mixed with wheat straw (WS). Stars indicate significant differences between treatments within the same day according to one-way ANOVA (* p < 0.05, ** p < 0.01, and *** p < 0.001). The different letters represent significant differences between treatments according to Tukey’s HSD test.
Agriculture 10 00527 g003
Figure 4. The microbial biomass carbon (MBC) evolution in each of four treatment conditions over a 105-day incubation period: soil only (Control), soil mixed with oilseed rape residues (OR), soil mixed with rye residues (Rye), and soil mixed with wheat straw (WS). Stars indicate significant differences between treatments within the same day according to one-way ANOVA (* p < 0.05, ** p < 0.01, and *** p < 0.001).
Agriculture 10 00527 g004
Table 1. Initial physicochemical properties of the soil used in the incubation experiment.
pHKClTCTNPKMgCaCECParticles Content, %
g kg−1meq 100 g−1 >0.063<0.0020.002–0.063
5.714.81.230.127.643.1191.39.557.410.332.3
Table 2. Initial chemical properties of plant residues.
Crop ResiduesTotal C, g C kg−1Total N, g N kg−1C/NDry Matter, g kg−1
Oilseed rape4244110153
Wheat straw451598796
Rye4293612194
Table 3. Results of two-way ANOVA for the effect of treatment, days, and the interaction of treatment by days for each parameter: soil moisture (SM), soil temperature (Temp.), electrical conductivity (EC), water-stable aggregates (WSA), microbial biomass carbon (MBC), total nitrogen (TN), and total carbon (TC); P1005: relative absorbance of the FTIR peak for silicates and clay minerals as well as C–O–C stretching in polysaccharides; P1410: relative absorbance of the FTIR peak for C–O bond vibrations and also the vibrations in C–N (amide III); P1630: relative absorbance of the FTIR peak for the aromatic C = C and C = O vibrations of amide I groups; P2920: relative absorbance of the FTIR peak for asymmetric C–H vibration of aliphatic compounds.
ParametersTreatmentDaysTreatment × Days
F ValuePF ValuePF ValueP
N2O (µg m−2 h−1)264.2390.000 ***76.9970.000 ***33.7150.000 ***
CO2 (mg m−2 h−1)660.9490.000 ***237.6620.000 ***89.5380.000 ***
CH4 (µg m−2 h−1)3.9360.005 **3.1720.000 ***0.8730.708
SM (m−3 m−3)442.6890.000 ***103.5430.000 ***6.8660.000 ***
Temp. (°C)149.7010.000 ***1859.0100.000 ***78.6810.000 ***
EC (mS cm−1)918.8840.000 ***98.9490.000 ***30.4980.000 ***
WSA (%)13.3250.000 ***10.2910.000 ***3.5550.000 ***
MBC (mg C kg−1)99.6880.000 ***12.7860.000 ***4.5640.000 ***
TN (%)1547.0480.000 ***2.8320.000 ***1.4140.036 *
TC (%)2158.9790.000 ***0.7250.7581.0030.477
P2920 (%)2.1510.0952.6570.1040.5980.617
P1630 (%)3.5490.015 *20.2960.000 ***5.6400.001 **
P1410 (%)55.1690.000 ***4.5340.034 *3.1630.025 *
P1005 (%)14.6940.000 ***8.6010.003 **2.6140.052
* p < 0.05, ** p < 0.01, and *** p < 0.001.
Table 4. Differences in relative absorbance (%) from the FTIR spectra (mean ± standard error) in different treatment conditions: Control, OR (soil mixed with oilseed rape residues), Rye (soil mixed with rye residues), and WS (soil mixed with wheat straw residues), at Day 0 (before residue incorporation) and at Day 105.
Treatment2920163014101005
Day 0
Control0.00 (±0.00) a *2.55 (±0.08) a0.55 (±0.04) a96.91 (±0.10) a
Rye0.00 (±0.00) a2.68 (±0.07) a0.27 (±0.07) c97.06 (±0.12) a
WS0.16 (±0.07) a2.61 (±0.10) a0.43 (±0.04) ac96.80 (±0.17) a
OR0.16 (±0.09) a2.78 (±0.08) a0.45 (±0.01) a96.61 (±0.11) a
105 days
Control0.20 (±0.06) a2.78 (±0. 05) a0.51 (±0.05) a96.52 (±0.11) a
Rye0.20 (±0.06) a3.59 (±0. 08) b ** ↑0.74 (±0.06) c ↑95.47 (±0.15) c ↓
WS0.14 (±0.06) a2.77 (±0. 05) a0.42 (±0.01) a96.67 (±0.06) a
OR0.14 (±0.06) a2.63 (±0.05) a0.80 (±0.03) c ↑96.43 (±0.08) a
* The different letters indicate the significant difference between the treatments on specific days, according to Tukey’s comparison test. ** Arrows indicate a significant decrease or increase in relative absorbance within each treatment as compared to the initial values at Day 0 according to Tukey’s comparison test.
Table 5. Observed remaining carbon (C) in soil with added crop residues after 105 days of incubation, and kinetic coefficients calculated from the double exponential model (Equation (3)). Values in the brackets are standard errors of the mean (n = 3). Soil mixed with wheat straw (WS), soil mixed with fresh green oilseed rape residues (OR), and soil mixed with fresh green rye residues (Rye).
TreatmentObserved Remaining CCa *Cp *ka *kp *
%%%%C d−1 × 10²%C d−1 × 10⁴
WS71.19 (±4.73)27.03 (±6.67)72.97 (±6.67)0.7 (±0.00)−32.9 (±0.00)
OR58.04 (±0.95)38.38 (±0.26)61.62 (±0.26)13.2 (±0.00)5.7 (±0.00)
Rye60.77 (±2.18)39.23 (±2.39)60.77 (±2.39)12.7 (±0.00)4.3 (±0.00)
* Ca: initial %C in the rapidly decomposing organic material; Cp: initial %C in the slow decomposing organic material; ka: decomposition rate of Ca; kp: decomposition rate of Cp.
Table 6. Correlation matrix between different parameters for all data (CO2: carbon dioxide emissions; N2O: nitrous oxide emissions; CH4: methane emissions; SM: soil moisture; Temp.: soil temperature; EC: electrical conductivity; WSA: water-stable aggregates; MBC: microbial biomass carbon; TN: total nitrogen; TC: total carbon; P1005: relative absorbance of the FTIR peak for silicates and clay minerals as well as C–O–C stretching in polysaccharides; P1410: relative absorbance of the FTIR peak for C–O bond vibrations and also the vibrations in C–N (amide III); P1630: relative absorbance of the FTIR peak for the aromatic C=C and C=O vibrations of amide I groups; P2920: relative absorbance of the FTIR peak for asymmetric C–H vibration of aliphatic compounds; Cremain: observed remaining carbon from crop residues in the soil after 105 days).
N2OCO2CH4SMTempECMBCWSATNTCP1005P1410P1630
CO2NS
CH4NSNS
SM0.3 ***−0.2 *0.2 *
TempNS0.2 *NS−0.6 ***
EC0.7 ***NS0.3 ***0.2 **−0.2 ***
MBC0.3 ***0.5 ***0.2 **NS−0.2 *NS
WSA−0.3 **NS−0.2 **−0.5 ***0.2 ***−0.3 ***NS
TN0.4 ***NS0.2 *NSNS0.7 ***0.2 **NS
TC0.4 ***0.2 *0.2 **NSNS0.4 ***0.4 ***NS0.7 ***
P1005−0.3 **NSNS−0.2 **0.4 **−0.3 ***−0.3 ***NS−0.4 ***−0.4 ***
P14100.4 **NSNSNSNS0.6 ***0.3 ***NS0.6 ***0.4 ***−0.7 ***
P1630NSNSNS0.2 **NS−0.2 **NSNS0.2 *0.2 ***−0.8 ***0.2 ***
P29200.3 *NSNS0.2 *−0.3 *0.3 *0.3 ***NSNS0.2 *−0.6 ***0.3 ***NS
Cremain−0.5 ***NS−0.3 ***−0.3 **NS−0.8 ***NS0.4 ***−0.8 ***−0.5 ***0.5 ***−0.8 ***NS
NS: not significant, * p < 0.05, ** p < 0.01, and *** p < 0.001.
Table 7. Results of stepwise multiple regression analysis showing the influence of different factors (N2O: nitrous oxide emissions; SM: soil moisture; Temp.: soil temperature; EC: electrical conductivity; MBC: microbial biomass carbon; TN: total nitrogen; TC: total carbon; P1005: relative absorbance of the FTIR peak for silicates and clay minerals as well as C–O–C stretching in polysaccharides; P1410: relative absorbance of the FTIR peak for C–O bond vibrations and also the vibrations in C–N (amide III); P2920: relative absorbance of the FTIR peak for asymmetric C–H vibration of aliphatic compounds) on water-stable aggregates within different treatments after 105 days.
Partial R2Model R2F-ValueP > F
Control
SM0.0690.06210.2020.057
EC0.1120.0998.6160.0091 **
TC0.2290.21213.4410.000 ***
N2O0.2460.22210.3620.0832
Rye
SM0.2680.24511.3710.0048 **
TN0.3900.3499.5840.0002 ***
Temp0.5250.47610.7010.2437
P14100.5840.5259.8350.0101 *
P10050.6310.5639.2490.0739
WS
P29200.2090.1838.1820.0009 ***
MBC0.3130.2686.8450.0201 *
EC0.4080.3476.6680.0395 *
OR
EC0.2740.25011.6740.0006 ***
TC0.5090.47615.5630.0002 ***
* p < 0.05, ** p < 0.01, and *** p < 0.001.
Publisher’s Note: MDPI stays neutral with regard to jurisdictional claims in published maps and institutional affiliations.

