Article

Soil Quality Characteristics as Affected by Continuous Rice Cultivation and Changes in Cropping Systems in South China

1
College of Natural Resources and Environment, South China Agricultural University, Guangzhou 510642, China
2
Guangdong Provincial Key Laboratory of Land Use and Consolidation, Guangzhou 510642, China
3
South China Academy of Natural Resources Science and Technology, Guangzhou 510610, China
4
State Key Laboratory of Plateau Ecology and Agriculture, Qinghai University, Xining 810016, China
*
Author to whom correspondence should be addressed.
Agriculture 2020, 10(10), 443; https://doi.org/10.3390/agriculture10100443
Submission received: 12 August 2020 / Revised: 22 September 2020 / Accepted: 23 September 2020 / Published: 30 September 2020
(This article belongs to the Special Issue Soil Quality and Crop Nutrition)

Abstract

:
This study was conducted to elucidate how changes in critical soil quality characteristics relate to continuous rice cultivation and changes in cropping systems and fertilization in South China over the time span 1980 to 2017. Soil pH, soil organic matter (SOM), total nitrogen (TN), available phosphorus (AP) and potassium (AK) were determined for the samples taken in 2017 and compared to results from the paired samples collected in 1980 by grouping all samples into four cropping systems: continuous paddy fields, new paddy fields developed from uplands, continuous uplands, and new uplands developed from paddy soils. The results show a significant increase in soil pH, AP and AK in all cropping systems, which was, however, coupled with low fertilizer use efficiency. Additionally, a significant increase in SOM came with new paddy soils, whereas a little SOM accumulation and a significantly weakened correlation of TN to SOM occurred in continuous paddy soils. Both low fertilizer use efficiency and deteriorated soil C sequestration function imply a sub-health status of continuous paddy soils. The changes in cropping systems and fertilization, which essentially resulted from expeditious economic growth, should be responsible for the dynamics of C and N and the consequences to soil quality. More experimental studies on balanced fertilization vs. local commonly used fertilization are suggested to probe the mechanisms underlying the C and N dynamics in paddy soils.

1. Introduction

Rice (Oryza sativa L.) is one of the most essential staple food crops that not only feeds about 50% of the world’s population but supports and affects the livelihoods and economies of several billion people [1]. As of the year 2017, the world’s rice planted area was up to 167.24 Mha and contributed about 26% to the global crop planted area and food production, respectively [2]. For example, the Indo Gangetic Plain of South Asia, one of the most vital paddy-rice produce bases in the world, has about 60 Mha of land cultivated with paddy rice and produces about 32% of global rice production [3]. In China, the paddy rice planted area was as high as 31.0 Mha and accounted for 30.2% of the total crop planted area and contributed 34.5% to the total food production in 2017 [2]. However, the productivity of the rice-rice cropping system is still low and appears to continues to decline because of continuous submergence-induced worse soil environment (e.g., weakened soil structure, increased bulk density and reduced hydraulic conductivity) [4] and subsequent deterioration of soil quality due to the imbalanced fertilization and limited organic carbon (OC) recycling [5]. On the other hand, lots of field experiments with controlled and balanced fertilization designs have demonstrated a great potential of paddy soils for sequestering atmospheric CO2 and mitigating the global warming by storing more OC in soils [6,7]. So far, few data are available to reveal what happened and are going to take place to the fertility and quality of paddy soils that have normally undergone with local management such as either insufficient fertilization in south Asia and southeast Asia while excessive fertilization in China.
Since about 1980, the rapid economic growth and corresponding demands for agriculture in China have resulted in an increasing concern about the sustainability of the nation’s agricultural soils that have been intensively cultivated with excessive inputs of fertilizers and other chemicals. According to the People’s Republic of China National Bureau of Statistics PRC NBS [8], China’s total grain output increased from 321 million tons (Mt) in 1980 to 617.9 Mt in 2017, with an average annual growth rate of 2.0%. At the same time, the consumption of nitrogen (N), phosphorus (P) and potassium (K) fertilizers increased from 12.69 to 60.65 Mt, with an average annual growth rate of 5.0%. China’s fertilizer usage accounted for more than 1/3 of the world’s fertilizer consumption at a rate that is four times the world average. These facts imply not only an irreplaceable role of chemical fertilizers in ensuring grain output and food security in China but also a high price of potential soil degradation due to excessive fertilizer inputs [9,10]. Meanwhile, there have been changes in land use intensity, especially the increased farmland fragmentation that resulted from rapid economy growth-triggered urbanization [11]; because these changes likely affect biodiversity and ecosystem functions [12,13] and disturb original hydrological and biogeochemical cycling across the agroecosystems [14]. Because of the close link of soil quality with land use intensity on a broad scale [15] and changes in cropping system on a landscape scale [16], it is critical for policy-makers and managers to understand the impacts of changes in cropping systems and farming activities that have been forced to respond to the rapid industrialization and urbanization in China.
Assessment of soil quality has been recently emphasized on issues much wider than a term of production; because soil condition can be an indication of soil quality/health with respect to soil nutrient availability to vegetation and C cycling and is becoming an environmental quality and human health issue [17]. Unlike forest and grassland ecosystems where soil quality is mainly controlled by climatic and environmental variables [18], the soil quality characteristics in an agricultural system is more subject to production-oriented agronomic options, particularly cropping system, cultivation, water management, and fertilization [19,20]. Many soil characteristics have been identified as indicators of soil quality because of their relationships with soil processes and functions. Of these characteristics, soil organic matter (SOM) has been thought to be crucial due to its fundamental role in improving soil properties and in maintaining soil fertility despite their interactions, driving terrestrial C cycling, and mitigating global warming [19,21]. In addition, soil pH, soil total nitrogen content (TN), soil available phosphorus (AP) and available potassium (AK) levels are closely related to the thresholds of biological and chemical activities and plant nutrient availability [22].
The direct assessment of soil quality can be inferred from management-induced changes in soil properties [5,23]. This study was conducted to elucidate how soil quality characteristics vary with continuous rice cultivation and conversions between paddy rice and upland crops over a certain time-span by revealing differences in pH, SOM, TN, AP and AK among cropping systems and tracking the historical responses of rice grain yields and soil quality characteristics to the excessive fertilization.

2. Materials and Methods
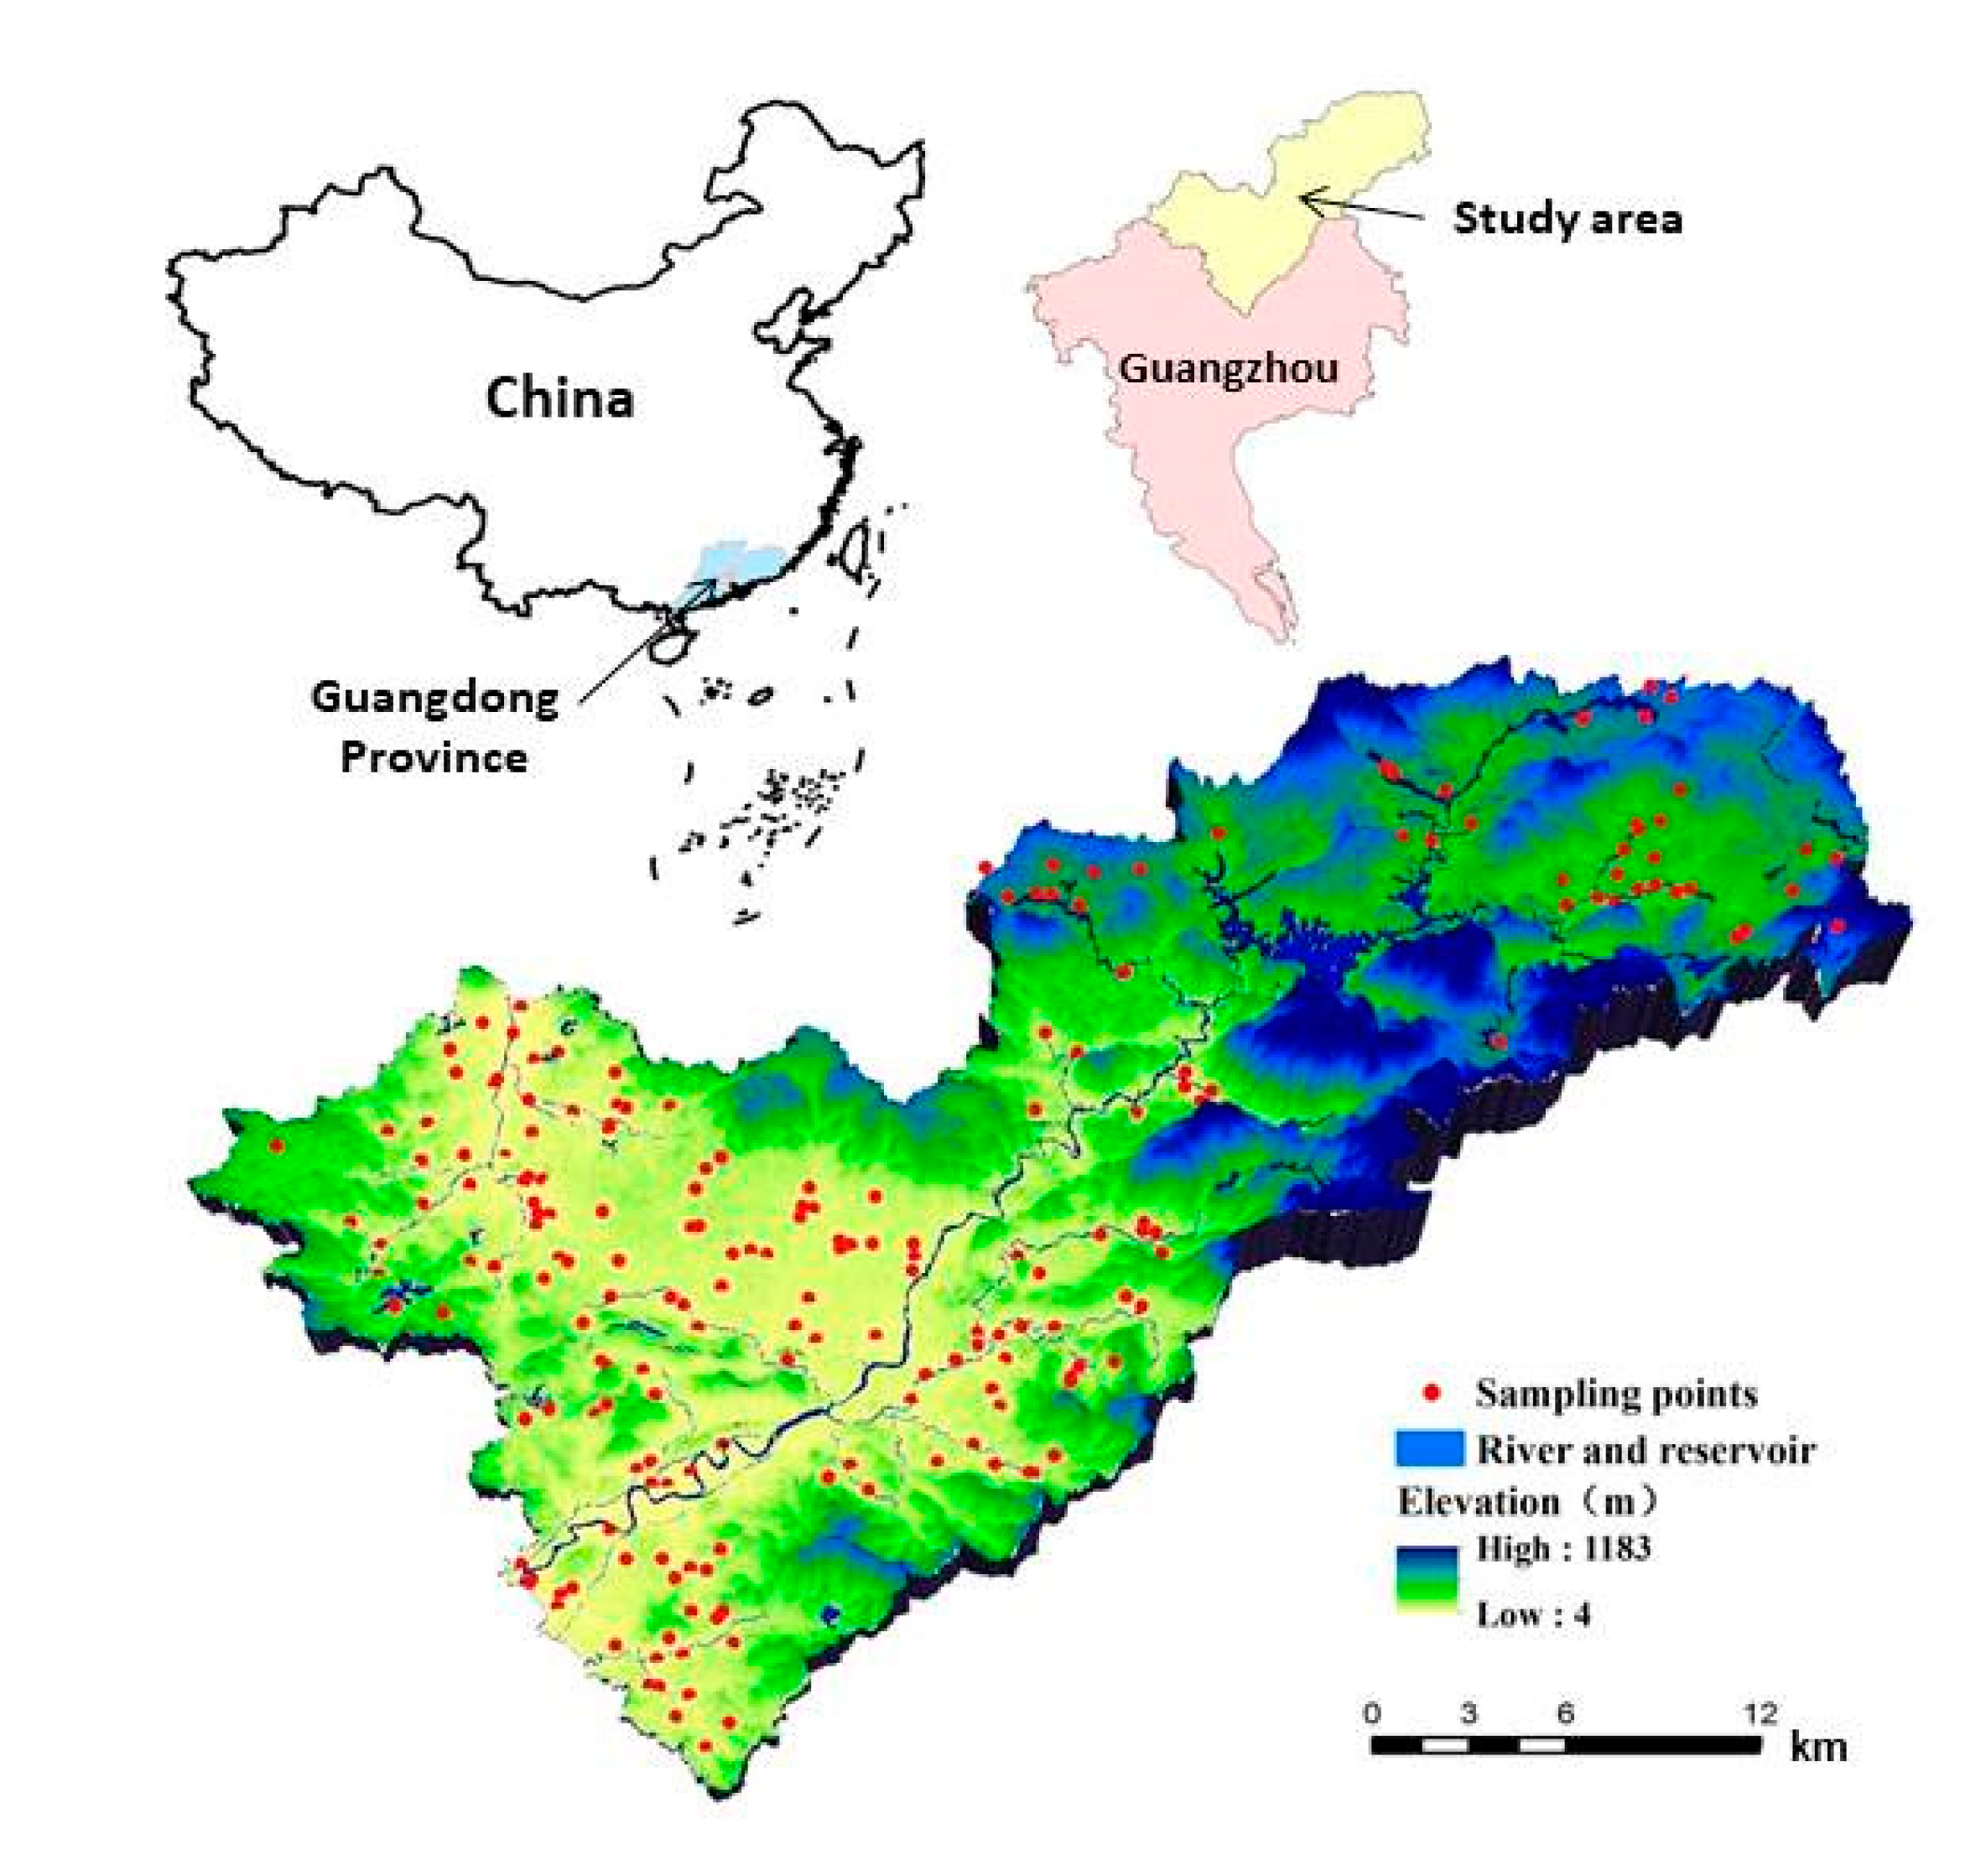
2.1. Study Area

The study area (named Conghua) locates in the northeast of Guangzhou of Guangdong Province in China, falling in a range of 23°22′ to 23°56′ N and 113°17′ to 114°04′ E (Figure 1). It covers an area of 1741 km2 and consists of valleys, hills, and low mountains. This region belongs to a subtropical monsoon climate with an annual average temperature of 19.5–21.4 °C and an annual precipitation of approximately 2000 mm.
The cultivated lands amounted up to 28,287 ha in 1980 and 20,646 ha in 2015, accounting for 20% and 12% of the total land area, respectively. According to the Second National Soil Survey, highly weathered soils (Hapludoxes) and paddy soils (Haplaquepts) have been attributed to all farming cultivation. Among all paddy soils, waterlogged paddy soils (Typical Haplaquepts) have predominated. Double-cropping systems are common, of which and the rice-rice system has been the most popular (in some cases followed by either fallow conditions or a winter crop). The upland crops include peanut, soybean, sweet potato, vegetables, etc. The dominant rice cultivars included Yue Jing Si Miao, Yue Xiu Zhan, Guang Feng Xiang 8, and Guang Yuan Zhan 5.

2.2. Soil Sampling and Analyses

Soil samples were collected from cultivated lands in September 2017. The total number of sampling sites was statistically (a stratified random sampling method) determined to represent all land use types, cropping systems, and soil taxonomic classes. For order to make the results be comparable to those obtained in 1980, new sampling sites were located as close as possible to the sites sampled in 1980. Each sample was geographically positioned and mapped using GPS. A total of 204 soil samples were collected, of which 53 samples (Typical Haplaquepts, consisting of various soil series) were positionally paired with those sampled in 1980. The 0–20 cm topsoil was sampled equally across 5 points in an “X” shape at each sampling site using a bamboo shovel and was then thoroughly mixed to yield approximately 1 kg after plant residues, roots, and stones were removed. All samples were air dried at room temperature, grounded for texture analysis, and passed through a 100-mesh sieve (0.15 mm) for chemical analyses. The processes and methods for determining SOM, pH, TN, AP, and AK were referred to Lu [24].
The 1980s soil data and soil map for the study area were derived from the report of the Second National Soil Survey of Conghua County. At that time, the soil quality characteristics of each sample were quantified for the plow layer, whose sampling depth varied with individual sampling sites; therefore, the magnitudes of all soil characteristics were scaled to be equivalent to those for 0–20 cm topsoil according to the model proposed by Tan et al. [25], so as to allow comparisons with soil samples collected in 2017.
Major soil properties were determined for the samples taken in 2017, statistically compared with the results from the paired samples taken in 1980 by grouping all samples into four cropping systems for sample-paired T-test: continuous paddy fields, new paddy fields developed from uplands, continuous uplands, and new uplands developed from paddy soils. The mean and standard deviation of samples for each cropping system were computed using SPSS 16.0 (SPSS Inc., Chicago, IL, USA) and the difference in a target variable between either the time-span or cropping systems was determined using the T-test. Differences in means of cropping systems were considered significant if p < 0.05.

3. Results

3.1. Changes in Cultivated Land Area and Cropping Characteristics

Since 1980, the rapid urbanization and consequent adjustment of the agricultural structure (for example, a high demand for vegetables and fruits) in the study area led to a huge reduction in the cultivated land (especially paddy fields), amounting up to a total of 27.0% by 2015 (Table 1). Surprisingly, the reduction rate was up to 25.2% in the first decade (1981–1990) or 2.52% when expressed as an annual rate, which was much higher than the national average of 0.36% (PRC NBS, 2018). This dramatic reduction prompted the Chinese Central Government to issue obligatory policies called “the cultivated land requisition-compensation balance” (e.g., Land Administration Law of the People’s Republic of China (issued in 1986) [26] and Basic Farmland Protection Ordinances (1998) [27]), which requires to quantitatively compensate the occupied cultivated land by exploring new arable land. That is why the total cultivated land area in the study area did not fluctuate considerably and stayed at a decline annual rate as low as 0.02% since 1990.
Of all cultivated lands, the paddy fields accounted for 82% in 1980, 86% in 1990, and 82% in 2015; the continuous paddy fields accounted for approximately 83.5% of all paddy fields. The decrease in the paddy rice planted area after 1990 was mainly due to a high demand for vegetables and fruits. The double “rice-rice” cropping system has existed in most paddy fields and been occasionally rotated with peanut, soybean, or corn. Vegetables are usually irrigated, and sweet potato, cassava and peanut are normally planted in rain-fed croplands. Because of favorable climatic conditions, the annual cropping index ranged from 1.32 to 2.16 until 2017.
Referring to the data presented in Table 1, the fertilizer use efficiency (FUE) (kg rice grain per kg fertilizers applied) was estimated to be 46 in 1980, but dropped to a range from 10 to 14 afterwards. The variations in fertilizer use efficiency of paddy rice over time for the study area and the nation are illustrated in Figure 2. Compared to the national average nitrogen fertilizer use efficiency (NUE) (Figure 2B), the NUE in the study area was higher by about 10 units, up to 52 in 1980, but was lower by 18 units and declined to 14 in 1990; and afterwards it was still lower by about 4 units even some increase to about 18.

3.2. Comparisons of Soil Quality Attributes between Paddy Fields and Uplands

As presented in Table 2, SOM, TN, and AP were significantly higher in paddy fields than in uplands in 1980, but no significant differences were observed in 2017. On the other hand, soil pH, AP and AK were significantly higher in 2017 than in 1980 in both paddy fields and uplands. Surprisingly, the C:N ratio was significantly greater in 2017 than in 1980; and the correlation of TN to SOM became much weaker in 2017 than in 1980 (Figure 3).

3.3. Variations in Critical Soil Attributes with Cropping Systems

Some soil quality attributes were quantified in 2017 and presented in Table 3. In general, there were no significant differences in pH and AP between cropping systems. The SOM in both continuous paddy fields and continuous uplands was significantly higher than that in new uplands. Compared to the continuous paddy fields, the conversion of paddy fields to (new) uplands means an alteration of flooding (anaerobic) condition to aerobic–dominated soil moisture one, which resulted in a significant SOM loss.

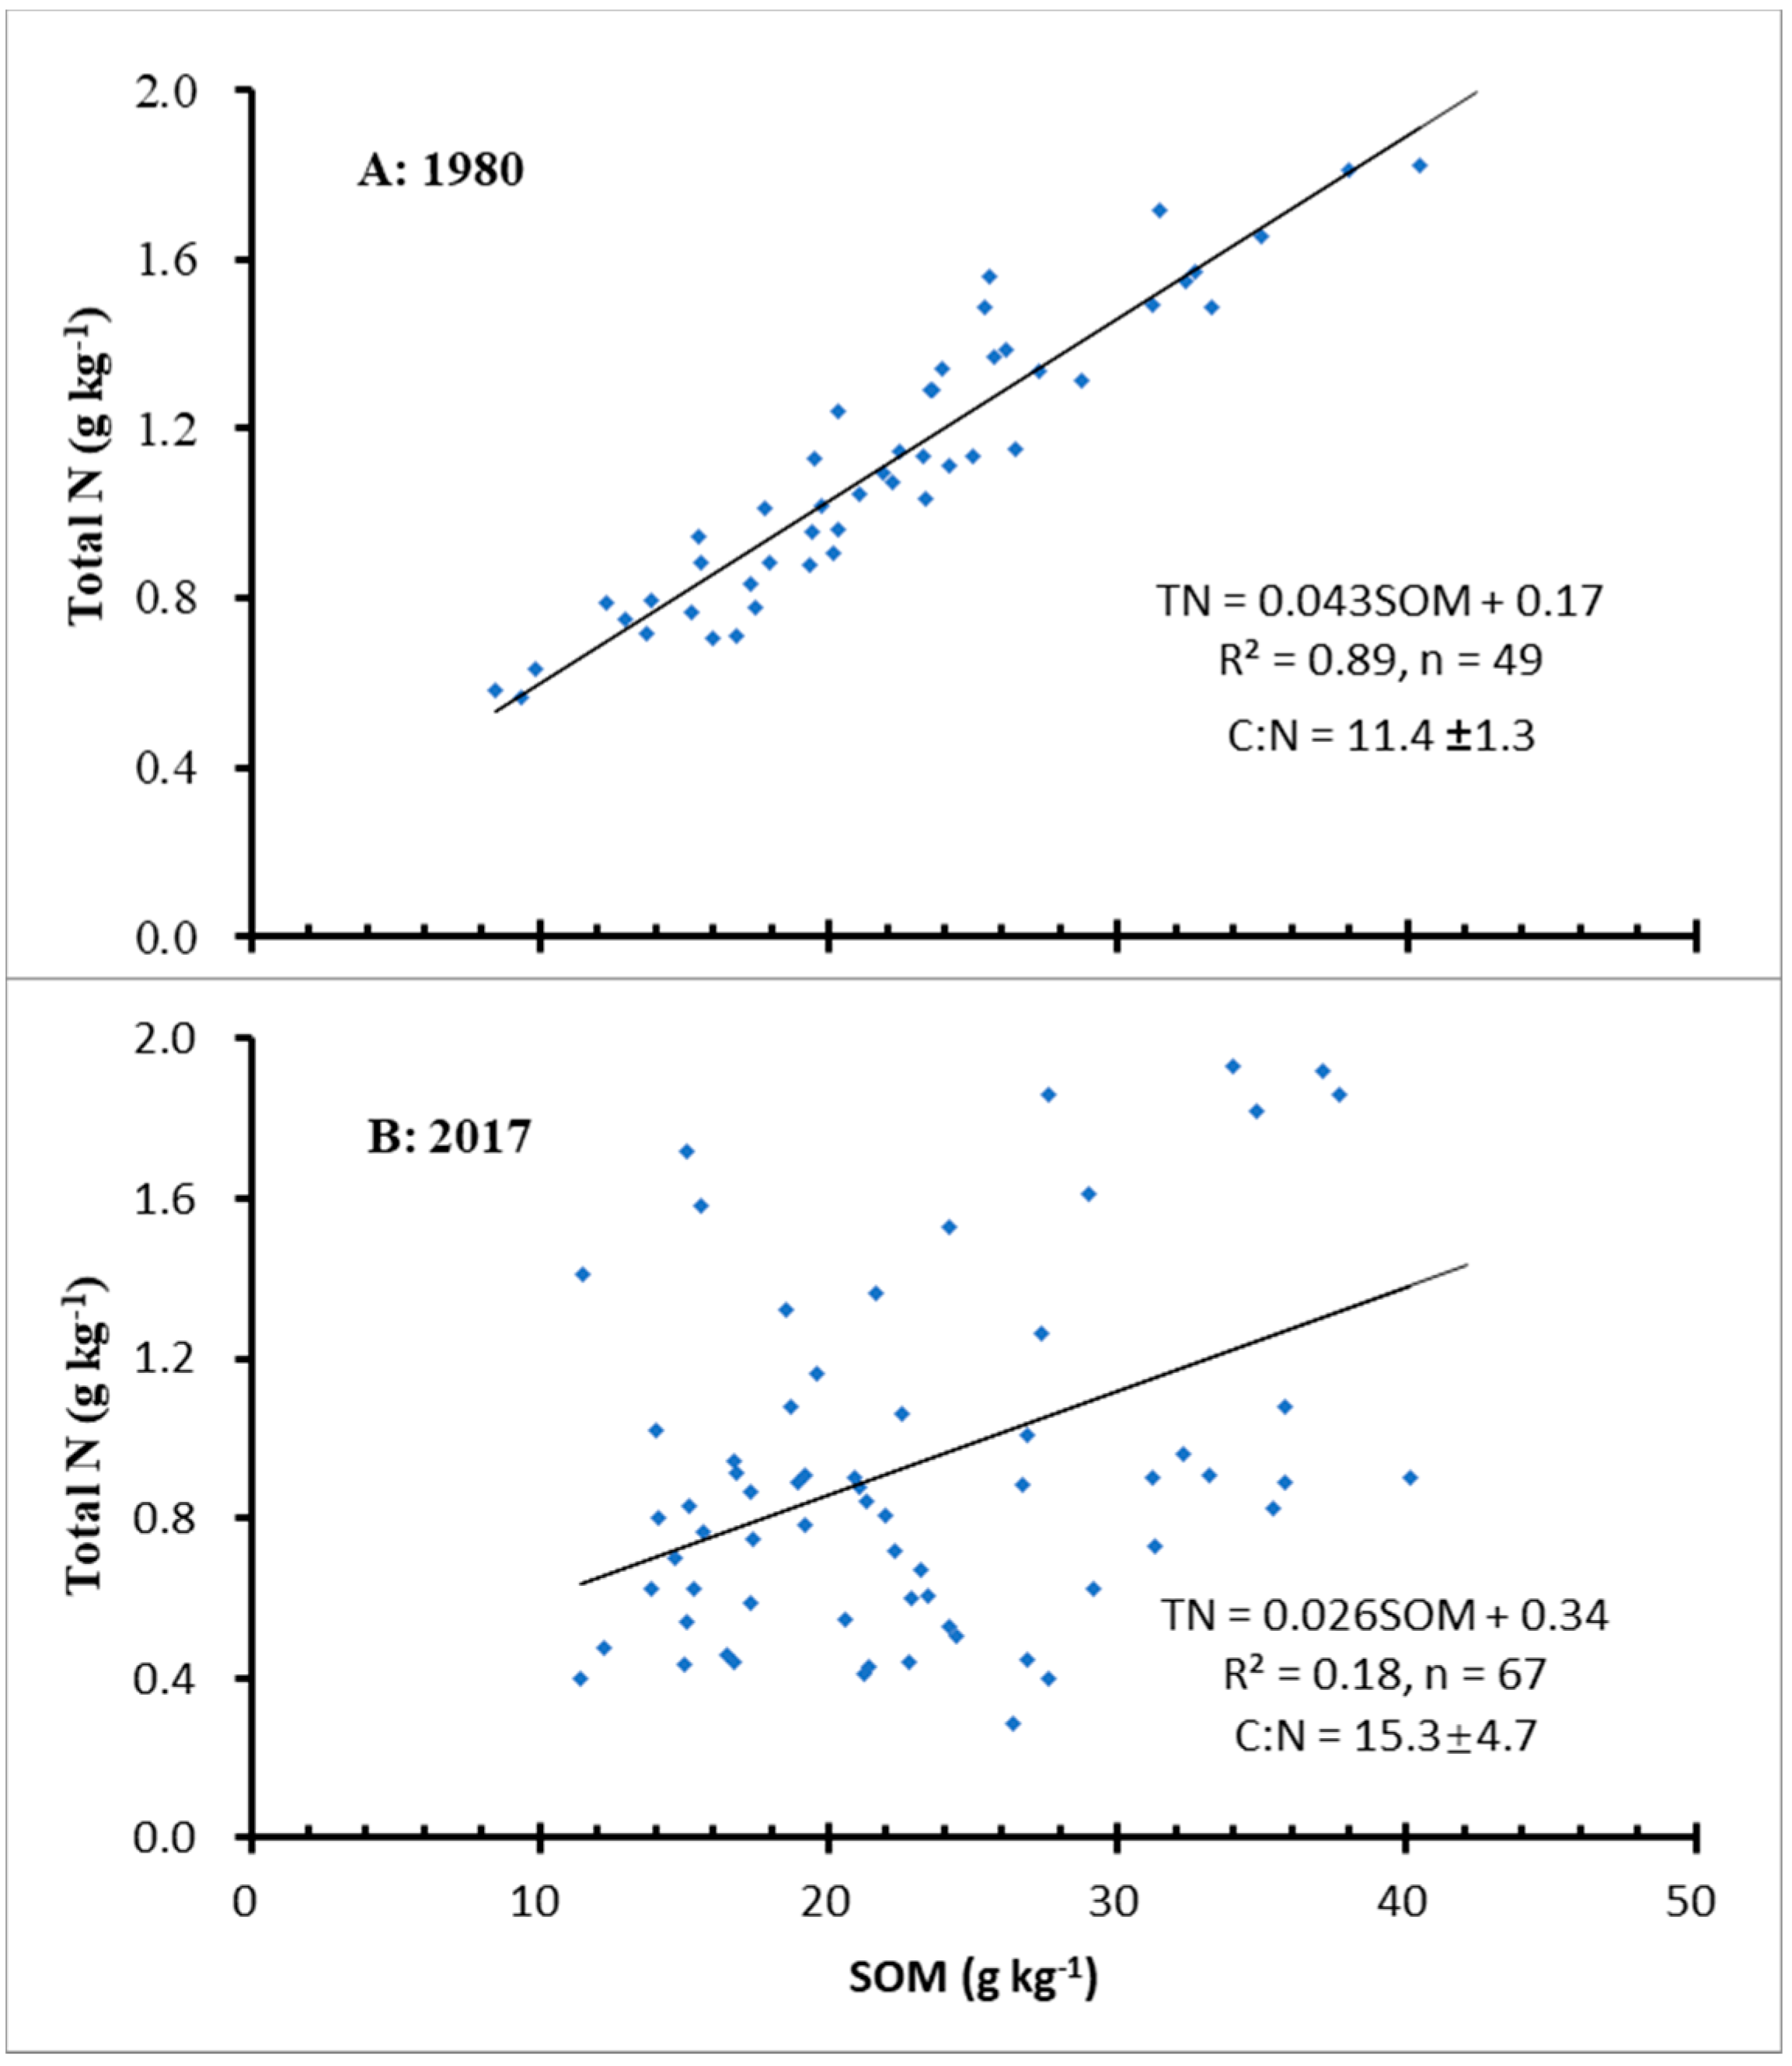
3.4. Changes in Critical Soil Attributes over Time

The data in Table 4 refer to the differences in soil attributes between 2017 and 1980. Compared to those in 1980, soil pH, AP and AK increased significantly in all cropping systems in 2017, and the SOM accumulated significantly in both the continuous uplands and the new paddy fields, but decreased significantly in the new uplands. On the other hand, the conversion of upland crops to paddy rice (or new paddy fields) and the continued upland crops since 1980 led to a significant increase in SOM, i.e., a total of 5.39 and 7.89 g kg−1, respectively, while the continuous paddy fields showed a total SOM addition of 1.05 g kg−1 only, equivalent to an annual accumulation rate <0.029 g SOM kg−1 y−1.

4. Discussion

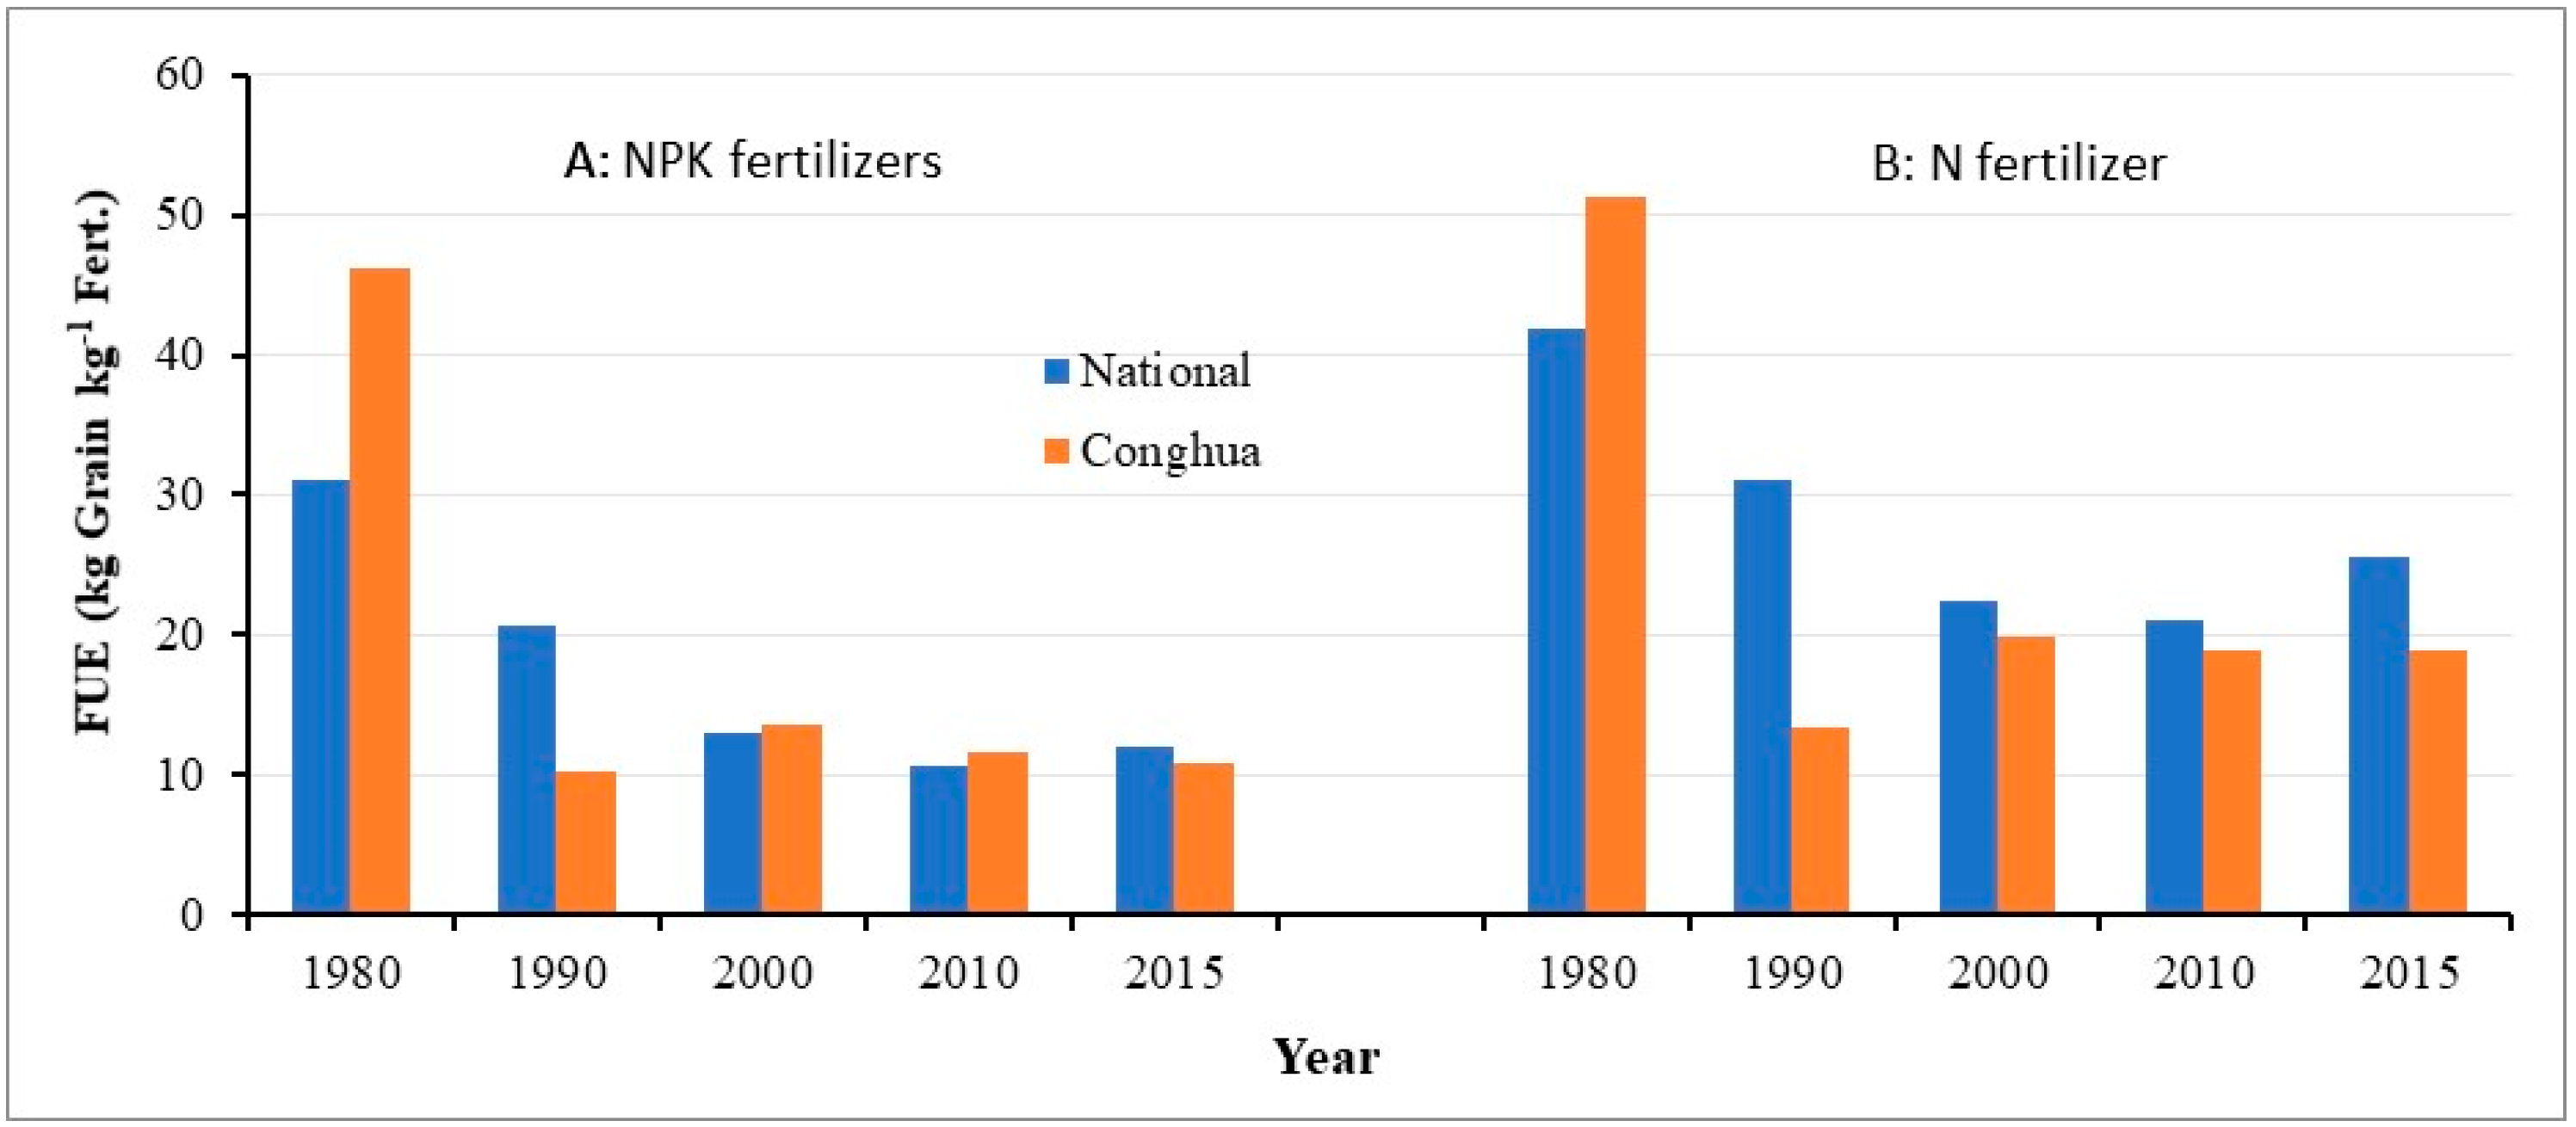
4.1. Responses of Rice Grain Yield to the Increased Fertilization Rate

As presented in Table 1, the fertilization rate (equivalent to pure N) increased dramatically from 129 kg N ha−1 y−1 in 1980 to 642 kg N ha−1 yr−1 in 1995, then remained at a level of approximately 550 kg N ha−1 y−1 until 2017, which was much higher than the threshold of about 294 kg N ha−1 y−1 [29]. At the same time, the rice grain yield did not proportionally respond to the increase in fertilization rate, confirming a remarkable decline in the FUE of paddy soils since 1990. Peng et al. documented that the average NUE of all paddy soils in China was about 30–35%, implying a loss of more than 60% of the applied N annually [30]. As is well recognized, the nitrification of fertilized N is partially responsible for the low FUE [31], and the surplus of fertilized N tends to enhance N losses through denitrification and leaching [32]. Evaluating the effects of soil quality on rice grain yield in Southern Asia, Biswas et al. concluded that rice grain yield increases with soil quality index [33]. In fact, any excessive or imbalanced fertilization and puddling anaerobic/anaerobic cycle in rice-rice cropping system certainly exert differential effects on soil physical, chemical and biological attributes and further on the soil quality.

4.2. Improvement of Soil Quality

In view of changes in pH, AP and AK, some improvements in soil quality can be seen from Table 2. A significant increment in both AP and AK as of 2017 was basically benefited from the elevated application rate of P and K fertilizers, as documented by Liu [9] for other areas. An increase in soil pH could be mainly attributed to the traditional application of lime that helped offset the overdosed N fertilizers-induced acidification. Liu [9] documented that, besides the increased fertilization rate cross China since 1980, the application intensity of chemical fertilizers has increased by an average of 4.1% per year; and the proportion of NPK fertilizer elevated from 1:0.3:0.05 in 1980 to 1:0.50:0.43 in 2014, close to the crop-required the ratio of 1:0.50:0.50. The input of excessive NPK fertilizers in fact has exceeded not only the crops’ requirements as indicated by the low NUE (Figure 2B) but also environmental safety threshold and became more over since 1988; because of no significant increase in soil TN as of 2017. In other words, a large portion of all applied N went into other ecosystems.

4.3. Consequences of Continuous Cultivation with Paddy Rice

Differing from other cropping systems, the continuous paddy fields did show no significant increase in SOM over a 37-year span (Table 4), suggesting that the mechanisms driving paddy soil quality changes would differ from what have been widely thought because of unusual anthropogenic interferences. This kind of non-experimental (but actual and widely representative) results also fails to support the general assumption that paddy soils tends to accumulate SOM with time in South China [34].
Note that routine management practices adopted by small farmers were in fact different from those implemented in any long-term experiments in which the balanced and controlled fertilizations were applied; unbalanced or excessive fertilization has been practiced by small farmers nationally since 1980 [35]. The latter has been thought to be a major factor restricting SOM accumulation in paddy rice-dominated cropping systems in East China [34,36]. The mandatory return of all straw to fields since about 2000 [37] could be another factor that undermines the C sequestration function of the continuous paddy soils.
In general, there is a high correlation between soil TN and SOM in paddy soils, as illustrated in Figure 3A. However, this correlation became much weaker for the continuous paddy soils in 2017 (Figure 3B), and a small SOM change coupled with a remarkable decrease in TN (Table 2) significantly enlarged the C:N ratio from 11.4 ± 1.3 in 1980 to 15.3 ± 4.7 in 2017 (the latter is equivalent to the C:N ratio of soil microorganisms), implying a very slow SOC accumulation rate due to the limited N availability to soil microbes. The abnormal C:N ratio observed in 2017 can be attributed to cumulative additions of both excessive fertilizer-N since 1980 as recorded (Table 1) and all rice straw return since about 2000 as documented [34,38]. A higher C:N ratio was reported to be associated with more residue return to a soil, which usually enhances soil N mineralization [39,40], because microorganisms have to feed and use N from SOM for their propagation while decomposing the N-poor residues. Meanwhile, the surplus fertilizer N tends to lose through denitrification and leaching during the flooding period [10]. At this point, well-designed experiments are needed to verify and quantify how excessive N interact with added residues to impede SOM accumulation in continuous paddy soils.

4.4. Impacts of Changes in Cropping Systems and Fertilization

Conversions between paddy rice and upland crops, one kind of land use changes on a landscape scale, certainly result in concomitant alterations in agronomic practices and consequently affect soil nutrient cycle and soil quality by modifying near surface energy, moisture and momentum fluxes (local hydrological cycling) owing to changes in a landscape surface structure with different crops (referred to as biogeophysical effects), even local atmospheric CO2 concentration and SOM content due to changes in biomass production (biogeochemical effects) [41]. Actually, conversions either from paddy fields to uplands or vice versa are pedogenically equivalent to what are resulted from changes in relief due to concomitant alterations in hydrological conditions. Once a paddy field was altered to a kind of upland, the aerobic condition would dominantly stay with all pedogenic processes, thus enhancing the decomposition of the SOM that had originally accumulated under anaerobic (flooding) conditions [42] and result in a decrease in SOM. In turn, flooding conditions introduced to any upland can greatly promote SOM accumulation (or C sequestration) and form a new paddy soil even though its SOM accumulation rate also depends on its initial SOM content and the duration of paddy rice cultivation [34]. That is just what the data in Table 3 and Table 4 verify.
The study area, similar to other counties of Guangdong, has undergone a transition from a traditionally agricultural-based economy to an industrial-based one coupled with concomitant adjustment of agricultural structure since the 1980s [43]. These transition-induced excessive inputs of fertilizers in agroecosystems have become common. These changes not only disturb the original hydrological and biogeochemical cycling across various cropping systems and thus feedback disproportionately to soil pedogenic processes and functions, but also impact nutrient recycling and the biodiversity of endogenic soil taxa due to changes in land use intensity [15,32], and eventually affect the soil quality. By identifying factors for SOC variations in the Pearl River Delta (including our study area), Ren et al. concluded that drastic changes in farmland use patterns and intensity since about 1980 were evaluated as the most critical force driving the spatial variability and uncertainty of soil properties [43]. Additionally, under the much stronger interference of farming activities, the impacts of other local geographic and environmental factors (such as climatic variables and topographic aspects) are prone to be greatly weakened on a landscape scale.

5. Conclusions

Over the time span 1980 to 2017, some improvements in soil quality were observed in all cropping systems in terms of a significant increase in soil pH, SOM, AP and AK, except the continuous paddy fields where an ignorable SOM accumulation was accompanied by an increased soil C:N ratio. Long-term excessive N fertilizer and residue applications can be one of the critical variables driving the dynamics of C and N in continuous paddy soils. The term “sub-health status” is proposed to describe the quality of the continuous paddy soils in the study area, because no obvious soil quality degradation can be observed to couple with low FUE and impaired C sequestration function. In other words, the “sub-health status” can be called if a soil shows no obvious quality degradation in terms of common soil quality/health indicators but its some fundamental functions have weakened or become deteriorating. Further fertilization experiments should consider excessive fertilization routinely implemented by local farmers to probe the mechanisms underlying the C and N dynamics in paddy soils for improving nutrient use efficiency and soil functions in South China.

Author Contributions

X.R. was in charge of the implementation of the work and made the first draft of the manuscript. F.C. joined the coordination of the program and contributed to data interpretation and drafting manuscript. T.M. was responsible for collecting soil samples and relevant data, conducting statistical analysis and generating graphs. Y.H., as the funding recipient and supervisor, contributed to the design of the work. All authors have read and agreed to the published version of the manuscript.

Funding

National Natural Science Foundation of China provided the financial support for this project (U1901601).

Acknowledgments

The Second National Soil Survey data were obtained from the Conghua Agricultural Bureau of Guangzhou. Thanks are extended to Harris for his thoughtful comments and English editing.

Conflicts of Interest

Authors declare no conflict of interest.

References

  1. IRRI. Bringing Hope, Improving Lives: Strategic Plan 2007–2015; IRRI: Manila, Philippines, 2006; p. 61. [Google Scholar]
  2. FAO. International Year of Rice-2018 Fact Sheet. 2018. Available online: http://www.fao.org/rice2018/en/f-sheet/factsheet1.pdf (accessed on 29 March 2019).
  3. Mohanty, S.; Panda, M.K.; Acharya, L.; Nayak, S. Genetic diversity and gene differentiation among ten species of Zingiberaceae from Eastern India. 3 Biotech 2014, 4, 383–390. [Google Scholar] [CrossRef] [PubMed] [Green Version]
  4. Zhou, W.; Lv, T.F.; Chen, Y.; Westby, A.P.; Ren, W.J. Soil physicochemical and biological properties of paddy-upland rotation: A review. Sci. World J. 2014, 856352. [Google Scholar] [CrossRef] [Green Version]
  5. Shahid, M.; Nayak, A.K.; Puree, C.; Tripathi, R.; Lal, B.; Gautam, P.; Bhattacharyya, P.; Mohanty, S.; Kumar, A.; Panda, B.; et al. Carbon and nitrogen fractions and stocks under 41 years of chemical and organic fertilization in a sub-humid tropical rice soil. Soil Tillage Res. 2017, 170, 136–146. [Google Scholar] [CrossRef]
  6. Wissing, L.; Kolbl, A.; Housler, W.; Schad, P.; Cao, Z.H.; Koger-Knabner, I. Management-induced organic carbon accumulation in paddy soils: The role of organo-mineral associations. Soil Tillage Res. 2013, 126, 60–71. [Google Scholar] [CrossRef]
  7. Wissing, L.; Kolbl, A.; Vogelsang, V.; Fu, J.R.; Cao, Z.H.; Koger-Knabner, I. Organic carbon accumulation in a 2000-year chronosequence of paddy soil evolution. Catena 2011, 87, 376–385. [Google Scholar] [CrossRef]
  8. People’s Republic of China National Bureau of Statistics. China Statistical Yearbook 2017. Available online: http://www.stats.gov.cn/tjsj/ndsj/2017/indexch.html (accessed on 29 March 2019).
  9. Liu, Q. Spatio-temporal changes of fertilization intensity and environmental safety threshold in China. Trans. CSAE 2017, 33, 214–221. [Google Scholar]
  10. Yang, F.; Tian, J.; Meersmans, J.; Fang, H.J.; Yang, H.; Lou, Y.L.; Li, Z.F.; Liu, K.L.; Zhou, Y.; Blagodatskaya, E.; et al. Functional soil organic matter fractions in response to long-term fertilization in upland and paddy systems in South China. Catena 2018, 162, 270–277. [Google Scholar] [CrossRef] [Green Version]
  11. Cheng, L.; Xia, N.; Jiang, P.H.; Zhong, L.S.; Pian, Y.Z.; Duan, Y.W.; Huang, Q.H.; Li, M.C. Analysis of farmland fragmentation in China Modernization Demonstration Zone since “Reform and Openness”: A case study of South Jiangsu Province. Sci. Rep. 2015, 5, 11797. [Google Scholar] [CrossRef] [Green Version]
  12. Fahrig, L. Effects of habitat fragmentation on biodiversity. Annu. Rev. Ecol. Evol. Syst. 2003, 34, 487–515. [Google Scholar] [CrossRef] [Green Version]
  13. Mitchell, M.G.E.; Suarez-Castro, A.F.; Martinez-Harms, M.; Maron, M.; McAlpine, C.; Gaston, K.J.; Johansen, K.; Rhodes, J.R. Reframing landscape fragmentation’s effects on ecosystem services. Trends Ecol. Evol. 2015, 34, 190–198. [Google Scholar] [CrossRef] [Green Version]
  14. Brabec, E.; Smith, C. Agricultural land fragmentation: The spatial effects of three land protection strategies in the eastern United States. Landsc. Urban Plan. 2002, 58, 255–268. [Google Scholar] [CrossRef] [Green Version]
  15. Bondi, G.; Wall, D.; Bacher, M.; Emmet-Booth, J.; Graça, J.; Marongiu, I.; Creamer, R. Role of soil biology and soil functions in relation to land use intensity. EGU Gen. Assem. Conf. Abstr. 2017, 19, 15021. [Google Scholar]
  16. Congreves, K.A.; Hayes, A.; Verhallen, E.A.; Van Eerd, L.L. Long-term impact of tillage and crop rotation on soil health at four temperate agroecosystems. Soil Tillage Res. 2015, 152, 17–28. [Google Scholar] [CrossRef]
  17. Haney, R.L.; Haney, E.B.; Smith, D.R.; Harmel, R.D.; White, M.J. The soil health tool—Theory and initial broad-scale application. Appl. Soil Ecol. 2017, 125, 162–168. [Google Scholar] [CrossRef]
  18. Tan, Z.X.; Liu, S.G.; Sohl, T.L.; Wu, Y.P.; Young, C.J. Ecosystem carbon stocks and sequestration potential of federal lands across the conterminous United States. Proc. Natl. Acad. Sci. USA 2015, 112, 12723–12728. [Google Scholar] [CrossRef] [PubMed] [Green Version]
  19. Lal, R. Soil carbon sequestration impacts on global climate change and food security. Science 2004, 304, 1623–1627. [Google Scholar] [CrossRef] [PubMed] [Green Version]
  20. Schlesinger, W.H. Carbon and Agriculture: Carbon Sequestration in Soils. Science 1999, 284, 2095. [Google Scholar] [CrossRef]
  21. Lehmann, J.; Kleber, M. The contentious nature of soil organic matter. Nature 2015, 528, 60–68. [Google Scholar] [CrossRef]
  22. Soil Health. Available online: https://www.nrcs.usda.gov/wps/portal/nrcs/main/soils/health/ (accessed on 26 February 2020).
  23. Takoutsing, B.; Weber, J.; Aynekulu, E.; Martín, J.A.R.; Shepherd, K.; Sila, A.; Diby, L. Assessment of soil health indicators for sustainable production of maizein smallholder farming systems in the highlands of Cameroon. Geoderma 2016, 276, 64–73. [Google Scholar] [CrossRef]
  24. Lu, R.K. Methods of Soil Agrochemical Analysis; China Agricultural Science and Technology Press: Beijing, China, 2000. [Google Scholar]
  25. Tan, X.Z.; Lal, R.; Smeck, N.E.; Calhoun, F.G.; Slater, B.K.; Parkinson, B.; Gehring, R.M. Taxonomic and geographic distribution of soil organic carbon pools in Ohio. Soil Sci. Soc. Am. J. 2004, 68, 1896–1904. [Google Scholar] [CrossRef]
  26. Land Administration Law of the People’s Republic of China (Issued in 1986). Available online: https://www.cecc.gov/resources/legal-provisions/land-administration-law-of-the-peoples-republic-of-china-0 (accessed on 29 March 2019).
  27. Basic Farmland Protection Ordinances. Available online: http://www.asianlii.org/cn/legis/cen/laws/rotpobf421/ (accessed on 29 March 2019).
  28. China Statistical Yearbook. 2018. Available online: http://www.stats.gov.cn/tjsj/tjcbw/201810/t20181024_1629505.html (accessed on 29 March 2019).
  29. Zhao, Y.C.; Wang, M.Y.; Hu, S.J.; Zhang, X.D.; Zhu, O.Y.; Zhang, G.L.; Huang, B.; Zhao, S.W.; Wu, J.S.; Xie, D.T.; et al. Economics- and policy-driven organic carbon input enhancement dominates soil organic carbon accumulation in Chinese croplands. Proc. Natl. Acad. Sci. USA 2018, 115, 4045–4050. [Google Scholar] [CrossRef] [PubMed] [Green Version]
  30. Peng, S.B.; Huang, J.L.; Zhong, X.H. Challenge and opportunity in improving fertilizer-nitrogen use efficiency of irrigated rice in China. Agric. Sci. China 2002, 1, 776–785. [Google Scholar]
  31. Wang, J.; Zhao, Y.; Zhang, J.B.; Zhao, W.; Muller, C.; Cai, Z.C. Nitrification is the key process determining N use efficiency in paddy soils. J. Plant Nutr. Soil Sci. 2017, 180, 648–658. [Google Scholar] [CrossRef]
  32. Yang, Y.J.; Zhang, H.P.; Shan, Y.H.; Wang, J.J.; Qian, X.Q.; Meng, T.Z.; Zhang, J.B.; Cai, Z.C. Response of denitrification in paddy soils with different nitrification rates to soil moisture and glucose addition. Sci. Total Environ. 2019, 651, 2097–2104. [Google Scholar] [CrossRef] [PubMed]
  33. Biswas, S.; Hazra, G.C.; Purakayastha, T.J.; Saha, N.; Mitran, T.; Singha, R.S.; Basak, N.; Mandal, B. Establishment of critical limits of indicators and indices of soil quality in rice-rice cropping systems under different soil orders. Geoderma 2017, 292, 34–48. [Google Scholar] [CrossRef]
  34. Zhu, L.Q.; Li, J.; Tao, B.R.; Hu, N.J. Effect of different fertilization modes on soil organic carbon sequestration in paddy fields in South China: A meta-analysis. Ecol. Indic. 2015, 53, 144–153. [Google Scholar] [CrossRef]
  35. Liu, X.J.; Zhang, Y.; Han, W.X.; Tang, A.; Shen, J.L.; Cui, Z.L.; Vitousek, P.; Erisman, J.W.; Goulding, K.; Christie, P.; et al. Enhanced nitrogen deposition over China. Nature 2013, 494, 459–462. [Google Scholar] [CrossRef]
  36. Guo, J.H.; Liu, X.J.; Zhang, Y.; Shen, J.L.; Han, W.X.; Zhang, W.F.; Christie, P.; Goulding, K.W.T.; Vitousek, P.M.; Zhang, F.S. Significant acidification in major Chinese croplands. Science 2010, 327, 1008–1010. [Google Scholar] [CrossRef] [Green Version]
  37. Kogel-Knabner, I.; Amelung, W.; Cao, Z.H.; Fiedler, S.; Frenzel, P.; Jahn, R.; Kalbitz, K.; Kolbl, A.; Schloter, M. Biogeochemistry of paddy soils. Geoderma 2010, 157, 1–14. [Google Scholar] [CrossRef]
  38. Tian, K.; Zhao, Y.C.; Xu, X.H.; Hai, N.; Huang, B.; Deng, W.J. Effects of long-term fertilization and residue management on soil organic carbon changes in paddy soils of China: A meta-analysis. Agric. Ecosyst. Environ. 2015, 204, 40–50. [Google Scholar] [CrossRef]
  39. Li, Y.; Wu, J.S.; Shen, J.L.; Liu, S.L.; Wang, C.; Chen, D.; Huang, T.P.; Zhang, J.P. Soil microbial C:N ratio is a robust indicator of soil productivity for paddy fields. Sci. Rep. 2016, 6. [Google Scholar] [CrossRef] [PubMed] [Green Version]
  40. Ma, L.; Yang, L.Z.; Xiao, H.A.; Yin, S.X.; Xia, L.Z.; Li, Y.D.; Liu, G.H. Effects of long-term fertilization and straw returning on nitrogen distribution and mineralization characteristics of paddy soil in red soil. Plant Nutr. Fertil. Sci. 2011, 17, 898–905. [Google Scholar]
  41. Ren, X.N.; Dong, Y.X. Construction of multivariate composite calculation model of soil organic carbon content in plough horizon based on geodetectors: A case study on the Pearl River Delta. Trop. Geogr. 2018, 38, 546–556. [Google Scholar]
  42. Guo, L.B.; Gifford, R.M. Soil carbon stocks and land use change: A meta analysis. Glob. Chang. Biol. 2002, 8, 345–360. [Google Scholar] [CrossRef]
  43. Jin, S.Q.; Ma, H.Y.; Huang, J.K.; Hu, R.; Rozelle, S. Productivity, efficiency and technical change: Measuring the performance of China’s transforming agriculture. J. Prod. Anal. 2010, 33, 191–207. [Google Scholar] [CrossRef]
Figure 1. Location and geographical feature of the study area, Conghua of Guangzhou in China.
Agriculture 10 00443 g001
Figure 2. Fertilizer use efficiency (FUE) and nitrogen fertilizer use efficiency (NUE) of paddy rice in the study area and China for selected years ((A): Based on the equivalent pure N estimated from all N, P, and K fertilizers applied in paddy fields; (B): Based on the pure N from the nitrogen fertilizers only applied in paddy fields) [28].
Agriculture 10 00443 g002
Figure 3. Correlations of soil total nitrogen (TN) to soil organic matter (SOM) in paddy fields for 1980 (A) and 2017 (B), respectively.
Agriculture 10 00443 g003
Table 1. Historical changes in cultivated land area and cropping characteristics.
ItemUnitYearly Statistical Data Change in Cropping System and Area
1980199020002010201519802017Ha
Total cultivated areaha28,28721,16618,82220,63720,646Paddy fieldsContinuous paddy fields14,132
Paddy fields% 82.585.884.382.382.0Paddy fieldsNew uplands232
Uplands §% 17.514.215.715.915.8UplandsNew paddy fields2,796
Cropping index 1.631.661.322.132.16UplandsContinuous uplands471
Fertilization rate #kg ha−1106476362423449
Rice grain yieldkg ha−14914 $5430584148035178
Note: —Derived from Guangzhou Annual Reports. —Annual double-/triple-cropping system, changed from the cropping system in 1980 to that in 2017, and these were derived from both 1980 and 2015 land use data. §—Including both fed and irrigated lands. —Percentage of the total cultivated area. #—Equivalent to pure N of all N, P, and K fertilizers applied in paddy fields only. $—Harvest area-weighted annual rice grain yield that was estimated from 49 soil sampling sites across the study area.
Table 2. Topsoil (0–20 cm) attributes and their differences between paddy fields and uplands.
YearCropping System Soil OrderNumber of SamplesCropWater ConditionpHSOMTNAPAKC:N
g kg−1ppm
1980Paddy fieldsAnthrosols49Paddy rice Flooded5.49 a22.1 a1.12 a8.1 a42 a11.4 a
UplandsFerralosols4Various crops §Rain-fed/Irrigated5.37 a16.4 b0.77 b3.5 b45 a12.4 a
2017Paddy fieldsAnthrosols49Paddy rice Flooded5.71 b22.4 a0.85 b43 c79 b15.3 b
UplandsFerralosols4Various crops §Rain-fed /Irrigated5.85 b21.8 a0.82 b45 c74 b15.4 b
Note: —Annual double-/triple-cropping system; —Rice-rice that might be followed with a winter crop or fallow; §—Including various vegetables and fruits. Numbers followed by different letters are significantly different at p < 0.05. SOM—Soil organic matter; TN—Soil total nitrogen; AP—Soil extractable phosphorus; AK—Soil extractable potassium.
Table 3. Topsoil attributes in the cropping systems identified as of 2017.
Cropping System Number of SamplesBulk DensitypHSOMTNAPAK
19802017 106 g m−3 g kg−1mg kg−1
Paddy fieldsContinuous paddy fields 441.065.74 a23.20 a0.94 a42 a90 a
Paddy fieldsNew uplands §41.075.79 a19.40 b0.87 ab47 a82 a
UplandsNew paddy fields 51.055.68 a21.7 ab0.79 b42 a71 b
UplandsContinuous uplands §41.065.89 a24.20 a0.79 b42 a67 b
Note: —The double-/triple-cropping system in 2017 was converted from or remained the same as that in 1980; —Rice-rice that might be followed with a winter crop or fallow; §—Including various vegetables and fruits. SOM—Soil organic matter; TN—soil total nitrogen; AP—Soil extractable phosphorus; AK—Soil extractable potassium; Numbers followed by different letters are significantly different at p < 0.05.
Table 4. Changes in quantified soil attributes between 1980 and 2017.
Cropping System Number of SamplespHSOMTNAPAK
20171980g kg−1ppm
Continuous paddy fields Paddy fields440.25 *1.05−0.1834 *48 *
New uplands §Paddy fields40.30 *−2.72 *−0.2539 *40 *
New paddy fields Uplands50.31 *5.39 *0.0239 *26 *
Continuous uplands §Uplands40.52 *7.89 *0.0239 *22 *
Note: *—Statistically significant at p < 0.05; —Annual double-/triple-cropping system; —Rice-rice that might be followed with a winter crop or fallow; §—Including various vegetables and fruits.

