Factors Influencing Variations in Hospitalization for Diabetes with Hypoglycemia


Abstract
:1. Introduction
- When other factors are held constant, what is the profile of hospitalized diabetics with HG in experiencing longer LOS?
- When other factors are held constant, what is the profile of hospitalized diabetics with HG in incurring higher total charges?
- When the effects of other predictors are simultaneously considered, is the need-for-care or total charges the most important predictor of LOS?
2. Materials and Methods
2.1. Design
2.2. Data Source and Sample
2.3. Study Variables
2.4. Statistical Analysis
3. Results
3.1. Descriptive Analysis
3.2. Correlation Analysis
3.3. Decision Tree Regression (DTREG)
4. Discussion
5. Conclusions
Author Contributions
Funding
Conflicts of Interest
References
- Diabetes.org. Statistics about Diabetes. Available online: http://www.diabetes.org/diabetes-basics/statistics/?referrer=https://www.google.com (accessed on 1 February 2016).
- NIDDK. Your Guide to Diabetes: Type 1 and Type 2. February 2014. Available online: http://www.niddk.nih.gov/health-information/health-topics/Diabetes/your-guide-diabetes/Pages/index.aspx (accessed on 20 May 2016).
- Briscoe, V.J.; Davis, S.N. Hypoglycemia in type 1 and type 2 diabetes: Physiology, pathophysiology, and management. Clin. Diabetes 2006, 24, 115–121. [Google Scholar] [CrossRef]
- American Diabetes Association (ADA). Hypoglycemia (Low Blood Glucose). Available online: http://www.diabetes.org/living-with-diabetes/treatment-and-care/blood-glucose-control/hypoglycemia-low-blood.html, 2015 (accessed on 20 May 2016).
- Barendse, S.; Singh, H.; Frier, B.M.; Speight, J. The impact of hypoglycaemia on quality of life and related patient-reported outcomes in Type 2 diabetes: A narrative review. Diabet. Med. 2012, 29, 293–302. [Google Scholar] [CrossRef] [PubMed]
- Curkendall, S.M.; Natoli, J.L.; Alexander, C.M.; Nathanson, B.H.; Haidar, T.; Dubois, R.W. Economic and clinical impact of inpatient diabetic hypoglycemia. Endocr. Pract. 2009, 15, 302–312. [Google Scholar] [CrossRef] [PubMed]
- Greco, D.; Angileri, G. Drug-induced severe hypoglycaemia in type 2 diabetic patients aged 80 years or older. Diabetes Nutr. Metab. 2004, 17, 23–26. [Google Scholar] [PubMed]
- Edridge, C.L.; Dunkley, A.J.; Bodicoat, D.H.; Rose, T.C.; Gray, L.J.; Davies, M.J.; Khunti, K. Prevalence and incidence of hypoglycaemia in 532,542 people with type 2 diabetes on oral therapies and insulin: A systematic review and meta-analysis of population based studies. PLoS ONE 2015, 10. [Google Scholar] [CrossRef] [PubMed]
- CDC. National Diabetes Statistics Report: Estimates of Diabetes and Its Burden in the United States. Available online: https://www.cdc.gov/diabetes/pdfs/data/2014-report-estimates-of-diabetes-and-its-burden-in-the-united-states.pdf (accessed on 23 May 2016).
- Ginde, A.A.; Espinola, J.A.; Camargo, C.A., Jr. Trends and disparities in U.S. Emergency department visits for hypoglycemia, 1993–2005. Diabetes Care 2008, 31, 511–513. [Google Scholar] [CrossRef] [PubMed]
- Geller, A.I.; Shehab, N.; Lovegrove, M.C.; Kegler, S.R.; Weidenbach, K.N.; Ryan, G.J.; Budnitz, D.S. National estimates of insulin-related hypoglycemia and errors leading to emergency department visits and hospitalizations. JAMA Intern. Med. 2014, 174, 678–686. [Google Scholar] [CrossRef] [PubMed]
- Hsu, P.F.; Sung, S.H.; Cheng, H.M.; Yeh, J.S.; Liu, W.L.; Chan, W.L.; Chuang, S.Y. Association of clinical symptomatic hypoglycemia with cardiovascular events and total mortality in type 2 diabetes: A nationwide population-based study. Diabetes Care 2013, 36, 894–900. [Google Scholar] [CrossRef] [PubMed]
- Jakubczyk, M.; Rdzanek, E. Economic resources consumption structure in severe hypoglycemia episodes: A systematic review and meta-analysis. Expert Rev. Pharmacoecon. Outcomes Res. 2015, 15, 813–822. [Google Scholar] [CrossRef] [PubMed]
- Davis, T.M.; Brown, S.G.; Jacobs, I.G.; Bulsara, M.; Bruce, D.G.; Davis, W.A. Determinants of severe hypoglycemia complicating type 2 diabetes: The Fremantle diabetes study. J. Clin. Endocrinol. Metab. 2010, 95, 2240–2247. [Google Scholar] [CrossRef] [PubMed]
- Majumdar, S.R.; Hemmelgarn, B.R.; Lin, M.; McBrien, K.; Manns, B.J.; Tonelli, M. Hypoglycemia associated with hospitalization and adverse events in older people: Population-based cohort study. Diabetes Care 2003, 36, 3585–3590. [Google Scholar] [CrossRef] [PubMed]
- Gómez, R.; Guijarro, R.; Zapatero, A.; Barba, R.; Guijarro, A.; Tinahones, F.; Bernal, R. The frequency and impact of hypoglycemia among hospitalized patients with diabetes: A population-based study. J. Diabetes Complicat. 2015, 29, 1050–1055. [Google Scholar] [CrossRef] [PubMed]
- Signorovitch, J.E.; Macaulay, D.; Diener, M.; Yan, Y.; Wu, E.Q.; Gruenberger, J.B.; Frier, B.M. Hypoglycaemia and accident risk in people with type 2 diabetes mellitus treated with non-insulin antidiabetes drugs. Diabetes Obes. Metab. 2013, 15, 335–341. [Google Scholar] [CrossRef] [PubMed]
- Turchin, A.; Matheny, M.E.; Shubina, M.; Scanlon, J.V.; Greenwood, B.; Pendergrass, M.L. Hypoglycemia and clinical outcomes in patients with diabetes hospitalized in the general ward. Diabetes Care 2009, 32, 1153–1157. [Google Scholar] [CrossRef] [PubMed]
- Blosch, A.K.; Chernoff, A.; Nijjar, P.S. Can hypoglycemia be used as a marker of outcome in hospitalized non-diabetics. J. Clin. Lipidol. 2010, 4. [Google Scholar] [CrossRef]
- Farrokhi, F.; Klindukhova, O.; Chandra, P.; Peng, L.; Smiley, D.; Newton, C.; Umpierrez, G. Risk factors for inpatient hypoglycemia during subcutaneous insulin therapy in non-critically ill patients with type 2 diabetes. J. Diabetes Sci. Technol. 2012, 6, 1022–1029. [Google Scholar] [CrossRef] [PubMed]
- Garg, R.; Hurwitz, S.; Turchin, A.; Trivedi, A. Hypoglycemia, with or without insulin therapy, is associated with increased mortality among hospitalized patients. Diabetes Care 2013, 36, 1107–1110. [Google Scholar] [CrossRef] [PubMed] [Green Version]
- Quilliam, B.J.; Simeone, J.C.; Ozbay, A.B. Risk factors for hypoglycemia-related hospitalization in patients with type 2 diabetes: A nested case–control study. Clin. Ther. 2011, 33, 1781–1791. [Google Scholar] [CrossRef] [PubMed]
- Zhang, Y.; Wieffer, H.; Modha, R.; Balar, B.; Pollack, M.; Krishnarajah, G. The burden of hypoglycemia in type 2 diabetes: A systematic review of patient and economic perspectives. J. Clin. Outcomes Manag. 2010, 17, 547–557. [Google Scholar]
- Babitsch, B.; Gohl, D.; von Lengerke, T. Re-revisiting Andersen’s behavioral model of health services use: A systematic review of studies from 1998–2011. Psychosoc. Med. 2012, 9. [Google Scholar] [CrossRef]
- Aday, L.A.; Andersen, R. A framework for the study of access to medical care. Health Serv. Res. 1974, 9, 208–220. [Google Scholar] [PubMed]
- Andersen, R. Revisiting the behavioral model and access to medical care: Does it matter? J. Health Soc. Behav. 1995, 36, 1–10. [Google Scholar] [CrossRef] [PubMed]
- Andersen, R.; Aday, L.A. Access to medical care in the U.S.: Realized and potential. Med. Care 1978, 16, 533–546. [Google Scholar] [CrossRef] [PubMed]
- Andersen, R.; Newman, J.F. Societal and individual determinants of medical care Utilization in the United States. Milbank Mem. Fund Q. Health Soc. 1973, 51, 95–124. [Google Scholar] [CrossRef] [PubMed]
- Wan, T.T.H.; Yates, A.S. Prediction of dental services utilization: A multivariate approach. Inquiry 1975, 12, 143–156. [Google Scholar] [PubMed]
- Chern, J.Y.; Wan, T.T.H.; Begun, J.W. A structural equation modeling approach to examining the predictive power of determinants of individuals’ health expenditures. J. Med. Syst. 2002, 26, 323–336. [Google Scholar] [CrossRef] [PubMed]
- Wan, T.T.H.; Soifer, S.J. Determinants of physician utilization: A causal analysis. J. Health Soc. Behav. 1974, 15, 100–108. [Google Scholar] [CrossRef] [PubMed]
- Bloomfield, H.E.; Greer, N.; Newman, D.; MacDonald, R.; Carlyle, M.; Fitzgerald, P.; Wilt, T.J. Predictors and Consequences of Severe Hypoglycemia in Adults with Diabetes—A Systematic Review of the Evidence. 2012. Available online: https://login.ezproxy.net.ucf.edu/login?auth=shibb&url=http://search.ebscohost.com/login.aspx?direct=true&db=cmedm&AN=23256228&site=ehost-live (accessed on 18 July 2016).
- Wan, T.T.H.; Soifer, S.J. A multivariate analysis of the determinants of physician utilization. Socioecon. Plan. Sci. 1975, 9, 229–237. [Google Scholar] [CrossRef]
- AHRQ.gov. Overview of the National (Nationwide) Inpatient Sample (NIS). HCUP Databases. Available online: https://www.hcup-us.ahrq.gov/nisoverview.jsp (accessed on 10 February 2017).
- HCUP-us.ahrq.gov. Overview of HCUP. Available online: https://www.hcup-us.ahrq.gov/overview.jsp (accessed on 15 March 2017).
- Wang, N.E.A.; Shandro, J.; Sohoni, A.; Fassl, B.A. Practical Guide to Pediatric Emergency Medicine: Caring for Children in the Emergency Department; Cambridge University Press: Cambridge, UK, 2011. [Google Scholar]
- Brook, C.G.D.; Clayton, P.; Brown, R. Brook’s Clinical Pediatric Endocrinology, 6th ed.; John Wiley & Sons Press: Hoboken, NJ, USA, 2010. [Google Scholar]
- Naik, D.; Shyamasunder, A.H.; Mruthyunjaya, M.D.; Gupta Patil, R.; Paul, T.V.; Christina, F.; Thomas, N. Masked hypoglycemia in pregnancy. J. Diabetes 2017, 9. [Google Scholar] [CrossRef] [PubMed]
- Wallis, J. Hypoglycaemia in Pregnancy. In Midwives Magazine; Academic OneFile: Farmington Hills, MI, USA, 2008; pp. 18–19. [Google Scholar]
- Adelmann, P.K. Mental and substance use disorders among Medicaid recipients: Prevalence estimates from two national surveys. Adm. Policy Ment. Health 2003, 31, 111–129. [Google Scholar] [CrossRef] [PubMed]
- Fayfman, M.; Vellanki, P.; Alexopoulos, A.S.; Buehler, L.; Zhao, L.; Smiley, D.; Umpierrez, G.E. Report on Racial Disparities in Hospitalized Patients with Hyperglycemia and Diabetes. J. Clin. Endocrinol. Metab. 2016, 101, 1144–1150. [Google Scholar] [CrossRef] [PubMed] [Green Version]
- Khunti, K.; Davies, M.; Majeed, A.; Thorsted, B.L.; Wolden, M.L.; Paul, S.K. Hypoglycemia and risk of cardiovascular disease and all-cause mortality in insulin-treated people with type 1 and type 2 Diabetes: A cohort study. Diabetes Care 2015, 38, 316–322. [Google Scholar] [CrossRef] [PubMed]
- Moen, M.F.; Zhan, M.; Hsu, V.D.; Walker, L.D.; Einhorn, L.M.; Seliger, S.L.; Fink, J.C. Frequency of hypoglycemia and its significance in chronic kidney disease. Clin. J. Am. Soc. Nephrol. 2009, 4, 1121–1127. [Google Scholar] [CrossRef] [PubMed]
- Nirantharakumar, K.; Marshall, T.; Kennedy, A.; Narendran, P.; Hemming, K.; Coleman, J.J. Hypoglycaemia is associated with increased length of stay and mortality in people with diabetes who are hospitalized. Diabet. Med. 2012, 29, e445–e448. [Google Scholar] [CrossRef] [PubMed]
- Patel, I.; Erickson, S.R.; Caldwell, C.H.; Woolford, S.J.; Bagozzi, R.P.; Chang, J.; Balkrishnan, R. Predictors of medication adherence and persistence in Medicaid enrollees with developmental disabilities and type 2 diabetes. Res. Soc. Adm. Pharm. 2015, 12, 592–603. [Google Scholar] [CrossRef] [PubMed]
- Dtreg.com. DTREG Software for Predictive Modeling and Forecasting. Available online: https://www.dtreg.com/methodology (accessed on 16 January 2017).
- Wan, T.T.H. Evidence-Based Healthcare Management: Multivariate Modeling Approaches; Kluwer Academic Publishers: Boston, MA, USA, 2002. [Google Scholar]
- Kline, R.B. Principles and Practice of Structural Equation Modeling; Guilford Press: New York, NY, USA, 2005. [Google Scholar]
- Hauke, J.; Kossowski, T. Comparison of values of Pearson’s and spearman’s correlation coefficients on the same sets of data. Quaest. Geogr. 2011, 30, 87–93. [Google Scholar] [CrossRef]
- Weston, R.; Gore, P.A. A Brief Guide to Structural Equation Modeling. Couns. Psychol. 2006, 34, 719–751. [Google Scholar] [CrossRef]
- Wan, T.T.H. Population Health Management for Poly Chronic Conditions: Evidence-Based Approaches; Springer Press: New York, NY, USA, 2018. [Google Scholar]
- United Health Foundation. Florida Annual Report. Available online: http://www.americashealthrankings.org/explore/2015-annual-report/measure/Diabetes/state/FL (accessed on 16 January 2017).
- Wan, T.T.H.; Lin, Y.L.; Ortiz, J. Racial disparities in diabetes hospitalization of rural Medicare beneficiaries in 8 Southeastern States. Health Serv. Res. Manag. Epidemiol. 2016, 3. [Google Scholar] [CrossRef] [PubMed]
- CMS.gov. Hospital Value-Based Purchasing. Available online: https://www.cms.gov/Medicare/Quality-Initiatives-Patient-Assessment-Instruments/Value-Based-Programs/HVBP/Hospital-Value-Based-Purchasing.html (accessed on 18 February 2017).
- Wagner, K. Shifting Gears. Healthc. Exec. 2015, 30, 10–18. [Google Scholar] [PubMed]
- Ramirez, B.; West, D.J.; Costell, M.M. Development of a culture of sustainability in health care organizations. J. Health Organ. Manag. 2013, 27, 665–672. [Google Scholar] [CrossRef] [PubMed]
- Henkel, R.J.; Maryland, P.A. The risks and rewards of value-based reimbursement. Front. Health Serv. Manag. 2015, 32, 3–16. [Google Scholar] [CrossRef]
- Wan, T.T.H. A population health approach to care management interventions and healthcare artificial intelligence. J. Biomed. Res. Pract. 2017, 1, 1–8. [Google Scholar]
- Marathe, K.R.; Wan, T.T.H.; Marathe, S. A Systematic Review on the KAP-O Framework for Diabetes Education and Research. Med. Res. Arch. 2016, 4, 1–21. [Google Scholar]
- Clarka, S.E.; Elswickb, S.; Gabrielb, M.; Gurupur, V.; Wisniewski, P. Transitions of care: A patient-centered perspective of health information systems that support post-acute care. J. Integr. Des. Process Sci. 2016, 20, 95–110. [Google Scholar] [CrossRef]
- Amiel, S.A.; Dixon, T.; Mann, R.; Jameson, K. Hypoglycaemia in type 2 diabetes. Diabet. Med. 2008, 25, 245–254. [Google Scholar] [CrossRef] [PubMed]
- Karges, B.; Rosenbauer, J.; Holterhus, P.M.; Beyer, P.; Seithe, H.; Vogel, C.; Initiative, D.P.V. Hospital admission for diabetic ketoacidosis or severe hypoglycemia in 31,330 young patients with type 1 diabetes. Eur. J. Endocrinol. 2015, 173, 341–350. [Google Scholar] [CrossRef] [PubMed]
- Chan, S.P.; Colagiuri, S. Systematic review and meta-analysis of the efficacy and hypoglycemic safety of gliclazide versus other insulinotropic agents. Diabetes Res. Clin. Pract. 2015, 110, 75–81. [Google Scholar] [CrossRef] [PubMed]
- Handelsman, Y.; Bode, B.W.; Endahl, L.A.; Mersebach, H.; King, A.B. Patients achieving good glycemic control (Hba1c < 7%) experience a lower rate of hypoglycemia with insulin degludec than With insulin glargine: A meta-analysis of Phase 3a Trials. Endocr. Pract. 2015, 21, 917–926. [Google Scholar] [CrossRef]
- Heller, S.R.; Frier, B.M.; Herslov, M.L.; Gundgaard, J.; Gough, S.C. Severe hypoglycaemia in adults with insulin-treated diabetes: Impact on healthcare resources. Diabet. Med. 2016, 33, 471–477. [Google Scholar] [CrossRef] [PubMed]
- Monami, M.; Dicembrini, I.; Kundisova, L.; Zannoni, S.; Nreu, B.; Mannucci, E. A meta-analysis of the hypoglycaemic risk in randomized controlled trials with sulphonylureas in patients with type 2 diabetes. Diabetes Obes. Metab. 2014, 16, 833–840. [Google Scholar] [CrossRef] [PubMed]
- Thompson, A.E. Hypoglycemia. JAMA 2015, 313, 1284. [Google Scholar] [CrossRef] [PubMed] [Green Version]
- Dżygało, K.; Golicki, D.; Kowalska, A.; Szypowska, A. The beneficial effect of insulin degludec on nocturnal hypoglycaemia and insulin dose in type 1 diabetic patients: A aystematic review and meta-analysis of randomised trials. Acta Diabetol. 2015, 52, 231–238. [Google Scholar] [CrossRef] [PubMed]
- Kendall, C.; Wooltorton, E. People with diabetes should avoid antibiotic gatifloxacin. CMAJ 2006, 174, 1089–1090. [Google Scholar] [CrossRef] [PubMed] [Green Version]
- Gangji, A.S.; Gerstein, H.C.; Goldsmith, C.H.; Clase, C.M. A systematic review and meta-analysis of hypoglycemia and cardiovascular events: A comparison of glyburide with other secretagogues and with insulin. Diabetes Care 2007, 30, 389–394. [Google Scholar] [CrossRef] [PubMed]
- Hermanides, J.; Vriesendorp, T.M.; Dotsch, R.; Rosendaal, F.R.; Zandstra, D.F.; Hoekstra, J.B.L.; DeVries, J.H. Hypoglycemia is associated with intensive care unit mortality. Crit. Care Med. 2010, 38, 1430–1434. [Google Scholar] [CrossRef] [PubMed]
- Zapatero, A.; Gomez-Huelgas, R.; Gonzalez, N.; Canora, J.; Asenjo, A.; Hinojosa, J.; Barba, R. Frequency of hypoglycemia and its impact on length of stay, mortality, and short-term readmission in patients with diabetes hospitalized in internal medicine wards. Endocr. Pract. 2014, 20, 870–875. [Google Scholar] [CrossRef] [PubMed]
- Hirsch, I.B.; Bode, B.; Courreges, J.P.; Dykiel, P.; Franek, E.; Hermansen, K.; King, A.; Mersebach, H.; Davies, M. Insulin degludec/insulin aspart administered once daily at any meal, with insulin aspart at other meals versus a standard basal-bolus regimen in patients with type 1 diabetes: A 26-week, phase 3, randomized, open-label, treat-to-target trial. Diabetes Care 2012, 35, 2174–2181. [Google Scholar] [CrossRef] [PubMed]
- Kaur, G.; Markley, B.; Schlauch, K.; Izuora, K.E. Outcomes of less intensive glycemic target for a subcutaneous insulin protocol in hospitalized patients. Am. J. Med. Sci. 2015, 350, 442–446. [Google Scholar] [CrossRef] [PubMed]


| Variable Name | Variable Type | Definition | Scale | |
|---|---|---|---|---|
| Predisposing Component (P) | ||||
| 1 | Age | Exogenous | Age of the patient. All adults 18 years and above | Continuous in years |
| 2 | Gender | Exogenous | Male or Female | Categorical (Dichotomous): Male = 0; Female = 1 |
| 3 | AA_Hisp | Exogenous | The ethnicity of the patient. Whether patient’s ethnicity is African American or Hispanic or not | Categorical: 1 = African American or Hispanic; 0 = Others |
| 4 | Dementia | Exogenous | Patient has dementia or not | Categorical (Dichotomous): No dementia = 0; Yes = 1 |
| 5 | No Depression | Exogenous | Patient has no depression | Categorical (Dichotomous) No depression = 1; Depression = 0 |
| 6 | Healthy lifestyle (HLS) | Exogenous | Refer to the healthy lifestyle for the patient, which is tobacco-free, alcohol-free, and no drug abuse | Categorical: 2 = Patient has a healthy lifestyle with no smoking, no alcohol, and no drugs; 1 = Patient does one of the above; 0 = Patient does 2 or more of the above. |
| Enabling Component (E) | ||||
| 1 | Medicaid | Exogenous | Whether the patient is covered by Medicaid or not | Categorical (Dichotomous): Medicaid = 1; Others (Medicare, Private, no insurance) = 0 |
| 2 | SES | Exogenous | The socio-economic status of the patient based on the median household income for patient | Categorical: 1 = 0–25th percentile; 2 = 26th to 50th percentile; 3 = 51st to 75th percentile; 4 = 76th to 100th percentile |
| 3 | Urban_hosp | Exogenous | Hospital located in an Urban or rural area | Categorical (Dichotomous): Urban = 1; Rural = 0 |
| 4 | Patient Location | Exogenous | Patient home location. Based on the location’s county population. | Categorical: 1 = Not metropolitan or micropolitan county; 2 = Micropolitan county; 3 = Counties in metro areas of 50,000–249,999 population; 4 = Counties in metro areas of 250,000–999,999 population; 5 = Counties of metro areas of ≥1 million population |
| Need Component (N) | ||||
| 1 | DM Complications | Exogenous | Patient has any DM specific complication (eye, neurological, cardiac, renal, others) | Categorical (Dichotomous): No complications = 0; Yes = 1 |
| 2 | Uncontrolled DM | Exogenous | Patient has DM that is uncontrolled | Categorical (Dichotomous): No = 0; Yes =1 (AIC > 7.0%) |
| 3 | DMII | Exogenous | Patient is T2DM | Categorical (Dichotomous): T2DM = 1; T1DM = 0 |
| 4 | BMI underweight | Exogenous | Patient BMI category is underweight | Categorical (Dichotomous): No = 0; Yes = 1 |
| 5 | Hypertension | Exogenous | Patient has hypertension | Categorical (Dichotomous): No = 0; Yes = 1 |
| 6 | Hyperlipidemia | Exogenous | Patient has hyperlipidemia | Categorical (Dichotomous): No = 0; Yes = 1 |
| 7 | Liver_dis | Exogenous | Patient has moderate to severe liver disease | Categorical (Dichotomous): No = 0; Yes = 1 |
| 8 | Renal_disease | Exogenous | Patient has Renal disease | Categorical (Dichotomous): No = 0; Yes = 1 |
| 9 | Cancer | Exogenous | Patient has malignancy | Categorical (Dichotomous): No = 0; Yes = 1 |
| 10 | Charlson Comorbidity Index (CCI) | Control | Score of the CCI | Categorical. Scores 1–25 |
| Utilization (U) | ||||
| 1 | Hospital LOS | Endogenous | Patient days in the hospital | Continuous: in days |
| 2 | Cost | Endogenous | Total charges in US$ for the admission | Continuous: in USD |
| Valid | Missing | Mean | Std. Deviation | Skewness | Kurtosis | Range | Min. | Max. | Sum | |
|---|---|---|---|---|---|---|---|---|---|---|
| Age | 4822 | 0 | 58.42 | 17.08 | −0.22 | −0.64 | 72 | 18 | 90 | 281,700 |
| Sex | 4822 | 0 | 0.48 | 0.50 | 0.08 | −1.99 | 1 | 0 | 1 | 2317 |
| AA_Hisp | 4822 | 0 | 0.32 | 0.47 | 0.78 | −1.40 | 1 | 0 | 1 | 1540 |
| Dementia | 4822 | 0 | 0.08 | 0.27 | 2.94 | 7.88 | 1 | 0 | 1 | 377 |
| No_Depression | 4822 | 0 | 0.61 | 0.49 | −0.44 | −1.81 | 1 | 0 | 1 | 2928 |
| HLS | 4822 | 0 | 1.57 | 0.68 | −1.31 | 0.34 | 2 | 0 | 2 | 7592 |
| Urban_hosp | 4822 | 0 | 0.77 | 0.42 | −1.30 | −0.31 | 1 | 0 | 1 | 3726 |
| Patient_Loc | 4822 | 0 | 4.18 | 1.16 | −1.30 | 0.59 | 4 | 1 | 5 | 20,140 |
| SES | 4822 | 0 | 2.21 | 1.07 | 0.36 | −1.14 | 3 | 1 | 4 | 10,678 |
| Medicaid | 4822 | 0 | 0.19 | 0.39 | 1.57 | 0.46 | 1 | 0 | 1 | 924 |
| CCI | 4822 | 0 | 2.43 | 2.43 | 1.36 | 2.22 | 16 | 0 | 16 | 11,715 |
| DM_comp | 4822 | 0 | 0.23 | 0.42 | 1.28 | −0.37 | 1 | 0 | 1 | 1113 |
| Uncont DM | 4822 | 0 | 0.24 | 0.42 | 1.24 | −0.45 | 1 | 0 | 1 | 1138 |
| DMII | 4822 | 0 | 0.85 | 0.35 | −2.01 | 2.04 | 1 | 0 | 1 | 4120 |
| Under_Wt | 4822 | 0 | 0.14 | 0.34 | 3.84 | 8.53 | 1 | 0 | 1 | 476 |
| Hyper-lipidemia | 4822 | 0 | 0.40 | 0.49 | 0.39 | −1.85 | 1 | 0 | 1 | 1947 |
| Renal_Disease | 4822 | 0 | 0.29 | 0.45 | 0.95 | −1.10 | 1 | 0 | 1 | 1380 |
| Liver_dis | 4822 | 0 | 0.06 | 0.23 | 3.82 | 12.61 | 1 | 0 | 1 | 275 |
| Hyper-tension | 4822 | 0 | 0.76 | 0.43 | −1.24 | −0.47 | 1 | 0 | 1 | 3679 |
| Cancer | 4822 | 0 | 0.08 | 0.27 | 3.13 | 7.82 | 1 | 0 | 1 | 379 |
| LoS | 4822 | 0 | 3.59 | 3.56 | 2.71 | 9.97 | 27 | 0 | 27 | 17,287 |
| TOTCHG | 4822 | 0 | 27,305 | 27,381 | 2.75 | 9.86 | 205,786 | 1713 | 207,499 | 131,662,579 |
| Outcome | 4822 | 0 | 0.90 | 0.98 | 0.30 | −1.70 | 3 | 0 | 3 | 4336 |
| YEAR | 4822 | 0 | 2013 | 0.82 | 0.00 | −1.50 | 2 | 2012 | 2014 | 9,706,689 |
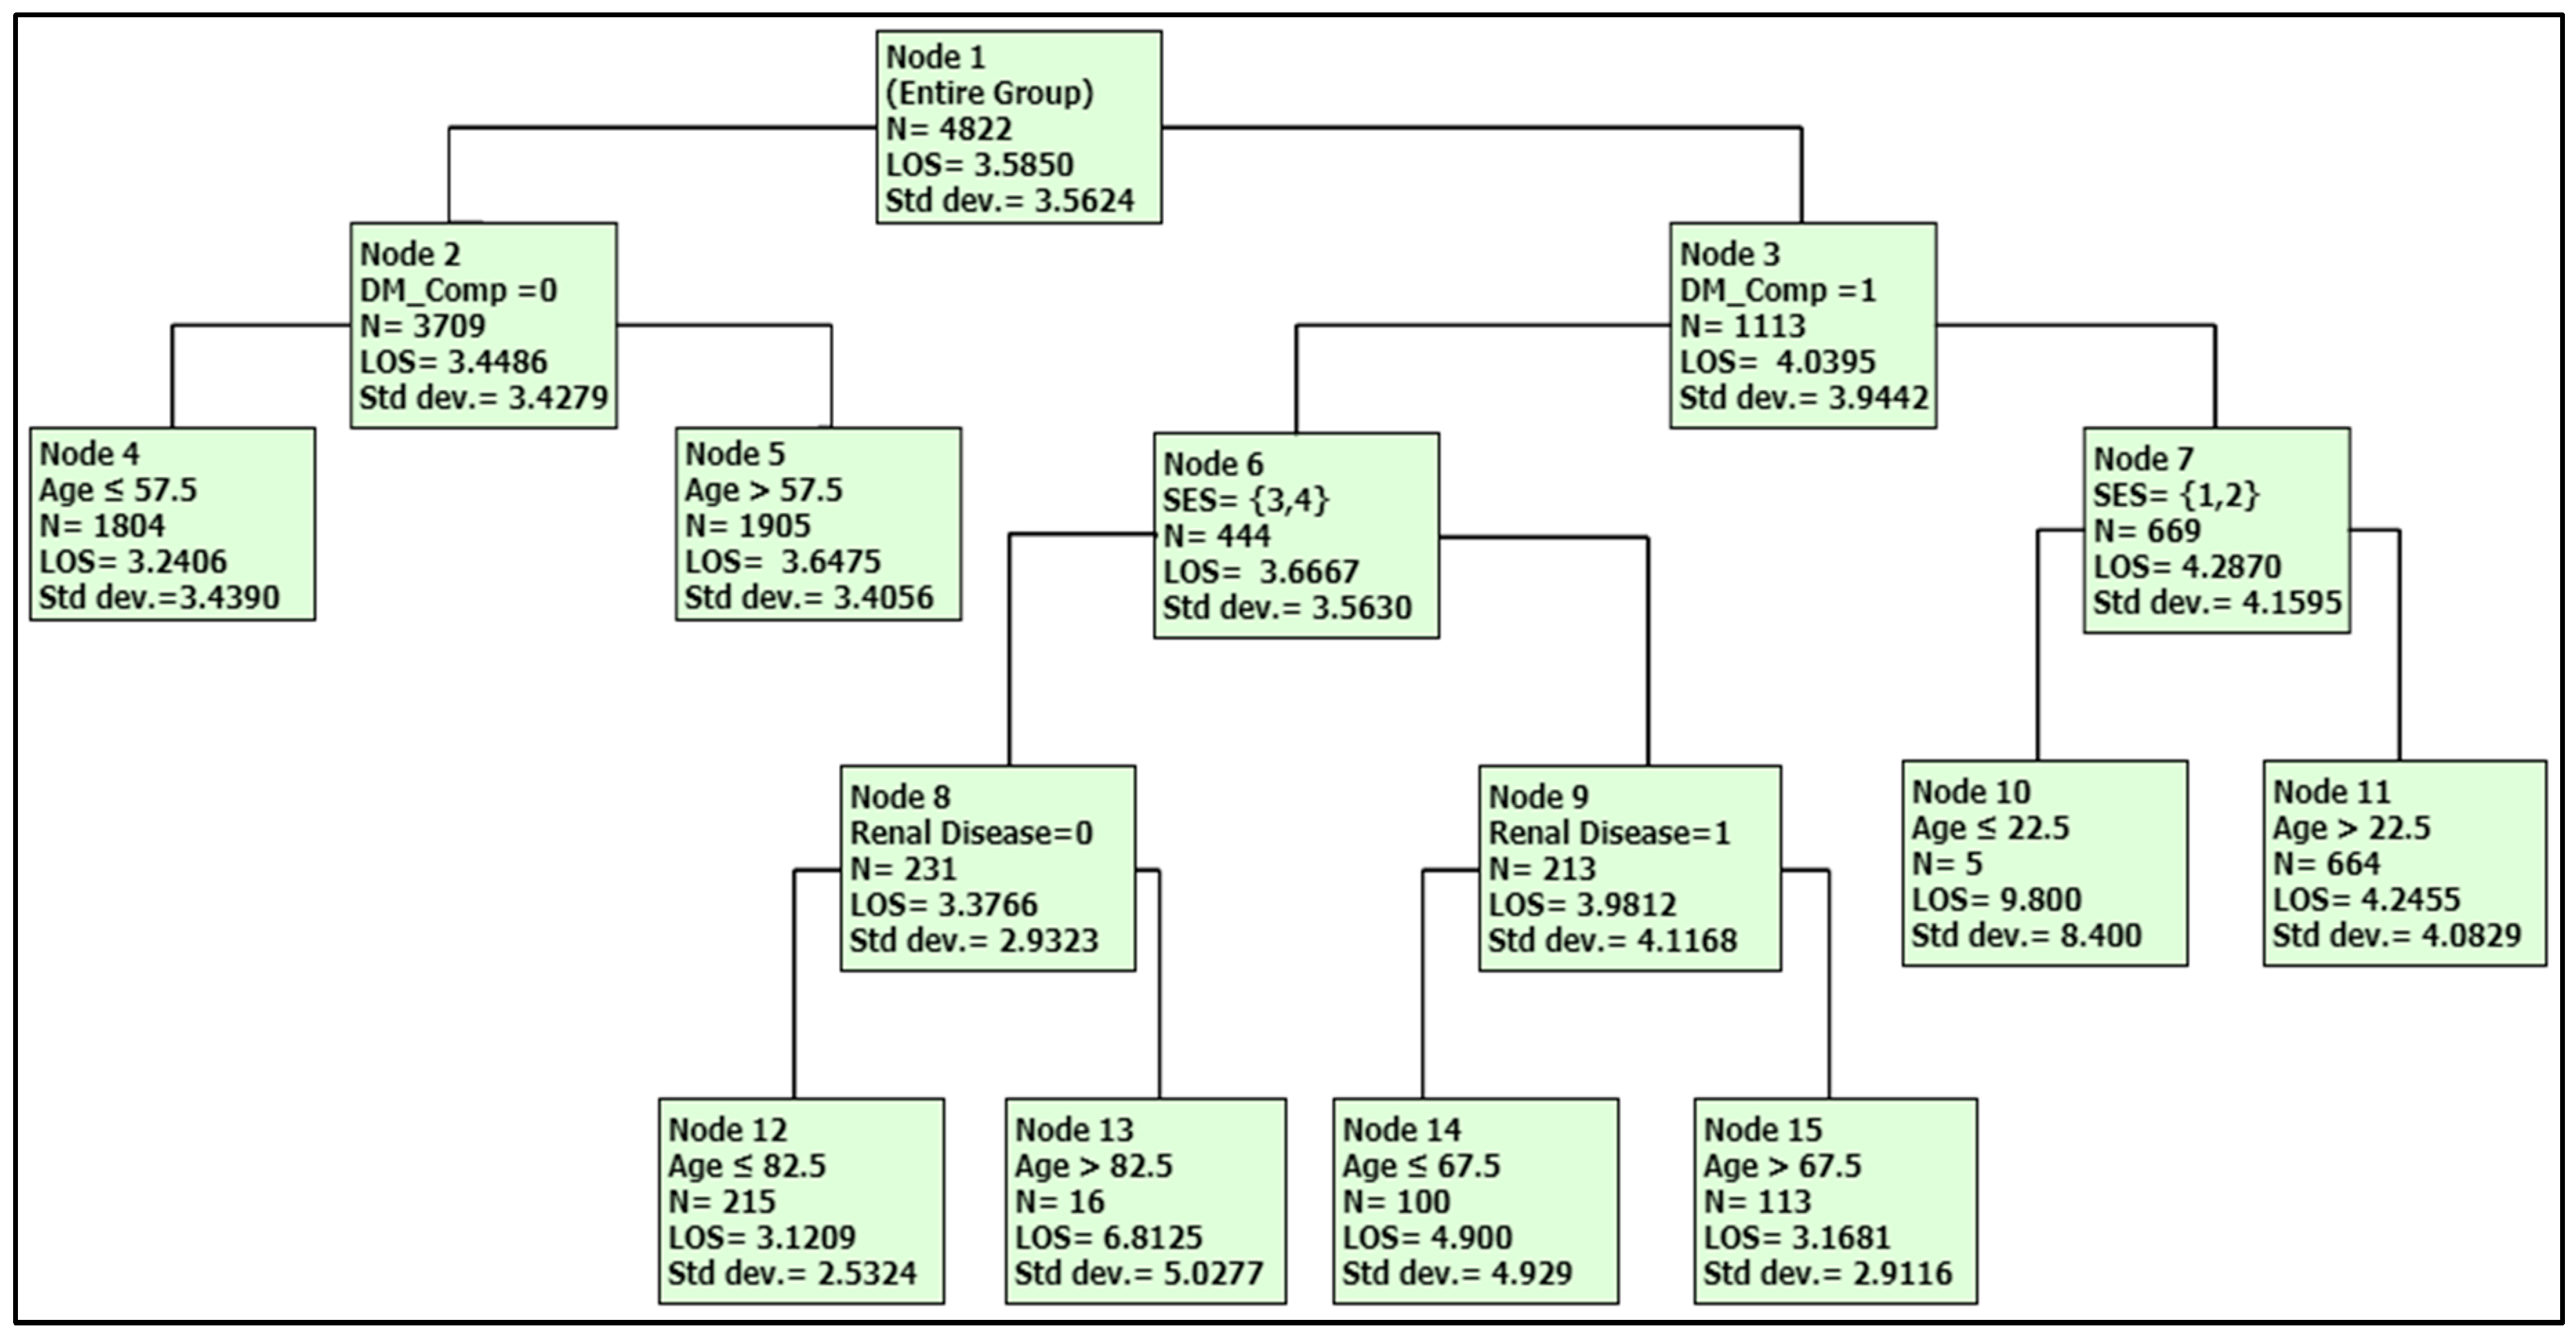
| LOS/ Node | Characteristics |
|---|---|
| 9.80 (Node 10) | Age < 22.5, with DM complications, SES 1,2 |
| 6.80 (Node 13) | Age > 82.5, with DM complications, no renal disease, SES 3,4 |
| 4.90 (Node 14) | Age < 67.5, with DM complications and Renal disease, SES 3,4 |
| 4.24 (Node 11) | Age > 22.5, with DM complications, SES 1,2 |
| 3.64 (Node 5) | Age > 57.5 with no DM complication |
| 3.24 (Node 4) | Age < 57.5 with no DM complication |
| 3.17 (Node 15) | Age > 67.5, with DM complications and Renal disease, SES 3,4 |
| 3.12 (Node 12) | Age < 82.5, with DM complications, no renal disease, SES 3,4 |
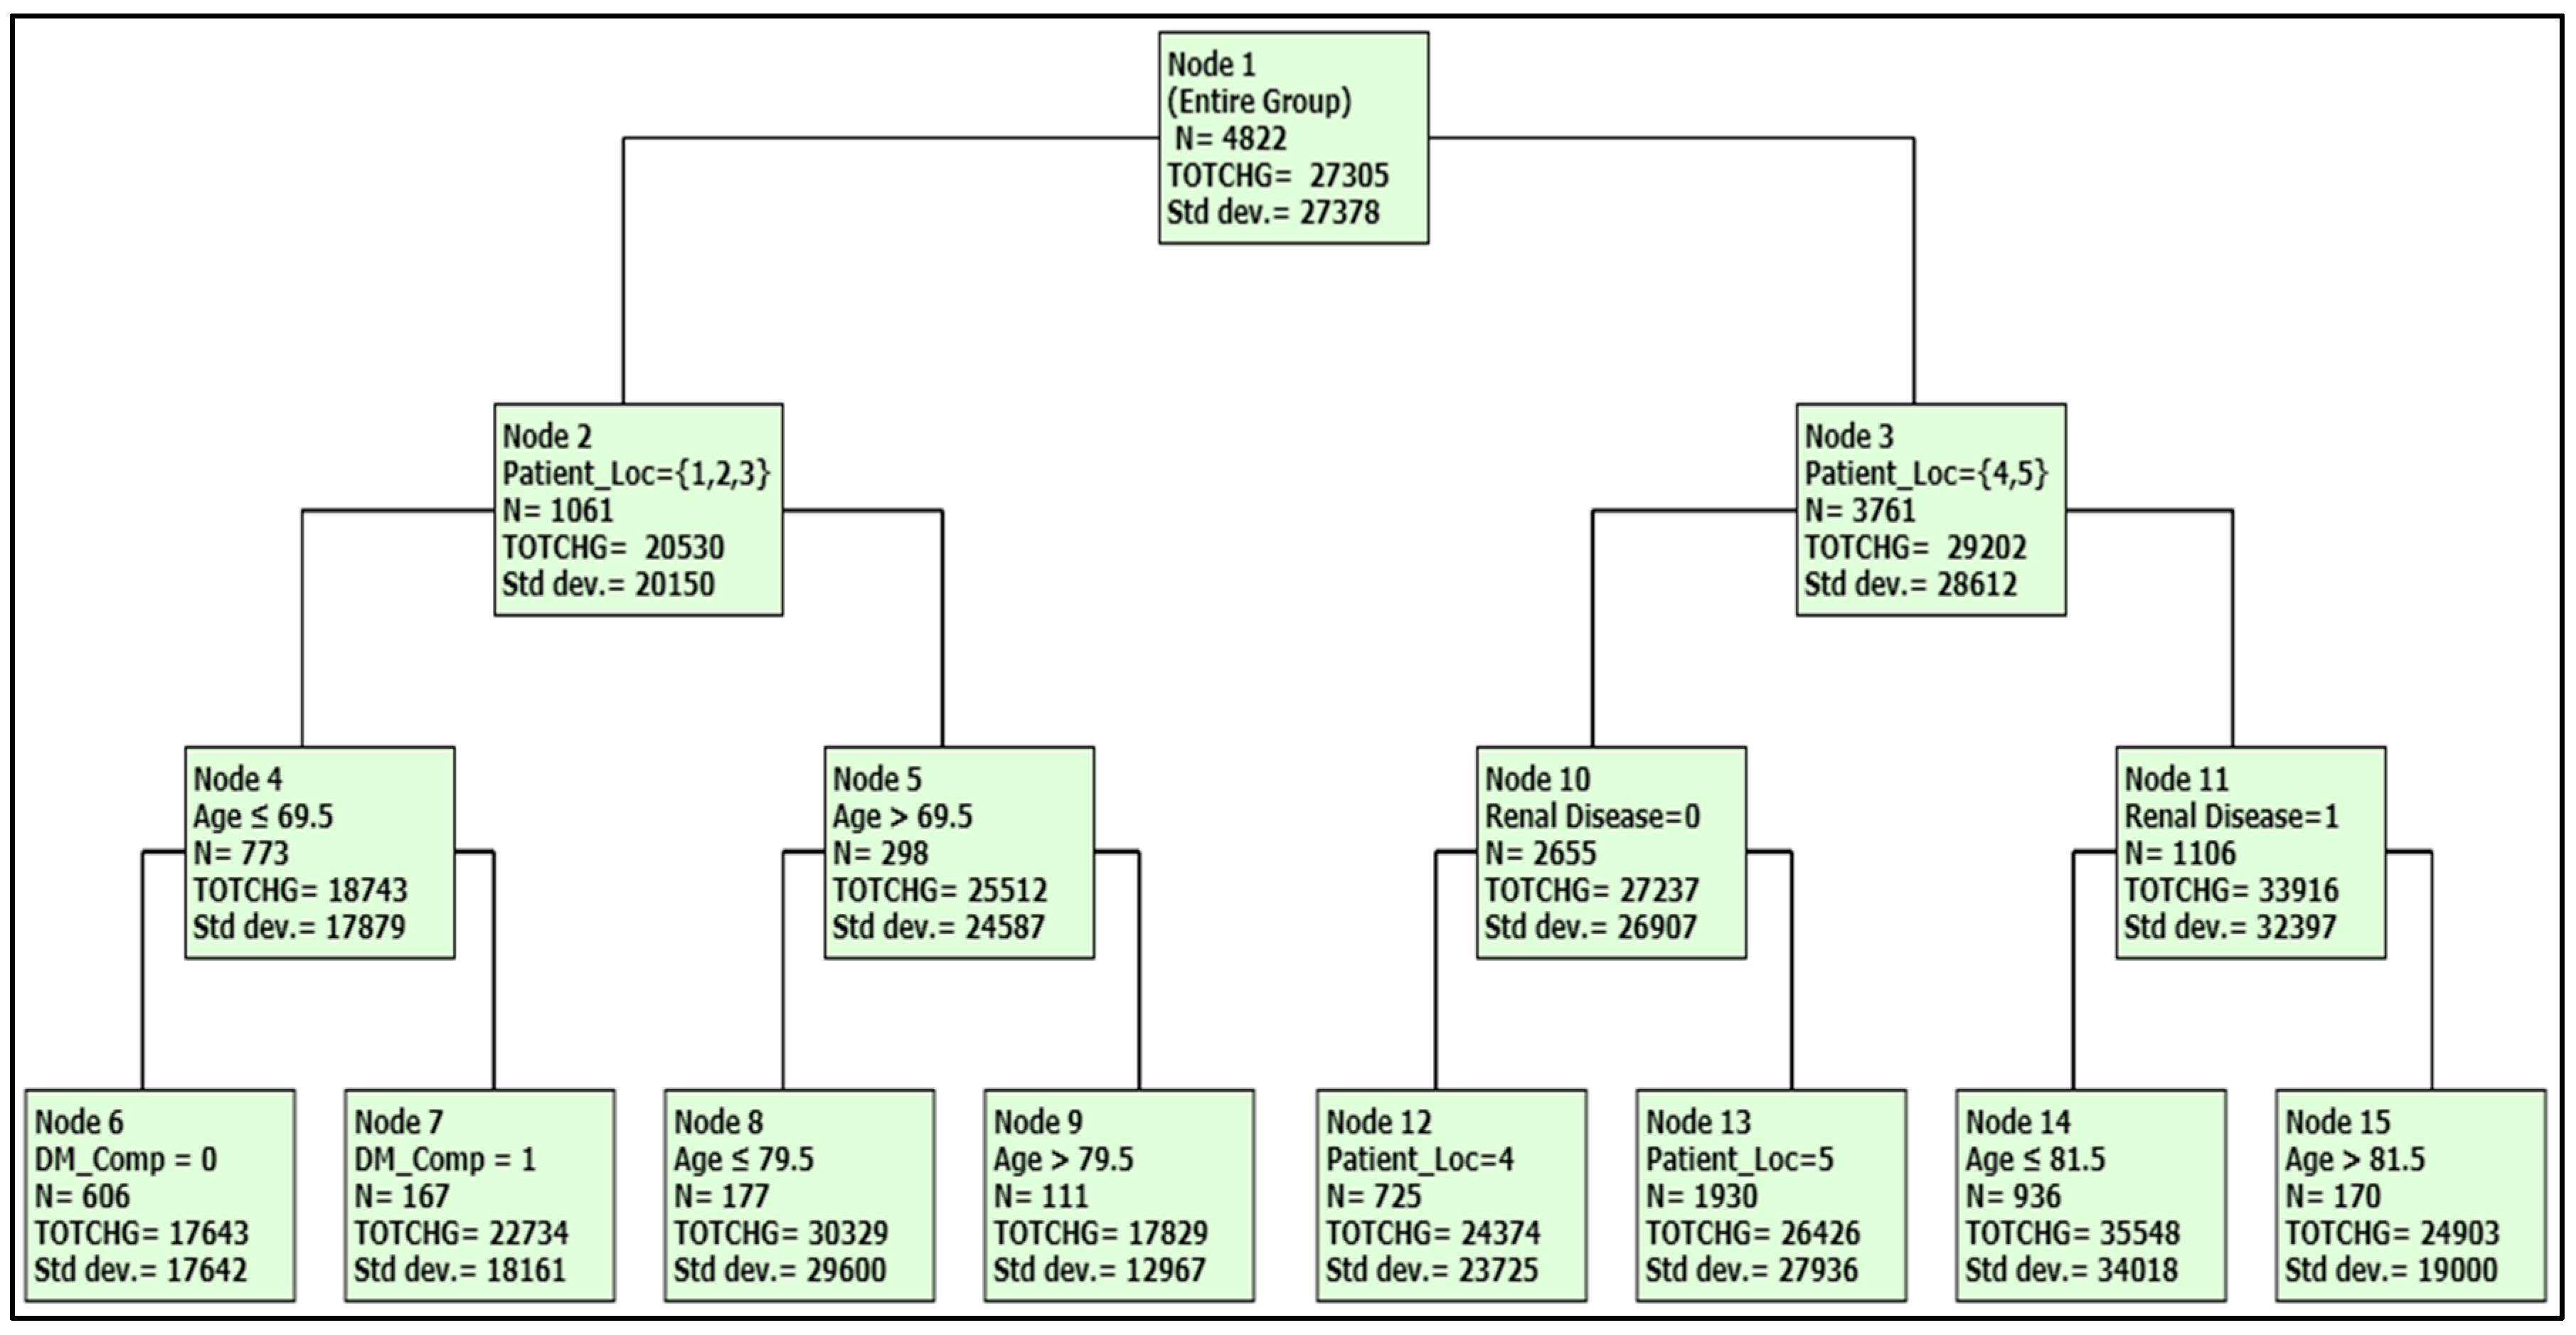
| Total Charge ($)/Node | Characteristics |
|---|---|
| 35,548 (Node 14) | Age < 81.5 with renal disease, Patient location 4, 5 |
| 30,329 (Node 8) | Age 70–80, Patient location 1, 2, 3 |
| 28,426 (Node 13 | Patient location 5 and no Renal disease |
| 24,933 (Node 15) | Age > 81.5 with renal disease, Patient location 4, 5 |
| 24,074 (Node 12) | Patient location 4 and no Renal disease |
| 22,734 (Node 7) | Age < 70, with DM comp, Patient location 1, 2, 3 |
| 17,829 (Node 9) | Age > 80, Patient location 1, 2, 3 |
| 17,643 (Node 6) | Age < 70, no DM comp, Patient location 1, 2, 3 |
© 2018 by the authors. Licensee MDPI, Basel, Switzerland. This article is an open access article distributed under the terms and conditions of the Creative Commons Attribution (CC BY) license (http://creativecommons.org/licenses/by/4.0/).
Share and Cite
Kattan, W.; Wan, T.T.H. Factors Influencing Variations in Hospitalization for Diabetes with Hypoglycemia. J. Clin. Med. 2018, 7, 367. https://doi.org/10.3390/jcm7100367
Kattan W, Wan TTH. Factors Influencing Variations in Hospitalization for Diabetes with Hypoglycemia. Journal of Clinical Medicine. 2018; 7(10):367. https://doi.org/10.3390/jcm7100367
Chicago/Turabian StyleKattan, Waleed, and Thomas T. H. Wan. 2018. "Factors Influencing Variations in Hospitalization for Diabetes with Hypoglycemia" Journal of Clinical Medicine 7, no. 10: 367. https://doi.org/10.3390/jcm7100367