
Association of the Calcification Score of the Abdominal Aorta, Common Iliac, and Renal Arteries with Outcomes in Living Kidney Donors
 , ,
, ,
Abstract
:1. Introduction
2. Materials and Methods
2.1. Subjects and Study Design
2.2. Outcome Parameters
2.3. Statistical Analysis
3. Results
3.1. Overall
3.2. Main Differences between Groups
3.2.1. At 1 Year
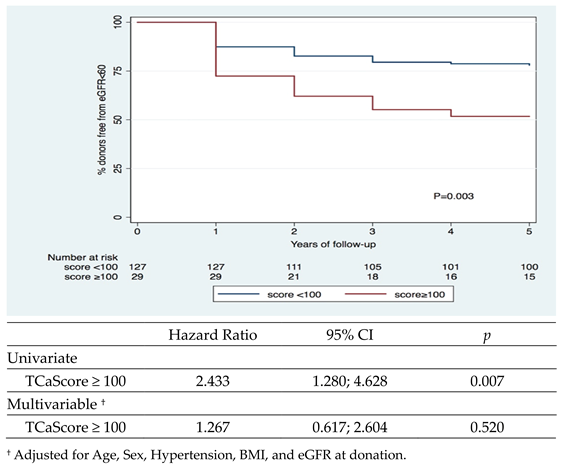
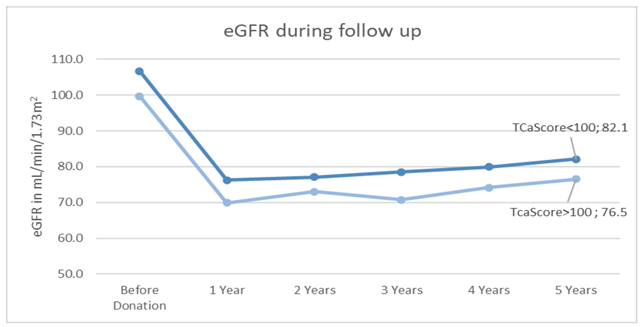
3.2.2. At 5 Years
4. Discussion
5. Conclusions
Author Contributions
Funding
Institutional Review Board Statement
Informed Consent Statement
Data Availability Statement
Conflicts of Interest
References
- Webster, A.C.; Nagler, E.V.; Morton, R.L.; Masson, P. Chronic Kidney Disease. Lancet 2017, 389, 1238–1252. [Google Scholar] [CrossRef] [PubMed]
- Sociedade Portuguesa de Nefrologia. DIA MUNDIAL DO RIM 2021. 2021. Available online: https://www.spnefro.pt/dia_mundial_do_rim/dia_mundial_do_rim_2021 (accessed on 10 April 2022).
- Wolfe, R.A.; Ashby, V.B.; Milford, E.L.; Ojo, A.O.; Ettenger, R.E.; Agodoa, L.Y.C.; Held, P.J.; Port, F.K. Comparison of Mortality in All Patients on Dialysis, Patients on Dialysis Awaiting Transplantation, and Recipients of a First Cadaveric Transplant. N. Engl. J. Med. 1999, 341, 1725–1730. [Google Scholar] [CrossRef] [PubMed]
- Gill, J.; Bunnapradist, S.; Danovitch, G.M.; Gjertson, D.; Gill, J.S.; Cecka, M. Outcomes of Kidney Transplantation From Older Living Donors to Older Recipients. Am. J. Kidney Dis. 2008, 52, 541–552. [Google Scholar] [CrossRef] [PubMed]
- Merion, R.M.; Ashby, V.B.; Robert Wolfe, M.A.; Distant, D.A.; Hulbert-Shearon, T.E.; Metzger, R.A.; Ojo, A.O.; Port, F.K. Deceased-Donor Characteristics and the Survival Benefit of Kidney Transplantation. JAMA 2005, 294, 2726–2733. Available online: http://jama.jamanetwork.com/ (accessed on 10 April 2022). [CrossRef] [PubMed]
- Pascual, J.; Zamora, J.; Pirsch, J.D. A Systematic Review of Kidney Transplantation From Expanded Criteria Donors. Am. J. Kidney Dis. 2008, 52, 553–586. [Google Scholar] [CrossRef]
- Fabrizii, V.; Kovarik, J.; Bodingbauer, M.; Kramar, R.; Hörl, W.H.; Winkelmayer, W.C. Long-term patient and graft survival in the Eurotransplant Senior Program: A single-center experience. Transplantation 2005, 80, 582–589. [Google Scholar] [CrossRef]
- Querard, A.H.; Foucher, Y.; Combescure, C.; Dantan, E.; Larmet, D.; Lorent, M.; Pouteau, L.-M.; Giral, M.; Gillaizeau, F. Comparison of survival outcomes between Expanded Criteria Donor and Standard Criteria Donor kidney transplant recipients: A systematic review and meta-analysis. Transpl. Int. 2016, 29, 403–415. [Google Scholar] [CrossRef]
- Lim, H.J.; Jambaldorj, E.; Lee, Y.; Kang, S.; Koo, T.; Ahn, C.; Yang, J. Increasing Use of the Expanded Criteria for Living Kidney Donation and Good Outcomes of Living Kidney Donors in Korea. Transplant. Proc. 2016, 48, 2407–2411. [Google Scholar] [CrossRef]
- Davis, C.L.; Delmonico, F.L. Living-donor kidney transplantation: A review of the current practices for the live donor. J. Am. Soc. Nephrol. 2005, 16, 2098–2110. [Google Scholar] [CrossRef]
- Naik, A.S.; Cibrik, D.M.; Sakhuja, A.; Samaniego, M.; Lu, Y.; Shahinian, V.; Norman, S.P.; Schnitzler, M.A.; Kasiske, B.L.; Segev, D.L.; et al. Temporal trends, center-level variation, and the impact of prevalent state obesity rates on acceptance of obese living kidney donors. Am. J. Transplant. 2018, 18, 642–649. [Google Scholar] [CrossRef]
- Plage, H.; Pielka, P.; Liefeldt, L.; Budde, K.; Ebbing, J.; Sugünes, N.; Miller, K.; Cash, H.; Bichmann, A.; Sattler, A.; et al. Extended criteria donors in living kidney transplantation including donor age, smoking, hypertension and BMI. Ther. Clin. Risk Manag. 2020, 16, 787–793. [Google Scholar] [CrossRef]
- Goldsmith, D.; Ritz, E.; Covic, A. Vascular Calcification: A Stiff Challenge for the Nephrologist Does Preventing Bone Disease Cause Arterial Disease? Kidney Int. 2004, 66, 1315–1333. [Google Scholar] [CrossRef]
- Golledge, J. Abdominal Aortic Calcification: Clinical Significance, Mechanisms and Therapies. Curr. Pharm. Des. 2014, 20, 5834–5838. [Google Scholar] [CrossRef]
- Gibson, A.O.; Blaha, M.J.; Arnan, M.K.; Sacco, R.L.; Szklo, M.; Herrington, D.M.; Yeboah, J. Coronary artery calcium and incident cerebrovascular events in an asymptomatic cohort the MESA study. JACC Cardiovasc. Imaging 2014, 7, 1108–1115. [Google Scholar] [CrossRef]
- Zhou, Y.; Hellberg, M.; Kouidi, E.; Deligiannis, A.; Höglund, P.; Clyne, N. Relationships between abdominal aortic calcification, glomerular filtration rate, and cardiovascular risk factors in patients with non-dialysis dependent chronic kidney disease. Clin. Nephrol. 2018, 90, 380–389. [Google Scholar] [CrossRef]
- Ichii, M.; Ishimura, E.; Shima, H.; Ohno, Y.; Ochi, A.; Nakatani, S.; Tsuda, A.; Ehara, S.; Mori, K.; Fukumoto, S.; et al. Quantitative analysis of abdominal aortic calcification in CKD patients without dialysis therapy by use of the agatston score. Kidney Blood Press. Res. 2014, 38, 196–204. [Google Scholar] [CrossRef]
- Deloach, S.S.; Joffe, M.M.; Mai, X.; Goral, S.; Rosas, S.E. Aortic calcification predicts cardiovascular events and all-cause mortality in renal transplantation. Nephrol. Dial. Transplant. 2009, 24, 1314–1319. [Google Scholar] [CrossRef]
- Tanaka, K.; Yamanaga, S.; Hidaka, Y.; Nishida, S.; Kinoshita, K.; Kaba, A.; Ishizuka, T.; Hamanoue, S.; Okumura, K.; Kawabata, C.; et al. Hba1c and aortic calcification index as noninvasive predictors of pre-existing histopathological damages in living donor kidney transplantation. J. Clin. Med. 2020, 9, 3266. [Google Scholar] [CrossRef]
- Neves, P.O.; Andrade, J.; Monção, H. Escore de cálcio coronariano: Estado atual. Radiol. Bras. 2017, 50, 182–189. [Google Scholar] [CrossRef]
- Hecht, H.S.; Cronin, P.; Blaha, M.J.; Budoff, M.J.; Kazerooni, E.A.; Narula, J.; Yankelevitz, D.; Abbara, S. 2016 SCCT/STR guidelines for coronary artery calcium scoring of noncontrast noncardiac chest CT scans: A report of the Society of Cardiovascular Computed Tomography and Society of Thoracic Radiology. J. Cardiovasc. Comput. Tomogr. 2017, 11, 74–84. [Google Scholar] [CrossRef]
- Yoon, Y.E.; Han, W.K.; Lee, H.H.; Chang, M.-Y.; Huh, K.H.; Jung, D.; Kim, Y.; Oh, Y. Abdominal Aortic Calcification in Living Kidney Donors. Transplant. Proc. 2016, 48, 720–724. [Google Scholar] [CrossRef] [PubMed]
- Benjamens, S.; Alghamdi, S.Z.; Rijkse, E.; Velde-Keyzer, C.A.T.; Berger, S.P.; Moers, C.; de Borst, M.H.; Slart, R.H.J.A.; Dor, F.J.M.F.; Minnee, R.C.; et al. Aorto-iliac artery calcification and graft outcomes in kidney transplant recipients. J. Clin. Med. 2021, 10, 325. [Google Scholar] [CrossRef]
- Tatami, Y.; Yasuda, Y.; Suzuki, S.; Ishii, H.; Sawai, A.; Shibata, Y.; Ota, T.; Shibata, K.; Niwa, M.; Morimoto, R.; et al. Impact of abdominal aortic calcification on long-term cardiovascular outcomes in patients with chronic kidney disease. Atherosclerosis 2015, 243, 349–355. [Google Scholar] [CrossRef]
- Blantz, R.C.; Steiner, R.W. Benign hyperfiltration after living kidney donation. J. Clin. Investig. 2015, 125, 972–974. [Google Scholar] [CrossRef]
- Chen, K.W.; Wu, M.W.F.; Chen, Z.; Tai, B.; Goh, Y.; Lata, R.; Vathsala, A.; Tiong, H. Compensatory Hypertrophy after Living Donor Nephrectomy. Transplant. Proc. 2016, 48, 716–719. [Google Scholar] [CrossRef]
- Rook, M.; Hofker, H.S.; van Son, W.J.; Homan Van Der Heide, J.J.; Ploeg, R.J.; Navis, G.J. Predictive capacity of pre-donation GFR and renal reserve capacity for donor renal function after living kidney donation. Am. J. Transplant. 2006, 6, 1653–1659. [Google Scholar] [CrossRef]
- Nunes-Carneiro, D.; Madanelo, M.; Silva, F.; Pestana, N.; Ribeiro, C.; Gil-Sousa, D.; Martins, L.S.; Almeida, M.; Dias, L.; Malheiro, J.; et al. Remaining kidney volume indexed to weight as a strong predictor of estimated glomerular filtration rate at 1 year and mid-term renal function after living-donor nephrectomy—A retrospective observational study. Transpl. Int. 2020, 33, 1262–1273. [Google Scholar] [CrossRef]
- Sanni, A.; Wilson, C.H.; Wyrley-Birch, H.; Vijayanand, D.; Navarro, A.; Sohrabi, S.; Jaques, B.; Rix, D.; Soomro, N.; Manas, D.; et al. Donor Risk Factors for Renal Graft Thrombosis. Transplant. Proc. 2007, 39, 138–139. [Google Scholar] [CrossRef]
- Ghadri, J.R.; Goetti, R.; Fiechter, M.; Pazhenkottil, A.P.; Küest, S.M.; Nkoulou, R.N.; Windler, C.; Buechel, R.R.; Herzog, B.A.; Gaemperli, O.; et al. Inter-scan variability of coronary artery calcium scoring assessed on 64-multidetector computed tomography vs. dual-source computed tomography: A head-to-head comparison. Eur. Heart J. 2011, 32, 1865–1874. [Google Scholar] [CrossRef]


| Total N = 156 | TCaScore < 100 N = 127 (81%) * | TCaScore ≥ 100 N = 29 (19%) * | p | |
|---|---|---|---|---|
| Age at donation, mean ± SD * | 47.6 ± 10.9 | 45.5 ± 10.6 | 56.7 ± 6.9 | <0.001 |
| Female donor, n (%) | 111 (71) | 94 (74) | 17 (59) | 0.099 |
| BMI at donation, mean ± SD * | 25.1 ± 3.5 | 24.8 ± 3.5 | 26.4 ± 2.9 | 0.019 |
| Hypertension at donation, n (%) | 26 (17) | 16 (13) | 10 (34) | 0.004 |
| Smoker, n (%) | 20 (13) | 16 (13) | 4 (14) | 0.768 |
| Dyslipidemia at donation, n (%) Missing = 3 | 86 (56) | 65 (52) | 21 (75) | 0.027 |
| eGFR at donation, mean ± SD * | 105.3 ± 13.6 | 106.6 ± 13.4 | 99.7 ± 13.5 | 0.014 |
| TCaScore, median (P25–P75) [P10–P90] * | 0 (0–50) [0–262] | 0 (0–0) [0–35] | 269 (182–564) [125–1276] | <0.001 |
| CaScore Abdominal Aorta, median (P25–P75) [P10–P90] * | 0 (0–10) [0–151] | 0 (0–0) [0–12] | 164 (117–358) [5–815] | <0.001 |
| CaScore Renal Artery, median (P25–P75) [P10–P90] * | 0 (0–0) [0–0] | 0 (0–0) [0–0] | 0 (0–0) [0–7] | <0.001 |
| CaScore Common Iliac Artery, median (P25–P75) [P10–P90] * | 0 (0–0) [0–84] | 0 (0–0) [0–9] | 99 (18–247) [0–610] | <0.001 |
| Total N = 156 | TCaScore < 100 N = 127 (81%) * | TCaScore ≥ 100 N = 29 (19%) * | p | |
|---|---|---|---|---|
| eGFR, mean ± SD * | 75.1 ± 15.7 | 76.3 ± 15.5 | 69.9 ± 15.7 | 0.048 |
| eGFR <60, n (%) * | 24 (15) | 16 (13) | 8 (28) | 0.044 |
| Proteinuria, n (%) Missing = 25 | 24 (18) | 17 (17) | 7 (25) | 0.303 |
| Dyslipidemia, n (%) Missing = 12 | 89 (62) | 69 (59) | 20 (71) | 0.243 |
Disclaimer/Publisher’s Note: The statements, opinions and data contained in all publications are solely those of the individual author(s) and contributor(s) and not of MDPI and/or the editor(s). MDPI and/or the editor(s) disclaim responsibility for any injury to people or property resulting from any ideas, methods, instructions or products referred to in the content. |
© 2023 by the authors. Licensee MDPI, Basel, Switzerland. This article is an open access article distributed under the terms and conditions of the Creative Commons Attribution (CC BY) license (https://creativecommons.org/licenses/by/4.0/).
Share and Cite
Ribeiro, L.C.; Almeida, M.; Malheiro, J.; Silva, F.; Nunes-Carneiro, D.; Martins, L.S.; Pedroso, S.; Silva-Ramos, M. Association of the Calcification Score of the Abdominal Aorta, Common Iliac, and Renal Arteries with Outcomes in Living Kidney Donors. J. Clin. Med. 2023, 12, 3339. https://doi.org/10.3390/jcm12093339
Ribeiro LC, Almeida M, Malheiro J, Silva F, Nunes-Carneiro D, Martins LS, Pedroso S, Silva-Ramos M. Association of the Calcification Score of the Abdominal Aorta, Common Iliac, and Renal Arteries with Outcomes in Living Kidney Donors. Journal of Clinical Medicine. 2023; 12(9):3339. https://doi.org/10.3390/jcm12093339
Chicago/Turabian StyleRibeiro, Luís Costa, Manuela Almeida, Jorge Malheiro, Filipa Silva, Diogo Nunes-Carneiro, La Salete Martins, Sofia Pedroso, and Miguel Silva-Ramos. 2023. "Association of the Calcification Score of the Abdominal Aorta, Common Iliac, and Renal Arteries with Outcomes in Living Kidney Donors" Journal of Clinical Medicine 12, no. 9: 3339. https://doi.org/10.3390/jcm12093339