
Minimal Clinically Important Differences in Inspiratory Muscle Function Variables after a Respiratory Muscle Training Programme in Individuals with Long-Term Post-COVID-19 Symptoms
 , , , , and
Abstract
:1. Introduction
2. Materials and Methods
2.1. Study Design
2.2. Participants
2.3. Outcome Measures
- -
- Inspiratory muscle function: Inspiratory muscle strength was assessed by the MIP using a digital mouth pressure meter (MicroRPM; Carefusion, San Diego, CA, USA), according to the American Thoracic Society/European Respiratory Society (ATS/ERS) guidelines [17]. Three trials were performed with a difference of less than 10% between them; the highest value was recorded. The estimated inspiratory muscle strength values were established following the reference equation for the adult population [18]. Inspiratory muscle endurance was measured during a constant load breathing test using the POWERbreathe KH1 device (POWERbreathe International Ltd., Southam, UK), following the instructions established in a previously published protocol [19]. Participants breathed against a submaximal inspiratory load (55% MIP at baseline) until reaching an endpoint limited by their symptoms or their inability to breathe successfully against the load. The length of time for which participants were able to breathe against this load was recorded.
- -
- Health-related quality of life: To measure HRQoL, we employed the EuroQol-5D questionnaire (EQ-5D-5L) [20], which consists of 5 dimensions with 5 response options based on severity level, ranging from 1 to 5. An index score was provided, ranging from 0 (death) to 1 (full health). Participants rated their current overall health on a visual analogue scale, ranging from 0 (poorest imaginable health) to 100 (best imaginable health).
- -
- Exercise tolerance: Cardiorespiratory fitness was assessed by the Ruffier test [21], consisting of 30 squats in 45 s, with a tempo set by a metronome (80 beats per min). Heart rate (HR) was measured after 1 min of resting (HR0), immediately after completing the 30 squats (HR1), and after a 1 min recovery (HR2). Cardiorespiratory fitness was calculated using the following index: ((HR0 + HR1 + HR2) − 200)/10. Cardiorespiratory fitness correlates with HR due to HR at rest is a general indicator of wellness, while a decline in the HR response to submaximal exercise represents an enhancement in endurance. The linearity of the HR and oxygen consumption relation has been used to predict maximal oxygen uptake in submaximal tasks [22].
- -
- Peripheral muscle strength: Lower-limb muscle strength was determined using the 1 min sit-to-stand (1-min STS) test according to a standardised protocol [23]. The number of times the participant gently touched the chair with their buttocks in 1 min, without using hands or arms to assist the movement, was recorded. Upper limb muscle strength (handgrip force) was assessed using a hand-held dynamometer (Jamar, Patterson Medical, IL, USA) [24]. Three measurements were performed for each hand, alternating sides, and the highest value was recorded.
- -
- Lung function: Pulmonary function testing was assessed using a portable spirometer (Spirobank II USB, MIR, Rome, Italy), according to ATS/ERS guidelines [25]. Measurements included forced vital capacity (FVC), forced expiratory volume in the first second (FEV1), and their ratio (FEV1/FVC).
2.4. Anchor Outcome
2.5. Data Analysis
3. Results
3.1. Findings Related with Minimal Clinically Important Difference
3.2. Comparison between Individuals with and without a Change Greater Than MCID
4. Discussion
5. Conclusions
Author Contributions
Funding
Institutional Review Board Statement
Informed Consent Statement
Data Availability Statement
Acknowledgments
Conflicts of Interest
References
- Montani, D.; Savale, L.; Noel, N.; Meyrignac, O.; Colle, R.; Gasnier, M.; Corruble, E.; Beurnier, A.; Jutant, E.-M.; Pham, T.; et al. Post-acute COVID-19 syndrome. Eur. Respir. Rev. 2022, 31, 210185. [Google Scholar] [CrossRef] [PubMed]
- Alkodaymi, M.S.; Omrani, O.A.; Fawzy, N.A.; Shaar, B.A.; Almamlouk, R.; Riaz, M.; Obeidat, M.; Obeidat, Y.; Gerberi, D.; Taha, R.M.; et al. Prevalence of post-acute COVID-19 syndrome symptoms at different follow-up periods: A systematic review and meta-analysis. Clin. Microbiol. Infect. 2022, 28, 657–666. [Google Scholar] [CrossRef]
- Hennigs, J.K.; Huwe, M.; Hennigs, A.; Oqueka, T.; Simon, M.; Harbaum, L.; Körbelin, J.; Schmiedel, S.; Wiesch, J.S.Z.; Addo, M.M.; et al. Respiratory muscle dysfunction in long-COVID patients. Infection 2022, 50, 1391–1397. [Google Scholar] [CrossRef] [PubMed]
- Singh, I.; Joseph, P.; Heerdt, P.M.; Cullinan, M.; Lutchmansingh, D.D.; Gulati, M.; Possick, J.D.; Systrom, D.M.; Waxman, A.B. Persistent Exertional Intolerance after COVID-19. Chest 2021, 161, 54–63. [Google Scholar] [CrossRef]
- Sheel, A.W.; Derchak, P.A.; Morgan, B.J.; Pegelow, D.F.; Jacques, A.J.; Dempsey, J.A. Fatiguing inspiratory muscle work causes reflex reduction in resting leg blood flow in humans. J. Physiol. 2001, 537, 277–289. [Google Scholar] [CrossRef] [PubMed]
- Terwee, C.; Dekker, F.; Wiersinga, W.; Prummel, M.; Bossuyt, P. On assessing responsiveness of health-related quality of life instruments: Guidelines for instrument evaluation. Qual. Life Res. 2003, 12, 349–362. [Google Scholar] [CrossRef]
- Jaeschke, R.; Singer, J.; Guyatt, G.H. Measurement of health status: Ascertaining the minimal clinically important difference. Control. Clin. Trials 1989, 10, 407–415. [Google Scholar] [CrossRef]
- Apaza, J.A.S.; Franco, J.V.A.; Meza, N.; Madrid, E.; Loézar, C.; Garegnani, L. Minimal clinically important difference: The basics. Medwave 2021, 21, e8149. [Google Scholar] [CrossRef] [PubMed]
- Iwakura, M.; Okura, K.; Kubota, M.; Sugawara, K.; Kawagoshi, A.; Takahashi, H.; Shioya, T. Estimation of minimal clinically important difference for quadriceps and inspiratory muscle strength in older outpatients with chronic obstructive pulmonary disease: A prospective cohort study. Phys. Ther. Res. 2021, 24, 35–42. [Google Scholar] [CrossRef] [PubMed]
- Gosselink, R.; De Vos, J.; Van Den Heuvel, S.P.; Segers, J.; Decramer, M.; Kwakkel, G. Impact of inspiratory muscle training in patients with COPD: What is the evidence? Eur. Respir. J. 2011, 37, 416–425. [Google Scholar] [CrossRef] [PubMed] [Green Version]
- Zanini, A.; Crisafulli, E.; D’Andria, M.; Gregorini, C.; Cherubino, F.; Zampogna, E.; Azzola, A.; Spanevello, A.; Schiavone, N.; Chetta, A. Minimum Clinically Important Difference in 30-s Sit-to-Stand Test after Pulmonary Rehabilitation in Subjects with COPD. Respir. Care 2019, 64, 1261–1269. [Google Scholar] [CrossRef]
- Vaidya, T.; de Bisschop, C.; Beaumont, M.; Ouksel, H.; Jean, V.; Dessables, F.; Chambellan, A. Is the 1-minute sit-to-stand test a good tool for the evaluation of the impact of pulmonary rehabilitation? Determination of the minimal important difference in COPD. Int. J. Chronic Obstr. Pulm. Dis. 2016, 11, 2609–2616. [Google Scholar] [CrossRef] [Green Version]
- Parreira, V.F.; Janaudis-Ferreira, T.; Evans, R.; Mathur, S.; Goldstein, R.S.; Brooks, D. Measurement Properties of the Incremental Shuttle Walk Test. Chest 2014, 145, 1357–1369. [Google Scholar] [CrossRef] [Green Version]
- Bohannon, R.W.; Crouch, R. Minimal clinically important difference for change in 6-minute walk test distance of adults with pathology: A systematic review. J. Evaluation Clin. Pract. 2016, 23, 377–381. [Google Scholar] [CrossRef] [PubMed]
- Del Corral, T.; Fabero-Garrido, R.; Plaza-Manzano, G.; Fernández-De-Las-Peñas, C.; Navarro-Santana, M.; López-De-Uralde-Villanueva, I. Home-based respiratory muscle training on quality of life and exercise tolerance in long-term post-COVID-19: Randomized controlled trial. Ann. Phys. Rehabil. Med. 2023, 66, 101709. [Google Scholar] [CrossRef]
- Cohen, J. Statistical Power Analysis for the Behavioral Sciences; Elsevier Science: Amsterdam, The Netherlands, 2013. [Google Scholar]
- American Thoracic Society/European Respiratory Society. ATS/ERS Statement on Respiratory Muscle Testing. Am. J. Respir. Crit. Care Med. 2002, 166, 518–624. [Google Scholar] [CrossRef]
- Morales, P.; Sanchis, J.; Cordero, P.J.; Díez, J.L. Maximum static respiratory pressures in adults. Reference values for a Caucasian Mediterranean population. Arch. Bronconeumol. 1997, 33, 213–219. [Google Scholar] [CrossRef]
- Langer, D.; Charususin, N.; Jácome, C.; Hoffman, M.; McConnell, A.; Decramer, M.; Gosselink, R. Efficacy of a Novel Method for Inspiratory Muscle Training in People with Chronic Obstructive Pulmonary Disease. Phys. Ther. 2015, 95, 1264–1273. [Google Scholar] [CrossRef] [Green Version]
- Herdman, M.; Gudex, C.; Lloyd, A.; Janssen, M.; Kind, P.; Parkin, D.; Bonsel, G.; Badia, X. Development and preliminary testing of the new five-level version of EQ-5D (EQ-5D-5L). Qual. Life Res. 2011, 20, 1727–1736. [Google Scholar] [CrossRef] [PubMed] [Green Version]
- Sartor, F.; Bonato, M.; Papini, G.; Bosio, A.; Mohammed, R.A.; Bonomi, A.G.; Moore, J.P.; Merati, G.; La Torre, A.; Kubis, H.-P. A 45-Second Self-Test for Cardiorespiratory Fitness: Heart Rate-Based Estimation in Healthy Individuals. PLoS ONE 2016, 11, e0168154. [Google Scholar] [CrossRef]
- American College of Sports Medicine. ACSM’s Guidelines for Exercise Testing and Prescription, 9th ed.; Lippincott Williams & Wilkins: Philadelphia, PA, USA, 2014. [Google Scholar]
- Núñez-Cortés, R.; Rivera-Lillo, G.; Arias-Campoverde, M.; Soto-García, D.; García-Palomera, R.; Torres-Castro, R. Use of sit-to-stand test to assess the physical capacity and exertional desaturation in patients post COVID-19. Chronic Respir. Dis. 2021, 18, 1479973121999205. [Google Scholar] [CrossRef] [PubMed]
- Peolsson, R.H.A. Intra- and inter-tester reliability and reference values for hand strength. J. Rehabil. Med. 2001, 33, 36–41. [Google Scholar] [CrossRef] [PubMed] [Green Version]
- Miller, M.R.; Crapo, R.; Hankinson, J.; Brusasco, V.; Burgos, F.; Casaburi, R.; Coates, A.; Enright, P.; van der Grinten, C.P.M.; Gustafsson, P.; et al. General considerations for lung function testing. Eur. Respir. J. 2005, 26, 153–161. [Google Scholar] [CrossRef] [PubMed] [Green Version]
- Nixon, R.; Wonderling, D.; Grieve, R. Non-parametric methods for cost-effectiveness analysis: The central limit theorem and the bootstrap compared. Health Econ. 2010, 19, 316–333. [Google Scholar] [CrossRef]
- Cohen, J. Statistical Power Analysis for the Behavioral Sciences; Lawrence Erlbaum Associates Inc.: Hillsdale, NJ, USA, 1988; Volume 18, pp. 131–132. [Google Scholar]
- Copay, A.G.; Subach, B.R.; Glassman, S.D.; Polly, D.W., Jr.; Schuler, T.C. Understanding the minimum clinically important difference: A review of concepts and methods. Spine J. 2007, 7, 541–546. [Google Scholar] [CrossRef]
- Pautz, N.; Olivier, B.; Steyn, F. The use of nonparametric effect sizes in single study musculoskeletal physiotherapy research: A practical primer. Phys. Ther. Sport 2018, 33, 117–124. [Google Scholar] [CrossRef]
- McNarry, M.A.; Berg, R.M.; Shelley, J.; Hudson, J.; Saynor, Z.L.; Duckers, J.; Lewis, K.; Davies, G.A.; Mackintosh, K.A. Inspiratory muscle training enhances recovery post-COVID-19: A randomised controlled trial. Eur. Respir. J. 2022, 60, 2103101. [Google Scholar] [CrossRef]
- Joosten, E.; DeFuentes-Merillas, L.; de Weert, G.; Sensky, T.; van der Staak, C.; de Jong, C. Systematic Review of the Effects of Shared Decision-Making on Patient Satisfaction, Treatment Adherence and Health Status. Psychother. Psychosom. 2008, 77, 219–226. [Google Scholar] [CrossRef]
- Balbás-Álvarez, L.; Candelas-Fernández, P.; Del Corral, T.; La Touche, R.; López-De-Uralde-Villanueva, I. Effect of Manual Therapy, Motor Control Exercise, and Inspiratory Muscle Training on Maximum Inspiratory Pressure and Postural Measures in Moderate Smokers: A Randomized Controlled Trial. J. Manip. Physiol. Ther. 2018, 41, 372–382. [Google Scholar] [CrossRef]
- Riddle, D.L.; Stratford, P.W. Is This Change Real?: Interpreting Patient Outcomes in Physical Therapy; F.A. Davis Company: Philadelphia, PA, USA, 2013. [Google Scholar]
- King, M.T. A point of minimal important difference (MID): A critique of terminology and methods. Expert Rev. Pharm. Outcomes Res. 2011, 11, 171–184. [Google Scholar] [CrossRef]
- Decramer, M. Treatment of chronic respiratory failure: Lung volume reduction surgery versus rehabilitation. Eur. Respir. J. 2003, 22, 47s–56s. [Google Scholar] [CrossRef] [PubMed] [Green Version]
- Souza, R.M.; Cardim, A.B.; Maia, T.O.; Rocha, L.G.; Bezerra, S.D.; Marinho, P.M. Inspiratory muscle strength, diaphragmatic mobility, and body composition in chronic obstructive pulmonary disease. Physiother. Res. Int. 2019, 24, e1766. [Google Scholar] [CrossRef] [PubMed]
- Windisch, W.; Hennings, E.; Sorichter, S.; Hamm, H.; Criée, C. Peak or plateau maximal inspiratory mouth pressure: Which is best? Eur. Respir. J. 2004, 23, 708–713. [Google Scholar] [CrossRef] [PubMed] [Green Version]


| Outcome | Group | Mean ± SD; Median (IQR) | Within-Group Differences p-Value; r Effect Size | ||
|---|---|---|---|---|---|
| Baseline | Post-Training | ΔPre-Post | |||
| MIP (cmH2O) | Improved | 78.45 ± 19.24 75 (64–94) | 117.41 ± 26.3 117 (100.5–130) | 38.97 ± 17.37 36 (28–50) | p < 0.001; r = 0.87 |
| Stable/not improved | 97.92 ± 22 93 (82.5–113) | 117.77 ± 20.47 114 (104.5–139) | 19.85 ± 15.97 17 (11–26) | p < 0.001; r = 0.83 | |
| Between-group differences for ΔPre-Post training p-value; r effect size | p < 0.001; r = 0.50 | ||||
| MIP (% pred) | Improved | 74.95 ± 15.57 73.75 (66.63–87.09) | 112.19 ± 20.87 114.10 (100.62–130.55) | 37.23 ± 15.21 365.75 (24.34–52.54) | p < 0.001; r = 0.87 |
| Stable/not improved | 91.4 ± 13.86 95.91 (80.24–100.77) | 110.82 ± 16.21 111.61 (99.46–120.88) | 19.42 ± 16.76 18.14 (9.74–21.76) | p < 0.001; r = 0.83 | |
| Between-group differences for ΔPre-Post training p-value; r effect size | p < 0.001; r = 0.50 | ||||
| IME (sec) | Improved | 200.17 ± 104.89 173 (117–286.5) | 511.48 ± 151 | 311.31 ± 149.21 347 (225–428) | p < 0.001; r = 0.87 |
| 494 (412–638) | |||||
| Stable/not improved | 166.23 ± 79.98 145 (113–182.5) | 352.62 ± 128.23 343 (263.5–420.5) | 186.38 ± 147.83 174 (85–291) | p < 0.001; r = 0.83 | |
| Between-group differences for ΔPre-Post training p-value; r effect size | p = 0.02; r = 0.36 | ||||
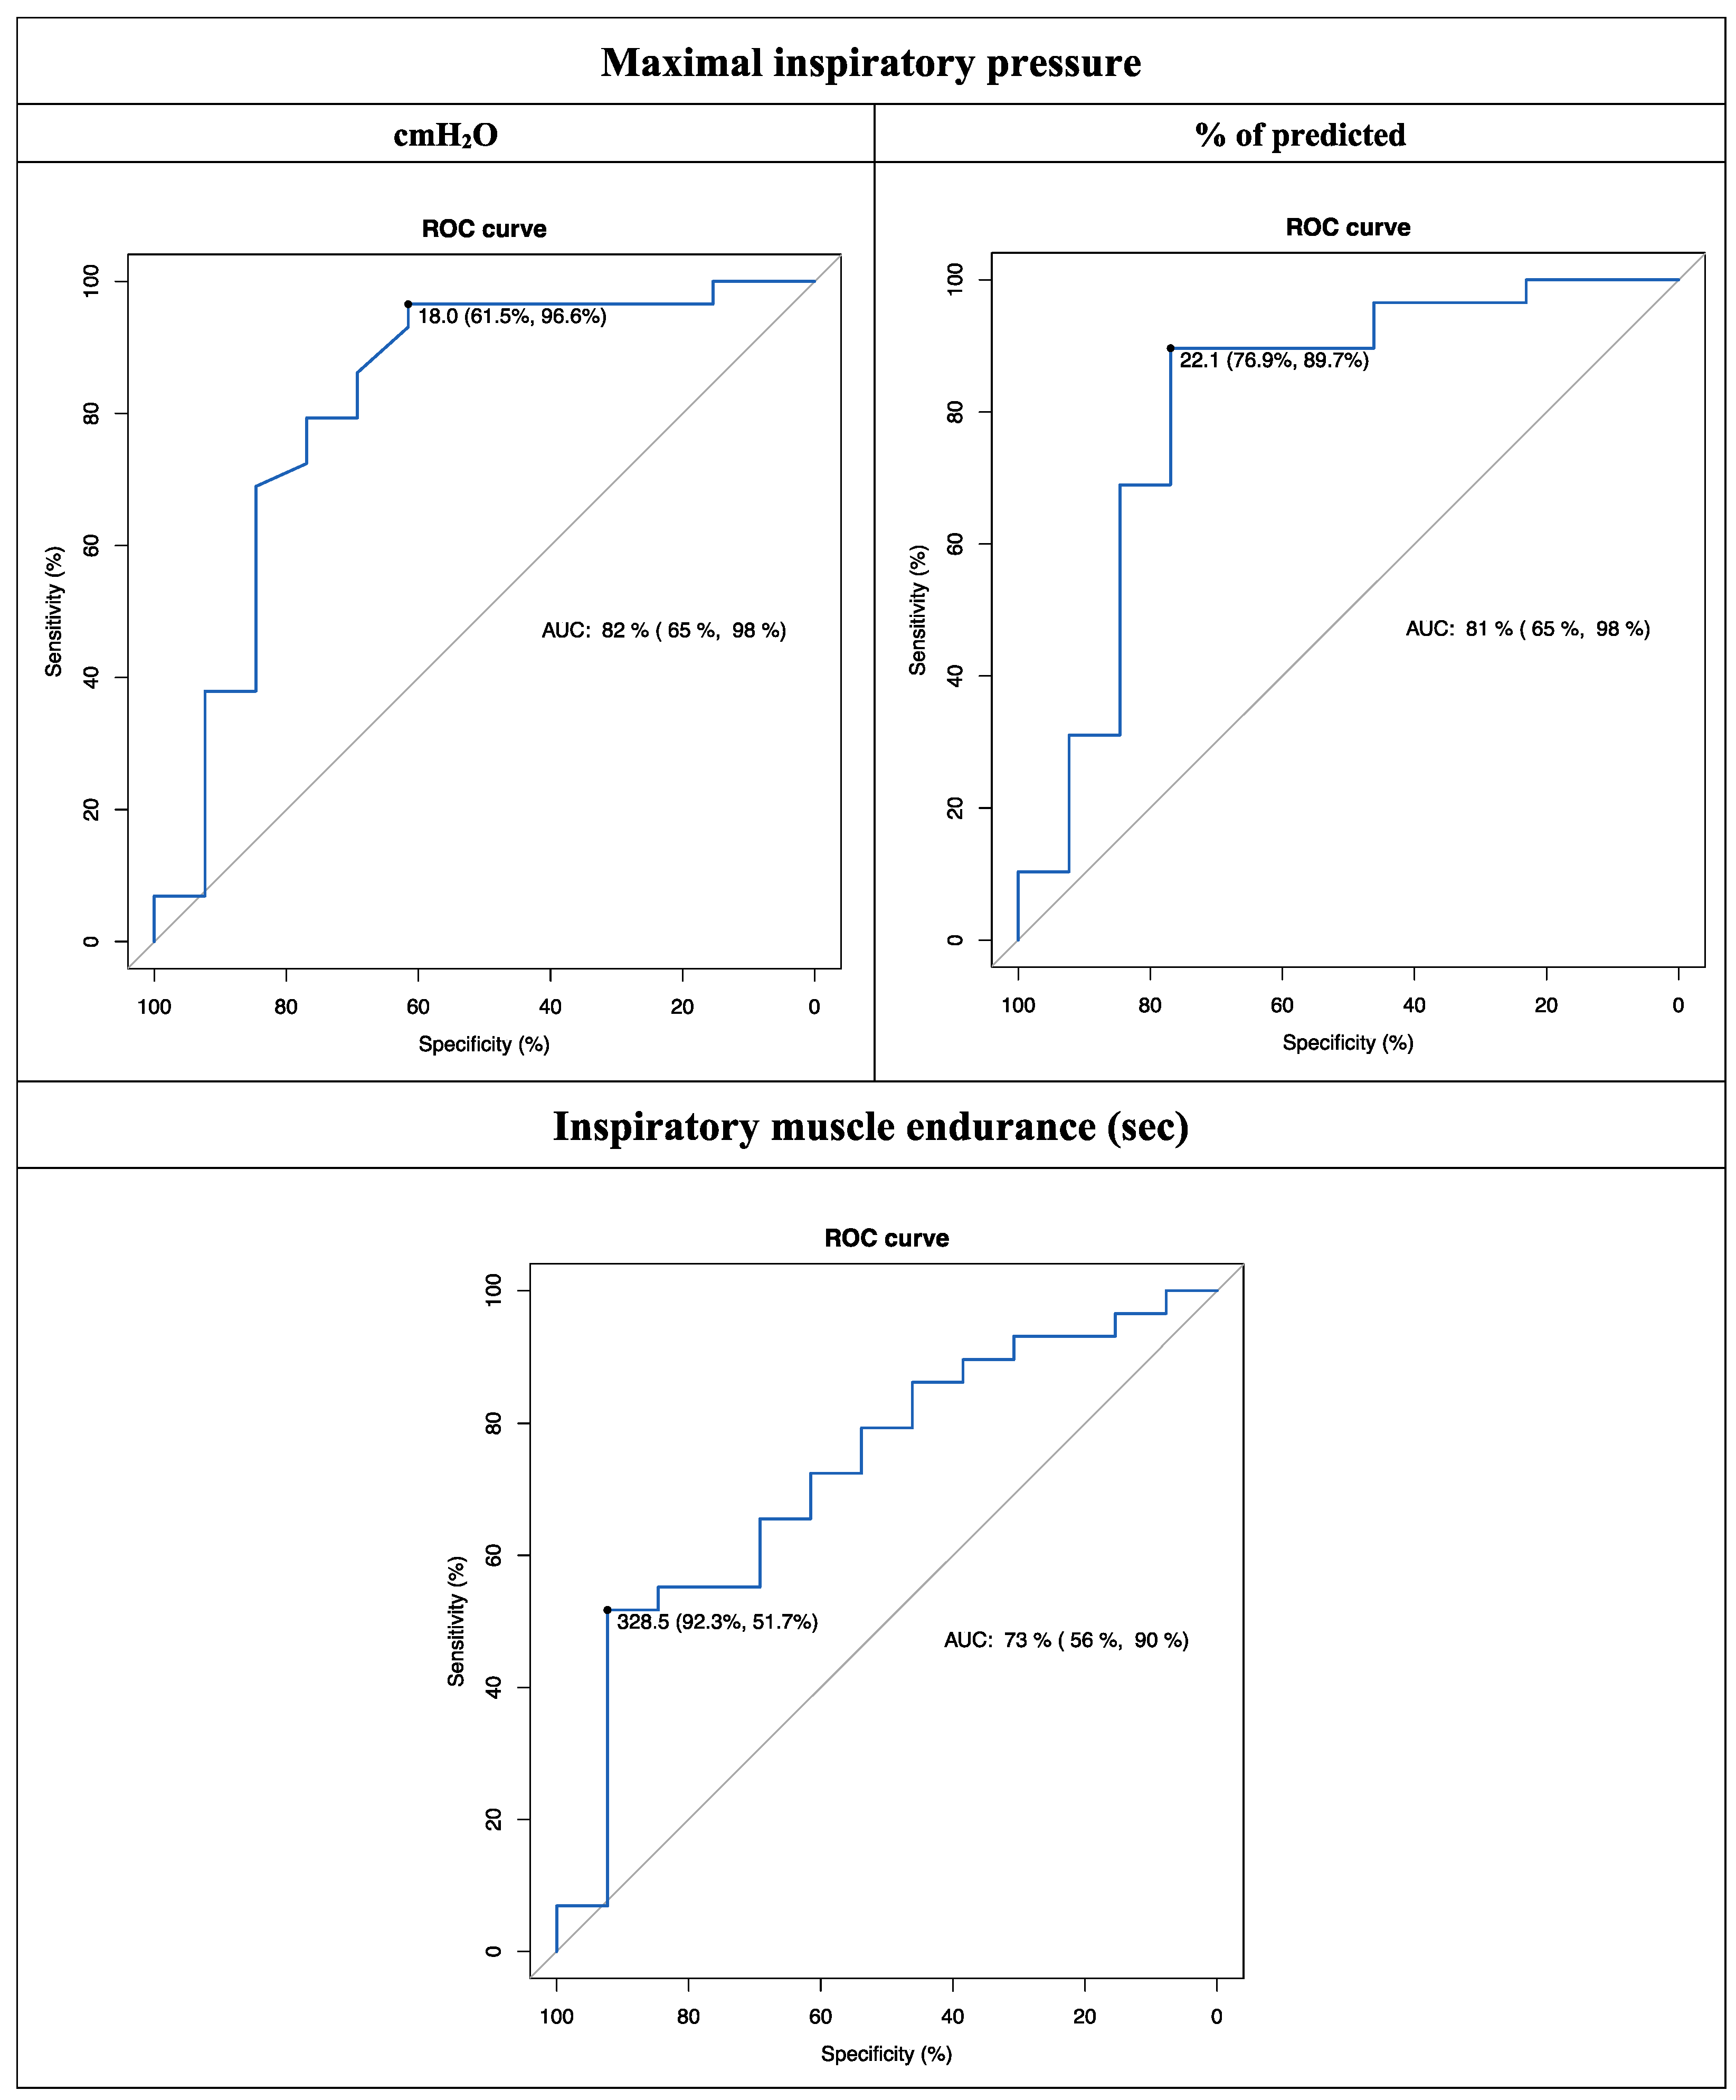
| Outcome | MCID | AUC (95% CI) | Sensitivity | Specificity | Youden Index | LR+ | LR− |
|---|---|---|---|---|---|---|---|
| MIP (cmH2O) | 18 | 0.82 (0.65 to 0.98) | 61.5 | 96.6 | 0.581 | 18.1 | 0.4 |
| MIP (% pred) | 22.1 | 0.81 (0.65 to 0.98) | 76.9 | 89.7 | 0.666 | 7.5 | 0.3 |
| IME (sec) | 328.5 | 0.73 (0.56 to 0.90) | 92.3 | 51.7 | 0.44 | 1.9 | 0.1 |
| Outcome | Maximal Inspiratory Pressure (MCID = 18 cmH2O) | Maximal Inspiratory Pressure (MCID = 22.1% of pred.) | Inspiratory Muscle Endurance (MCID = 328.5 s) | Between-Group Differences p-Value; r Effect Size
| |||
|---|---|---|---|---|---|---|---|
| Did not exceed MCID | Exceeded MCID | Did not exceed MCID | Exceeded MCID | Did not exceed MCID | Exceeded MCID | ||
| Inspiratory muscle function | |||||||
| MIP (cmH2O) | — — | — — | — — | — — | 26.31 ± 19.83 22.5 (14–34) a | 44 ± 11.15 49 (33.5–51) a |
|
| MIP (% pred) | — — | — — | — — | — — | 23.23 ± 14.71 22.78 (14.53–28.67) a | 45.52 ± 12.57 51.36 (36.4–52.94) a |
|
| IME (sec) | 116.56 ± 111.07 121 (60–174) b | 315.21 ± 142.3 310 (229–428) a | 168.23 ± 125.32 174 (85–250) a | 319.45 ± 150.24 347 (229–457) a | — — | — — |
|
| HRQoL | |||||||
| EQ-5D-5L, index | 0.145 ± 0.136 0.11 (0.049–0.214) a | 0.205 ± 0.172 0.22 (0.09–0.302) a | 0.12 ± 0.155 0.11 (0.023–0.214) a | 0.225 ± 0.162 0.23 (0.133–0.322) a | 0.152 ± 0.146 0.167 (0.023–0.253) a | 0.258 ± 0.178 0.254 (0.166–0.380) a |
|
| EQ-5D-5L, VAS | 6.67 ± 7.5 5 (5–10) b | 20.67 ± 12.23 20 (14–28) a | 8.08 ± 11.46 5 (5–15) b | 21.97 ± 10.88 20 (15–28) a | 12.46 ± 9.82 14.5 (5–20) a | 26.12 ± 12.55 24 (17.5–35) a |
|
| Exercise tolerance | |||||||
| Ruffier index | −0.62 ± 2.38 −1.2 (−2.2–−0.3) | −1.39 ± 2.72 −1.9 (−2.7–0.1) a | −0.19 ± 2.34 −0.3 (−1.2–1.3) | −1.69 ± 2.67 −2.2 (−3–0) a | −0.87 ± 2.12 −1.2 (−2.3–0.1) b | −1.82 ± 3.32 −2.35 (−3.55–0.35) b |
|
| Peripheral muscle strength | |||||||
| 1 min STS (n of squats) | 10.67 ± 9.57 11 (4–18) b | 12.52 ± 10.34 13 (7–17) a | 7.23 ± 11.4 6 (4–13) b | 14.31 ± 8.8 14 (9–17) a | 10 ± 10.19 10 (4–16) a | 15.56 ± 9.23 15.5 (11–20) a |
|
| Handgrip (Kg) | −1 ± 3.85 −1 (−4–−0.5) | 1.21 ± 4.82 2 (−2.5–3) | −0.77 ± 3.53 −1 (−3.5–−0.5) | 1.41 ± 5.02 2 (−2.5–3) | 0.98 ± 5.43 −0.5 (−2.5–4) | 0.34 ± 3.23 1.5 (−2.75–2.5) |
|
| Lung function | |||||||
| FVC (% pred) | −3.78 ± 10.32 −2 (−9–3) | 5.27 ± 11.13 3 (0–9) a | −0.77 ± 12.36 −2 (−6–3) | 5.17 ± 10.77 3 (1–9) a | 0.5 ± 12.43 0 (−3–3) | 7.94 ± 8.12 6 (2–10.5) a |
|
| FEV1 (% pred) | −1.33 ± 8.63 2 (−4–3) | 2.76 ± 10.59 2 (−3–6) | 1.92 ± 11.76 2 (−3–3) | 1.86 ± 9.71 2 (−3–5) | 0.88 ± 11.27 2 (−3–5) | 3.5 ± 8.39 2.5 (−1–7.5) |
|
| FEV1/FVC (%) | −0.67 ± 2.45 0 (−1–0) | −1.12 ± 3.19 −1 (−2–0) b | 0.31 ± 3.38 0 (−1–1) | −1.62 ± 2.7 −2 (−3–0) a | −0.77 ± 3.3 −0.5 (−2–0) | −1.44 ± 2.56 −1.5 (−3–0) b |
|
Disclaimer/Publisher’s Note: The statements, opinions and data contained in all publications are solely those of the individual author(s) and contributor(s) and not of MDPI and/or the editor(s). MDPI and/or the editor(s) disclaim responsibility for any injury to people or property resulting from any ideas, methods, instructions or products referred to in the content. |
© 2023 by the authors. Licensee MDPI, Basel, Switzerland. This article is an open access article distributed under the terms and conditions of the Creative Commons Attribution (CC BY) license (https://creativecommons.org/licenses/by/4.0/).
Share and Cite
del Corral, T.; Fabero-Garrido, R.; Plaza-Manzano, G.; Fernández-de-las-Peñas, C.; Navarro-Santana, M.J.; López-de-Uralde-Villanueva, I. Minimal Clinically Important Differences in Inspiratory Muscle Function Variables after a Respiratory Muscle Training Programme in Individuals with Long-Term Post-COVID-19 Symptoms. J. Clin. Med. 2023, 12, 2720. https://doi.org/10.3390/jcm12072720
del Corral T, Fabero-Garrido R, Plaza-Manzano G, Fernández-de-las-Peñas C, Navarro-Santana MJ, López-de-Uralde-Villanueva I. Minimal Clinically Important Differences in Inspiratory Muscle Function Variables after a Respiratory Muscle Training Programme in Individuals with Long-Term Post-COVID-19 Symptoms. Journal of Clinical Medicine. 2023; 12(7):2720. https://doi.org/10.3390/jcm12072720
Chicago/Turabian Styledel Corral, Tamara, Raúl Fabero-Garrido, Gustavo Plaza-Manzano, César Fernández-de-las-Peñas, Marcos José Navarro-Santana, and Ibai López-de-Uralde-Villanueva. 2023. "Minimal Clinically Important Differences in Inspiratory Muscle Function Variables after a Respiratory Muscle Training Programme in Individuals with Long-Term Post-COVID-19 Symptoms" Journal of Clinical Medicine 12, no. 7: 2720. https://doi.org/10.3390/jcm12072720