
Classification of Skin Cancer Using Novel Hyperspectral Imaging Engineering via YOLOv5

 ,
, 
Abstract
:1. Introduction
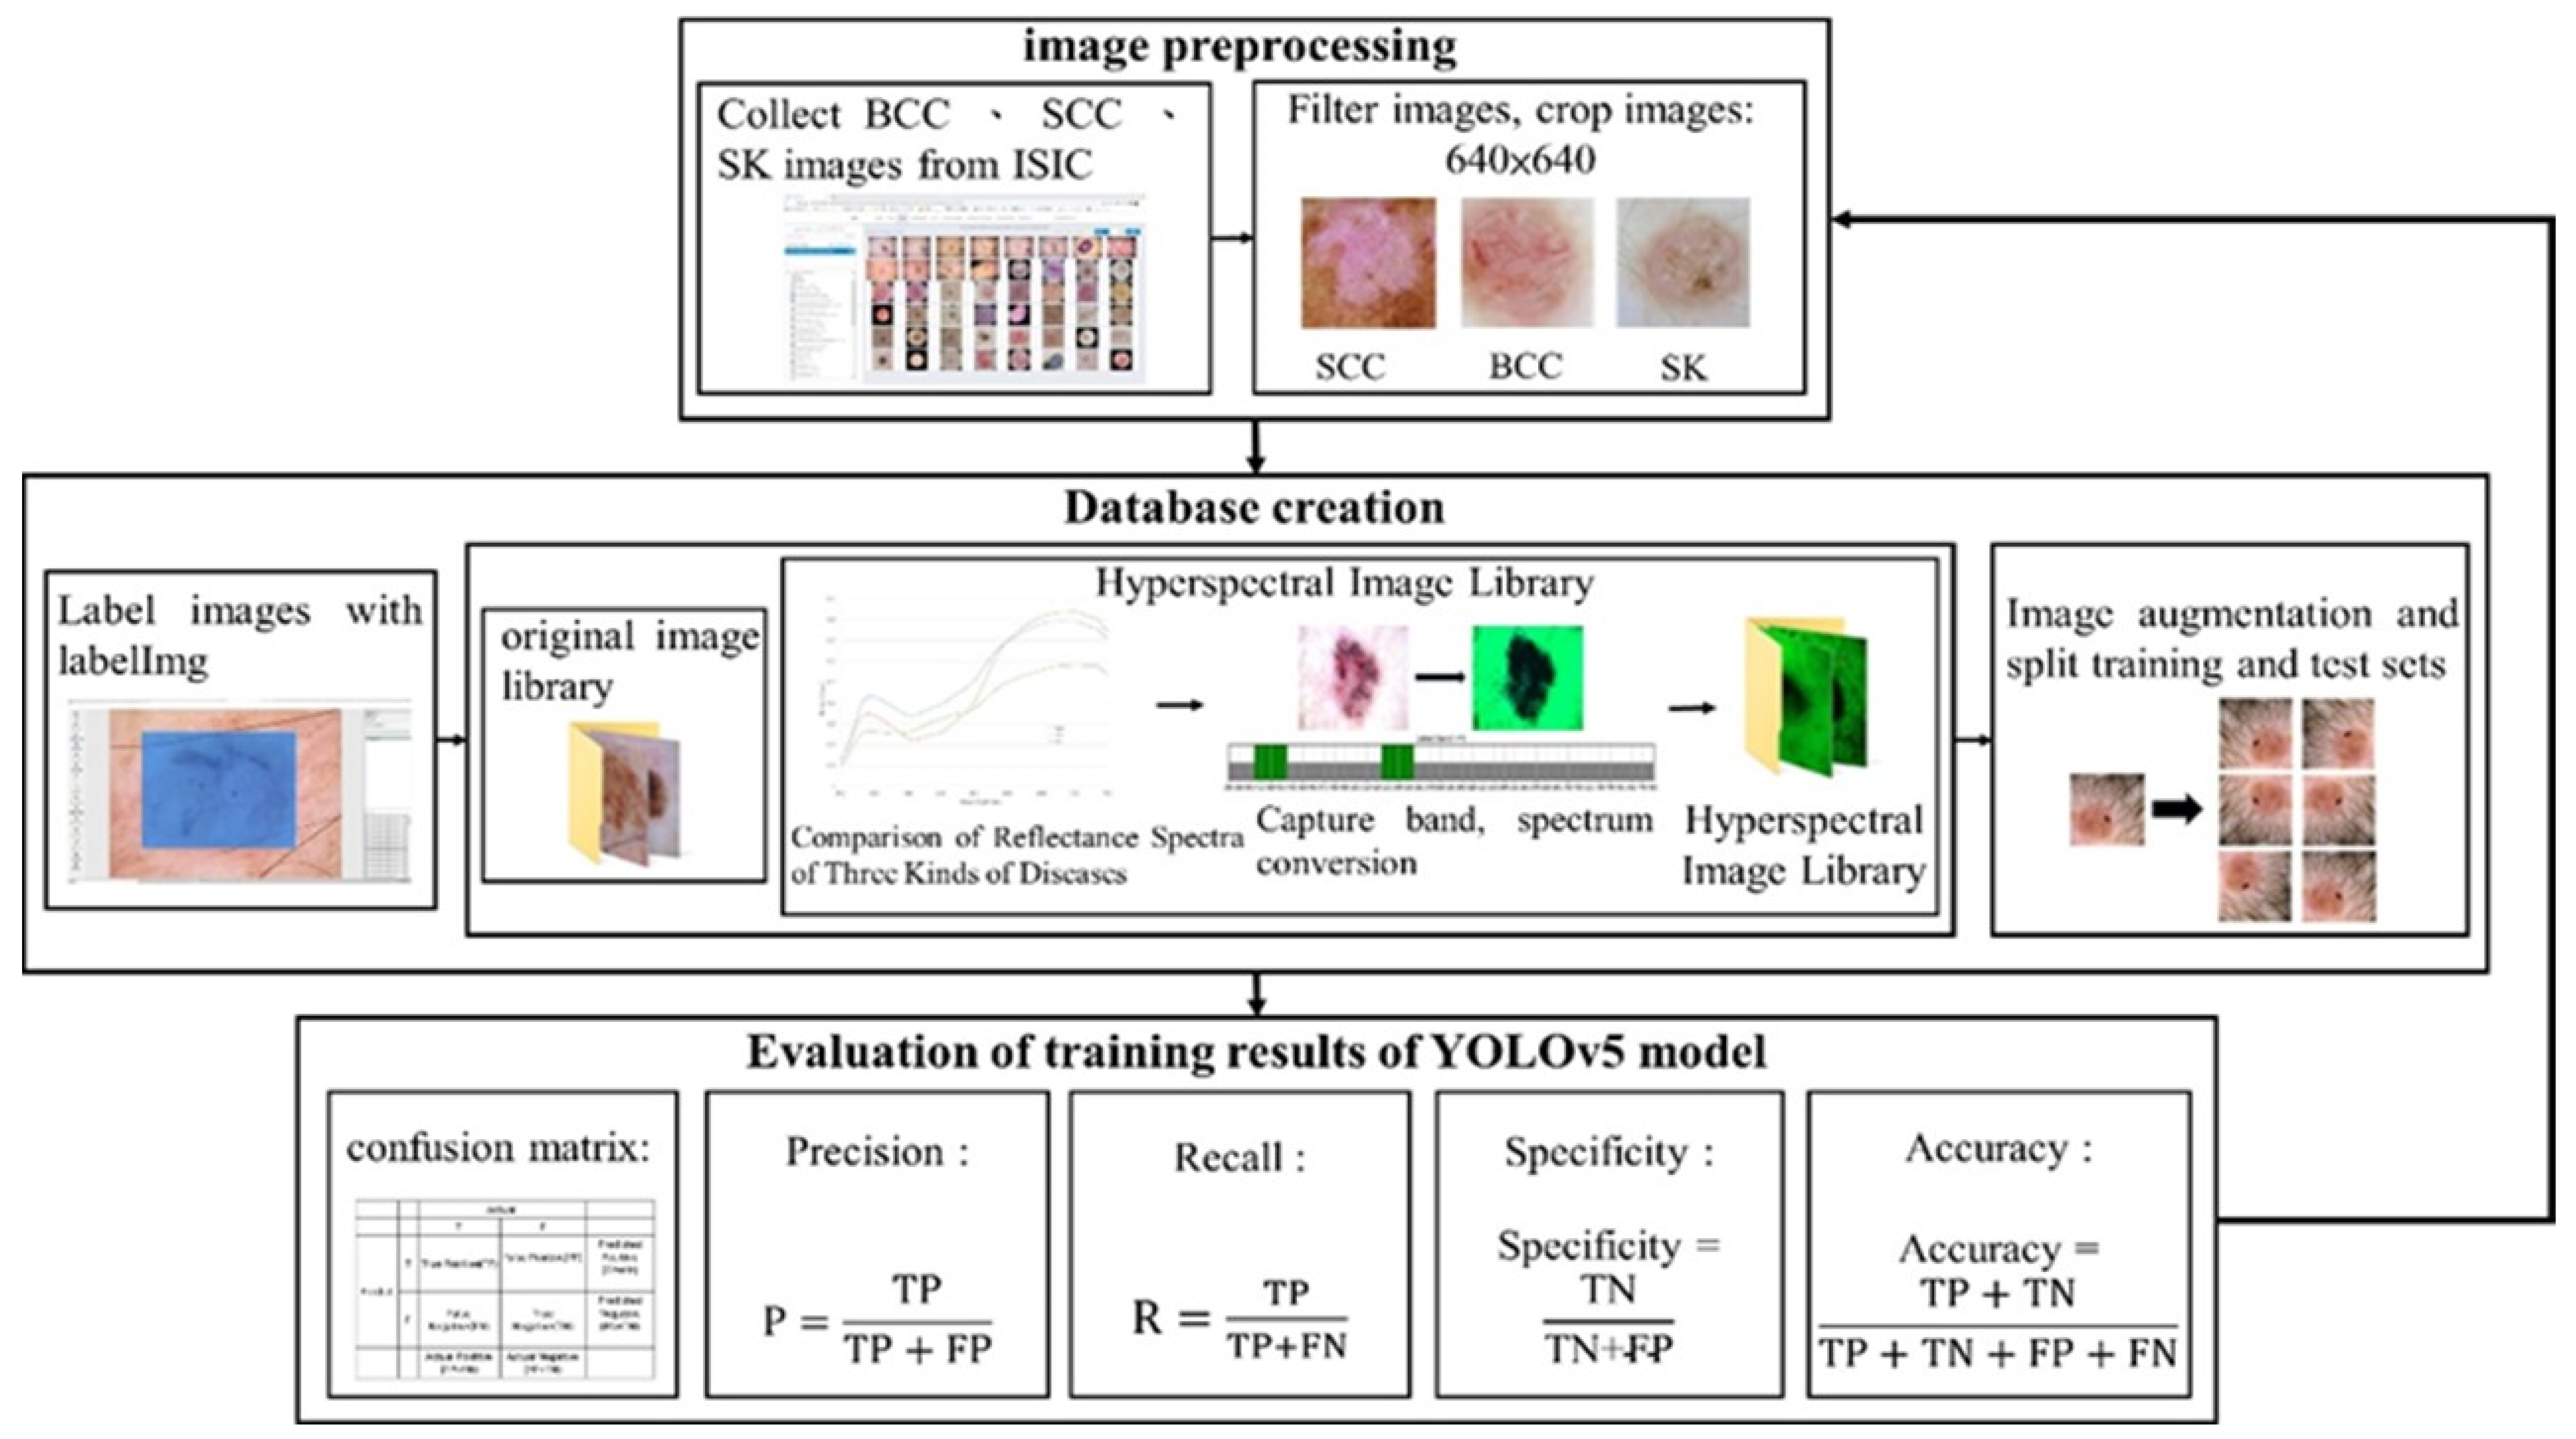
2. Methods
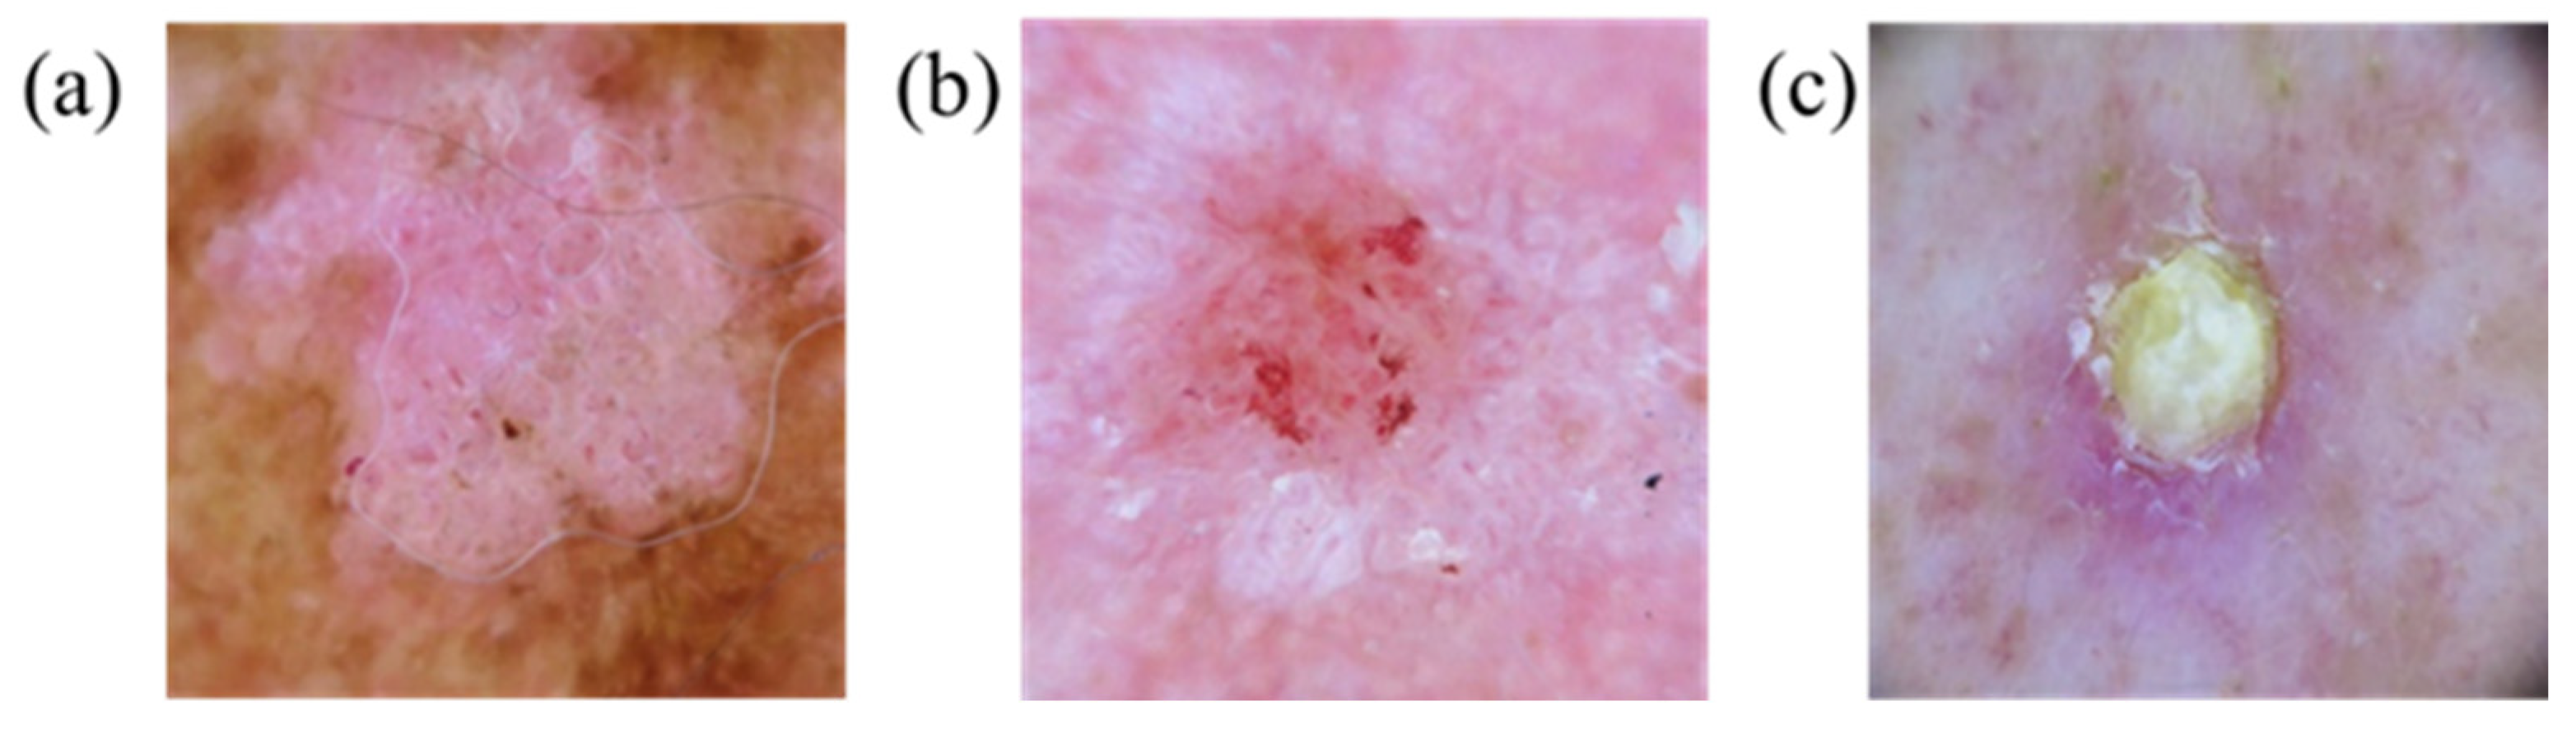
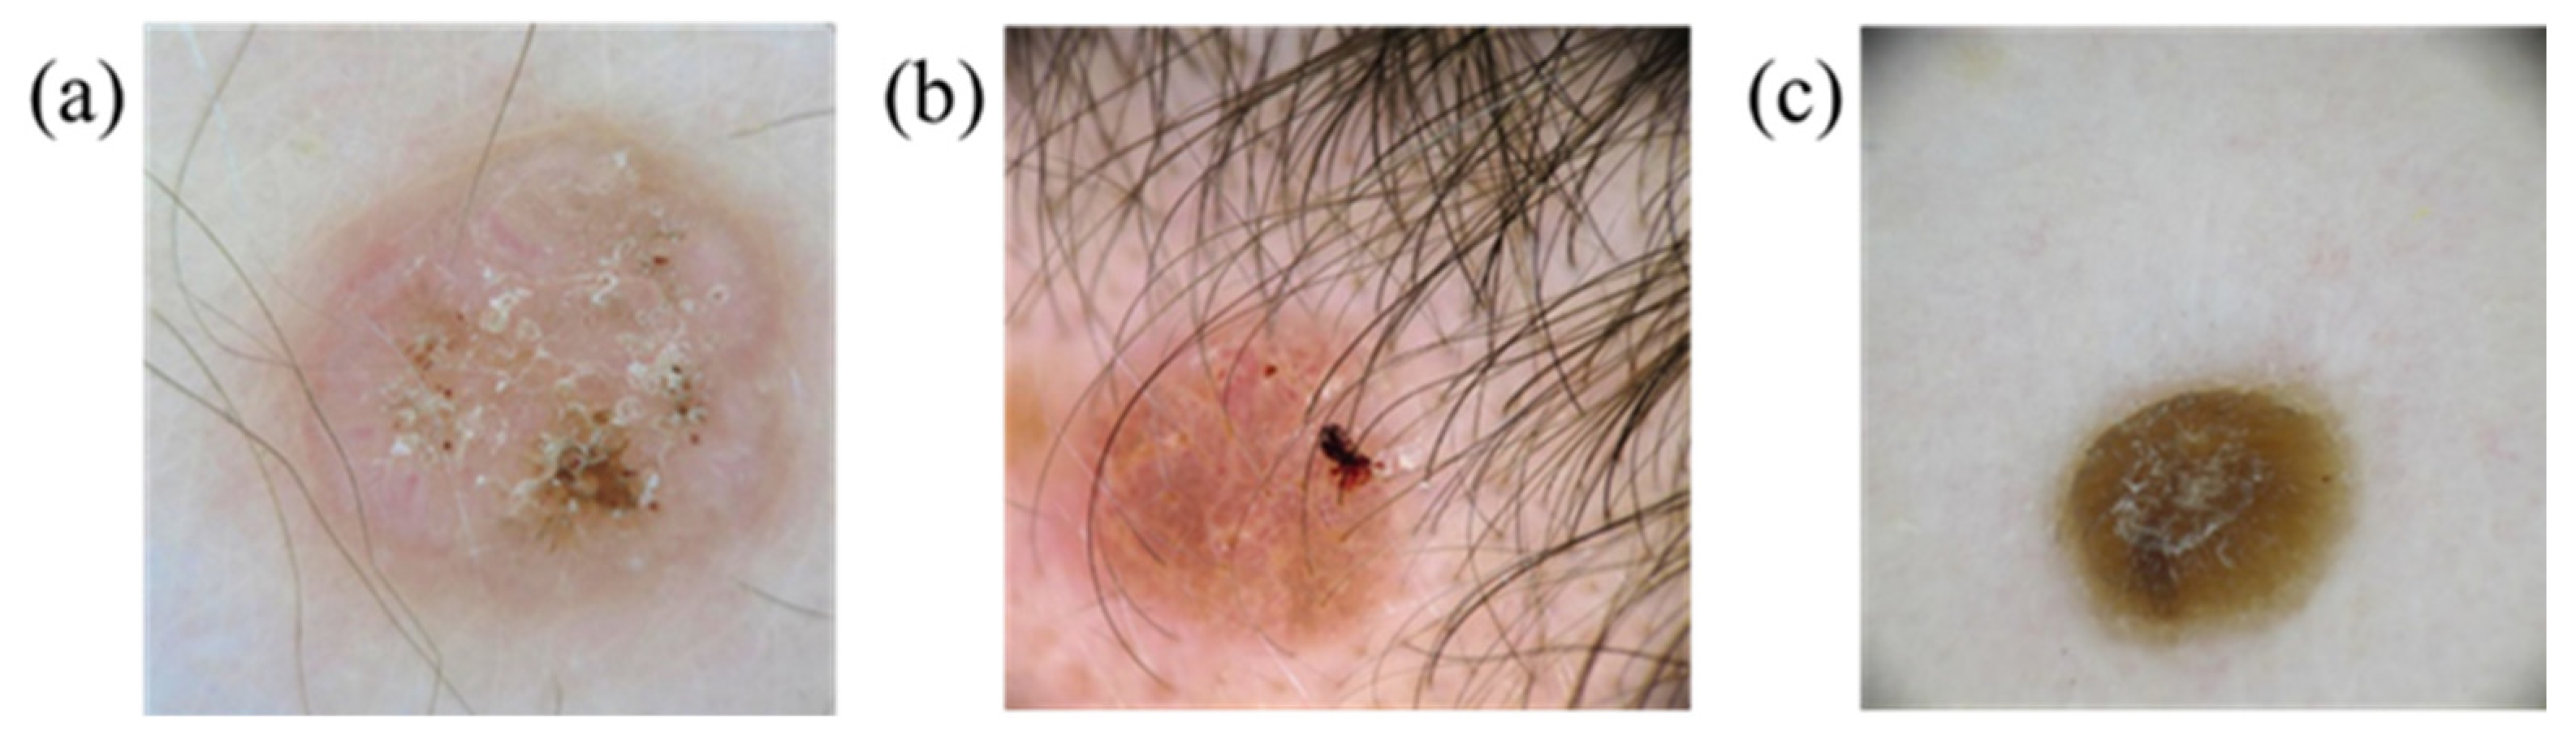
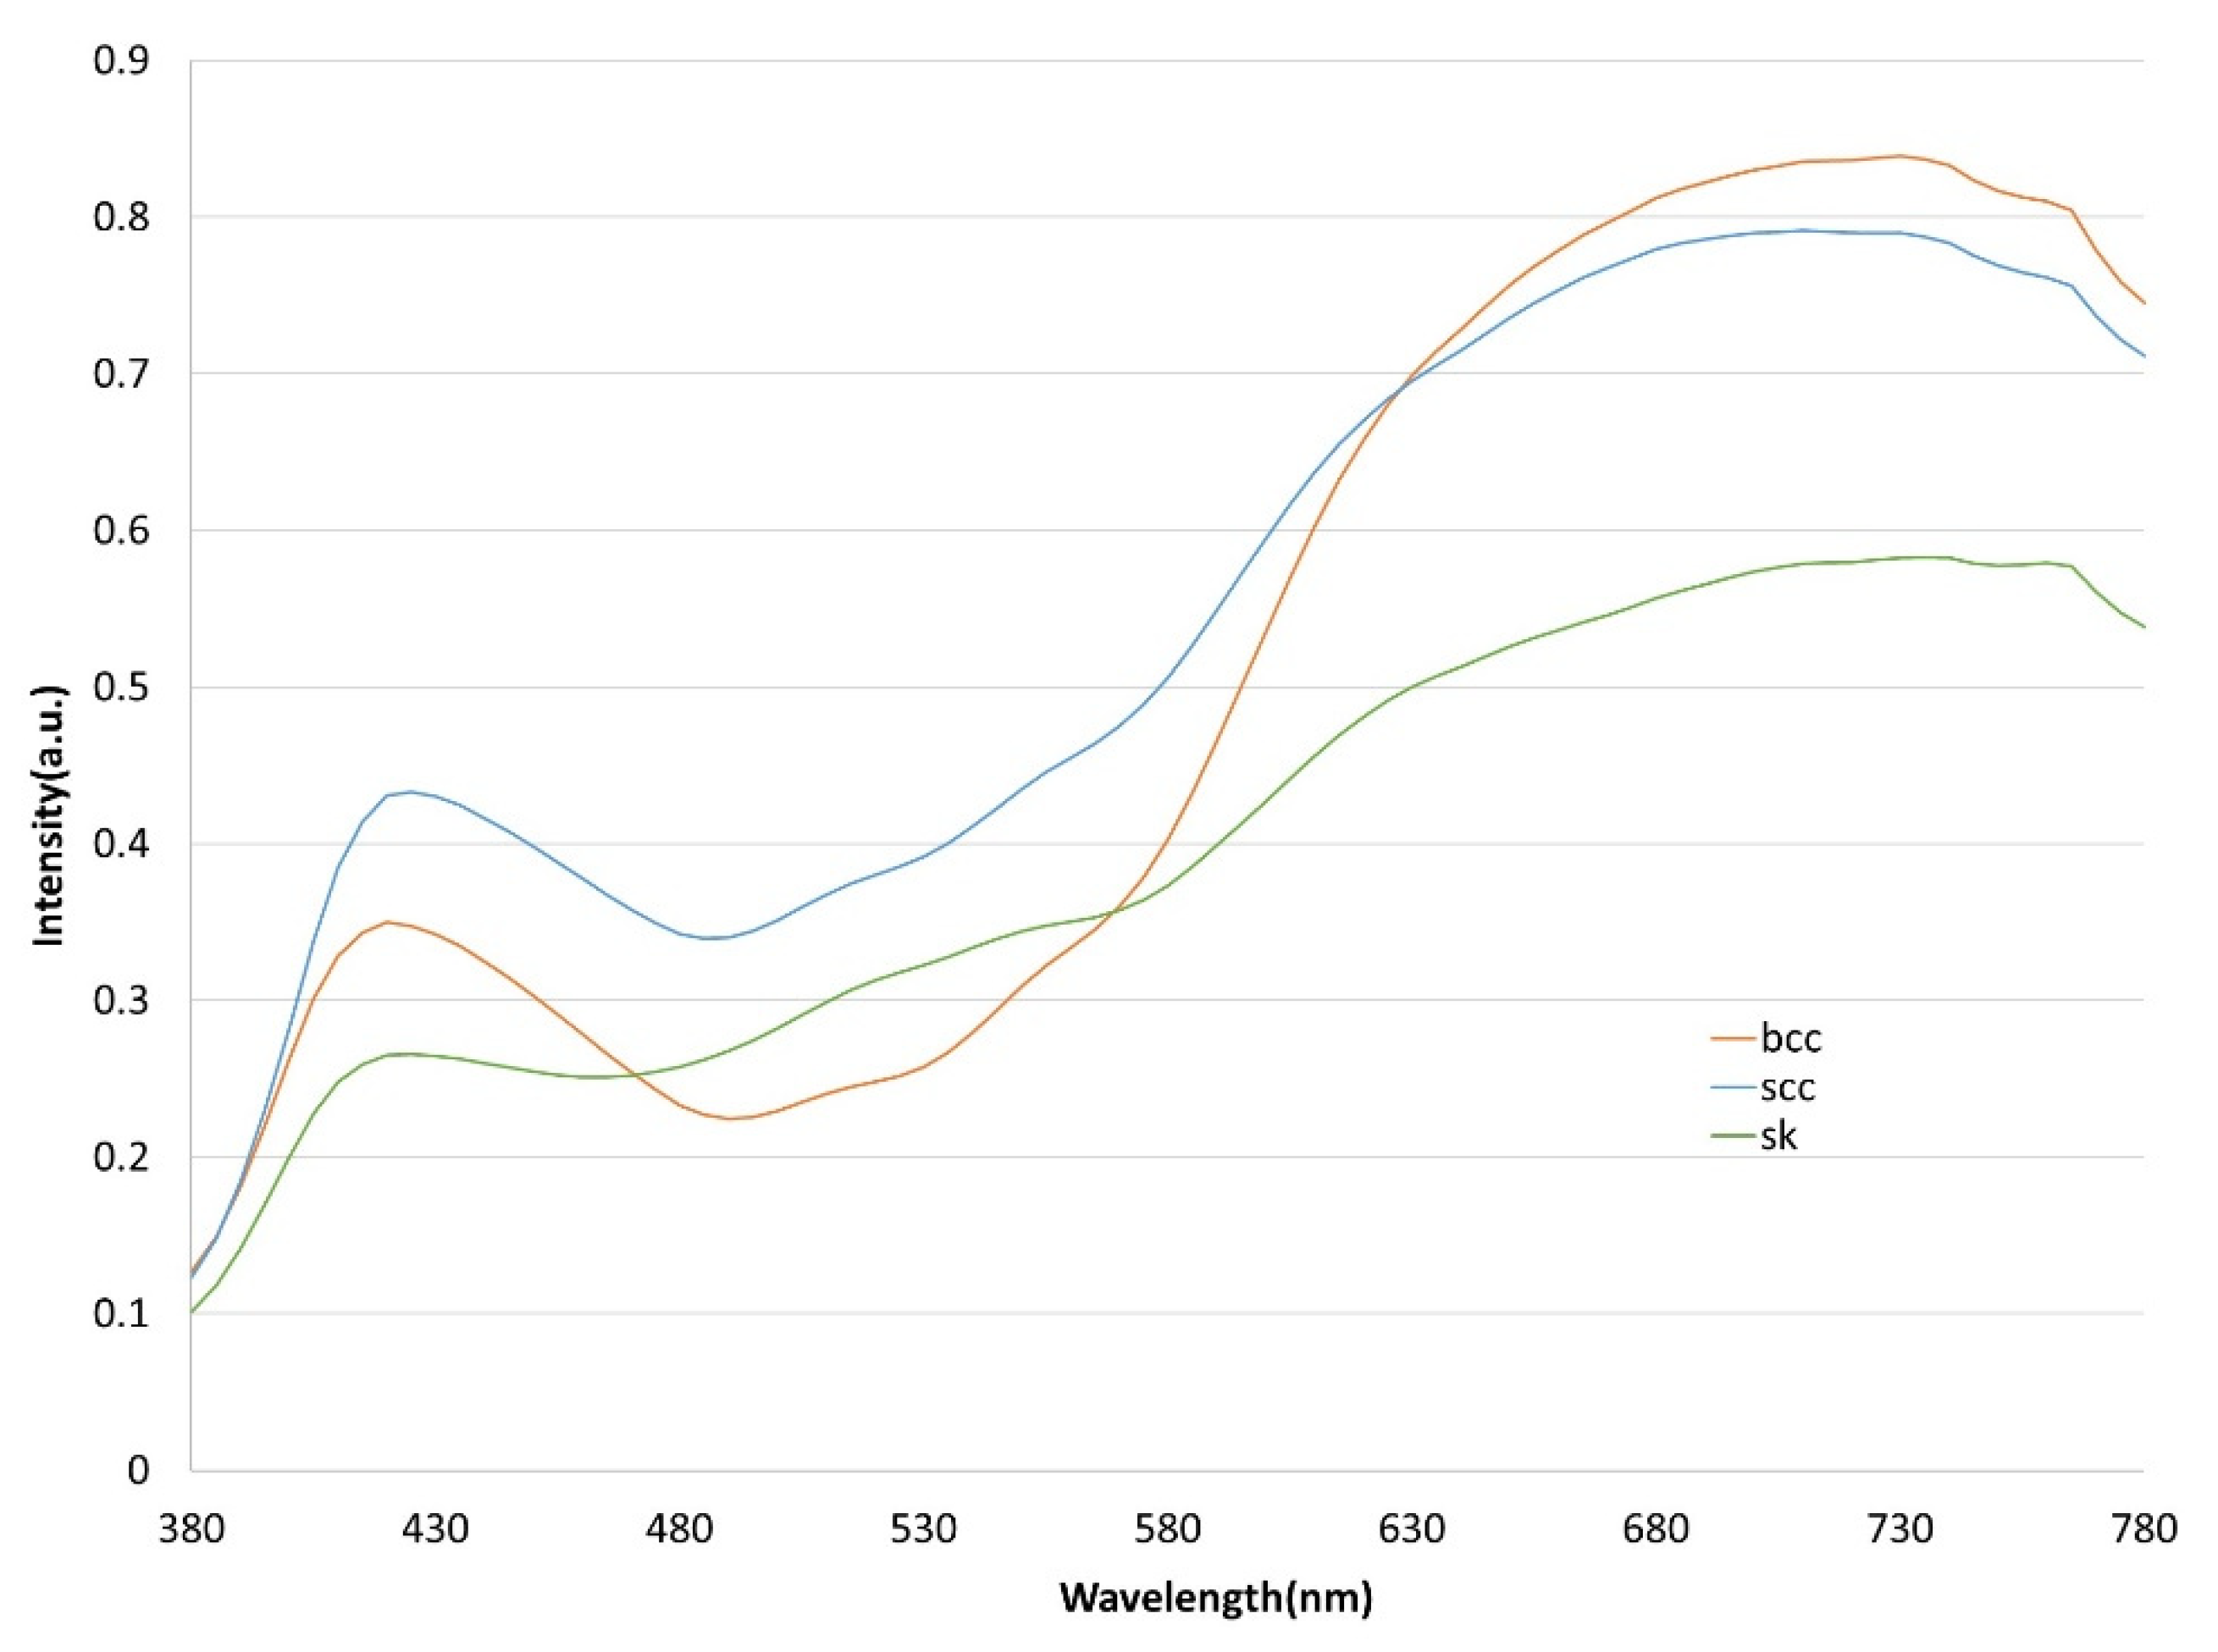
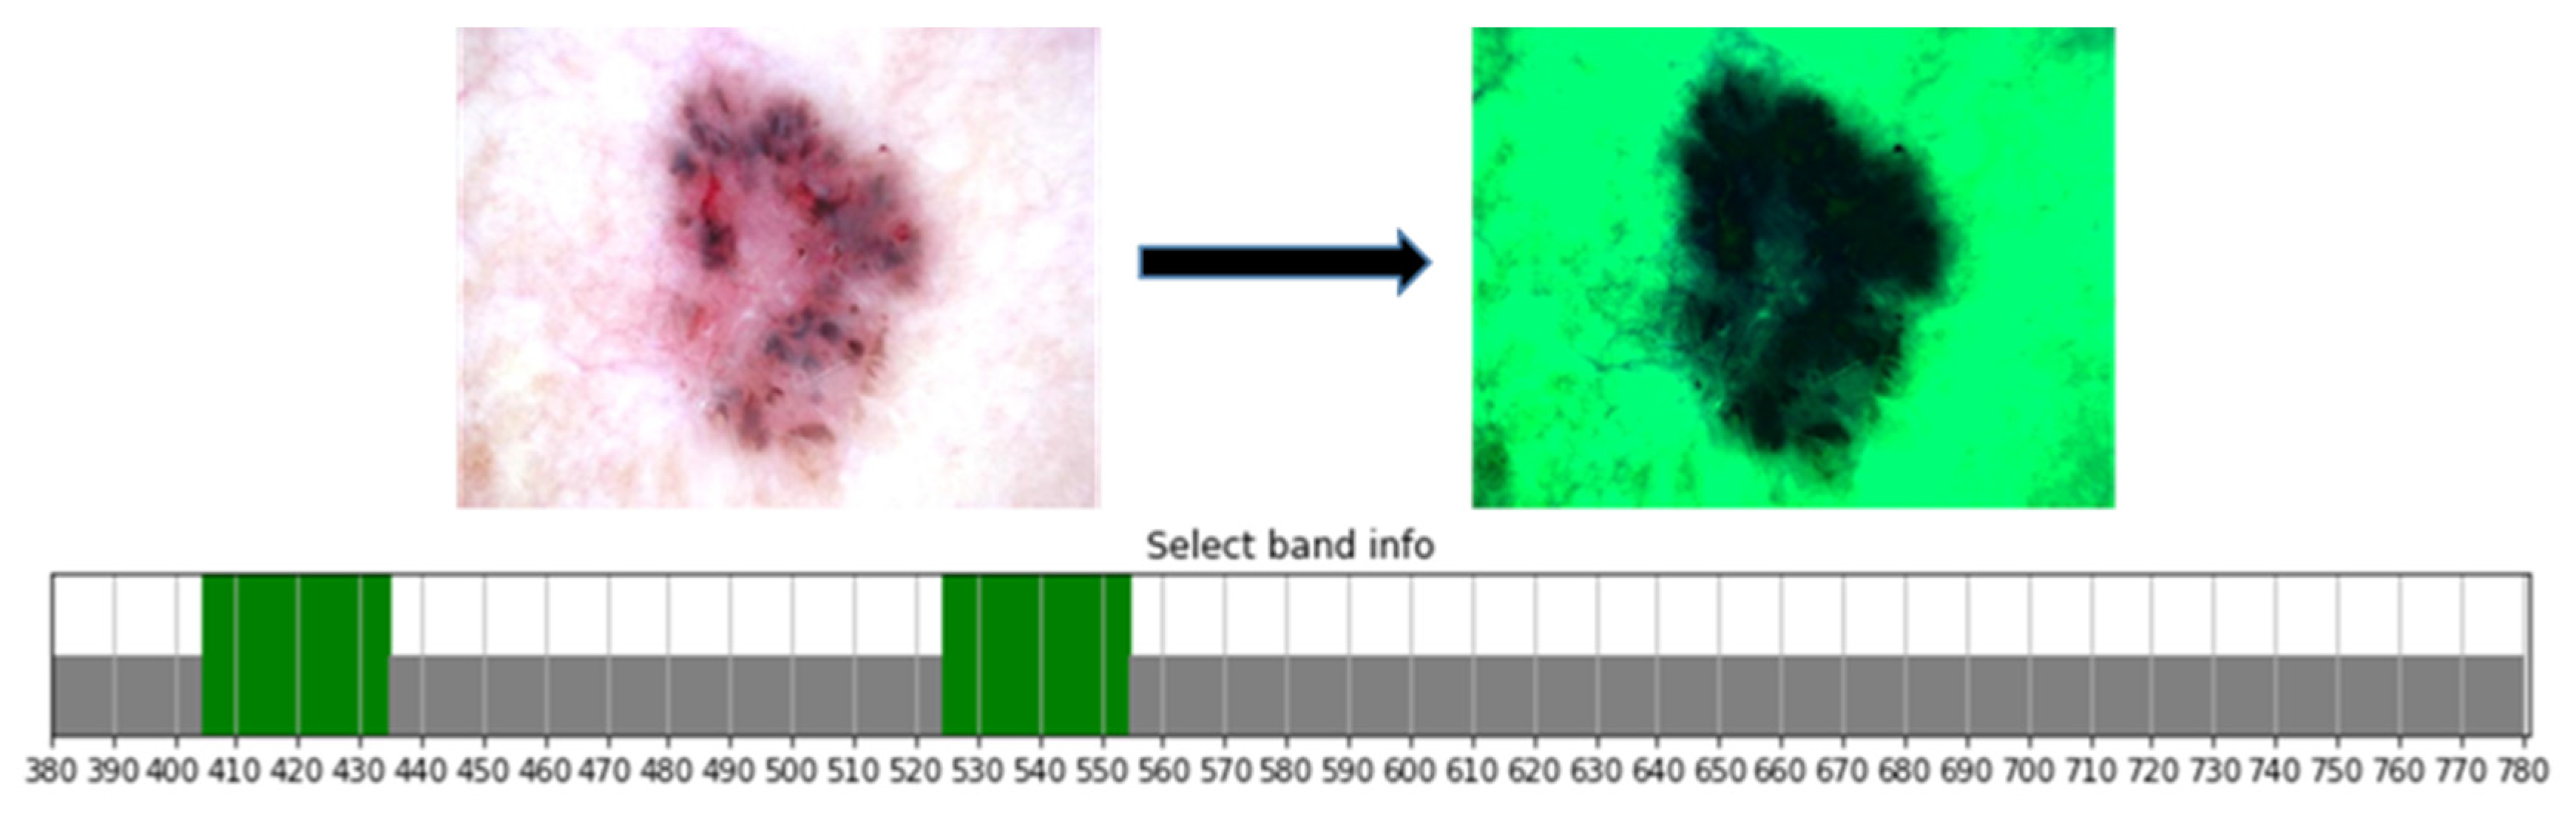
2.1. Data Preprocessing
2.2. YOLOv5 Model
3. Results
4. Conclusions
Supplementary Materials
Author Contributions
Funding
Institutional Review Board Statement
Informed Consent Statement
Data Availability Statement
Conflicts of Interest
References
- Didona, D.; Paolino, G.; Bottoni, U.; Cantisani, C. Non Melanoma Skin Cancer Pathogenesis Overview. Biomedicines 2018, 6, 6. [Google Scholar] [CrossRef] [PubMed]
- Leiter, U.; Eigentler, T.; Garbe, C. Epidemiology of skin cancer. In Sunlight, Vitamin D and Skin Cancer; Springer: New York, NY, USA, 2014; pp. 120–140. [Google Scholar]
- Apalla, Z.; Nashan, D.; Weller, R.B.; Castellsagué, X. Skin cancer: Epidemiology, disease burden, pathophysiology, diagnosis, and therapeutic approaches. Dermatol. Ther. 2017, 7, 5–19. [Google Scholar] [CrossRef] [PubMed]
- Cameron, M.C.; Lee, E.; Hibler, B.P.; Barker, C.A.; Mori, S.; Cordova, M.; Nehal, K.S.; Rossi, A.M. Basal cell carcinoma: Epidemiology; pathophysiology; clinical and histological subtypes; and disease associations. J. Am. Acad. Dermatol. 2019, 80, 303–317. [Google Scholar] [CrossRef] [PubMed]
- Cives, M.; Mannavola, F.; Lospalluti, L.; Sergi, M.C.; Cazzato, G.; Filoni, E.; Cavallo, F.; Giudice, G.; Stucci, L.S.; Porta, C.; et al. Non-Melanoma Skin Cancers: Biological and Clinical Features. Int. J. Mol. Sci. 2020, 21, 5394. [Google Scholar] [CrossRef] [PubMed]
- Chantrain, C.F.; Henriet, P.; Jodele, S.; Emonard, H.; Feron, O.; Courtoy, P.J.; DeClerck, Y.A.; Marbaix, E. Mechanisms of pericyte recruitment in tumour angiogenesis: A new role for metalloproteinases. Eur. J. Cancer 2006, 42, 310–318. [Google Scholar] [CrossRef] [PubMed]
- Godar, D.E. Worldwide increasing incidences of cutaneous malignant melanoma. J. Ski. Cancer 2011, 2011, 858425. [Google Scholar] [CrossRef]
- Smittenaar, C.; Petersen, K.; Stewart, K.; Moitt, N. Cancer incidence and mortality projections in the UK until 2035. Br. J. Cancer 2016, 115, 1147–1155. [Google Scholar] [CrossRef] [PubMed]
- Donaldson, M.R.; Coldiron, B.M. No end in sight: The skin cancer epidemic continues. In Seminars in Cutaneous Medicine and Surgery; WB Saunders: Philadelphia, PA, USA, 2011; pp. 3–5. [Google Scholar]
- Sung, H.; Ferlay, J.; Siegel, R.L.; Laversanne, M.; Soerjomataram, I.; Jemal, A.; Bray, F. Global cancer statistics 2020: GLOBOCAN estimates of incidence and mortality worldwide for 36 cancers in 185 countries. CA A Cancer J. Clin. 2021, 71, 209–249. [Google Scholar] [CrossRef] [PubMed]
- Ferlay, J.; Soerjomataram, I.; Dikshit, R.; Eser, S.; Mathers, C.; Rebelo, M.; Parkin, D.M.; Forman, D.; Bray, F. Cancer incidence and mortality worldwide: Sources, methods and major patterns in GLOBOCAN 2012. Int. J. Cancer 2015, 136, E359–E386. [Google Scholar] [CrossRef]
- Wen, D.; Khan, S.M.; Ji Xu, A.; Ibrahim, H.; Smith, L.; Caballero, J.; Zepeda, L.; de Blas Perez, C.; Denniston, A.K.; Liu, X.; et al. Characteristics of publicly available skin cancer image datasets: A systematic review. Lancet Digit. Health 2022, 4, e64–e74. [Google Scholar] [CrossRef]
- Senan, E.M.; Jadhav, M.E. Classification of dermoscopy images for early detection of skin cancer—A review. Int. J. Comput. Appl. 2019, 975, 8887. [Google Scholar]
- Janda, M.; Cust, A.E.; Neale, R.E.; Aitken, J.F.; Baade, P.D.; Green, A.C.; Khosrotehrani, K.; Mar, V.; Soyer, H.P.; Whiteman, D.C. Early detection of melanoma: A consensus report from the Australian skin and skin cancer research centre melanoma screening Summit. Aust. N. Z. J. Public Health 2020, 44, 111–115. [Google Scholar] [CrossRef] [PubMed]
- Demir, A.; Yilmaz, F.; Kose, O. Early detection of skin cancer using deep learning architectures: Resnet-101 and inception-v3. In Proceedings of the 2019 Medical Technologies Congress (TIPTEKNO), Izmir, Turkey, 3–5 October 2019; pp. 1–4. [Google Scholar]
- Dildar, M.; Akram, S.; Irfan, M.; Khan, H.U.; Ramzan, M.; Mahmood, A.R.; Alsaiari, S.A.; Saeed, A.H.M.; Alraddadi, M.O.; Mahnashi, M.H. Skin Cancer Detection: A Review Using Deep Learning Techniques. Int. J. Environ. Res. Public Health 2021, 18, 5479. [Google Scholar] [CrossRef] [PubMed]
- Brinker, T.J.; Hekler, A.; Utikal, J.S.; Grabe, N.; Schadendorf, D.; Klode, J.; Berking, C.; Steeb, T.; Enk, A.H.; Von Kalle, C. Skin cancer classification using convolutional neural networks: Systematic review. J. Med. Internet Res. 2018, 20, e11936. [Google Scholar] [CrossRef]
- Adla, D.; Reddy, G.; Nayak, P.; Karuna, G. Deep learning-based computer aided diagnosis model for skin cancer detection and classification. Distrib. Parallel Databases 2021, 40, 717–736. [Google Scholar] [CrossRef]
- Henriksen, E.L.; Carlsen, J.F.; Vejborg, I.M.; Nielsen, M.B.; Lauridsen, C.A. The efficacy of using computer-aided detection (CAD) for detection of breast cancer in mammography screening: A systematic review. Acta Radiol. 2019, 60, 13–18. [Google Scholar] [CrossRef]
- di Ruffano, L.F.; Takwoingi, Y.; Dinnes, J.; Chuchu, N.; Bayliss, S.E.; Davenport, C.; Matin, R.N.; Godfrey, K.; O’Sullivan, C.; Gulati, A. Computer-assisted diagnosis techniques (dermoscopy and spectroscopy-based) for diagnosing skin cancer in adults. Cochrane Database Syst. Rev. 2018, 12. [Google Scholar] [CrossRef]
- Fang, Y.-J.; Mukundan, A.; Tsao, Y.-M.; Huang, C.-W.; Wang, H.-C. Identification of Early Esophageal Cancer by Semantic Segmentation. J. Pers. Med. 2022, 12, 1204. [Google Scholar] [CrossRef]
- Haenssle, H.A.; Fink, C.; Toberer, F.; Winkler, J.; Stolz, W.; Deinlein, T.; Hofmann-Wellenhof, R.; Lallas, A.; Emmert, S.; Buhl, T. Man against machine reloaded: Performance of a market-approved convolutional neural network in classifying a broad spectrum of skin lesions in comparison with 96 dermatologists working under less artificial conditions. Ann. Oncol. 2020, 31, 137–143. [Google Scholar] [CrossRef]
- Mukundan, A.; Feng, S.-W.; Weng, Y.-H.; Tsao, Y.-M.; Artemkina, S.B.; Fedorov, V.E.; Lin, Y.-S.; Huang, Y.-C.; Wang, H.-C. Optical and Material Characteristics of MoS2/Cu2O Sensor for Detection of Lung Cancer Cell Types in Hydroplegia. Int. J. Mol. Sci. 2022, 23, 4745. [Google Scholar] [CrossRef]
- Mukundan, A.; Tsao, Y.-M.; Artemkina, S.B.; Fedorov, V.E.; Wang, H.-C. Growth Mechanism of Periodic-Structured MoS2 by Transmission Electron Microscopy. Nanomaterials 2022, 12, 135. [Google Scholar] [CrossRef]
- Hsiao, Y.-P.; Mukundan, A.; Chen, W.-C.; Wu, M.-T.; Hsieh, S.-C.; Wang, H.-C. Design of a Lab-On-Chip for Cancer Cell Detection through Impedance and Photoelectrochemical Response Analysis. Biosensors 2022, 12, 405. [Google Scholar] [CrossRef] [PubMed]
- Chao, L.; Liang, Y.; Hu, X.; Shi, H.; Xia, T.; Zhang, H.; Xia, H. Recent advances in field effect transistor biosensor technology for cancer detection: A mini review. J. Phys. D Appl. Phys. 2021, 55, 153001. [Google Scholar] [CrossRef]
- Goldoni, R.; Scolaro, A.; Boccalari, E.; Dolci, C.; Scarano, A.; Inchingolo, F.; Ravazzani, P.; Muti, P.; Tartaglia, G. Malignancies and biosensors: A focus on oral cancer detection through salivary biomarkers. Biosensors 2021, 11, 396. [Google Scholar] [CrossRef] [PubMed]
- Johansen, T.H.; Møllersen, K.; Ortega, S.; Fabelo, H.; Garcia, A.; Callico, G.M.; Godtliebsen, F. Recent advances in hyperspectral imaging for melanoma detection. Wiley Interdiscip. Rev. Comput. Stat. 2020, 12, e1465. [Google Scholar] [CrossRef]
- Mukundan, A.; Huang, C.-C.; Men, T.-C.; Lin, F.-C.; Wang, H.-C. Air Pollution Detection Using a Novel Snap-Shot Hyperspectral Imaging Technique. Sensors 2022, 22, 6231. [Google Scholar] [CrossRef]
- Tsai, C.-L.; Mukundan, A.; Chung, C.-S.; Chen, Y.-H.; Wang, Y.-K.; Chen, T.-H.; Tseng, Y.-S.; Huang, C.-W.; Wu, I.-C.; Wang, H.-C. Hyperspectral Imaging Combined with Artificial Intelligence in the Early Detection of Esophageal Cancer. Cancers 2021, 13, 4593. [Google Scholar] [CrossRef]
- Schneider, A.; Feussner, H. Chapter 5—Diagnostic Procedures. In Biomedical Engineering in Gastrointestinal Surgery; Schneider, A., Feussner, H., Eds.; Academic Press: Cambridge, MA, USA, 2017; pp. 87–220. [Google Scholar]
- Schelkanova, I.; Pandya, A.; Muhaseen, A.; Saiko, G.; Douplik, A. 13—Early optical diagnosis of pressure ulcers. In Biophotonics for Medical Applications; Meglinski, I., Ed.; Woodhead Publishing: Sawston, UK, 2015; pp. 347–375. [Google Scholar]
- Lu, B.; Dao, P.D.; Liu, J.; He, Y.; Shang, J. Recent advances of hyperspectral imaging technology and applications in agriculture. Remote Sens. 2020, 12, 2659. [Google Scholar] [CrossRef]
- Hsiao, Y.-P.; Chiu, C.W.; Lu, C.W.; Nguyen, H.T.; Tseng, Y.S.; Hsieh, S.C.; Wang, H.-C. Identification of skin lesions by using single-step multiframe detector. J. Clin. Med. 2021, 10, 144. [Google Scholar] [CrossRef]
- Hsiao, Y.-P.; Wang, H.-C.; Chen, S.H.; Tsai, C.H.; Yang, J.H. Identified early stage mycosis fungoides from psoriasis and atopic dermatitis using non-invasive color contrast enhancement by LEDs lighting. Opt. Quantum Electron. 2015, 47, 1599–1611. [Google Scholar] [CrossRef]
- Hsiao, Y.-P.; Wang, H.-C.; Chen, S.H.; Tsai, C.H.; Yang, J.H. Optical perception for detection of cutaneous T-cell lymphoma by multi-spectral imaging. J. Opt. 2014, 16, 125301. [Google Scholar] [CrossRef]
- Tsai, T.-J.; Mukundan, A.; Chi, Y.-S.; Tsao, Y.-M.; Wang, Y.-K.; Chen, T.-H.; Wu, I.-C.; Huang, C.-W.; Wang, H.-C. Intelligent Identification of Early Esophageal Cancer by Band-Selective Hyperspectral Imaging. Cancers 2022, 14, 4292. [Google Scholar] [CrossRef] [PubMed]
- Gross, W.; Queck, F.; Vögtli, M.; Schreiner, S.; Kuester, J.; Böhler, J.; Mispelhorn, J.; Kneubühler, M.; Middelmann, W. A multi-temporal hyperspectral target detection experiment: Evaluation of military setups. In Proceedings of the Target and Background Signatures VII, Online, 13–17 September 2021; pp. 38–48. [Google Scholar]
- Chen, C.-W.; Tseng, Y.-S.; Mukundan, A.; Wang, H.-C. Air Pollution: Sensitive Detection of PM2.5 and PM10 Concentration Using Hyperspectral Imaging. Appl. Sci. 2021, 11, 4543. [Google Scholar] [CrossRef]
- Gerhards, M.; Schlerf, M.; Mallick, K.; Udelhoven, T. Challenges and future perspectives of multi-/Hyperspectral thermal infrared remote sensing for crop water-stress detection: A review. Remote Sens. 2019, 11, 1240. [Google Scholar] [CrossRef]
- Lee, C.-H.; Mukundan, A.; Chang, S.-C.; Wang, Y.-L.; Lu, S.-H.; Huang, Y.-C.; Wang, H.-C. Comparative Analysis of Stress and Deformation between One-Fenced and Three-Fenced Dental Implants Using Finite Element Analysis. J. Clin. Med. 2021, 10, 3986. [Google Scholar] [CrossRef] [PubMed]
- Stuart, M.B.; McGonigle, A.J.; Willmott, J.R. Hyperspectral imaging in environmental monitoring: A review of recent developments and technological advances in compact field deployable systems. Sensors 2019, 19, 3071. [Google Scholar] [CrossRef]
- Mukundan, A.; Wang, H.-C. Simplified Approach to Detect Satellite Maneuvers Using TLE Data and Simplified Perturbation Model Utilizing Orbital Element Variation. Appl. Sci. 2021, 11, 10181. [Google Scholar] [CrossRef]
- Huang, S.-Y.; Mukundan, A.; Tsao, Y.-M.; Kim, Y.; Lin, F.-C.; Wang, H.-C. Recent Advances in Counterfeit Art, Document, Photo, Hologram, and Currency Detection Using Hyperspectral Imaging. Sensors 2022, 22, 7308. [Google Scholar] [CrossRef]
- Mukundan, A.; Tsao, Y.-M.; Lin, F.-C.; Wang, H.-C. Portable and low-cost hologram verification module using a snapshot-based hyperspectral imaging algorithm. Sci. Rep. 2022, 12, 18475. [Google Scholar] [CrossRef]
- Mukundan, A.; Wang, H.-C.; Tsao, Y.-M. A Novel Multipurpose Snapshot Hyperspectral Imager used to Verify Security Hologram. In Proceedings of the 2022 International Conference on Engineering and Emerging Technologies (ICEET), Kuala Lumpur, Malaysia, 27–28 October 2022; pp. 1–3. [Google Scholar]
- Vangi, E.; D’Amico, G.; Francini, S.; Giannetti, F.; Lasserre, B.; Marchetti, M.; Chirici, G. The new hyperspectral satellite PRISMA: Imagery for forest types discrimination. Sensors 2021, 21, 1182. [Google Scholar] [CrossRef]
- Zhang, X.; Han, L.; Dong, Y.; Shi, Y.; Huang, W.; Han, L.; González-Moreno, P.; Ma, H.; Ye, H.; Sobeih, T. A deep learning-based approach for automated yellow rust disease detection from high-resolution hyperspectral UAV images. Remote Sens. 2019, 11, 1554. [Google Scholar] [CrossRef] [Green Version]
- Hennessy, A.; Clarke, K.; Lewis, M. Hyperspectral classification of plants: A review of waveband selection generalisability. Remote Sens. 2020, 12, 113. [Google Scholar] [CrossRef]
- Terentev, A.; Dolzhenko, V.; Fedotov, A.; Eremenko, D. Current State of Hyperspectral Remote Sensing for Early Plant Disease Detection: A Review. Sensors 2022, 22, 757. [Google Scholar] [CrossRef] [PubMed]
- De La Rosa, R.; Tolosana-Delgado, R.; Kirsch, M.; Gloaguen, R. Automated Multi-Scale and Multivariate Geological Logging from Drill-Core Hyperspectral Data. Remote Sens. 2022, 14, 2676. [Google Scholar] [CrossRef]
- Vo-Dinh, T. A hyperspectral imaging system for in vivo optical diagnostics. IEEE Eng. Med. Biol. Mag. 2004, 23, 40–49. [Google Scholar] [PubMed]
- Lu, G.; Fei, B. Medical hyperspectral imaging: A review. J. Biomed. Opt. 2014, 19, 010901. [Google Scholar] [CrossRef]
- Aggarwal, s.L.P.; Papay, F.A. Applications of multispectral and hyperspectral imaging in dermatology. Exp. Dermatol. 2022, 31, 1128–1135. [Google Scholar] [CrossRef]
- Leon, R.; Martinez-Vega, B.; Fabelo, H.; Ortega, S.; Melian, V.; Castaño, I.; Carretero, G.; Almeida, P.; Garcia, A.; Quevedo, E.; et al. Non-Invasive Skin Cancer Diagnosis Using Hyperspectral Imaging for In-Situ Clinical Support. J. Clin. Med. 2020, 9, 1662. [Google Scholar] [CrossRef]
- Courtenay, L.A.; González-Aguilera, D.; Lagüela, S.; del Pozo, S.; Ruiz-Mendez, C.; Barbero-García, I.; Román-Curto, C.; Cañueto, J.; Santos-Durán, C.; Cardeñoso-Álvarez, M.E.; et al. Hyperspectral imaging and robust statistics in non-melanoma skin cancer analysis. Biomed. Opt. Express 2021, 12, 5107–5127. [Google Scholar] [CrossRef]
- Dicker, D.T.; Lerner, J.; Van Belle, P.; Guerry, t.D.; Herlyn, M.; Elder, D.E.; El-Deiry, W.S. Differentiation of normal skin and melanoma using high resolution hyperspectral imaging. Cancer Biol. Ther. 2006, 5, 1033–1038. [Google Scholar] [CrossRef]
- Tan, L.; Huangfu, T.; Wu, L.; Chen, W. Comparison of RetinaNet, SSD, and YOLO v3 for real-time pill identification. BMC Med. Inform. Decis. Mak. 2021, 21, 324. [Google Scholar] [CrossRef] [PubMed]


| Skin Disease | Results of the RGB Model | ||||
|---|---|---|---|---|---|
| True | |||||
| BCC | SCC | SK | Background FP | ||
| Predicted | BCC | 133 | 7 | 8 | 45 |
| SCC | 6 | 66 | 0 | 27 | |
| SK | 6 | 1 | 102 | 54 | |
| Background FN | 23 | 16 | 16 | ||
| Skin Disease | Result of HSI Model | ||||
| True | |||||
| BCC | SCC | SK | Background FP | ||
| Predicted | BCC | 102 | 4 | 19 | 74 |
| SCC | 17 | 72 | 0 | 10 | |
| SK | 6 | 0 | 100 | 55 | |
| Background FN | 43 | 14 | 7 | ||
| RGB Model | Precision | Recall | Specificity | F1-Score | Accuracy |
|---|---|---|---|---|---|
| All | 0.888 | 0.758 | 0.798 | 0.818 | 0.792 |
| BCC | 0.899 | 0.747 | 0.791 | 0.816 | |
| SCC | 0.812 | 0.722 | 0.833 | 0.764 | |
| SK | 0.954 | 0.805 | 0.71 | 0.873 | |
| HSI Model | Precision | Recall | Specificity | F1-score | Accuracy |
| All | 0.8 | 0.726 | 0.786 | 0.761 | 0.787 |
| BCC | 0.813 | 0.624 | 0.716 | 0.706 | |
| SCC | 0.746 | 0.794 | 0.878 | 0.769 | |
| SK | 0.841 | 0.76 | 0.764 | 0.798 |
Disclaimer/Publisher’s Note: The statements, opinions and data contained in all publications are solely those of the individual author(s) and contributor(s) and not of MDPI and/or the editor(s). MDPI and/or the editor(s) disclaim responsibility for any injury to people or property resulting from any ideas, methods, instructions or products referred to in the content. |
© 2023 by the authors. Licensee MDPI, Basel, Switzerland. This article is an open access article distributed under the terms and conditions of the Creative Commons Attribution (CC BY) license (https://creativecommons.org/licenses/by/4.0/).
Share and Cite
Huang, H.-Y.; Hsiao, Y.-P.; Mukundan, A.; Tsao, Y.-M.; Chang, W.-Y.; Wang, H.-C. Classification of Skin Cancer Using Novel Hyperspectral Imaging Engineering via YOLOv5. J. Clin. Med. 2023, 12, 1134. https://doi.org/10.3390/jcm12031134
Huang H-Y, Hsiao Y-P, Mukundan A, Tsao Y-M, Chang W-Y, Wang H-C. Classification of Skin Cancer Using Novel Hyperspectral Imaging Engineering via YOLOv5. Journal of Clinical Medicine. 2023; 12(3):1134. https://doi.org/10.3390/jcm12031134
Chicago/Turabian StyleHuang, Hung-Yi, Yu-Ping Hsiao, Arvind Mukundan, Yu-Ming Tsao, Wen-Yen Chang, and Hsiang-Chen Wang. 2023. "Classification of Skin Cancer Using Novel Hyperspectral Imaging Engineering via YOLOv5" Journal of Clinical Medicine 12, no. 3: 1134. https://doi.org/10.3390/jcm12031134