
Non-Invasive Cardiac Output Measurement Using Inert Gas Rebreathing Method during Cardiopulmonary Exercise Testing—A Systematic Review


Abstract
:1. Introduction
1.1. Cardiac Output Measurement
1.2. Inert Gas Rebreathing
1.3. IGR with the Use of SF6
2. Methods
2.1. Literature Search
2.2. Evidence Acquisition
2.3. Inclusion and Exclusion Criteria
2.4. Evidence Synthesis and Quality Assessment
2.5. Study Registration
2.6. Availability of Data
3. Results
3.1. Study Selection and Description
3.2. Participants of the Studies Included
3.3. Protocols Used in CPET-IGR Studies
3.4. Health Conditions as Indication for IGR Study
3.5. Other
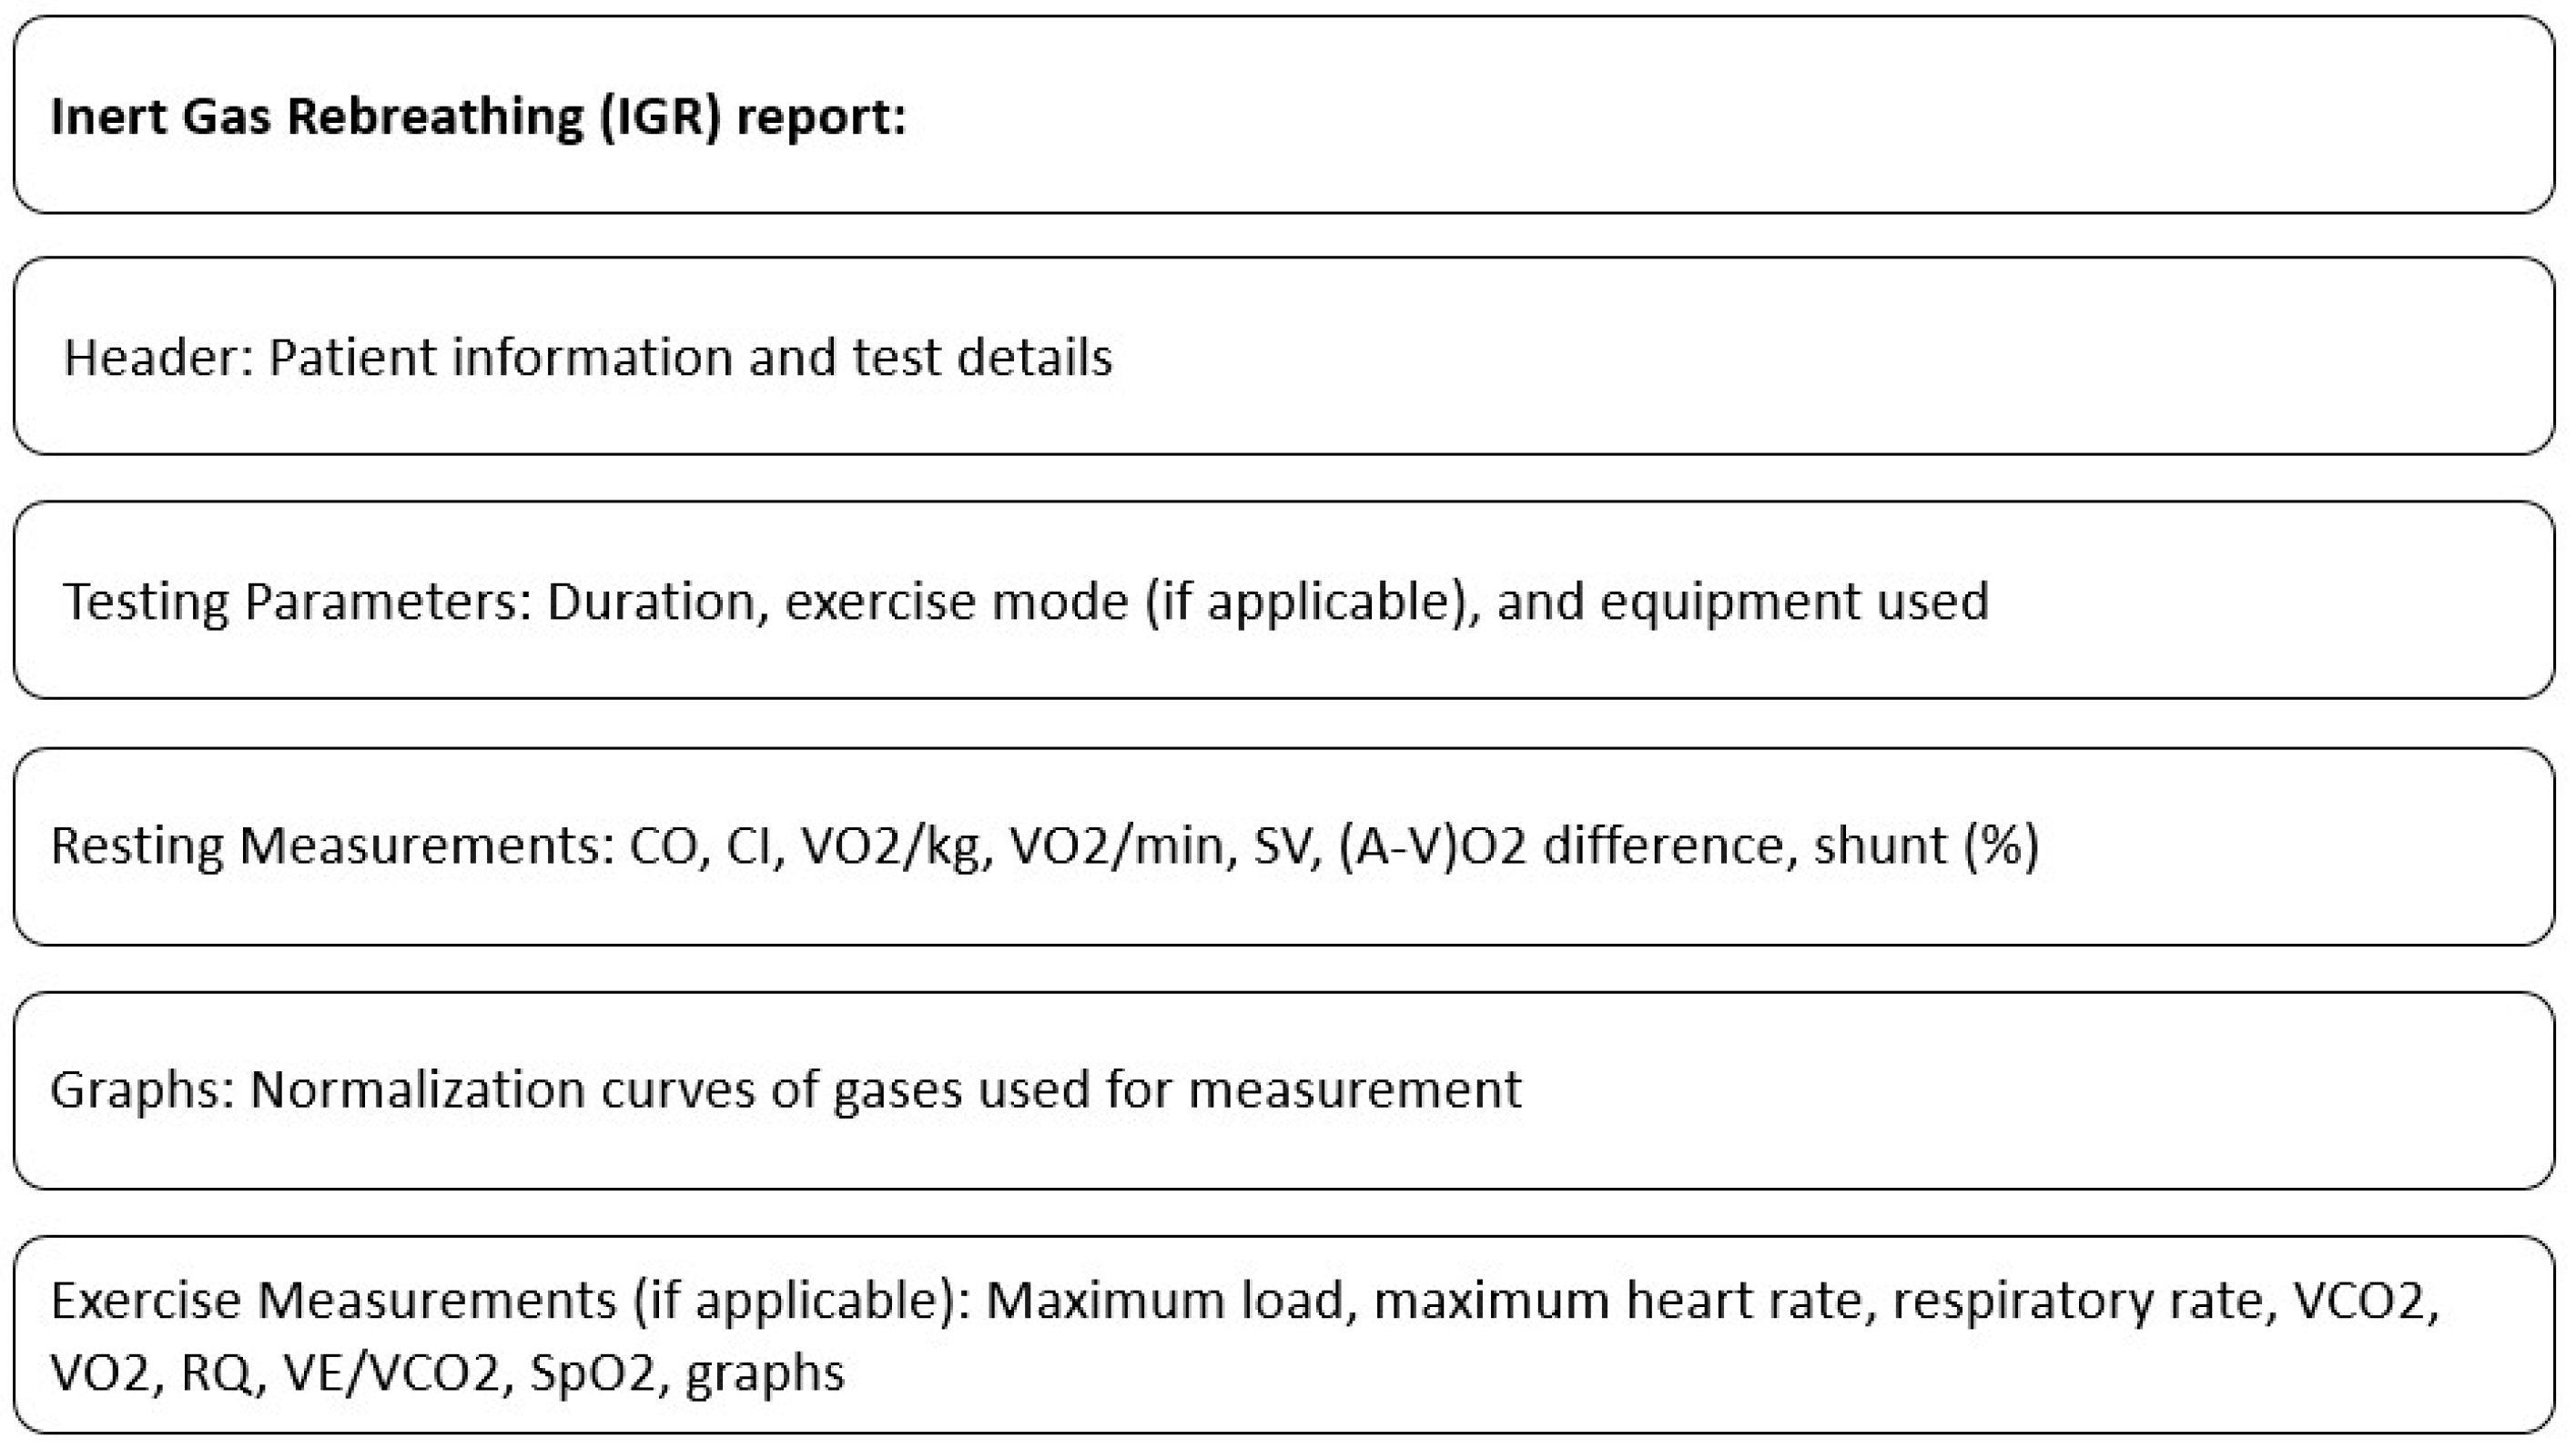
3.6. Proposed IGR Report Style
4. Discussion
4.1. The Validation and Utility of CPET-IGR
4.2. Lack of Uniform Result Presentation
4.3. Diverse Study Protocols
4.4. Inadequate Methodology Reporting
4.5. Points for Clinical Practice
4.6. Establishing Normative Ranges
5. Limitations
6. Conclusions
Author Contributions
Funding
Institutional Review Board Statement
Informed Consent Statement
Data Availability Statement
Conflicts of Interest
Abbreviations
| AT | Anaerobic Threshold |
| a-vO2 diff | Arteriovenous Oxygen Difference |
| CI | Cardiac Index |
| CHF | Chronic Heart Failure |
| CO | Cardiac Output |
| COPD | Chronic Obstructive Pulmonary Disease |
| CPO | Cardiac Power Output |
| GLP-1 | Glucagon-like Peptide 1 |
| HF | Heart Failure |
| HR | Heart Rate |
| IGR | Inert Gas Rebreathing |
| LVAD | Left Ventricular Assist Device |
| PAC | Pulmonary Artery Catheterization |
| peak VO2 | Peak oxygen consumption |
| PH | Pulmonary Hypertension |
| PBF | Pulmonary Blood Flow |
| RQ | Respiratory Quotient |
| SF6 | Sulfur hexafluoride |
| SV | Stroke Volume |
| VCO2 | Ventilatory Carbon Dioxide Output |
| VE/VCO2 | Ratio of minute ventilation to carbon dioxide output |
| VO2 | Oxygen Consumption |
| VE | Minute Ventilation |
| VO2 max | Maximal oxygen consumption |
References
- Hansen, J.E.; Sue, D.Y.; Stringer, W.W.; Whipp, B.J. Principles of Exercise Testing and Interpretation, 4th ed.; Wasserman, K., Ed.; Lea & Febiger: Philadelphia, PA, USA, 2004. [Google Scholar]
- Schraufnagel, D.E.; Agostoni, P. Cardiopulmonary Exercise Testing. Ann. Am. Thorac. Soc. 2017, 14 (Suppl. S1), S1–S2. [Google Scholar] [CrossRef]
- Wasserman, B.W.K.; Hansen, J.; Sue, D.; Stringer, W. Principles of Exercise Testing and Interpretation. Can. J. Cardiol. 2007, 23, 274. [Google Scholar] [CrossRef]
- Phan, V.; Hershenson, J.; Caldarera, L.; Larkin, S.K.; Wheeler, K.; Cortez, A.L.; Dulman, R.; Briere, N.; Lewis, A.; Kuypers, F.A.; et al. Effect of voxelotor on cardiopulmonary testing in youths with sickle cell anemia in a pilot study. Pediatr. Blood Cancer 2023, 70, e30423. [Google Scholar] [CrossRef] [PubMed]
- Liem, R.I.; Reddy, M.; Pelligra, S.A.; Savant, A.P.; Fernhall, B.; Rodeghier, M.; Thompson, A.A. Reduced fitness and abnormal cardiopulmonary responses to maximal exercise testing in children and young adults with sickle cell anemia. Physiol. Rep. 2015, 3, e12338. [Google Scholar] [CrossRef]
- Palau, P.; Domínguez, E.; Seller, J.; Sastre, C.; Sanchis, J.; López, L.; Bodí, V.; Llàcer, P.; Miñana, G.; de la Espriella, R.; et al. Chronotropic index and long-term outcomes in heart failure with preserved ejection fraction. Rev. Esp. Cardiol. 2023, 76, 511–518. [Google Scholar] [CrossRef]
- Piepoli, M.F.; Corrà, U.; Agostoni, P. Cardiopulmonary exercise testing in patients with heart failure with specific comorbidities. Ann. Am. Thorac. Soc. 2017, 14, S110–S115. [Google Scholar] [CrossRef]
- Collins, S.; Phillips, D.B.; Brotto, A.R.; Rampuri, Z.H.; Stickland, M.K. Ventilatory efficiency in athletes, asthma and obesity. Eur. Respir. Rev. 2021, 30, 200206. [Google Scholar] [CrossRef] [PubMed]
- Mezzani, A. Cardiopulmonary Exercise Testing: Basics of Methodology and Measurements. Ann. Am. Thorac. Soc. 2017, 14, S3–S11. [Google Scholar] [CrossRef]
- Mezzani, A.; Agostoni, P.; Cohen-Solal, A.; Corra, U.; Jegier, A.; Kouidi, E.; Mazic, S.; Meurin, P.; Piepoli, M.; Simon, A.; et al. Standards for the use of cardiopulmonary exercise testing for the functional evaluation of cardiac patients: A report from the Exercise Physiology Section of the European Association for Cardiovascular Prevention and Rehabilitation. Eur. J. Prev. Cardiol. 2009, 16, 249–267. [Google Scholar] [CrossRef] [PubMed]
- Ross, R.; Blair, S.N.; Arena, R.; Church, T.S.; Després, J.P.; Franklin, B.A.; Haskell, W.L.; Kaminsky, L.A.; Levine, B.D.; Lavie, C.J.; et al. Importance of Assessing Cardiorespiratory Fitness in Clinical Practice: A Case for Fitness as a Clinical Vital Sign: A Scientific Statement from the American Heart Association. Circulation 2016, 134, e653–e699. [Google Scholar] [CrossRef]
- Myers, J.; McAuley, P.; Lavie, C.J.; Despres, J.P.; Arena, R.; Kokkinos, P. Physical activity and cardiorespiratory fitness as major markers of cardiovascular risk: Their independent and interwoven importance to health status. Prog. Cardiovasc. Dis. 2015, 57, 306–314. [Google Scholar] [CrossRef]
- Kokkinos, P.; Myers, J. Exercise and Physical Activity. Circulation 2010, 122, 1637–1648. [Google Scholar] [CrossRef]
- Kodama, S.; Saito, K.; Tanaka, S.; Maki, M.; Yachi, Y.; Asumi, M.; Sugawara, A.; Totsuka, K.; Shimano, H.; Ohashi, Y.; et al. Cardiorespiratory Fitness as a Quantitative Predictor of All-Cause Mortality and Cardiovascular Events in Healthy Men and Women: A Meta-analysis. JAMA 2009, 301, 2024–2035. [Google Scholar] [CrossRef]
- Faselis, C.; Doumas, M.; Pittaras, A.; Narayan, P.; Myers, J.; Tsimploulis, A.; Kokkinos, P. Exercise capacity and all-cause mortality in male veterans with hypertension aged ≥70 years. Hypertension 2014, 64, 30–35. [Google Scholar] [CrossRef] [PubMed]
- Older, P.; Smith, R.; Courtney, P.; Hone, R. Preoperative evaluation of cardiac failure and ischemia in elderly patients by cardiopulmonary exercise testing. Chest 1993, 104, 701–704. [Google Scholar] [CrossRef] [PubMed]
- Older, P.; Hall, A.; Hader, R. Cardiopulmonary exercise testing as a screening test for perioperative management of major surgery in the elderly. Chest 1999, 116, 355–362. [Google Scholar] [CrossRef]
- Fleisher, L.A.; Fleischmann, K.E.; Auerbach, A.D.; Barnason, S.A.; Beckman, J.A.; Bozkurt, B.; Davila-Roman, V.G.; Gerhard-Herman, M.D.; Holly, T.A.; Kane, G.C.; et al. 2014 ACC/AHA guideline on perioperative cardiovascular evaluation and management of patients undergoing noncardiac surgery: A report of the American College of Cardiology/American Heart Association Task Force on practice guidelines. J. Am. Coll. Cardiol. 2014, 64, e77–e137. [Google Scholar] [CrossRef]
- Kristensen, S.D.; Knuuti, J.; Saraste, A.; Anker, S.; Bøtker, H.E.; Hert, S.D.; Ford, I.; Gonzalez-Juanatey, J.R.; Gorenek, B.; Heyndrickx, G.R.; et al. 2014 ESC/ESA Guidelines on non-cardiac surgery: Cardiovascular assessment and management: The Joint Task Force on non-cardiac surgery: Cardiovascular assessment and management of the European Society of Cardiology (ESC) and the European Society of Anaesthesiology (ESA). Eur. Heart J. 2014, 35, 2383–2431. [Google Scholar] [CrossRef]
- Jarvis, S.S.; Levine, B.D.; Prisk, G.K.; Shykoff, B.E.; Elliott, A.R.; Rosow, E.; Blomqvist, C.G.; Pawelczyk, J.A. Simultaneous determination of the accuracy and precision of closed-circuit cardiac output rebreathing techniques. J. Appl. Physiol. 2007, 103, 867–874. [Google Scholar] [CrossRef] [PubMed]
- Saur, J.; Fluechter, S.; Trinkmann, F.; Papavassiliu, T.; Schoenberg, S.; Weissmann, J.; Haghi, D.; Borggrefe, M.; Kaden, J.J. Noninvasive determination of cardiac output by the inert-gas-rebreathing method-comparison with cardiovascular magnetic resonance imaging. Cardiology 2009, 114, 247–254. [Google Scholar] [CrossRef]
- Gabrielsen, A.; Videbæk, R.; Schou, M.; Damgaard, M.; Kastrup, J.; Norsk, P. Non-invasive measurement of cardiac output in heart failure patients using a new foreign gas rebreathing technique. Clin. Sci. 2002, 102, 247–252. [Google Scholar] [CrossRef]
- Jakovljevic, D.G.; Nunan, D.; Donovan, G.; Hodges, L.D.; Sandercock, G.R.H.; Brodie, D.A. Comparison of cardiac output determined by different rebreathing methods at rest and at peak exercise. Eur. J. Appl. Physiol. 2008, 102, 593–599. [Google Scholar] [CrossRef] [PubMed]
- Straburzyńska-Migaj, E. Testy Spiroergometryczne w Praktyce Klinicznej; PZWL: Warsaw, Poland, 2022. [Google Scholar]
- Vincent, J.L. Understanding cardiac output. Crit Care 2008, 12, 1–3. [Google Scholar] [CrossRef] [PubMed]
- Borlaug, B.A.; Reddy, Y.N.V. Determinants and Correlates of Exercise Capacity in Heart Failure. JACC Heart Fail. 2015, 3, 815–817. [Google Scholar] [CrossRef]
- Franciosa, J.A.; Ziesche, S.; Wilen, R.N.M. Functional capacity of patients with chronic left ventricular failure. Relationship of bicycle exercise performance to clinical and hemodynamic characterization. Am. J. Med. 1979, 67, 460–466. [Google Scholar] [CrossRef] [PubMed]
- Weber, K.T.; Janicki, J.S. Cardiopulmonary exercise testing for evaluation of chronic cardiac failure. Am. J. Cardiol. 1985, 55, A22–A31. [Google Scholar] [CrossRef] [PubMed]
- Giglio, M.; Dalfino, L.; Puntillo, F.; Rubino, G.; Marucci, M.; Brienza, N. Haemodynamic goal-directed therapy in cardiac and vascular surgery. A systematic review and meta-analysis. Interact. Cardiovasc. Thorac. Surg. 2012, 15, 878–887. [Google Scholar] [CrossRef]
- McGuinness, S.; Parke, R. Using cardiac output monitoring to guide perioperative haemodynamic therapy. Curr. Opin. Crit. Care 2015, 21, 364–368. [Google Scholar] [CrossRef]
- Halbirk, M.; Nørrelund, H.; Møller, N.; Holst, J.J.; Schmitz, O.; Nielsen, R.; Nielsen-Kudsk, J.E.; Nielsen, S.S.; Nielsen, T.T.; Eiskjaer, H.; et al. Cardiovascular and metabolic effects of 48-h glucagon-like peptide-1 infusion in compensated chronic patients with heart failure. Am. J. Physiol. Heart Circ. Physiol. 2010, 298, H1096–H1102. [Google Scholar] [CrossRef]
- McGee, W.T.; Mailloux, P.; Jodka, P.; Thomas, J. The pulmonary artery catheter in critical care. Semin. Dial. 2006, 19, 480–491. [Google Scholar] [CrossRef]
- Dobb, G.J.; Donovan, K.D. Non-invasive methods of measuring cardiac output. Intensive Care Med. 1987, 13, 304–309. [Google Scholar] [CrossRef]
- Leibowitz, A.B. Who benefits from pulmonary artery catheterization? Crit. Care Med. 2003, 31, 2805–2806. [Google Scholar] [CrossRef]
- Mermel, L.A.; Maki, D.G. Infectious complications of Swan-Ganz pulmonary artery catheters. Pathogenesis, epidemiology, prevention, and management. Am. J. Respir. Crit. Care Med. 2012, 149, 1020–1036. [Google Scholar] [CrossRef] [PubMed]
- Sirivella, S.; Gielchinsky, I.; Parsonnet, V. Management of catheter-induced pulmonary artery perforation: A rare complication in cardiovascular operations. Ann. Thorac. Surg. 2001, 72, 2056–2059. [Google Scholar] [CrossRef] [PubMed]
- Dracup, K. The Swan-Ganz pulmonary artery catheter. Incidence of complications, with particular reference to ventricular dysrhythmias, and their prevention. Anaesthesia 1979, 34, 125–128. [Google Scholar] [CrossRef]
- Gorenek, B. Arrhythmias in cardiac catheterization laboratories. Acta Cardiol. 2008, 63, 259–263. [Google Scholar] [CrossRef] [PubMed]
- Peyton, P.J.; Chong, S.W. Minimally invasive measurement of cardiac output during surgery and critical care: A meta-analysis of accuracy and precision. Anesthesiology 2010, 113, 1220–1235. [Google Scholar] [CrossRef] [PubMed]
- Squara, P. Bioreactance: A New Method for Non-invasive Cardiac Output Monitoring. In Yearbook of Intensive Care and Emergency Medicine; Springer: Berlin/Heidelberg, Germany, 2008; pp. 619–630. [Google Scholar] [CrossRef]
- Saugel, B.; Kouz, K.; Scheeren, T.W.L.; Greiwe, G.; Hoppe, P.; Romagnoli, S.; de Backer, D. Cardiac output estimation using pulse wave analysis-physiology, algorithms, and technologies: A narrative review. Br. J. Anaesth. 2021, 126, 67–76. [Google Scholar] [CrossRef]
- Yamada, T.; Tsutsui, M.; Sugo, Y.; Sato, T.; Akazawa, T.; Sato, N.; Yamashita, K.; Ishihara, H.; Takeda, J. Multicenter study verifying a method of noninvasive continuous cardiac output measurement using pulse wave transit time: A comparison with intermittent bolus thermodilution cardiac output. Anesth. Analg. 2012, 115, 82–86. [Google Scholar] [CrossRef]
- Dvir, A.; Goldstein, N.; Rapoport, A.; Balmor, R.G.; Nachman, D.; Merin, R.; Fons, M.; Ben Ishay, A.; Eisenkraft, A. Comparing Cardiac Output Measurements Using a Wearable, Wireless, Noninvasive Photoplethysmography-Based Device to Pulse Contour Cardiac Output in the General ICU: A Brief Report. Crit. Care Explor. 2022, 4, e0624. [Google Scholar] [CrossRef]
- Jaffe, M.B. Partial CO2 rebreathing cardiac output--operating principles of the NICO system. J. Clin. Monit. Comput. 1999, 15, 387–401. [Google Scholar] [CrossRef]
- Cattadori, G.; Schmid, J.P.; Agostoni, P. Noninvasive Measurement of Cardiac Output during Exercise by Inert Gas Rebreathing Technique. Heart Fail. Clin. 2009, 5, 209–215. [Google Scholar] [CrossRef]
- Agostoni, P.; Cattadori, G. Noninvasive cardiac output measurement: A new tool in heart failure. Cardiology 2009, 114, 244–246. [Google Scholar] [CrossRef]
- Dong, L.; Wang, J.A.; Jiang, C.Y. Validation of the use of foreign gas rebreathing method for non-invasive determination of cardiac output in heart disease patients. J. Zhejiang Univ. Sci. B 2005, 6, 1157–1162. [Google Scholar] [CrossRef]
- Christensen, P.; Clemensen, P.; Andersen, P.K.; Henneberg, S.W. Thermodilution versus inert gas rebreathing for estimation of effective pulmonary blood flow. Crit. Care Med. 2000, 28, 51–56. [Google Scholar] [CrossRef]
- Peyton, P.J.; Thompson, B. Agreement of an inert gas rebreathing device with thermodilution and the direct oxygen fick method in measurement of pulmonary blood flow. J. Clin. Monit. Comput. 2004, 8, 373–378. [Google Scholar] [CrossRef] [PubMed]
- Peyton, P.J.; Bailey, M.; Thompson, B.R. Reproducibility of cardiac output measurement by the nitrous oxide rebreathing technique. J. Clin. Monit. Comput. 2009, 23, 233–236. [Google Scholar] [CrossRef] [PubMed]
- Okwose, N.C.; Zhang, J.; Chowdhury, S.; Houghton, D.; Ninkovic, S.; Jakovljević, S.; Jevtic, B.; Ropret, R.; Eggett, C.; Bates, M.; et al. Reproducibility of Inert Gas Rebreathing Method to Estimate Cardiac Output at Rest and during Cardiopulmonary Exercise Stress Testing. Int. J. Sports Med. 2019, 40, 125–132. [Google Scholar] [CrossRef] [PubMed]
- Wagner, P.D.; Saltzman, H.A.; West, J.B. Measurement of continuous distributions of ventilation-perfusion ratios: Theory. J. Appl. Physiol. 1974, 36, 588–599. [Google Scholar] [CrossRef] [PubMed]
- Harris, P.D.; Barnes, R. The uses of helium and xenon in current clinical practice. Anaesthesia 2008, 63, 284–293. [Google Scholar] [CrossRef]
- Hansen, S.; Wendelboe, O.; Christensen, P. The non-invasive acetylene rebreathing method for estimation of cardiac output: Influence of breath-by-breath variation. Clin. Physiol. 1997, 17, 193–202. [Google Scholar] [CrossRef]
- Marks, C.; Katch, V.; Rocchini, A.; Beekman, R.; Rosenthal, A. Validity and reliability of cardiac output by CO2 rebreathing. Sports Med. 1985, 2, 432–446. [Google Scholar] [CrossRef] [PubMed]
- Middlemiss, J.E.; Cocks, A.; Paapstel, K.; Maki-Petaja, K.M.; Sunita Wilkinson, I.B.; McEniery, C.M.; ACCT Study Investigators. Evaluation of inert gas rebreathing for determination of cardiac output: Influence of age, gender and body size. Hypertens. Res. 2018, 42, 834–844. [Google Scholar] [CrossRef] [PubMed]
- Agostoni, P.; Vignati, C.; Gentile, P.; Boiti, C.; Farina, S.; Salvioni, E.; Mapelli, M.; Magrì, D.; Paolillo, S.; Corrieri, N.; et al. Reference Values for Peak Exercise Cardiac Output in Healthy Individuals. Chest 2017, 151, 1329–1337. [Google Scholar] [CrossRef] [PubMed]
- Goda, A.; Lang, C.C.; Williams, P.; Jones, M.; Farr, M.J.; Mancini, D.M. Usefulness of Non-Invasive Measurement of Cardiac Output during Sub-Maximal Exercise to Predict Outcome in Patients with Chronic Heart Failure. Am. J. Cardiol. 2009, 104, 1556–1560. [Google Scholar] [CrossRef]
- del Torto, A.; Skattebo, Ø.; Hallén, J.; Capelli, C. Cardiac output with modified cardio-impedance against inert gas rebreathing during sub-maximal and maximal cycling exercise in healthy and fit subjects. Eur. J. Appl. Physiol. 2019, 119, 163–170. [Google Scholar] [CrossRef]
- Lang, C.C.; Karlin, P.; Haythe, J.; Tsao, L.; Mancini, D.M. Ease of Noninvasive Measurement of Cardiac Output Coupled with Peak VO2 Determination at Rest and during Exercise in Patients with Heart Failure. Am. J. Cardiol. 2007, 99, 404–405. [Google Scholar] [CrossRef]
- Accalai, E.; Vignati, C.; Salvioni, E.; Pezzuto, B.; Contini, M.; Cadeddu, C.; Meloni, L.; Agostoni, P. Non-invasive estimation of stroke volume during exercise from oxygen in heart failure patients. Eur. J. Prev. Cardiol. 2021, 28, 280–286. [Google Scholar] [CrossRef]
- Agostoni, P.; Cattadori, G.; Apostolo, A.; Contini, M.; Palermo, P.; Marenzi, G.; Wasserman, K. Noninvasive measurement of cardiac output during exercise by inert gas rebreathing technique: A new tool for heart failure evaluation. J. Am. Coll. Cardiol. 2005, 46, 1779–1781. [Google Scholar] [CrossRef]
- Fontana, P.; Boutellier, U.; Toigo, M. Reliability of measurements with innocor(TM) during exercise. Int. J. Sports Med. 2009, 30, 747–753. [Google Scholar] [CrossRef]
- Page, M.J.; McKenzie, J.E.; Bossuyt, P.M.; Boutron, I.; Hoffmann, T.C.; Mulrow, C.D.; Shamseer, L.; Tetzlaff, J.M.; Akl, E.A.; Brennan, S.E.; et al. The PRISMA 2020 statement: An updated guideline for reporting systematic reviews. Syst. Rev. 2021, 10, 105906. [Google Scholar] [CrossRef]
- Koshy, A.; Okwose, N.C.; Nunan, D.; Toms, A.; Brodie, D.A.; Doherty, P.; Seferovic, P.; Ristic, A.; Velicki, L.; Filipovic, N.; et al. Association between heart rate variability and haemodynamic response to exercise in chronic heart failure. Scand. Cardiovasc. J. 2019, 53, 77–82. [Google Scholar] [CrossRef] [PubMed]
- Fontana, P.; Betschon, K.; Boutellier, U.; Toigo, M. Cardiac output but not stroke volume is similar in a Wingate and O2peak test in young men. Eur. J. Appl. Physiol. 2011, 111, 155–158. [Google Scholar] [CrossRef] [PubMed]
- Corrieri, N.; Del Torto, A.; Vignati, C.; Maragna, R.; De Martino, F.; Cellamare, M.; Farina, S.; Salvioni, E.; Bonomi, A.; Agostoni, P. Cardiac output changes during exercise in heart failure patients: Focus on mid-exercise. ESC Heart Fail. 2021, 8, 55–62. [Google Scholar] [CrossRef]
- Shelton, R.J.; Ingle, L.; Rigby, A.S.; Witte, K.K.; Cleland, J.G.F.; Clark, A.L. Cardiac output does not limit submaximal exercise capacity in patients with chronic heart failure. Eur. J. Heart Fail. 2010, 12, 983–989. [Google Scholar] [CrossRef]
- Schmidt, T.; Bjarnason-Wehrens, B.; Mommertz, S.; Hannig, M.; Schulte-Eistrup, S.; Willemsen, D.; Reiss, N. Changes in Total Cardiac Output and Oxygen Extraction During Exercise in Patients Supported with an HVAD Left Ventricular Assist Device. Artif. Organs 2018, 42, 686–694. [Google Scholar] [CrossRef]
- Okwose, N.C.; Chowdhury, S.; Houghton, D.; Trenell, M.I.; Eggett, C.; Bates, M.; MacGowan, G.A.; Jakovljevic, D.G. Comparison of cardiac output estimates by bioreactance and inert gas rebreathing methods during cardiopulmonary exercise testing. Clin. Physiol. Funct. Imaging 2018, 38, 483–490. [Google Scholar] [CrossRef]
- Apostolo, A.; Paolillo, S.; Contini, M.; Vignati, C.; Tarzia, V.; Campodonico, J.; Mapelli, M.; Massetti, M.; Bejko, J.; Righini, F.; et al. Comprehensive effects of left ventricular assist device speed changes on alveolar gas exchange, sleep ventilatory pattern, and exercise performance. J. Heart Lung Transplant. 2018, 37, 1361–1371. [Google Scholar] [CrossRef] [PubMed]
- Del Torto, A.; Corrieri, N.; Vignati, C.; Gentile, P.; Cattadori, G.; Paolillo, S.; Agostoni, P. Contribution of central and peripheral factors at peak exercise in heart failure patients with progressive severity of exercise limitation. Int. J. Cardiol. 2017, 248, 252–256. [Google Scholar] [CrossRef]
- Vignati, C.; Morosin, M.; Fusini, L.; Pezzuto, B.; Spadafora, E.; De Martino, F.; Salvioni, E.; Rovai, S.; Filardi, P.P.; Sinagra, G.; et al. Do rebreathing manoeuvres for non-invasive measurement of cardiac output during maximum exercise test alter the main cardiopulmonary parameters? Eur. J. Prev. Cardiol. 2019, 26, 1616–1622. [Google Scholar] [CrossRef] [PubMed]
- Morosin, M.; Farina, S.; Vignati, C.; Spadafora, E.; Sciomer, S.; Salvioni, E.; Sinagra, G.; Agostoni, P. Exercise performance, haemodynamics, and respiratory pattern do not identify heart failure patients who end exercise with dyspnoea from those with fatigue. ESC Heart Fail. 2018, 5, 115–119. [Google Scholar] [CrossRef] [PubMed]
- Cattadori, G.; Schmid, J.-P.; Brugger, N.; Gondoni, E.; Palermo, P.; Agostoni, P. Hemodynamic effects of exercise training in heart failure. J. Card. Fail. 2011, 17, 916–922. [Google Scholar] [CrossRef] [PubMed]
- Reiss, N.; Schmidt, T.; Mommertz, S.; Feldmann, C.; Schmitto, J.D. Inert gas rebreathing-helpful tool in the management of left ventricular assist device patients. Perfusion 2018, 33, 335–338. [Google Scholar] [CrossRef]
- Vignati, C.; Apostolo, A.; Cattadori, G.; Farina, S.; Del Torto, A.; Scuri, S.; Gerosa, G.; Bottio, T.; Tarzia, V.; Bejko, J.; et al. Lvad pump speed increase is associated with increased peak exercise cardiac output and vo2, postponed anaerobic threshold and improved ventilatory efficiency. Int. J. Cardiol. 2017, 230, 28–32. [Google Scholar] [CrossRef]
- Iellamo, F.; Manzi, V.; Caminiti, G.; Vitale, C.; Castagna, C.; Massaro, M.; Franchini, A.; Rosano, G.; Volterrani, M. Matched dose interval and continuous exercise training induce similar cardiorespiratory and metabolic adaptations in patients with heart failure. Int. J. Cardiol. 2013, 167, 2561–2565. [Google Scholar] [CrossRef]
- Pokan, R.; Ocenasek, H.; Hochgatterer, R.; Miehl, M.; Vonbank, K.; Von Duvillard, S.P.; Franklin, B.; Würth, S.; Volf, I.; Wonisch, M.; et al. Myocardial dimensions and hemodynamics during 24-h ultraendurance ergometry. Med. Sci. Sports Exerc. 2014, 46, 268–275. [Google Scholar] [CrossRef]
- Fontana, P.; Boutellier, U.; Toigo, M. Non-invasive haemodynamic assessments using InnocorTM during standard graded exercise tests. Eur. J. Appl. Physiol. 2010, 108, 573–580. [Google Scholar] [CrossRef] [PubMed]
- Prochnau, D.; Forberg, T.; Khnert, H.; Heinke, M.; Figulla, H.R.; Surber, R. Optimization of the atrioventricular delay during cardiac resynchronization therapy using a device for non-invasive measurement of cardiac index at rest and during exercise. Europace 2012, 14, 249–253. [Google Scholar] [CrossRef]
- Lang, C.C.; Karlin, P.; Haythe, J.; Lim, T.K.; Mancini, D.M. Peak cardiac power output, measured noninvasively, is a powerful predictor of outcome in chronic heart failure. Circ. Heart Fail. 2009, 2, 33–38. [Google Scholar] [CrossRef]
- Jakovljevic, D.G.; Birks, E.J.; George, R.S.; Trenell, M.I.; Seferovic, P.M.; Yacoub, M.H.; Brodie, D.A. Relationship between peak cardiac pumping capability and selected exercise-derived prognostic indicators in patients treated with left ventricular assist devices. Eur. J. Heart Fail. 2011, 13, 992–999. [Google Scholar] [CrossRef]
- Jakovljevic, D.G.; Seferovic, P.M.; Nunan, D.; Donovan, G.; Trenell, M.I.; Grocott-Mason, R.; Brodie, D.A. Reproducibility of cardiac power output and other cardiopulmonary exercise indices in patients with chronic heart failure. Clin. Sci. 2012, 122, 175–181. [Google Scholar] [CrossRef]
- Vignati, C.; De Martino, F.; Muratori, M.; Salvioni, E.; Tamborini, G.; Bartorelli, A.; Pepi, M.; Alamanni, F.; Farina, S.; Cattadori, G.; et al. Rest and exercise oxygen uptake and cardiac output changes 6 months after successful transcatheter mitral valve repair. ESC Heart Fail. 2021, 8, 4915–4924. [Google Scholar] [CrossRef]
- Bentley, R.F.; Jones, J.H.; Hirai, D.M.; Zelt, J.T.; Giles, M.D.; Raleigh, J.P.; Quadrilatero, J.; Gurd, B.J.; Neder, J.A.; Tschakovsky, M.E. Submaximal exercise cardiac output is increased by 4 weeks of sprint interval training in young healthy males with low initial -O2: Importance of cardiac response phenotype. PLoS ONE 2019, 14, e0195458. [Google Scholar] [CrossRef] [PubMed]
- Jakovljevic, D.G.; George, R.S.; Nunan, D.; Donovan, G.; Bougard, R.S.; Yacoub, M.H.; Birks, E.J.; Brodie, D.A. The impact of acute reduction of continuous-flow left ventricular assist device support on cardiac and exercise performance. Heart 2010, 96, 1390–1395. [Google Scholar] [CrossRef]
- Shen, Y.; Song, H.; Ma, W.; Gong, Z.; Ni, Y.; Zhang, X.; Xu, W.; Jiang, J.; Che, L.; Xu, J.; et al. The prognostic value of peak cardiac power output in Chinese patients with chronic heart failure. PLoS ONE 2016, 11, e0147423. [Google Scholar] [CrossRef] [PubMed]
- Rajani, R.; Rimington, H.; Chambers, J.B. Treadmill exercise in apparently asymptomatic patients with moderate or severe aortic stenosis: Relationship between cardiac index and revealed symptoms. Heart 2010, 96, 689–695. [Google Scholar] [CrossRef] [PubMed]
- Pastormerlo, L.E.; Agazio, A.; Benelli, E.; Gabutti, A.; Poletti, R.; Prontera, C.; Clerico, A.; Emdin, M.; Passino, C. Usefulness of high-sensitive troponin elevation after effort stress to unveil vulnerable myocardium in patients with heart failure. Am. J. Cardiol. 2015, 116, 567–572. [Google Scholar] [CrossRef]
- Hassan, M.; Wagdy, K.; Kharabish, A.; Selwanos, P.P.; Nabil, A.; Elguindy, A.; ElFaramawy, A.; Elmahdy, M.F.; Mahmoud, H.; Yacoub, M.H. Validation of noninvasive measurement of cardiac output using inert gas rebreathing in a cohort of patients with heart failure and reduced ejection fraction. Circ. Heart Fail. 2017, 10, e003592. [Google Scholar] [CrossRef]
- Lee, W.-T.N.; Brown, A.; Peacock, A.J.; Johnson, M.K. Use of non-invasive haemodynamic measurements to detect treatment response in precapillary pulmonary hypertension. Thorax 2011, 66, 810–814. [Google Scholar] [CrossRef]
- Bentley, R.F.; Jones, J.H.; Hirai, D.M.; Zelt, J.T.; Giles, M.D.; Raleigh, J.P.; Quadrilatero, J.; Gurd, B.J.; Neder, J.A.; Tschakovsky, M.E. Do interindividual differences in cardiac output during submaximal exercise explain differences in exercising muscle oxygenation and ratings of perceived exertion? Physiol. Rep. 2018, 6, e13570. [Google Scholar] [CrossRef]
- Siebenmann, C.; Rasmussen, P.; Sørensen, H.; Zaar, M.; Hvidtfeldt, M.; Pichon, A.; Secher, N.H.; Lundby, C. Cardiac output during exercise: A comparison of four methods. Scand. J. Med. Sci. Sports 2015, 25, e20–e27. [Google Scholar] [CrossRef]
- Ananey, O.M.; Malone, J.; Warmington, S.; O’Shea, D.; Green, S.; Egaña, M. Cardiac output is not related to the slowed O2 uptake kinetics in type 2 diabetes. Med. Sci. Sports Exerc. 2011, 43, 935–942. [Google Scholar] [CrossRef] [PubMed]
- Le, V.D.T. Cardiopulmonary Exercise Testing in Aortic Stenosis. Dan. Med. J. 2017, 64, B5352. [Google Scholar] [PubMed]
- O’Connor, E.; Green, S.; Kiely, C.; O’Shea, D.; Egaña, M. Differential effects of age and type 2 diabetes on dynamic vs. peak response of pulmonary oxygen uptake during exercise. J. Appl. Physiol. 2015, 118, 1031–1039. [Google Scholar] [CrossRef] [PubMed]
- Galera, R.; Casitas, R.; Martínez-Cerón, E.; Rodríguez-Fraga, O.; Utrilla, C.; Torres, I.; Cubillos-Zapata, C.; García-Río, F. Effect of Dynamic Hyperinflation on Cardiac Response to Exercise of Patients with Chronic Obstructive Pulmonary Disease|Efecto de la hiperinsuflación dinámica en la respuesta cardíaca al ejercicio de pacientes con enfermedad pulmonar obstructiva crónica. Arch. Bronconeumol. 2021, 57, 406–414. [Google Scholar] [CrossRef]
- Jones, J.H.; Zelt, J.T.; Hirai, D.M.; Diniz, C.V.; Zaza, A.; O’Donnell, D.E.; Neder, J.A. Emphysema on Thoracic CT and Exercise Ventilatory Inefficiency in Mild-to-Moderate COPD. Copd-J. Chronic Obstr. Pulm. Dis. 2017, 14, 210–218. [Google Scholar] [CrossRef]
- Kiely, C.; Rocha, J.; O’Connor, E.; O’Shea, D.; Green, S.; Egaña, M. Influence of menopause and Type 2 diabetes on pulmonary oxygen uptake kinetics and peak exercise performance during cycling. Am. J. Physiol. Regul. Integr. Comp. Physiol. 2015, 309, R875–R883. [Google Scholar] [CrossRef]
- Laroche, D.; Joussain, C.; Espagnac, C.; Morisset, C.; Tordi, N.; Gremeaux, V.; Casillas, J.M. Is it possible to individualize intensity of eccentric cycling exercise from perceived exertion on concentric test? Arch. Phys. Med. Rehabil. 2013, 94, 1621–1627. [Google Scholar] [CrossRef]
- Schmid, J.P.; Noveanu, M.; Morger, C.; Gaillet, R.; Capoferri, M.; Anderegg, M.; Saner, H. Influence of water immersion, water gymnastics and swimming on cardiac output in patients with heart failure. Heart 2007, 93, 722–727. [Google Scholar] [CrossRef]
- American Thoracic Society; American College of Chest Physicians. ATS/ACCP Statement on cardiopulmonary exercise testing. Am. J. Respir. Crit. Care Med. 2003, 167, 211–277, Erratum in Am. J. Respir. Crit. Care Med. 2003, 1451–1452. [Google Scholar] [CrossRef]
- Reiss, N.; Schmidt, T.; Workowski, A.; Willemsen, D.; Schmitto, J.D.; Haverich, A.; Bjarnason-Wehrens, B. Physical capacity in LVAD patients: Hemodynamic principles, diagnostic tools and training control. Int. J. Artif. Organs 2016, 39, 451–459. [Google Scholar] [CrossRef] [PubMed]


| Peak VO2 (mL/min) | Peak CO (L/min) | Peak Δ(a-v) (mL/100 mL) | Peak HR (bpm) | Peak SV (mL) | Peak CI (L/min/m2) | ||
|---|---|---|---|---|---|---|---|
| Total population | All (n = 500) | 2025 ± 668 | 13.2 ± 3.5 | 15.2 ± 2.7 | 157 ± 19 | 84.5 ± 21.6 | 7.33 ± 1.59 |
| M (n = 260) | 2494 ± 560 | 15.3 ± 3.4 | 16.5 ± 2.7 | 158 ± 20 | 96.7 ± 20.3 | 7.87 ± 1.69 | |
| F (n = 240) | 1518 ± 309 | 11 ± 2.1 | 13.8 ± 2 | 156 ± 18 | 71 ± 13.7 | 6.75 ± 1.24 | |
| Age ≤ 40 | All (n = 181) | 2175 ± 688 | 14.4 ± 3.4 | 15 ± 2.5 | 168 ± 14 | 86.2 ± 19.9 | 8.15 ± 1.46 |
| M (n = 88) | 2735 ± 532 | 16.9 ± 2.9 | 16.3 ± 2.5 | 170 ± 16 | 100.1 ± 16.9 | 8.82 ± 1.57 | |
| F (n = 93) | 1646 ± 277 | 12.1 ± 1.8 | 13.7 ± 1.8 | 167 ± 13 | 73 ± 12.2 | 7.52 ± 1.02 | |
| Age 41–60 | All (n = 242) | 2042 ± 655 | 13.1 ± 3.4 | 15.5 ± 2.8 | 155 ± 17 | 85.1 ± 22.6 | 7.13 ± 1.41 |
| M (n = 134) | 2485 ± 515 | 15.1 ± 3.1 | 16.7 ± 2.8 | 156 ± 18 | 96.7 ± 21.2 | 7.64 ± 1.45 | |
| F (n = 108) | 1492 ± 292 | 10.7 ± 1.9 | 14 ± 2 | 153 ± 17 | 70.5 ± 14.4 | 6.49 ± 1.05 | |
| Age > 60 | All (n = 77) | 1627 ± 483 | 10.8 ± 2.7 | 15.1 ± 3 | 139 ± 20 | 78.9 ± 21.5 | 6.04 ± 1.37 |
| M (n = 38) | 1969 ± 392 | 12.2 ± 2.9 | 16.5 ± 2.9 | 139 ± 22 | 89.1 ± 22.5 | 6.49 ± 1.51 | |
| F (n = 39) | 1286 ± 283 | 9.5 ± 1.7 | 13.7 ± 2.4 | 140 ± 17 | 68.8 ± 14.9 | 5.59 ± 1.06 |
| Author and Year | Center | N of Patients | Methods Used | Protocol | Disease/State of Health | Age | Male Gender (n (%)) | BMI (kg/m2) | Study Design | Primary Endpoint | Secondary Endpoint | Comments and Conclusions |
|---|---|---|---|---|---|---|---|---|---|---|---|---|
| Koshy A. et al., 2019 [65] | Newcastle University and Newcastle upon Tyne Hospitals, Newcastle upon Tyne, UK | 33 | IGR | Test: progressive work rate; Equipment: semi-recumbent cycle ergometer; Watt range/protocol: 0 to maximum with workload increased at the rate of 10 watts per minute; Cadence: 60–70 rpm; IGR measurement: at rest and approximately 30 s before maximal exercise; Other: respiratory exchange ratio ≥1.05 was used as an objective indicator that a patient is approaching near maximal exertion and when rebreathing maneuver was initiated. | HF | 64 ± 9 | 26 (79%) | 28.0 ± 5.4 | prospective observational | Association between heart rate variability and hemodynamic response to exercise in chronic heart failure | IGR as secondary investigation | Cardiac autonomic function is not good indicator of overall function and pumping capability of the heart in chronic heart failure. |
| Fontana P et al., 2011 [66] | University of Zurich, Zurich, Switzerland | 15 | IGR | Test: graded cycling exercise test (GXT) + Wingate test (WT); Equipment: cycle ergometer; Watt range/protocol: 100 W (males) or 70 W (females) to maximum; Cadence: freely chosen (≥70 min−1); IGR measurement: 130 W and right before volitional exhaustion (“peak exercise”); Other: - | none (healthy and non-smoking) | 26.7 ± 5.6 | 15 (100%) | prospective observational | Effect of Wingate test (WT) on cardiac function in comparison with graded cycling exercise (GXT) | IGR as secondary investigation | Single WT produces a hemodynamic response which is characterized by similar cardiac output, higher stroke volume. and lower heart rate compared to peak exercise during a GXT. | |
| Corrieri N et al., 2021 [67] | Centro Cardiologico Monzino, IRCCS, Milan, Italy | 496 | IGR | Test: progressive work rate; Equipment: cycle ergometer; Watt range/protocol: personalized; Cadence: -; IGR measurement: at rest and after 4–5 min of loaded cycling (mid-exercise) and at peak exercise; Other: - | 231 HF patients (HF), 265 healthy volunteers (HV) | 45 33.5–55 (HV) 67 57–73 (HF) | 144 54% (HV) 169 73% (HF) | 23.5 21.4–25.4 (HV) 25.7 23.4–28.4 (HF) | retrospective analysis | Cardiac output changes during exercise in heart failure patients: focus on mid-exercise | IGR as secondary investigation | Mid-exercise VO2 and CO portend peak exercise values and identify severe HF patients. Their evaluation could be clinically useful. |
| Shelton R et al., 2010 [68] | Castle Hill Hospital, University of Hull, Kingston-upon-Hull, UK | 72 | IGR | Test: progressive work rate; Equipment: cycle ergometer; Watt range/protocol: 15–60 W; Cadence: -; IGR measurement: at rest and at 15, 30, 45, 60 W; Other: - | 23 HF patients (HF), 42 patients without HF (no-HF). Seven subjects (four CHF patients and three non-CHF patients with similar demographics) were unable to perform an adequate rebreathing maneuver and were excluded from further analysis | 68.2 ± 8.1 | 95.7%—HF; 61.9%—non-HF | 27.6 (7.7)—HF; 27.1 (4.7)—non-HF | prospective observational | Mechanisms of exercise limitation in patients with chronic heart failure | IGR as secondary investigation | During submaximal exercise, patients with systolic heart failure are able to increase their CO to a similar extent as those without with equal levels of oxygen consumption, but requiring a much greater degree of tissue oxygen extraction. |
| del Torto A et al., 2019 [59] | University of Brescia, Brescia, Italy | 7 | IGR (CO IN) and modified cardio-impedance (CO PF) | Test: progressive work rate; Equipment: cycle ergometer; Watt range/protocol: 50–250 W; Cadence: 80–85 rpm; IGR measurement: after 5 min of exercise at each step; Other: approximately one minute before exhaustion, the mouthpiece of the metabolic cart was removed and IN was assessed during the last 30 s of exercise before exhaustion. | none (young, active and healthy, non-smokers) | 25 ± 1 | 7 (100%) | prospective observational | CO measured by bioimpedance by PF vs. IGR by Innocor | __ | CO PF seems to represent a valuable alternative to invasive methods for assessing CO during sub-maximal exercise. The CO PF underestimation with respect to CO IN during supra-maximal exercise suggests that CO PF might be less optimal for supra-maximal intensities. | |
| Halbirk M et al., 2010 [31] | Aarhus University Hospital, University of Copenhagen, Copenhagen, Denmark | 15 | IGR | Test: progressive work rate; Equipment: cycle ergometer; Watt range/protocol: stages lasting 1 min and in increments of 10 watts/min; Cadence: -; IGR measurement: at rest and at peak exercise; Other: - | HF due to ischemic heart disease; GLP-1 infusion group, Placebo group | 61 ± 3 | 13 (87%) | 26 ± 3 | a double-blinded placebo-controlled crossover design | Cardiovascular and metabolic effects of 48 h glucagon-like peptide-1 infusion in compensated chronic patients with heart failure | IGR as secondary investigation | Short-term GLP-1 treatment has no significant cardiovascular effects in patients without diabetes with compensated HF. |
| Schmidt T et al., 2018 [69] | German Sports University Cologne, Cologne, Germany | 20 | IGR | Test: progressive work rate; Equipment: cycle ergometer; Watt range/protocol: Flat ramp exercise protocol was selected. Following a 2 min warm-up phase (10 watts), the load was continually increased (10 watts increase per minute) until patients reached a symptom-induced maximum exercise capacity; Cadence: -; IGR measurement: Determined individually for each patient based on his CPET results. For example, if in the CPET a patient could achieve a maximum of 75 watts, the steps for inert gas rebreathing were set at 20, 40, and 60 watts. If, however, a patient was already at his maximum performance in the ramp protocol after 60 watts, the steps were correspondingly set to 15, 30, and 45 watts; Other: - | HF supported by LVAD | 60.8 ± 7.3 | 10 (100%) | 25.7 ± 3.3 | prospective observational | Changes in Total Cardiac Output and Oxygen Extraction During Exercise in Patients Supported with an HVAD Left Ventricular Assist Device | IGR as secondary investigation | A significant increase in total CO between rest and sub-maximum exercise level could be observed |
| Okwose N et al., 2017 [70] | Newcastle University, Newcastle upon Tyne | 20 | IGR, bioreactance (BR) | Test: progressive work rate; Equipment: cycle ergometer; Watt range/protocol: six steady-state stages each lasting 3 min (30, 60, 90, 120, 150, and 180 W); Cadence: -; IGR measurement: at rest and at peak exercise; Other: rebreathing was performed and lasted about 8–12 s with a gas volume of 40–60% of the participants’ predicted vital capacity. | none (healthy) | 32 ± 10 | 9 (45%) | observational study | CO measured by bioreactance vs. IGR | __ | Bioreactance and inert gas rebreathing methods show acceptable levels of agreement for estimating cardiac output at higher levels of metabolic demand. However, they cannot be used interchangeably due to strong disparity in results at rest and low-to-moderate exercise intensity. | |
| Apostolo A et al., 2018 [71] | Centro Cardiologico Monzino, IRCCS, Milan, Italy | 33 | IGR | Test: progressive work rate, constant workload exercise; Equipment: cycle ergometer; Watt range/protocol: step 1, maximal CPET performed at LVAD pump speed 3; step 2, 2 maximal CPETs, randomly performed, with LVAD pump speed set at 3 or changing from 3 to 5; step 3, 2 constant workload CPETs on 2 different days with LVAD pump speed randomly set at 2 or 4; Cadence: -; IGR measurement: during constant workload exercise, at rest, and at the end of the active workload exercise; Other: the constant workload CPETs were performed at 60% of the workload, reached at the maximal baseline CPE, and lasted for 6 min. | HF patients supported with Jarvik 2000 LVADs | 62.4 ± 8.2 | 32 (97%) | prospective cohort study | Comprehensive effects of left ventricular assist device speed changes on alveolar gas exchange, sleep ventilatory pattern, and exercise performance | IGR as secondary investigation | Short-term LVAD speed increase improves exercise performance, CO, O2 kinetics, and muscle oxygenation. | |
| Del Torto A et al., 2017 [72] | Centro Cardiologico Monzino, IRCCS, Milan, Italy | 278 | IGR | Test: progressive work rate; Equipment: cycle ergometer; Watt range/protocol: personalized ramp protocol aimed at achieving peak exercise in around 10 min; Cadence: -; IGR measurement: at rest and at peak exercise, determined when they approached maximal exercise, allowing the final 30 s for the rebreathing maneuver; Other: - | HF | 69 57–74 | 215 (77%) | 25.8 23.4–28.4 | retrospective analysis | Contribution of central and peripheral factors at peak exercise in heart failure patients with progressive severity of exercise limitation | IGR as secondary investigation | Peak VO2 is strictly and directly related to peak CO in HF patients. In patients with more compromised exercise capacity, there was a lower peak exercise Δ(a-v)O2. Moreover, estimation of peak CO from peak VO2 in patients with most severe HF is questionable. |
| Vignati C et al., 2019 [73] | Centro Cardiologico Monzino, IRCCS, Milan, Italy | 181 | IGR | Test: progressive work rate; all patients underwent two CPETs with (CPET + CO) and without CO determination; Equipment: cycle ergometer; Watt range/protocol: personalized ramp protocol; Cadence: -; IGR measurement: at rest, at submaximal exercise (usually = 40% of exercise), and at peak; Other: - | HF | 64.6 ± 11.2 | 154 (85%) | 26.2 ± 4.1 | retrospective analysis | Impact of IGR on the main cardiopulmonary parameters during CPET | __ | The similar anaerobic threshold and peak oxygen uptake in the two tests with a lower peak workload and higher VE/VCO2 slope at CPET CO suggest higher respiratory work and consequent demand for respiratory muscle blood flow secondary to the ventilatory maneuvers. Accordingly, VE/VCO2 slope and peak workload must be evaluated with caution during CPET CO. |
| Lang C et al., 2007 [60] | Columbia University, New York | 88 | IGR | Test: progressive work rate; Equipment: cycle ergometer; Watt range/protocol: exercise began at a workload of 0 W and increased every 3 min by 25 W until symptom-limited maximal exercise was reached; Cadence: -; IGR measurement: CO measurements were made at the end of the resting period, at 50 W, and at peak exercise; Other: patients were instructed to signal approximately 1 min before peak exercise. | HF | 54 ± 13 | 68 (77%) | prospective observational | Ease of IGR during CPET among HF patients | __ | Combined metabolic stress testing with inert gas rebreathing can be easily performed in patients with HF | |
| Morosin M et al., 2018 [74] | Centro Cardiologico Monzino, IRCCS, Milan, Italy | 170 | IGR | Test: progressive work rate; Equipment: cycle ergometer; Watt range/protocol: personalized ramp protocol aimed at achieving peak exercise in around 10 min; Cadence: -; IGR measurement: at rest and at peak exercise; Other: patients were grouped according to the reason (muscular fatigue or dyspnea) that led them to terminate the procedure. | HF (MF—muscular fatigue n = 132; D—dyspnea n = 38) | MF 65 ± 11.1; D 65.1 ± 11.4 | MF 87%; D 82% | MF 26.4 ± 4.3; D 26.1 ± 3.9 | retrospective analysis | To determine if patients experiencing dyspnea or muscle fatigue exhibited distinct ventilatory or hemodynamic responses during exercise | IGR as secondary investigation | Exercise performance, hemodynamics, and respiratory pattern do not identify heart failure patients who end exercise with dyspnea from those with fatigue. |
| Cattadori G et al., 2011 [75] | Centro Cardiologico Monzino, IRCCS, Milan, Italy | 70 | IGR | Test: progressive work rate; Equipment: cycle ergometer; Watt range/protocol: ramp pattern; Cadence: -; IGR measurement: at rest and at peak exercise; Other: - | HF (“Pre”—before—and “Post”—after—an 8-week training program) | 61.6 ± 9.6 | 54 (77%) | prospective cohort study | Hemodynamic Effects of Exercise Training in Heart Failure | IGR as secondary investigation | Exercise training improves peak VO2 by increasing CO with unchanged a-vO2 diff | |
| Reiss N et al., 2018 [76] | Bad Rothenfelde, Germany | 7 | IGR | Test: progressive work rate; Equipment: cycle ergometer; Watt range/protocol: ramp protocol of 10 W/min; Cadence: -; IGR measurement: based on the results, the test protocol for inert gas rebreathing is then individually deduced; Other: In order to compensate for the transfer from ramp to step protocol, we subtract 15–20% of the maximum watt level achieved during CPET. The result is then split into three equal steps. | HF supported by LVAD | 51.7 ± 7.6 | 7 (100%) | 26.3 ± 2.5 | prospective observational | IGR as a helpful tool in the management of left ventricular assist device patients | __ | The inert gas rebreathing method is ideal for determining cardiac output in LVAD patients at rest and during exercise. It is helpful for estimating physical capacity and providing exercise guidance in this special patient group; nevertheless, until now, it is unjustifiably underused. Inert gas rebreathing displays high reproducibility, and its measuring accuracy is not impacted by either atrial fibrillation or pulmonary diseases. |
| Vignati C et al., 2017 [77] | Centro Cardiologico Monzino, IRCCS, Milan, Italy | 15 | IGR | Test: progressive work rate; Equipment: cycle ergometer; Watt range/protocol: -; Cadence: -; IGR measurement: at rest and at peak exercise; Other: on 2 days at LVAD pump speed set randomly at 2 and 4. | HF supported by LVAD | 60.8 ± 7.6 | 15 (100%) | randomized control trial | The impact of adjusting LVAD pump speed in HF patients on CO | IGR as secondary investigation | In HF, an increase in CO with a higher LVAD pump speed is associated with increased peak VO2, postponed anaerobic threshold, and improved ventilatory efficiency. | |
| Iellamo F et al., 2013 [78] | a Istituto di Ricovero e Cura a Carattere Scientifico San Raffaele Pisana, Rome, Italy | 16 | IGR | Test: progressive incremental test; Equipment: treadmill; Watt range/protocol: modified Bruce protocol; Cadence: -; IGR measurement: -; Other: - | postinfarction CHF—chronic heart failure (ACT—aerobic continuous training n = 8; AIT—aerobic interval training n = 8) | ACT 62.6 ± 9 AIT 62.2 ± 8 | 16(100%) | ACT 27.2 ± 3 AIT 27.8 ± 2 | randomized control trial | To test the hypothesis that aerobic continuous training (ACT) and aerobic interval training (AIT) induce similar effects on functional capacity, central hemodynamics, and metabolic profile in patients with postinfarction CHF | IGR as secondary investigation | ACT and AIT both induce significant improvement in aerobic capacity in patients with postinfarction CHF, without significant differences between the two training modes. |
| Pokan R et al., 2014 [79] | University of Vienna, Vienna, AUSTRIA | 8 | IGR | Test: incremental pretest and continuous 24 h ultra-endurance performance; Equipment: cycle ergometer; Watt range/protocol: blood lactate concentration was used to assess the first and second lactate turn point (LTP1 and LTP2) and the corresponding power output for each subject to subsequently determine the appropriate submaximal workload that the athlete could sustain and complete during the ultra-endurance test; Cadence: ≥70 rpm; IGR measurement: at rest and during the last 5 min of every hour throughout the 24 h ultra endurance performance; Other: one week before the continuous 24 h ultra endurance performance, subjects completed a single incremental cycle ergometer exercise test to volitional fatigue. | ultra endurance cycling athletes | 39 ± 8 | 8 (100%) | prospective observational | Myocardial Dimensions and Hemodynamics during 24 h Ultra endurance Ergometry | IGR as secondary investigation | The decrease in HR during 24 h of ultra-endurance exercise was due to hypervolemia and the associated ventricular loading, increasing left ventricular diastolic dimensions. | |
| Accalai E et al., 2021 [61] | Centro Cardiologico Monzino, IRCCS, Milan, Italy | 1007 | IGR | Test: progressive work rate; Equipment: cycle ergometer; Watt range/protocol: personalized ramp protocol; Cadence: -; IGR measurement: at rest, at submaximal exercise (50% of exercise duration), and at peak exercise; Other: - | HF—heart failure (n = 507), HC—healthy controls (n = 500) | HC 44.9 ± 13.4; HF 65.3 ± 12.4 | HC 240 (48%); HF 400 (81%) | HC 23.4 ± 3.4; HF 26 ± 4.2 | retrospective analysis | Non-invasive estimation of stroke volume during exercise from oxygen in heart failure patients | IGR as secondary investigation | In heart failure patients, both the estimation of stroke volume and the measurement of oxygen pulse during exercise are indicative of stroke volume. However, there is notable variability in individual data, making them suitable for population studies, but not sufficiently reliable for assessing a single subject. As a result, direct measurement of stroke volume is necessary when accuracy is required. |
| Fontana p et al., 2010 [80] | University of Zurich, Zurich, Switzerland | 16 | IGR | Test: progressive work rate (3 tests); Equipment: cycle ergometer; Watt range/protocol: test 1—increments of 30 W every 2 min until volitional exhaustion; Cadence: freely chosen (≥70 rpm); IGR measurement: in test 2 and 3 at 69, 77, and 85% peak power attained in test 1; Other: Test 1 served for determining peak power and maximal gas exchange. The respective rebreathings were performed in a randomized order, either during the first or the second minute on each stage (either in test 2 or 3). | recreationally trained male cyclists | 25.4 ± 2.9 | 16 (100%) | prospective observational | Non-invasive hemodynamic assessments using InnocorTM during standard graded exercise tests (GXT) | __ | It is feasible to non-invasively determine CO by IGR at 46 and 103 s on moderate and high-intensity submaximal GXT stages, using the InnocorTM device. This study also shows that CO of recreationally trained cyclists does not change between these two points in time at 69, 77, and 85% peak power. | |
| Prochnau D et al., 2012 [81] | Friedrich Schiller University, Jena, Germany | 27 | IGR, impedance cardiography | Test: constant workload exercise; Equipment: cycle ergometer; Watt range/protocol: standardized, steady-state bibycle exercise at 30 W; Cadence: -; IGR measurement: at rest was measured with the following AVD: 60, 90, 120, and 150 ms consecutively; Other: - | HF + CRT | 69.9 ± 10 | 22 (81.5%) | prospective observational | Optimization of the atrioventricular delay during cardiac resynchronization therapy (CRT) using a device for non-invasive measurement of cardiac index (CI) at rest and during exercise | IGR as secondary investigation | Shortening or lengthening of the atrioventricular delay (AVD). AVD during exercise has no impact on CI in CRT patients. On the basis of our results, we conclude that in CRT patients the AVD should be programmed and fixed even during exercise. | |
| Lang C et al., 2009 [82] | Columbia University, New York, NY | 148 | IGR | Test: progressive work rate; Equipment: cycle ergometer; Watt range/protocol: exercise began at a workload of 0 W and increased every 3 minutes by 25 W until symptom limited maximum; Cadence: -; IGR measurement: at the end of the rest period, at 25 W, and at peak exercise; Other: patients were instructed to signal 1 min before peak exercise. | HF | 53 ± 14 | 119 (80%) | 28 ± 5 | prospective observational | To compare the prognostic value of peak CO and cardiac power to peak VO2 in chronic heart failure patients | IGR as secondary investigation | Peak cardiac power, measured non-invasively, is an independent predictor of outcome that can enhance the prognostic power of peak VO2 in the evaluation of patients with heart failure. |
| Agostoni P et al., 2017 [57] | Centro Cardiologico Monzino, IRCCS, Milan, Italy | 500 | IGR | Test: progressive work rate; Equipment: cycle ergometer; Watt range/protocol: personalized ramp protocol aimed at achieving peak exercise in 8 to 12 min; Cadence: -; IGR measurement: at rest and at peak exercise, determined when they approached maximal exercise, allowing the final 30 s for the rebreathing maneuver; Other: - | none (healthy) | 45 ± 13.5 | 260 (52%) | prospective observational | To establish the reference Values for Peak Exercise Cardiac Output in Healthy Individuals | __ | The simultaneous measurement of CO and VO2 at peak exercise in a large sample of healthy subjects provided an equation to predict peak CO from peak VO2 values. | |
| Jakovljevic D et al., 2011 [83] | Newcastle University, Newcastle upon Tyne | 54 | IGR | Test: progressive work rate; Equipment: treadmill; Watt range/protocol: modified Bruce protocol (implanted LVAD) or the Bruce protocol (explanted LVAD); Cadence: -; IGR measurement: At rest and at peak exercise. Patients were instructed to give a 1 min warning before they felt they would end the exercise so that a final cardiac output rebreathing measurement was obtained; Other: - | HF—heart failure (n = 20); LVAD—implanted LVAD (n = 18); exLVAD—explanted LVAD (n = 16) | 22–64 | 54 (100%) | 26.8 ± 4.7 | prospective observational | To assess the relationship between cardiac pumping capability represented by peak cardiac power output and peak oxygen consumption, anaerobic threshold, ventilatory efficiency slope, and peak circulatory power in patients treated with LVAD | IGR as secondary investigation | Powerful exercise-derived prognostic indicators, including peak oxygen consumption, anaerobic threshold, circulatory power, and ventilatory efficiency slope demonstrate limited capacity to reflect cardiac organ function in patients treated with LVADs. The imperfect correlation between cardiac power and other exercise-derived variables may suggest that exercise performance of LVAD-implanted patients may be limited by factors other than cardiac. |
| Fontana P et al., 2009 [63] | University of Zurich, Zurich, Switzerland | 30 | IGR | Test: progressive work rate (2 sessions, 4 tests—both, sessions A and B, consisted of 2 graded exercise tests (A1 and A2; B1 and B2) with 1 h rest in between); Equipment: cycle ergometer; Watt range/protocol: start at 100 W (males) or 70 W (females) to volitional exhaustion; Cadence: freely chosen (≥70 rpm); IGR measurement: at rest, at 130 W, and right before volitional exhaustion (“peak exercise”); Other: - | healthy, asymptomatic, non-smoking, and recreationally active | 30.6 ± 4.5 | 15 (50%) | prospective observational | Reliability of Measurements with Innocor TM during Exercise | __ | Innocor™ (Denmark, Odense) delivers safe and reliable measurements of cardiac output, gas exchange, and ventilation. Therefore, Innocor™ can be used to assess these parameters in exercise physiology studies as well as in performance diagnostics. | |
| Jakovljevic D et al., 2012 [84] | Newcastle University, Newcastle upon Tyne | 19 | IGR | Test: progressive work rate; Equipment: treadmill; Watt range/protocol: modified Bruce protocol; Cadence: -; IGR measurement: at rest and at near-maximal exercise [defined as at least one of the following: RER (respiratory exchange ratio) > 1.05, the absence of a rise in VO2 with further increase in exercise intensity, Borg scale > 17]; Other: - | HF—heart failure | 62 ± 11 | 15 (79%) | 26.6 ± 4.0 | prospective observational | Reproducibility of cardiac power output and other cardiopulmonary exercise indices in patients with chronic HF | __ | Cardiac power output demonstrates good reproducibility suggesting that there is no need for performing more than one CPET. As a direct measure of cardiac function (dysfunction) and an excellent prognostic marker, it is strongly advised in the assessment of patients with chronic HF undergoing CPET. |
| Okwose N et al., 2019 [51] | Newcastle University, Newcastle upon Tyne | 13 | IGR | Test: progressive work rate; Equipment: semi-recumbent cycle ergometer; Watt range/protocol: 6 steady-state stages, each lasting 3 min (30, 60, 90, 120, 150, and 180 W); Cadence: -; IGR measurement: at rest and at 60, 120, 150, and 180 W; Other: participants visited the laboratory on 2 occasions (2 days apart, Test 1 and Test 2). | healthy | 27 (23–32) | 10 (77%) | 23.5 ± 2.2 | prospective observational | Reproducibility of IGR Method to Estimate CO at Rest and During CPET | __ | The IGR method demonstrates an acceptable level of test–retest reproducibility for estimating CO at rest and during CPET at higher metabolic demands. |
| Vignati C et al., 2021 [85] | Centro Cardiologico Monzino, IRCCS, Milan, Italy. | 115 | IGR | Test: progressive work rate; Equipment: cycle ergometer; Watt range/protocol: -; Cadence: -; IGR measurement: at rest and at peak exercise; Other: - | patients with PMR (primary mitral regurgitation, n = 62) and FMR (functional mitral regurgitation, n = 53), before (PRE-pMVR) and after (POST-pMVR) pMVR (percutaneous edge-to-edge mitral valve repair) | 77 ± 8 | 75 (65%) | 25 ± 4 | prospective observational | To assess the efficacy of percutaneous edge-to-edge mitral valve repair (pMVR) at rest by echocardiography, VO2, and CO (IGR) measurement and during CPET with CO measurement | IGR as secondary investigation | The data confirm pMVR-induced clinical improvement and reverse ventricular remodeling at a 6-month analysis and show, despite an increase in CO, an unchanged exercise performance, which is achieved through a ‘more physiological’ blood flow distribution and O2 extraction behavior. Direct rest and exercise CO should be measured to assess pMVR efficacy. |
| Bentley R et al., 2019 [86] | Queen’s University, Kingston, ON, Canada | 22 | IGR, finger photoplethysmography | Test: progressive work rate; Equipment: cycle ergometer; Watt range/protocol: Test beginning with rest and increasing by 40 W every 4 min until 160 W. Beyond 160 W, exercise increased by 25 W every minute until volitional exhaustion; Cadence: self-selected; IGR measurement: during the last ~30 s of rest and each completed exercise intensity up to 160 W; Other: - | none (healthy) PRE—before training; POST—after training | 21 ± 2 | 22 (100%) | 23.9 ± 2.5 | prospective observational | Importance of cardiac response phenotype | IGR as secondary investigation | The findings emphasize the importance of recognizing individual response differences in attempting to understand the integrated cardiovascular response to exercise and to exercise training. |
| Jakovljevic D et al., 2010 [87] | Newcastle University, Newcastle upon Tyne | 12 | IGR | Test: progressive work rate; Equipment: treadmill; Watt range/protocol: modified Bruce protocol; Cadence: -; IGR measurement: at rest and at peak exercise; Other: Patients visited the transplant exercise laboratory twice during the same day with at least 4 h rest between the two visits. During the first (morning) visit, the HeartMate II LVAD support was optimal with speed ranging from 9000 to 9600 revolutions per minute (rpm). Provided that the international normalization ratio was >2 during the second (afternoon) visit, the HeartMate II LVAD support was reduced and the speed decreased from optimal to 6000 rpm. | HF supported by LVAD | 33 ± 13 | 12 (100%) | 23.6 ± 4.2 | prospective observational | To assess cardiac and exercise performance in patients implanted with the HeartMate II LVAD under two settings: (i) optimal device support and (ii) reduced device support. | IGR as secondary investigation | HeartMate II LVAD can confer both resting and peak cardiac functional benefits to patients with end-stage HF, thus improving exercise capacity. |
| Shen Y et al., 2016 [88] | Tongji Hospital of Tongji University, Shanghai, China | 129 | IGR | Test: progressive work rate; Equipment: cycle ergometer; Watt range/protocol: modified Ramp10 protocol—the exercise began with a 3 min warm-up at 0 W, and thereafter, 10 W increment in load was administered every minute after exercising at 20 W for 2 min; Cadence: 60–70 rpm; IGR measurement: at the end of the rest period, at 30 W, 60 W, 90 W, and 120 W; Other: - | CHF—chronic heart failure | 59.1 ± 11.4 | 113 (87.6) | 24.7 ± 3.7 | prospective observational | The Prognostic Value of Peak CPO in Chinese Patients with Chronic HF | IGR as secondary investigation | Peak CPO is not a predictor of cardiac death in Chinese CHF patients. |
| Rajani R et al., 2010 [89] | Guy’s and St Thomas’ Hospitals Foundation Trust, London, UK | 38 | IGR | Test: progressive work rate; Equipment: treadmill; Watt range/protocol: Bruce protocol modified by two warm-up stages; Cadence: -; IGR measurement: before the commencement of the exercise test, at each stage during exercise, and then during recovery; Other: - | aortic stenosis (AS—asymptomatic n = 28; S—symptomatic n = 10) | 63 (29–83) | 32 (84%) | 26.7 ± 3.4 | prospective observational | Relationship between CI and revealed symptoms in patients with aortic stenosis | IGR as secondary investigation | Revealed symptoms on treadmill exercise in apparently asymptomatic aortic stenosis were associated with lower peak myocardial VO2 and lower peak stroke index during exercise. The strongest resting predictor of revealed symptoms and of peak cardiac index was the blood BNP level. |
| Pastormerlo L et al., 2015 [90] | Fondazione G. Monasterio CNR-Regione Toscana, Pisa, Italy | 30 | IGR | Test: progressive work rate; Equipment: cycle ergometer; Watt range/protocol: ramp protocol individualized to achieve target respiratory exchange ratio of at least 1.05 and exercise duration of 10 ± 2 min; Cadence: -; IGR measurement: at rest and at peak exercise; Other: - | HF (hsT < 20%—hs-Troponin Increase < 20% n = 20; hsT > 20%—hs-Troponin Increase > 20% n = 10) | 62.5 ± 1.5 | 27 (90%) | 25.4 ± 3.2 | prospective observational | Usefulness of Highly Sensitive Troponin Elevation After Effort Stress to Unveil Vulnerable Myocardium in Patients With HF | IGR as secondary investigation | The association of troponin release with norepinephrine, CO, and NT-proBNP changes after effort suggests a pathophysiological link among transient hemodynamic overload, adrenergic activation, and myocardial cell damage, likely identifying a clinical subset at greater risk for HF progression. |
| Goda A et al., 2009 [58] | Columbia University, New York | 145 | IGR | Test: progressive work rate; Equipment: upright, braked cycle ergometer; Watt range/protocol: after 3 min of rest, exercise was begun at 0 W and increased every 3 min by 25 W until symptom-limited maximal exercise was achieved; Cadence: -; IGR measurement: at the end of the rest period, at 25 W, and at peak exercise; Other: - | HF | 51.1 ± 13.6 | 186 (72%) | 28.7 ± 13.5 | prospective observational | Usefulness of Non-Invasive Measurement of CO During Sub-Maximal Exercise to Predict Outcome in Patients With Chronic HF | __ | CO at 25 W measured non-invasively during submaximal exercise may have potential value as a predictor of outcomes in patients with CHF. |
| Hassan M et al., 2017 [91] | Cairo University, Egypt | 97 | IGR; CC—cadriac catheterization; CMR— cardiac magnetic resonance; echocardiography | Test: CPET; Equipment: treadmill; Watt range/protocol: -; Cadence: -; IGR measurement: -; Other: the resting CO measurements were repeated after 15 min to check for reproducibility of measurements in 30 patients. | HF | 42 ± 15.5 | 71 (73.2%) | 28 ± 6.4 | prospective observational | Validation of Non-invasive Measurement of CO Using IGR in a Cohort of Patients With HF and Reduced Ejection Fraction | __ | The IGR method is a simple, accurate, and reproducible non-invasive method for quantification of CO in patients with advanced heart failure. The prognostic value of this simple measurement needs to be studied prospectively. |
| Lee W et al.m 2011 [92] | Golden Jubilee National Hospital, Glasgow, UK | 24 | IGR | Test: progressive work rate, followed by constant load; Equipment: cycle ergometer; Watt range/protocol: progressive work rate—2 min of rest, followed by 3 min of unloaded cycling, and then cycling at a ramp rate of 5–20 Watts/min to achieve peak work rate in 8–12 min; constant work—2 min of rest followed by 3 min of cycling at 40% maximal work rate predetermined in the incremental CPET; Cadence: -; IGR measurement: during constant load cycling, at the end of exercise; Other: the development of right-to-left shunt through a patent foramen ovale during exercise was assessed using a set of published pulmonary gas exchange criteria. | precapillary PH (pulmonary hypertension) | 59 ± 15 | 16 (66%) | prospective observational | Use of non-invasive hemodynamic measurements to detect treatment response in precapillary PH | __ | Non-invasive IGR hemodynamic measurements could be used to detect treatment response in patients with precapillary PH and may be more responsive to change than 6MWD in fitter patients. | |
| Bentley R et al., 2018 [93] | Queen’s University, Kingston, Ontario, Canada | 31 | IGR, finger photoplethysmography | Test: progressive work rate; Equipment: cycle ergometer; Watt range/protocol: Test beginning with rest and increasing by 40 W every 4 minutes until 160 W. Beyond 160 W, exercise increased by 25 W every minute until volitional exhaustion; Cadence: self-selected; IGR measurement: at rest and during exercise at 40 W increments once every 4 min up to 160 W; Other: pilot work (n = 4)-CO variability—2.2% for exercise intensities up to 200 W. | none (healthy and non-smoking); divided post-hoc into: LCR—lower cardiac resoinders (n = 10); HCR—higher cardiac responder (n = 10) | 21 ± 3 | 31 (100%) | 23 ± 2.4 | prospective observational | Impact of interindividual differences in CO during submaximal exercise on exercising muscle oxygenation and ratings of perceived exertion | IGR as secondary investigation | Interindividual differences in CO during submaximal exercise have no impact on exercising muscle oxygenation and ratings of perceived exertion. |
| Siebenmann C et al., 2015 * [94] | University of Zürich, Institute of Physiology | 12 | the Fick method, IGR, impedance cardiography, pulse contour analysis | Test: progressive work rate; Equipment: cycle ergometer; Watt range/protocol: First trial (normoxic)—For 3 min unloaded, 6 min at 112.5 W, and 10 min at 150 W. Thereafter, the workload was increased by 37.5 W every 1.5 min until exhaustion. Second trial (performed with the inspired O2 fraction reduced by N2 dilution) to 12% (∼4000 m)—3 min bouts of cycling at 75 W, 112.5 W, and 150 W, respectively. The load was then increased as in the normoxic trial by 37.5 W every 1.5 min until exhaustion; Cadence: 75 rpm; IGR measurement: In normoxia, CO was determined at rest, at 112.5 W, 150 W, and at every second step of the incremental trial, i.e., every third minute after the 185.5 W workload. During hypoxia, CO was assessed at the same workloads and additionally at 75 W with the rebreathing maneuver starting immediately after blood sampling, approximately 30 s before the end of the workload; Other: - | none (healthy) | 25 ± 5 | 12 (100%) | prospective observational | CO during exercise: comparison of four methods | __ | Although all methods have been validated, they may generate significantly different CO values within the same subjects. Different measurement techniques for CO should be taken into account by researchers as well as physicians when comparing the outcome of evaluations. | |
| Ananey, O. et al., 2011 * [95] | Trinity College Dublin, Dublin, Ireland | 29 | IGR | Test: progressive work rate; Equipment: cycle ergometer; Watt range/protocol: On testing day 1, subjects completed a graded cycle test to fatigue. After 3 min of rest, subjects cycled at an initial workload of 40 W for 3 min before the workload was increased by 20 W every 3 min until a cadence of 60 rpm could not be maintained (i.e., task failure). On testing days 2 and 3, subjects were required to complete six 7 min exercise bouts on each day, so that, during the 2 d, each subject completed four exercise bouts at each of the following three intensities relative to the workloads achieved at VT and peak VO2, as defined by the graded test performed on day 1:50% VT, 80% VT, and midpoint between VT and peak workload (50% A), Cadence: 60 rpm; IGR measurement: during the final exercise bout, only on testing day 3, but at two time points (at 30 and 240 s) during each 7 min exercise period at each intensity; Other: - | DMT2—type 2 diabetes mellitus (n = 9); HC—overweight but otherwise healthy controls (“heavy controls”, n = 9); and LC—lean and healthy controls (“lean controls”, n = 11) | 49.1 ± 5.7 (DMT2); 42.5 ± 12.6 (HV); 44.1 + 8.2 (LC) | 0(0%) | 34.4 ± 7.4 (DMT2); 29.0 ± 8.7 (HV); 22.7 ± 1.2 (LC) | prospective observational | To investigate whether CO responses are related to VO2 kineties during cycling in type 2 diabetes | IGR as secondary investigation | Type 2 diabetes slows the dynamic response of VO2 during light and moderate relative intensity exercise in females, but this occurs in the absence of any slowing of the CO response during the initial period of exercise. |
| Van Doan Tuyet Le, 2015 * [96] | Roskilde University Hospital, Roskilde, Denmark | 131 | IGR | Test: progressive work rate; Equipment: cycle ergometer; Watt range/protocol: the load was calculated and set to reach the predicted VO2 in approximately 8–10 min, with linear increments in load at 1 min intervals after 3 min of unloaded cycling, Cadence: -; IGR measurement: at rest and during submaximal exercise beyond the anaerobic threshold, which is the point of maximal stroke volume during exercise; Other: the stroke volume index (SVI) was calculated at rest and during exercise (SVIrest and SVI-exercise) from the cardiac output, heart rate, and body surface. | Aortic stenosis (asymptomatic or equivocal symptomatic) | 72.1 ± 9.3 | 83 (63%) | 26.8 ± 4.0 | prospective observational | Cardiopulmonary Exercise Testing in Aortic Stenosis | IGR as secondary investigation | Equivocal symptomatic patients are characterized by lower pVO2 and a low aortic valve area index, but with lower gradients. Both CPET and IGR confirmed that this was due to a lower stroke volume. |
| O’Connor E et al., 2015 * [97] | Trinity College Dublin, Dublin, Ireland | 54 | IGR | Test: progressive work rate; Equipment: cycle ergometer; Watt range/protocol: Day 1—an initial power output of 40 W for 3 min using a fixed cadence (60 rpm). Thereafter, the power output was increased by 30 W every 3 min until the required cadence could not be maintained. Day 2—subjects performed six, 6 min bouts of cycling at 80% VT, with each bout separated by 12 min of rest and preceded by a 3 min cycling period at 10 W (“unloaded” cycling); Cadence: 60 rpm; IGR measurement: at rest, 30 s, and 240 s Other: - | DMT2—type 2 diabetes mellitus (n = 33; 15 middle-aged; 18 older); HC—healthy controls (n = 21; 11 middle-aged; 10 older) | (Middle-aged: controls/T2DM; Older: controls/T2DM): (48 ± 10/52 ± 7; 64 ± 2/64 ± 3) | 54 (100%) | (Middle-aged: controls/T2DM; Older: controls/T2DM): (28.8 ± 3.8/29.3 ± 2.8; 28.2 ± 2.9/30.3 ± 3.1) | prospective observational | Differential effects of age and type 2 diabetes on dynamic vs. peak response of pulmonary oxygen uptake during exercise | IGR as secondary investigation | The mechanisms by which type 2 diabetes induces significant reductions in peak exercise performance are linked to a slower dynamic response of VO2 and reduced systemic vascular conductance responses in middle-aged men, whereas this is not the case in older men. |
| Galera R et al., 2021 * [98] | Hospital Universitario La Paz-IdiPAZ, Madrid, Spain | 82 | IGR | Test: progressive work rate; Equipment: cycle ergometer; Watt range/protocol: 15 W/min; Cadence: -; IGR measurement: at the end of the resting period, at 15 W, and at 45 W; Other: - | COPD (n = 57), healthy control (HC) (n = 25) | COPD 62 ± 10; HC 59 ± 8 | COPD 38 (67%); HC 18 (72%) | COPD 26.8 ± 4.0; HC 26.4 ± 3.4 | prospective observational | To compare the exercise response of SV and CO between COPD patients with or without dynamic hyperinflation and control subjects | IGR as secondary investigation | Dynamic hyperinflation decreases the cardiac response to exercise of COPD patients. |
| Joshua H. Jones et al., 2016 * [99] | Queen’s University, Kingston, Ontario, Canada | 45 | IGR | Test: progressive work rate and constant wok rate test (on a different day, at least 48 h apart); Equipment: cycle ergometer; Watt range/protocol: progressive work rate—selected individually; constant work—5 min 25 and 50 W exercise bouts separated by 5 min resting periods; Cadence: -; IGR measurement: at rest and after 3 min of exercise; Other: - | COPD (n = 19), healthy control (HC) (n = 26) | COPD 62 ± 6 (male); 65 ± 11 (female); HC 61 ± 9 | COPD 9 (47%); HC 14 (54%) | COPD 27.4 ± 5.2; HC 26.8 ± 4.1 | prospective observational | Exercise capacity of COPD patients with emphysema | IGR as secondary investigation | The observed association between emphysema extent and low exercise PBF likely represents the combined effects of poor lung perfusion in emphysematous areas with the undesired consequences of higher alveolar dead space on IGR measurements. |
| Kiely C et al., 2015 * [100] | Trinity College Dublin, Dublin, Ireland | 44 | IGR | Test: progressive work rate, constant work test; Equipment: cycle ergometer; Watt range/protocol: day 1—subjects completed a graded cycling exercise test; after a 3 min period of seated rest, all subjects began the graded test by cycling at an initial power output of 40 W for 3 min using a fixed cadence (60 rpm). Thereafter, the power output was increased by 20 W every 3 min until the required cadence could not be maintained (i.e., task failure). On testing day 2, subjects performed six, 6 min bouts of cycling at 80% VT, with each bout separated by 12 min of rest and preceded by a 3 min cycling period at 10 W; Cadence: 60 rpm; IGR measurement: at rest, 30 s, and 240 s; Other: - | DMT2—type 2 diabetes mellitus (n = 22; 8 premenopausal (DMT2/Pre-m), 11 postmenopausal (DMT2/Post-m)); HC—healthy controls (n= 22; 11 premenopausal (HC/Pre-m), 11 postmenopausal (HC/Post-m)) | (DMT2/Pre-m) 44 ± 1; (DMT2/Post-m) 55 ± 4; (HC/Pre-m) 40 ± 5; (HC/Post-m) 55 ± 2 | 0(0%) | (DMT2/Pre-m) 33.1 ± 5; (DMT2/Post-m) 31.1 ± 3; (HC/Pre-m) 30.4 ± 3.3; (HC/Post-m) 30.3 ± 3.2 | prospective observational | Hemodynamic responses during graded and constant-load plantar flexion exercise in middle-aged men and women with type 2 diabetes | IGR as secondary investigation | The magnitude of T2D-induced impairments in peak O2 and O2 kinetics is not affected by menopausal status in participants younger than 60 yr of age. |
| Laroche D et al., 2013 * [101] | University Hospital of Dijon, Dijon, France | 18 | IGR | Test: progressive work rate; Equipment: cycle ergometer; Watt range/protocol: initial power 50 W/min, increments 25 W/min; Cadence: 60 rpm; IGR measurement: at rest, at 11 minutes, and at 20 min after the start of exercise; Other: - | none (healthy) | 27.4 ± 5.3 | 15 (83%) | 22.7 ± 1.8 | prospective observational | To assess the safety and acute effects of a procedure using perceived exertion during a prior submaximal concentric (CON) test to individualize eccentric (ECC) cycling exercise intensity | IGR as secondary investigation | Moderate-intensity ECC cycling exercise tailored according to perceived exertion during a prior CON test is well tolerated. It corresponds to a limited muscular use of oxygen and to an isolated increase in stroke volume. It appears to be a feasible procedure for preconditioning before ECC training. |
| Middlemiss, J. E. et al., 2018 * [56] | University of Cambridge, Cambridge, UK | 20 | IGR | Test: progressive work rate; Equipment: cycle ergometer; Watt range/protocol: exercise at 20 and 35 rpm, corresponding to approximately 12 and 25 watts, respectively, for 5 min at each workload; Cadence: 20–35 rpm; IGR measurement: at rest, at 11 min, and in the final minute of each workload; Other: - | none (healthy) | 32 ± 11 | 9 (45%) | 24.4 ± 4.3 | prospective observational | Evaluation of inert gas rebreathing for determination of cardiac output: influence of age, gender, and body size | __ | IGR using the Innocor device provides repeatable measurements of CO and related indices, which are sensitive to the effects of acute physiological maneuvers. Moreover, IGR is a suitable technique for examining chronic influences such as age, gender, and body size on key hemodynamic components of the arterial blood pressure. |
| Schmid J et al., 2015 * [102] | Bern University Hospital and University of Bern, Switzerland | 29 | IGR | Test: progressive work rate; Equipment: cycle ergometer; Watt range/protocol: 15 W/2 min; Cadence: -; IGR measurement: at the end of each step; Other: measurements conducted at 540 m and 3454 m altitude. | HF (IHD—ischemic heart disease, n = 19; ICD—with an implantable cardioverter defibrillator, n = 10) | 60.0 ± 8.9 | 25 (86%) | prospective observational | Influence of water immersion, water gymnastics, and swimming on cardiac output in patients with heart failure | IGR as secondary investigation | Although cardiac index and V˙ O2 are lower than in patients with coronary artery disease with preserved left ventricular function and controls, these patients are able to increase cardiac index adequately during water immersion and swimming. |
| Author and Year | Disease/State of Health | Rest CO (L/min)—Healthy | Rest CO (L/min)—Disease | Peak CO (L/min)—Healthy | Peak CO (L/min)—Disease | Rest CI (L/min/m2)—Healthy | Rest CI (L/min/m2)—Disease | Peak CI (L/min/m2)—Healthy | Peak CI (L/min/m2)—Disease | Rest SV (mL/beat)—Healthy | Rest SV (mL/beat)—Disease | Peak SV (mL/beat)—Healthy | Peak SV (mL/beat)—Disease | Rest VO2 (mL/kg/min)—Healthy | Rest VO2 (mL/kg/min)—Disease | Peak VO2 (mL/kg/min)—Healthy | Peak VO2 (mL/kg/min)—Disease | Rest VO2 (L/min)—Healthy | Rest VO2 (L/min)—Disease | Peak VO2 (L/min)—Healthy | Peak VO2 (L/min)—Disease | Rest ΔC(a-v)O2—Healthy | Rest ΔC(a-v)O2—Disease | Peak ΔC(a-v)O2—Healthy | Peak ΔC(a-v)O2—Disease |
|---|---|---|---|---|---|---|---|---|---|---|---|---|---|---|---|---|---|---|---|---|---|---|---|---|---|
| Koshy A. et al., 2019 [65] | HF | 5.32 ± 1.28 | 10.34 ± 3.14 | 77.83 ± 23.47 | 91.43 ± 40.77 | 3.99 ± 1.17 | 19.04 ± 5.64 | 0.33 ± 0.10 | 1.57 ± 0.42 | ||||||||||||||||
| Fontana P et al., 2011 [66] | none (healthy and non-smokng) | 18.2 ± 3.3 (WT) 17.9 ± 2.6 (GXT) | 127 ± 37 (WT) 94 ± 15 (GXT) | 45.0 ± 5.3 | |||||||||||||||||||||
| Corrieri N et al., 2021 [67] | 231 HF patients (HF), 265 healthy volunteers (HV) | 5.5 4.6–6.6 | 3.5 2.8–4.2 | 13.6 11.2–16.0 | 6.7 5.2–8.5 | 3.1 2.6–3.6 | 1.8 1.6–2.2 | 7.5 6.7–8.5 | 3.5 3.0–4.5 | 67 55–84 (mL) | 50 41–63 (mL) | 85 71–104 (mL) | 65 53–85 (mL) | 4.7 4.0–5.5 | 4.3 3.6–4.7 | 28.1 23.7–34.2 | 14.1 11.4–16.8 | 0.314 0.279–0.376 | 0.300 0.256–0.350 | 1.953 1.522–2.579 (mL/min) | 1.018 0.800–1.323 | 5.8 4.9–7.6 (mL/100 mL) | 9.1 7.4–10.6 (mL/100 mL) | 14.6 10.9–16.3 (mL/100 mL) | 15.6 13.8–17.8 (mL/100 mL) |
| Shelton R et al., 2010 [68] | 23 HF patients (HF), 42 patients without HF (no-HF); seven subjects (four CHF patients and three non-CHF patients with similar demographics) were unable to perform an adequate rebreathing manoeuvre and were excluded from further analysis | 2.1 (0.6) | 1.8 (0.5) | 4.2 (0.7) | 3.6 (0.8) | 0.27 (0.08) | 0.27 (0.08) | 1.0 (0.14) | 1.02 (0.15) | 32.4 (7.4) (%) | 37.8 (4.9) (%) | 63.0 (12.1) (%) | 75.4 (10.4) (%) | ||||||||||||
| del Torto A et al., 2019 [59] | none (young, active, and healthy, non-smokers) | PF 10.4 ± 1.7 (50 W); IN 12.6 ± 1.0 (50 W) | PF 22.9 ± 2.5 (250 W); IN o 20.8 ± 1.4 (250 W) | 1.21± 0.04 (50 W) | 3.62 ± 0.06 (250 W) | 96.8 ± 6.8 (50 W) (mL/L) | 174.7 ± 9.3 (250 W) (mL/L) | ||||||||||||||||||
| Halbirk M et al., 2010 [31] | HF due to ischemic heart disease; GLP-1 infusion group, Placebo group | GLP-1 1.5 ± 0.1; Placebo 1.7 ± 0.2 | GLP-1 4.0 ± 0.6; Placebo 3.9 ± 0.4 | GLP-1 40 ± 3; Placebo 46 ± 5 | GLP-1 74 ± 12; Placebo 72 ± 8 | GLP-1 3.3 ± 0.5; Placebo 3.4 ± 0.6 | GLP-1 18 ± 2; Placebo 16 ± 2 | ||||||||||||||||||
| Schmidt T et al., 2018 [69] | HF supported by LVAD | 3.76 (±0.9) | 6.95 (±1.4) | 1.9 (±0.4) | 3.5 (±0.7) | 3.3 (±0.6) | 10.9 (±2.6) | 7.4 (±1.9) (mL/dL); 44 (±10) (% of oxygen content) | 13.2 (±13.1) (mL/dL); 75 (±12) (% of oxygen content) | ||||||||||||||||
| Okwose N et al., 2017 [70] | none (healthy) | IGR 6.5 ± 2; BR 7.8 ± 1 | IGR 18.5 ± 2,6; BR 21.6 ± 3.3 | IGR 3.5 ± 1; BR 4.4 ± 1 | IGR 9.2 ± 1.8; BR 10.9 ± 1.5 | IGR 90 ± 28; BR 104 ± 14 (mL) | IGR 119 ± 30; BR 124 ± 23 (mL) | 2.17 ± 0.7 | IGR 16.6; BR 15.5 (mL/dL) | ||||||||||||||||
| Apostolo A et al., 2018 [71] | HF patients supported with Jarvik 2000 LVADs | Speed 2 3.18 ± 0.76; Speed 4 3.69 ± 0.75 | Speed 2 5.91 ± 1.31; Speed 4 6.69 ± 0.99 | Speed 2 1.63 ± 0.35; Speed 4 1.89 ± 0.38 | Speed 2 3.05 ± 0.61; Speed 4 3.47 ± 0.50 | Speed 3 11.7 ± 2.8; Speed 3-4-5 12.5 ± 2.5 | Speed 3 948 ± 238; Speed 3-4-5 1014 ± 219 (mL/min) | ||||||||||||||||||
| Del Torto A et al., 2017 [72] | HF | 3.4 2.8–4.2 | 6.3 5.1–8.0 | 1.83 1.55–2.17 | 3.39 2.87–4.21 | 50 40–61 (mL) | 61 51–75 (mL) | 4.0 3.4–4.7 | 13.4 10.9–16.4 | 0.3 0.25–0.35 | 0.96 0.78–1.28 | 8.86 7.21–10.4 (mL/dL) | 16.00 14.17–18.00 (mL/dL) | ||||||||||||
| Vignati C et al., 2019 [73] | HF | 1101 (870–1418)-CPET; 1103 (844–1389)-CPET + CO | |||||||||||||||||||||||
| Lang C et al., 2007 [60] | HF | 3.5 ± 1.1 | 7.2 ± 2.7 | 12.6 ± 4.7 | |||||||||||||||||||||
| Morosin M et al., 2018 [74] | HF (MF—muscular fatigue n = 132; D—dyspnoea n = 38) | MF 3.26 ± 0.98; D 3.12 ± 0.92 | MF 6.68 ± 2.51; D 6.21 ± 2.55 | MF 48.5 ± 15.1; D 46.6 ± 14 (L/min) | MF 64.5 ± 21.2; D 58.3 ± 16.2 (L/min) | MF 15.49 ± 4.77; D 15.35 ± 4.34 | MF 1.21 ± 0.43; D 1.14 ± 0.41 | MF 9.87 ± 3.2; D 10.1 ± 2.7 (mL/100 mL) | MF 18.2 ± 3.8; D 18.2 ± 3.6 (mL/100 mL) | ||||||||||||||||
| Cattadori G et al., 2011 [75] | HF (“Pre”—before—and “Post”—after—an 8-week training program) | Pre 3.7 ± 1.1; Post 3.9 ± 1.1 | Pre 6.6 ± 2.2; Post 7.3 ± 2.5 | Pre 51 ± 16; Post 54.5 ± 16.9 (mL) | Pre 62.6 ± 25.7; Post 70.0 ± 25.5 (mL) | Pre 14.1 ± 3.9; Post 15.1 ± 4.6 | Pre 1.1 ± 0.4; Post 1.2 ± 0.4 | Pre 9.8 ± 4.4; Post 8.6 ± 2.6 (mL/100 mL) | Pre 17.5 ± 5.1; Post 16.6 ± 4.1 (mL/100 mL) | ||||||||||||||||
| Reiss N et al., 2018 [76] | HF supported by LVAD | 4.1 ± 1.3 | 7.6 ± 2.4 | ||||||||||||||||||||||
| Vignati C et al., 2017 [77] | HF supported by LVAD | Speed 2 3.4 ± 0.9; Speed 4 3.8 ± 1.0 | Speed 2 5.3 ± 1.3; Speed 4 35.9 ± 1.4 | Speed 2 10.0 ± 1.6; Speed 4 10.8 ± 2.0 | Speed 2 788 ± 169; Speed 4 841 ± 152 | Speed 2 11.4 ± 4.5; Speed 4 9.9 ± 2.7 (mL/100 mL) | Speed 2 15.7 ± 3.9; Speed 4 15.1 ± 3.6 (mL/100 mL) | ||||||||||||||||||
| Iellamo F et al., 2013 [78] | postinfarction CHF—chronic heart failure (ACT—aerobic continuous training n = 8; AIT—aerobic interval training n = 8) | before ACT 3.24 ± 0.63; after ACT 3.38 ± 0.73; before AIT 3.43 ± 0.80; after AIT 3.43 ± 0.77 | before ACT 58.29 ± 8.53; after ACT 59.14 ± 6.51; before AIT 59.00 ± 10.35; after AIT 59.67 ± 9.04 (mL) | before ACT 18.44 ± 4.29; after ACT 22.53 ± 3.13; before AIT 18.78 ± 4.58; after AIT 23.02 ± 4.28 | |||||||||||||||||||||
| Pokan R et al., 2014 [79] | ultraendurance cycling athletes | 1 h 16.9 ± 1.5; 6 h 17.2 ± 1.8; 12 h 17.5 ± 1.7; 18 h 17.6 ± 2.1; 24 h 17.7 ± 2.3 | LTP1 36 ± 6; LTP2 54 ± 10; max 68 ± 12 | LTP1 2757 ± 427; LTP2 4165 ± 552; max 5231 ± 741 (mL/min) | |||||||||||||||||||||
| Accalai E et al., 2021 [61] | HF—heart failure (n = 507), HC—healthy controls (n = 500) | 5.4 ± 1.5 | 3.3 ± 1 | 13.3 ± 3.5 | 6.6 ± 2.6 | 68 ± 22.1 (mL) | 49.5 ± 16.6 | 85 ± 21.5 | 63.8 ± 21.4 | 4.8 ± 1.18 | 4.06 ± 1.01 | 29.5 ± 7.7 | 14.6 ± 4.7 | 330.7 ± 90.4 (mL/min) | 300 ± 83.8 (mL/min) | 2026 ± 668 (mL/min) | 1113 ± 413 (mL/min) | 6.5 ± 1.9 (ml/100 ml) | 9.5 ± 3.1 (mL/100 mL) | 15.2 ± 2.7 (mL/100 mL) | 17.1 ± 3.9 (mL/100 mL) | ||||
| Fontana p et al., 2010 [80] | recreationally trained male cyclists | 6.4 ± 1.2 | 18.2 ± 2.3 (103s) | 91 ± 23 (mL) | 123 ± 21 (103s) | 0.43 ± 0.08 | 3.62 ± 0.27 (103s) | ||||||||||||||||||
| Prochnau D et al., 2012 [81] | HF + CRT | 2.02 ± 0.2 | 3.38 ± 0.23 | ||||||||||||||||||||||
| Lang C et al., 2009 [82] | HF | (all patients, n = 148) 7.3 ± 2.9; (NYHA1, n = 12) 10.2 ± 2.8; (NYHA2, n = 38) 9.4 ± 2.7; (NYHA3, n = 73) 6.7 ± 2.2; (NYHA4, n = 23) 4.6 ± 1.5 | (all patients, n = 148) 12.9 ± 4.5; (NYHA1, n = 12) 21.4 ± 6.3; (NYHA2, n = 38) 15.7 ± 3.1; (NYHA3, n = 73) 11.6 ± 2.1; (NYHA4, n = 23) 8.1 ± 1.9 | ||||||||||||||||||||||
| Agostoni P et al., 2017 [57] | none (healthy) | 5.4 ± 1.5 | 13.2 ± 3.5 | 3.0 ± 0.8 | 7.33 ± 1.59 | 84.5 ± 21.6 (mL) | 2025 ± 668 (mL/min) | 15.2 ± 2.7 (mL/100mL) | |||||||||||||||||
| Jakovljevic D et al., 2011 [83] | HF—heart failure (n = 20); LVAD—implanted LVAD (n = 18); exLVAD—explanted LVAD (n = 16) | HF 9.1 ± 2.1; LVAD 12.4 ± 2.2; exLVAD 14.6 ± 2.9 | HF 71.1 ± 14.1; LVAD 87.2 ± 16.4; exLVAD 89.4 ± 15.1 | HF 15.8 ± 5.8; LVAD 19.8 ± 4.1; exLVAD 28.2 ± 5.0 | HF 1384 ± 375; LVAD 1592 ± 554; exLVAD 2511 ± 468 (mL/min) | ||||||||||||||||||||
| Fontana P et al., 2009 [63] | healthy, asymptomatic, non-smoking, and recreationally active | A1 5.31 ± 0.9; A2 5.41 ± 0.9; B1 5.41 ± 1.1; B2 5.51 ± 1.2 | A1 17 ± 3.0; A2 16.6 ± 2.5; B1 16.4 ± 2.2; B2 16.7 ± 2.4 | A1 3.18 ± 0.7; A2 3.17 ± 0.72; B1 3.24 ± 0.75; B2 3.23 ± 0.7 | |||||||||||||||||||||
| Jakovljevic D et al., 2012 [84] | HF—heart failure | test I 4.0 ± 1.0; test II 3.9 ± 0.9 | test I 11.2 ± 5.7; test II 11.3 ± 5.6 | test I 3.9 ± 0.9; test II 4.0 ± 0.9 | test I 21.7 ± 7.0; test II 23.0 ± 5.8 | test I 304 ± 98; test II 320 ± 100 (mL/min) | test I 1792 ± 827; test II 1884 ± 767 (mL/min) | ||||||||||||||||||
| Okwose N et al., 2019 [51] | healthy | test 1 7.4 ± 1.6; test 2 7.1 ± 1.2 | test 1 20.4 ± 2.3; test 2 19.8 ± 2.6 | test 1 114 ± 28; test 2 108 ± 15 | test 1 135 ± 25; test 2 132 ± 25 | test 1 4.4 ± 1.7; test 2 4.7 ± 1.6 | test 1 35 ± 1.7; test 2 33.4 ± 0.9 | test 1 0.3 ± 0.1; test 2 0.3 ± 0.1 | test 1 2.2 ± 0.5; test 2 2.2 ± 0.5 | ||||||||||||||||
| Vignati C et al., 2021 [85] | patients with PMR (primary mitral regurgitation, n = 62) and FMR (funtctional mitral regurgitation, n = 53), before (PRE-pMVR) and after (POST-pMVR) pMVR (percutaneous edge-to-edge mitral valve repair) | FMR: PRE-pVMR 3.0 ± 0.8; POST-pMVR 3.4 ± 0.8/PMR: PRE-pVMR 3.1 ± 0.9; POST-pMVR 3.2 ± 0.9 | FMR: PRE-pVMR 5.6 ± 1.4; POST-pMVR 6.3 ± 1.5/PMR: PRE-pVMR 6.2 ± 2.4; POST-pMVR 6.7 ± 2.0 | FMR: PRE-pVMR 44 ± 13; POST-pMVR 51 ± 14/PMR: PRE-pVMR 43 ± 14; POST-pMVR 45 ± 13 (mL) | FMR: PRE-pVMR 57 ± 19; POST-pMVR 66 ± 20/PMR: PRE-pVMR 62 ± 20; POST-pMVR 69 ± 20 (mL) | FMR: PRE-pVMR 294 ± 64; POST-pMVR 298 ± 56/PMR: PRE-pVMR 269 ± 59; POST-pMVR 276 ± 54 (mL/min) | FMR: PRE-pVMR 932 ± 204; POST-pMVR 968 ± 224/PMR: PRE-pVMR 938 ± 302; POST-pMVR 957 ± 258 (mL/min) | FMR: PRE-pVMR 10.2 ± 2.9; POST-pMVR 9.2 ± 2.3/PMR: PRE-pVMR 9.3 ± 2.7; POST-pMVR 9.2 ± 2.7 (mL/100 mL) | FMR: PRE-pVMR 17.3 ± 4.1; POST-pMVR 15.7 ± 3.7/PMR: PRE-pVMR 15.7 ± 3.8; POST-pMVR 14.9 ± 4.4 (mL/100 mL) | ||||||||||||||||
| Bentley R et al., 2019 [86] | none (healthy) PRE—before training; POST—after training | PRE 6.3 ± 1.2; POST 6.5 ± 1.0 | PRE 21.2 ± 3.5; POST 21.9 ± 3.3 | PRE 76 ± 16; POST 79 ± 18 | PRE 44.0 ± 6.3; POST 48.1 ± 7.7 | ||||||||||||||||||||
| Jakovljevic D et al., 2010 [87] | HF supported by LVAD | optimal speed 5.3 ± 1.7; reduced speed 4.6 ± 1.4 | optimal speed 12.2 ± 2.1; reduced speed 8.6 ± 2.5 | optimal speed 71.4 ± 16.1; reduced speed 58.2 ± 12.2 | optimal speed 88.4 ± 16.4; reduced speed 67.5 ± 14.7 | optimal speed 4.3 ± 0.4; reduced speed 4.6 ± 0.3 | optimal speed 18.2 ± 4.5; reduced speed 14.1 ± 5.3 | ||||||||||||||||||
| Shen Y et al., 2016 [88] | CHF—chronic heart failure | 4.0 ± 1.6 | 5.8 ± 2.4 | 14.0 ± 3.9 | |||||||||||||||||||||
| Rajani R et al., 2010 [89] | aortic stenosis (AS—asypmtomatic n = 28; S—symptomatic n = 10) | AS 2.9 ± 0.7; S 2.8 ± 0.8 | AS 5.9 ± 1.6; S 4.1 ± 0.9 | AS 4.7 ± 2.5; S 5.4 ± 3.2 | AS 23.1 ± 5.8; S 16.7 ± 3.8 | ||||||||||||||||||||
| Pastormerlo L et al., 2015 [90] | HF (hsT < 20%—hs-Troponin Increase < 20% n = 20; hsT > 20%—hs-Troponin Increase > 20% n = 10) | hsT < 20% 3.4 ± 1.2; hsT > 20% 3.1 ± 1.2 | hsT < 20% 8.3 ± 1.9; hsT > 20% 7.1 ± 1.9 | ||||||||||||||||||||||
| Goda A et al., 2009 [58] | HF | 4.5 ± 1.6 | 8.8 ± 2.8 | 3.8 ± 1.0 | 15.4 ± 4.4 | 9.5 ± 4.3 | 2.1 ± 0.8 | ||||||||||||||||||
| Hassan M et al., 2017 [91] | HF | 1.75 (1.0–3.4) | 3.1 (1.4–6.9) | 15.5 (6.5–25) | |||||||||||||||||||||
| Lee W et al., 2011 [92] | precapillary PH (pulmonary hipertension) | PBF: Before therapy: supine position 4.0 ± 1.0, erect position 3.2 ± 0.6. After therapy: supine position 4.7 ± 1.4, erect position 3.9 ± 0.9 | PBF: Before therapy: 5.3 ± 1.7. After therapy: 5.7 (4.1–8.1) | 2.2 ± 0.7 | Before therapy: supine position 53 ± 22, erect position 40 ± 13. After therapy: supine position 58 (44–68), erect position 50 ± 15 (mL) | Before therapy: 48 ± 18. After therapy: 56 ± 21 (mL) | 12 ± 4 | 0.971 ± 0.355 | |||||||||||||||||
| Bentley R et al., 2018 [93] | none (healthy and non-smoking); divided post-hoc into: LCR—lower cardiac resoinders (n = 10); HCR—higher cardiac responder (n = 10) | All: 6.2 ± 1.1; LCR: 6.4 ± 1.5; HCR: 6.0 ± 1.0 | LCR: 11.0 ± 2.0; HCR: 17.3 ± 2.3 | All: 75 ± 15; LCR: 70.0 ± 20.0; HCR: 83.0 ± 11.0 | All: 0.34 ± 0.05; LCR: 0.33 ± 0.05; HCR: 0.33 ± 0.05 | All: 3.0 ± 0.5; LCR: 2.6 ± 0.4; HCR: 3.4 ± 0.5 |
| Indication for CPET-IGR | n. of Articles | % of Articles Included |
|---|---|---|
| 1. HF (heart failure): | 25 | 53% |
| LVAD pump | 6 | |
| 2. MR (mitral regurgitation) | 1 | 2% |
| 3. AS (aortic stenosis) | 2 | 4% |
| 4. PPH (precapillary pulmonary hypertension) | 1 | 2% |
| 5. Assessment of healthy individuals: | 13 | 28% |
| athletes | 2 | |
| 6. DMT2 (diabetes mellitus t.2) | 3 | 6% |
| 7. COPD (chronic obstructive pulmonary disease | 2 | 4% |
| Patient information: Name: Age: Gender: Medical Record Number: Date of Test: | |||
| Indication for CPET + IGR: Provide a summary of the patient’s medical condition or reason for conducting the CPET. This may include a suspected cardiovascular or pulmonary disease, exercise intolerance, preoperative evaluation, or any other relevant clinical indication. | |||
| Protocol: Describe the specific CPET protocol employed during the test. Include details such as the type of ergometer (treadmill or cycle ergometer), ramp or incremental protocol, exercise duration, and any specific adjustments made based on the patient’s condition or limitations. | |||
| Medication taken: [List all medications the patient took before the CPET, including the dosage and frequency. Highlight any medications that may affect cardiovascular or respiratory parameters.] | |||
| Hb: [the hemoglobin level at the time of the CPET measured in g/dL or other appropriate units; the level of Hb impacts the a-vO2 diff] | |||
| CPET | IGR | ||
| VO2 (rest) [L/min]/[mL/kg/min] | VO2 (peak) [L/min]/[mL/kg/min] | CO (rest) [L/min] | CO (peak) [L/min] |
| HR (rest) [bpm] | HR (peak) [bpm] | SV (rest) [mL/beat] | SV (peak) [mL/beat] |
| RQ (peak) | % of predicted VO2 max [%] | a-vO2 diff (rest) [mL/100mL] | a-vO2 diff (peak) [mL/100mL] |
| VE/VCO2 | Resp. Freq. | PBF (rest) [L/min] | PBF (peak) [L/min] |
| Load [Watts] | SpO2 [%] | Shunt (rest) [%] | Shunt (peak) [%] |
| Graphs: Include a graph that depicts the relationship between CO and VO2 max. Plot the CO values on the y-axis and the VO2 max values on the x-axis. Each data point represents an individual patient’s result. Additionally, you may consider highlighting the patient’s specific data point on the graph for easier interpretation. | |||
| Interpretation: Provide a detailed interpretation of the CPET and non-invasive CO measurement results, considering the patient’s demographics, indication for the test, medications taken, and reference values when available. Discuss any abnormalities or significant findings in the context of the patient’s clinical presentation. Consider integrating the relevant literature or guidelines to support your interpretation. | |||
| Conclusions: Summarize the key findings of the CPET and non-invasive CO measurement, highlighting any notable results or abnormalities. Provide recommendations for further evaluation or management if applicable. | |||
Disclaimer/Publisher’s Note: The statements, opinions and data contained in all publications are solely those of the individual author(s) and contributor(s) and not of MDPI and/or the editor(s). MDPI and/or the editor(s) disclaim responsibility for any injury to people or property resulting from any ideas, methods, instructions or products referred to in the content. |
© 2023 by the authors. Licensee MDPI, Basel, Switzerland. This article is an open access article distributed under the terms and conditions of the Creative Commons Attribution (CC BY) license (https://creativecommons.org/licenses/by/4.0/).
Share and Cite
Chwiedź, A.; Minarowski, Ł.; Mróz, R.M.; Razak Hady, H. Non-Invasive Cardiac Output Measurement Using Inert Gas Rebreathing Method during Cardiopulmonary Exercise Testing—A Systematic Review. J. Clin. Med. 2023, 12, 7154. https://doi.org/10.3390/jcm12227154
Chwiedź A, Minarowski Ł, Mróz RM, Razak Hady H. Non-Invasive Cardiac Output Measurement Using Inert Gas Rebreathing Method during Cardiopulmonary Exercise Testing—A Systematic Review. Journal of Clinical Medicine. 2023; 12(22):7154. https://doi.org/10.3390/jcm12227154
Chicago/Turabian StyleChwiedź, Agnieszka, Łukasz Minarowski, Robert M. Mróz, and Hady Razak Hady. 2023. "Non-Invasive Cardiac Output Measurement Using Inert Gas Rebreathing Method during Cardiopulmonary Exercise Testing—A Systematic Review" Journal of Clinical Medicine 12, no. 22: 7154. https://doi.org/10.3390/jcm12227154