
Gastric Alimetry® Test Interpretation in Gastroduodenal Disorders: Review and Recommendations
 , , and
Abstract
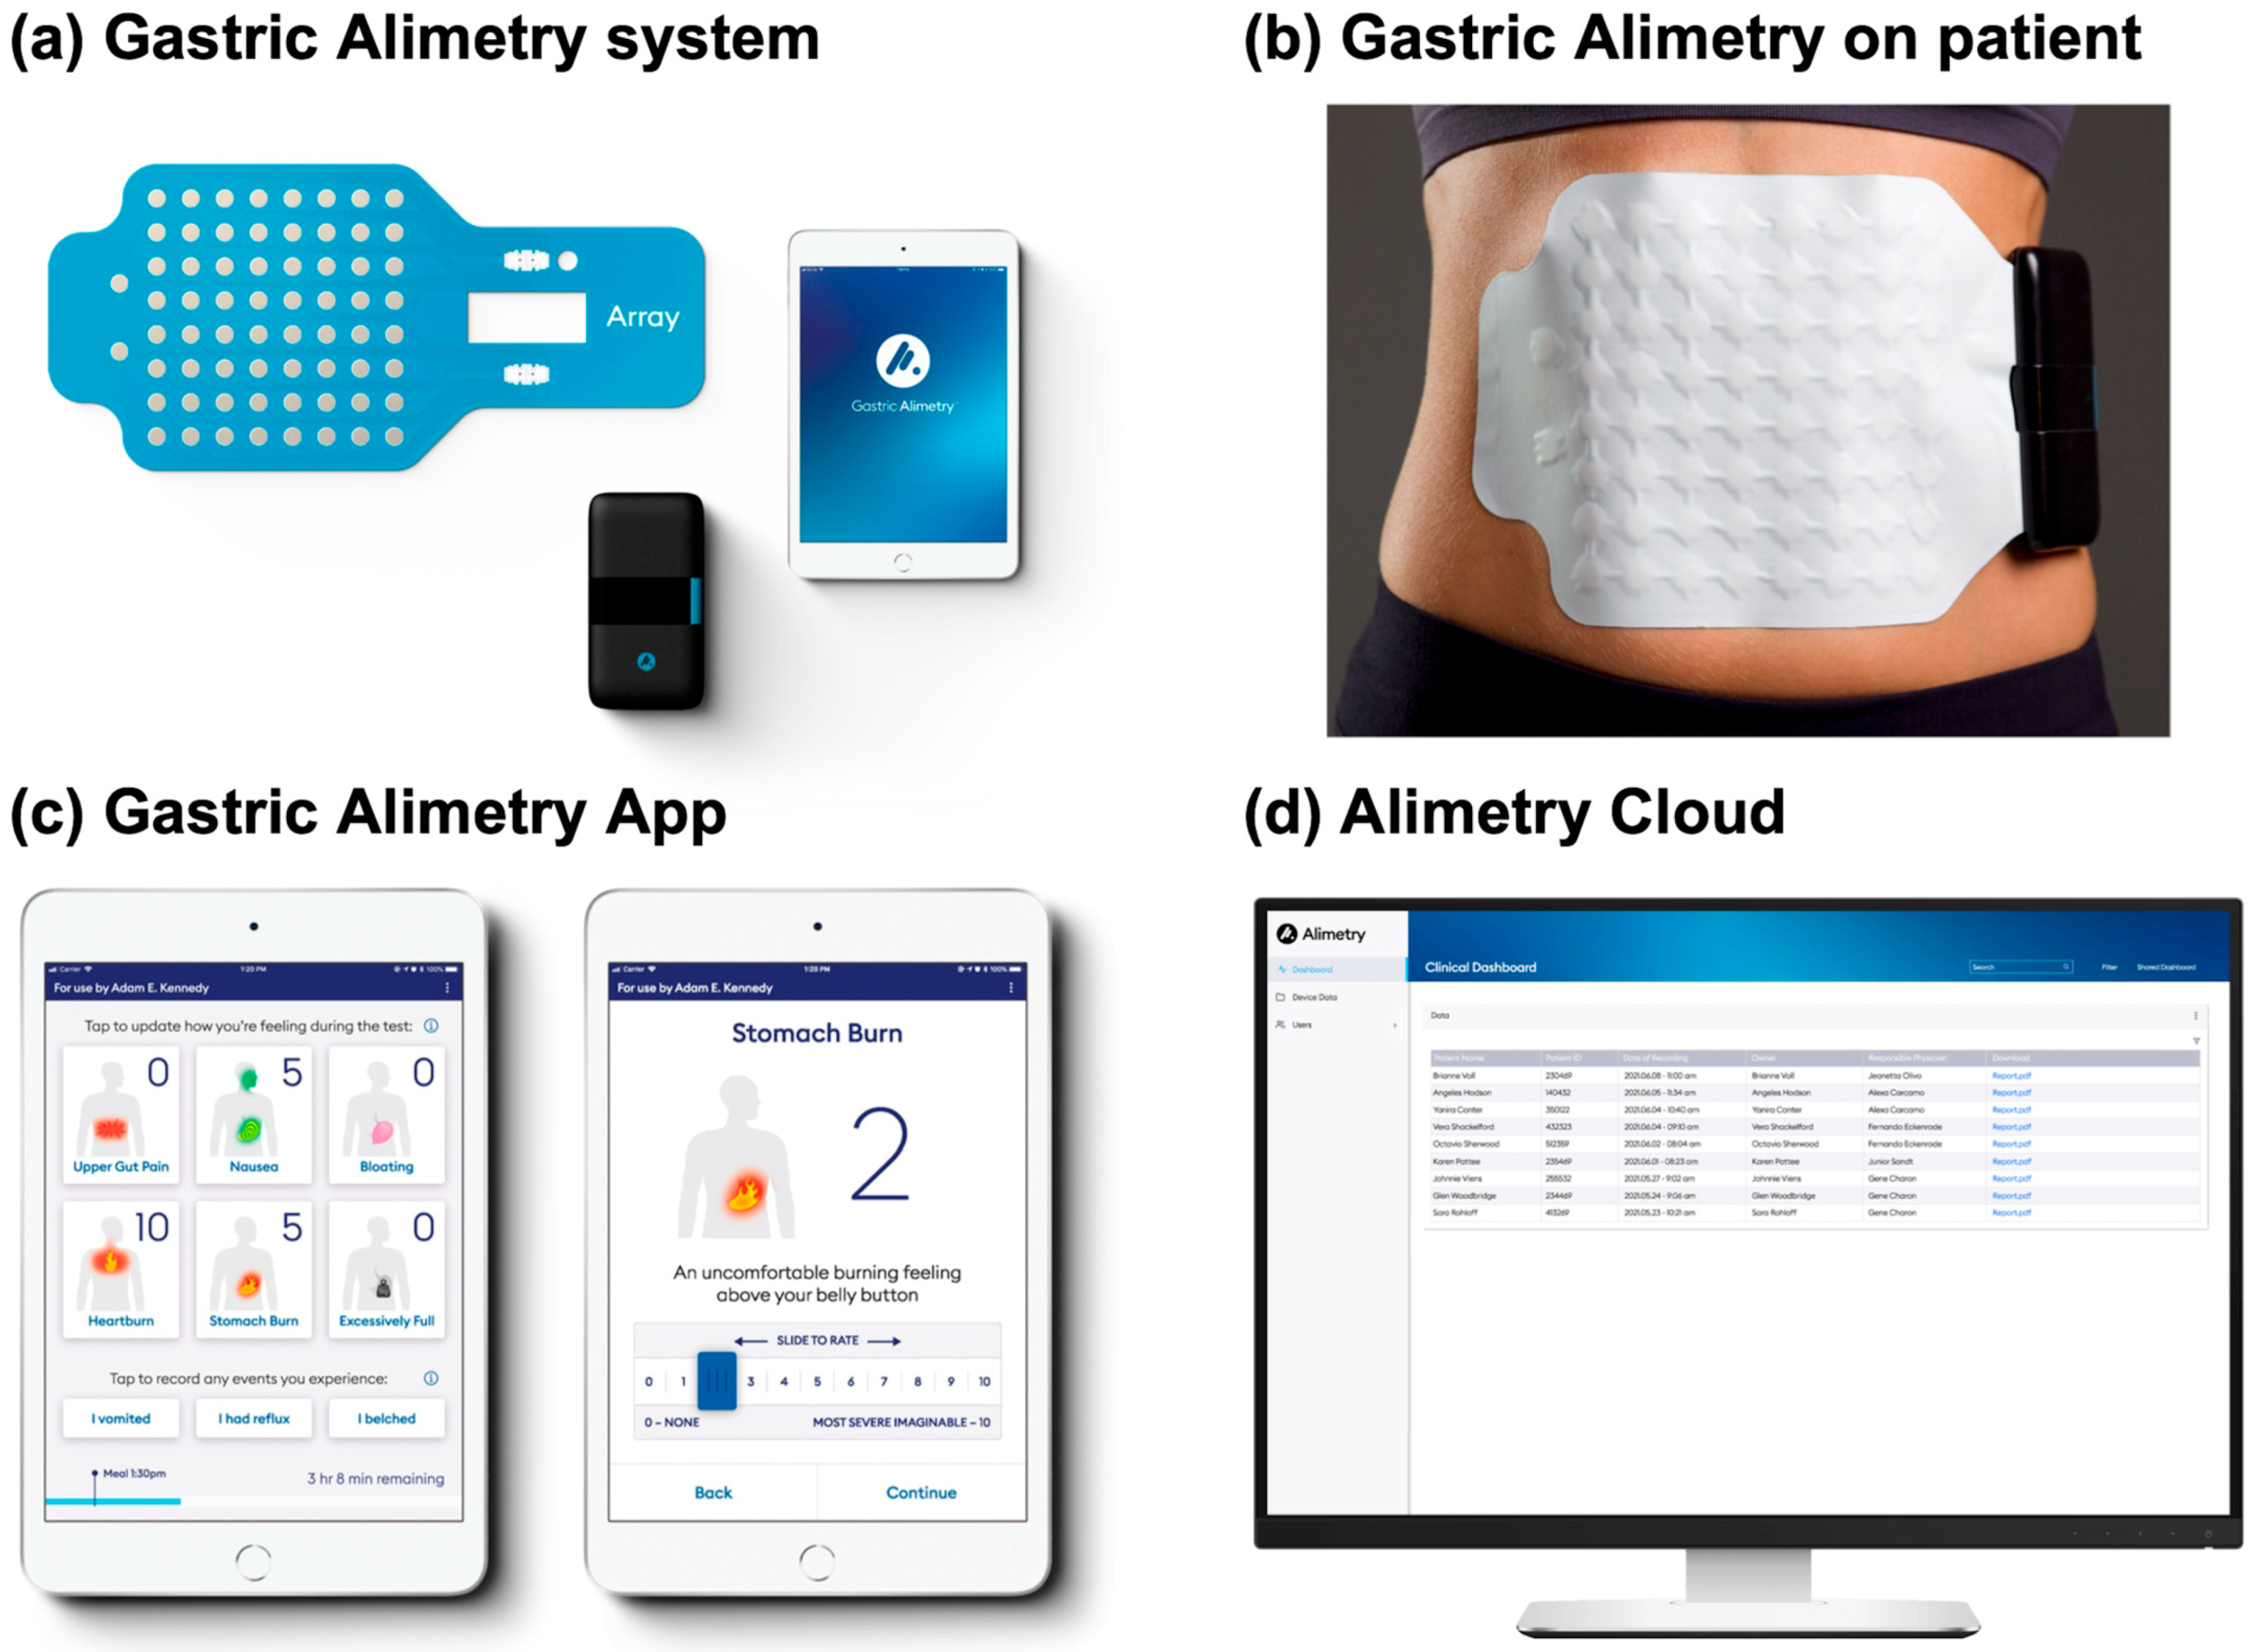
:1. Introduction
2. Overview of Test Interpretation Methodology
- Test Quality
- Spectral Analysis
- Symptoms
- Conclusions
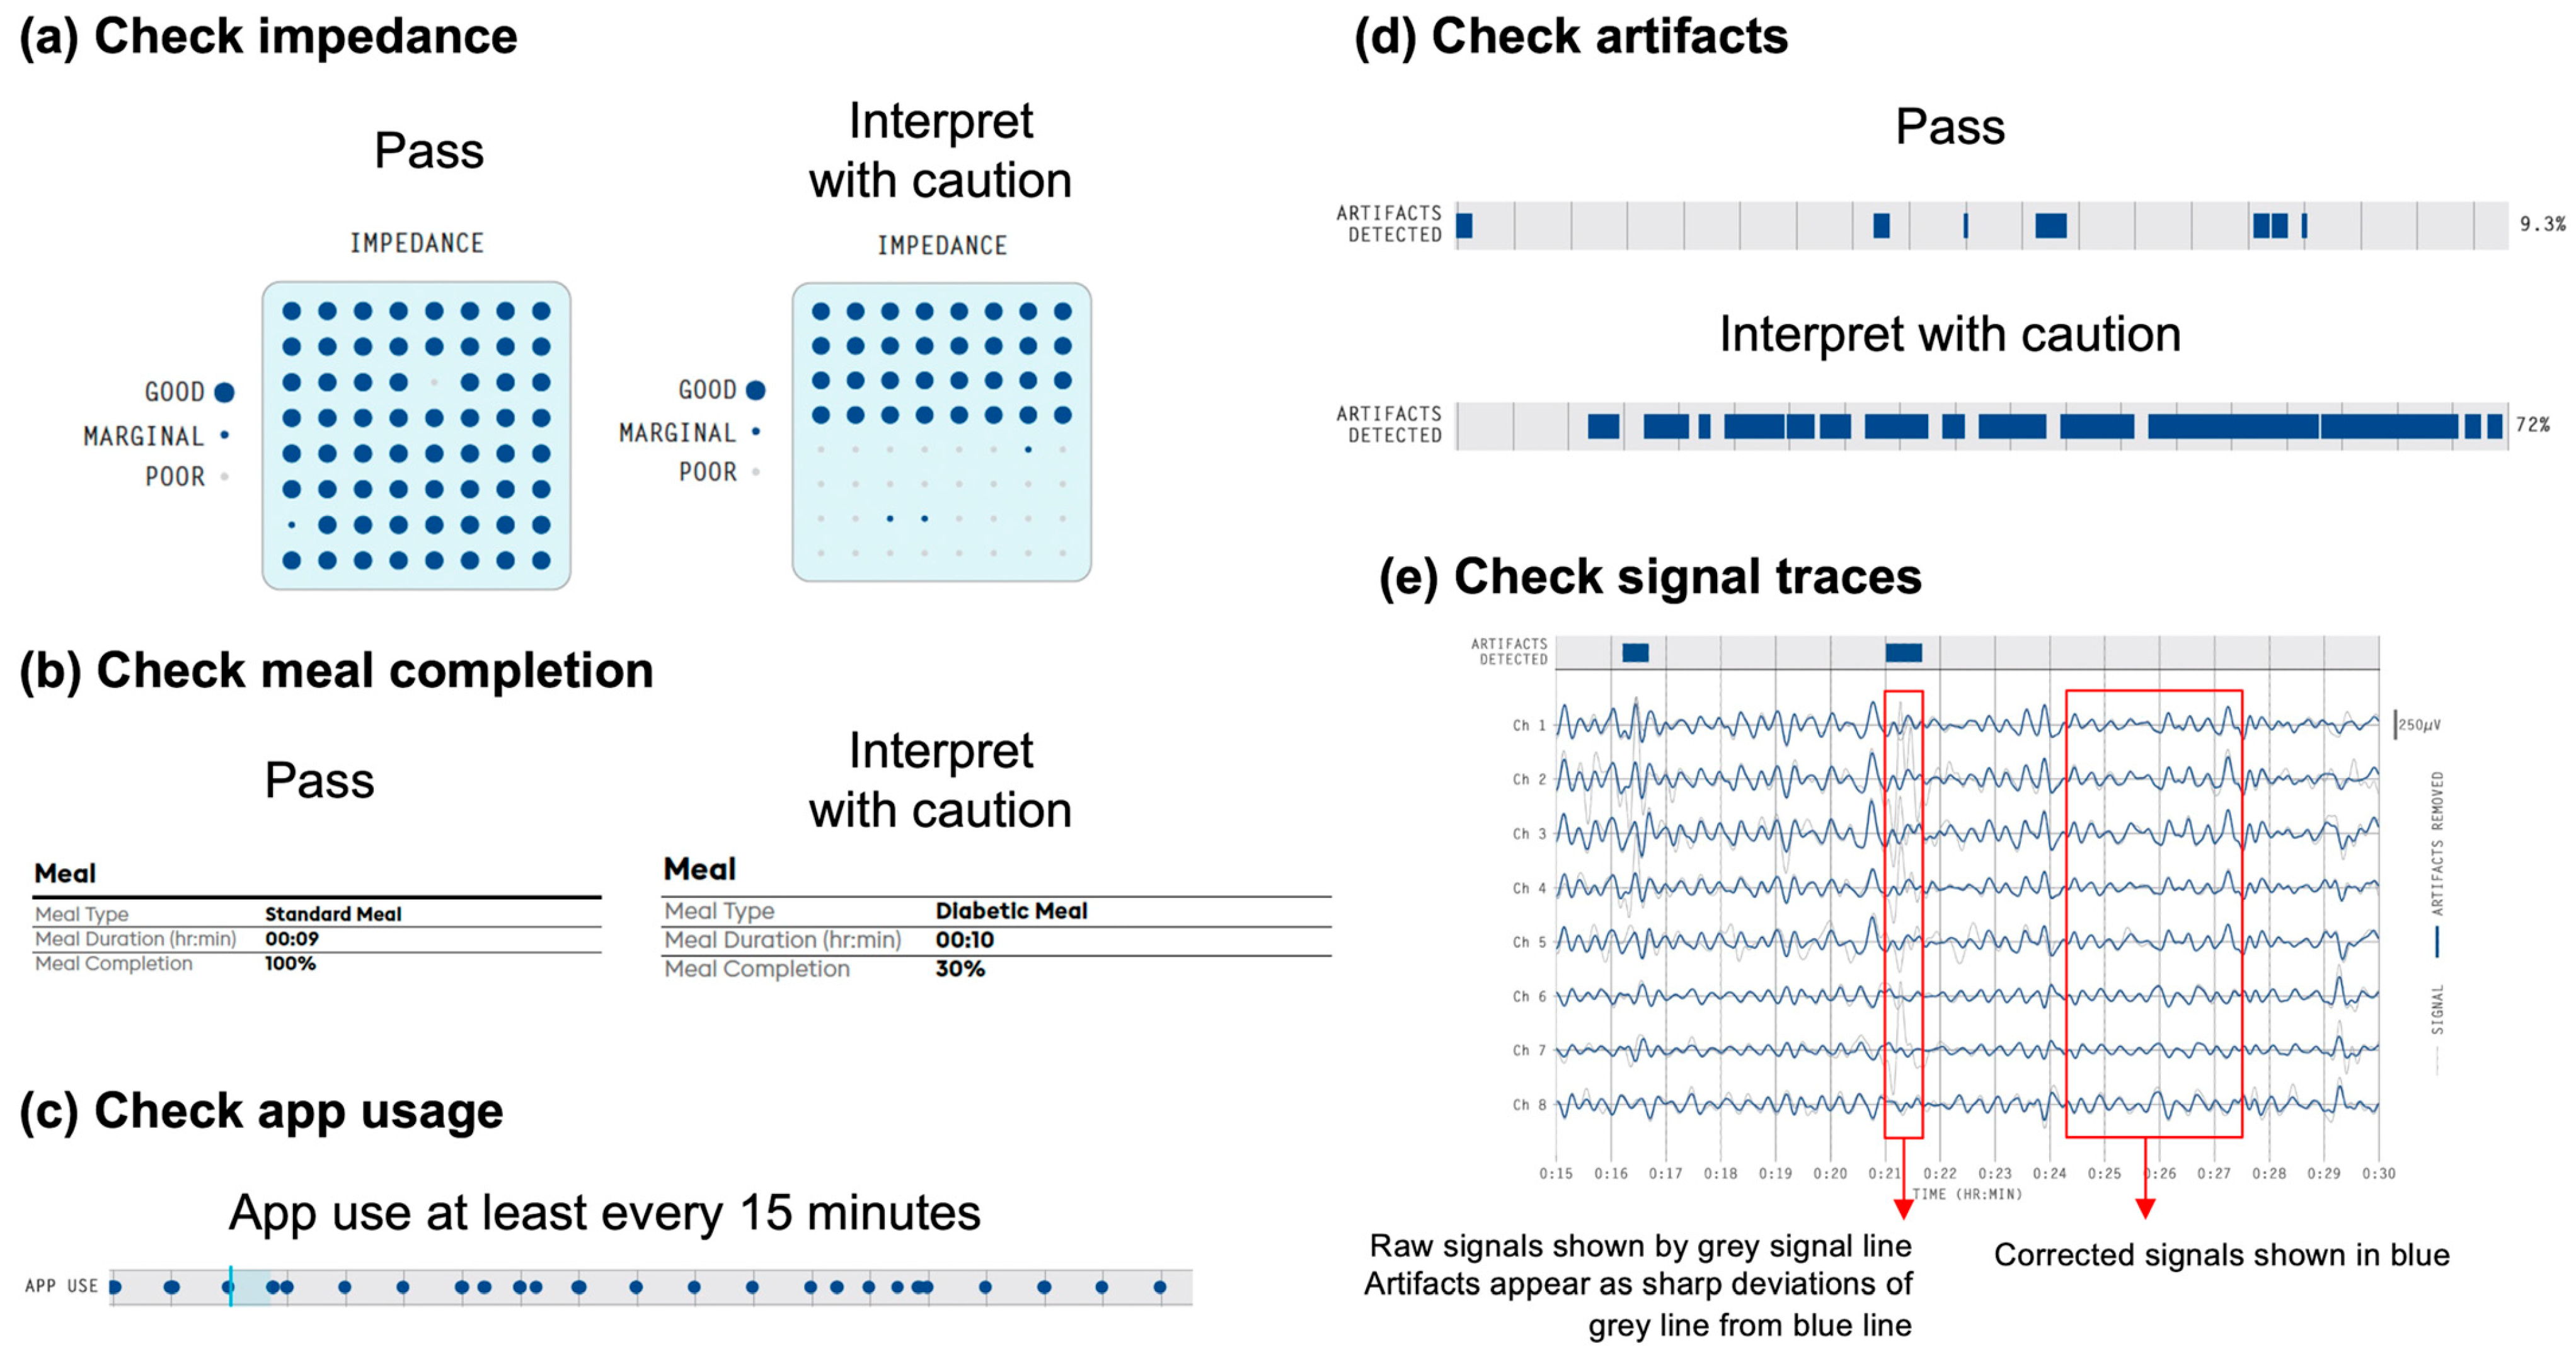
3. Step 1: Assess Test Quality
- Checking impedance (Figure 2a)
- Checking meal completion (Figure 2b)
- Checking app usage (Figure 2c)
- Checking artifacts (Figure 2d)
- Checking signals (Figure 2e)
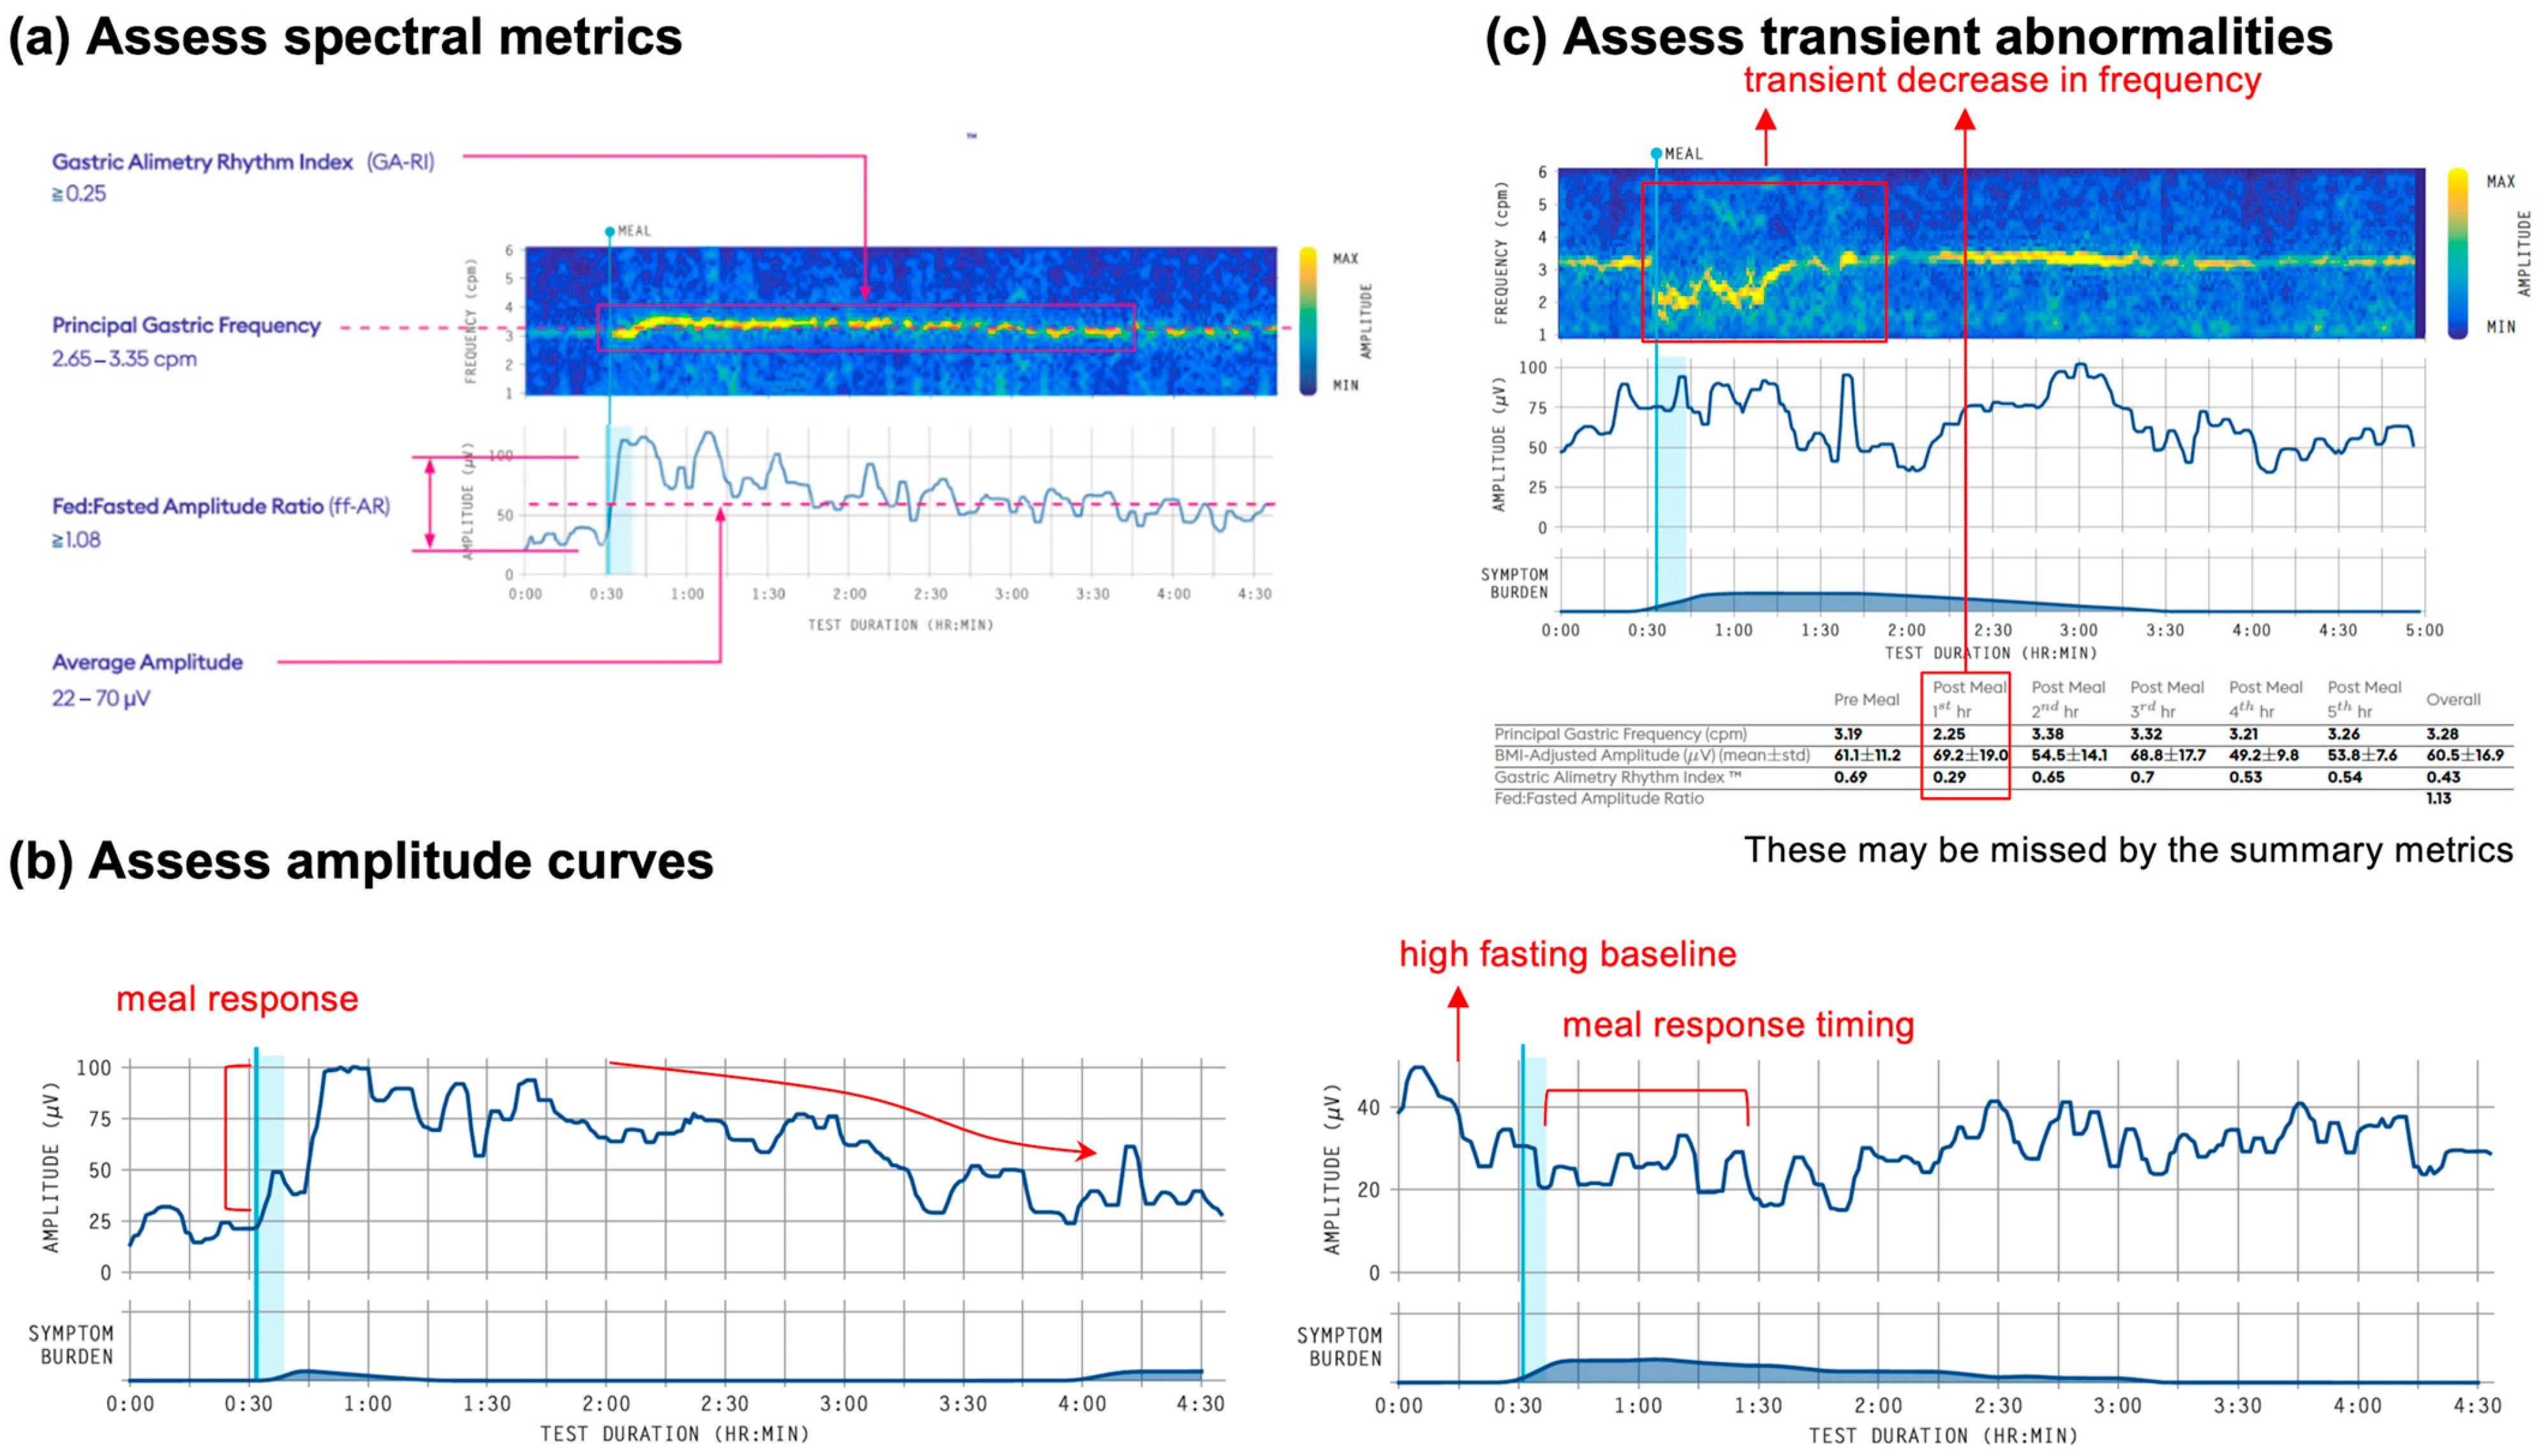
4. Step 2: Spectral Analysis
- Principal Gastric Frequency (cpm) [Reference interval 2.65–3.35 cpm].
- BMI-Adjusted Amplitude (μV) [Reference interval 22–70 μV]
- Gastric Alimetry Rhythm Index (GA-RI): [Reference interval ≥ 0.25]
- Fed:Fasted Amplitude Ratio (ff-AR): >1.08
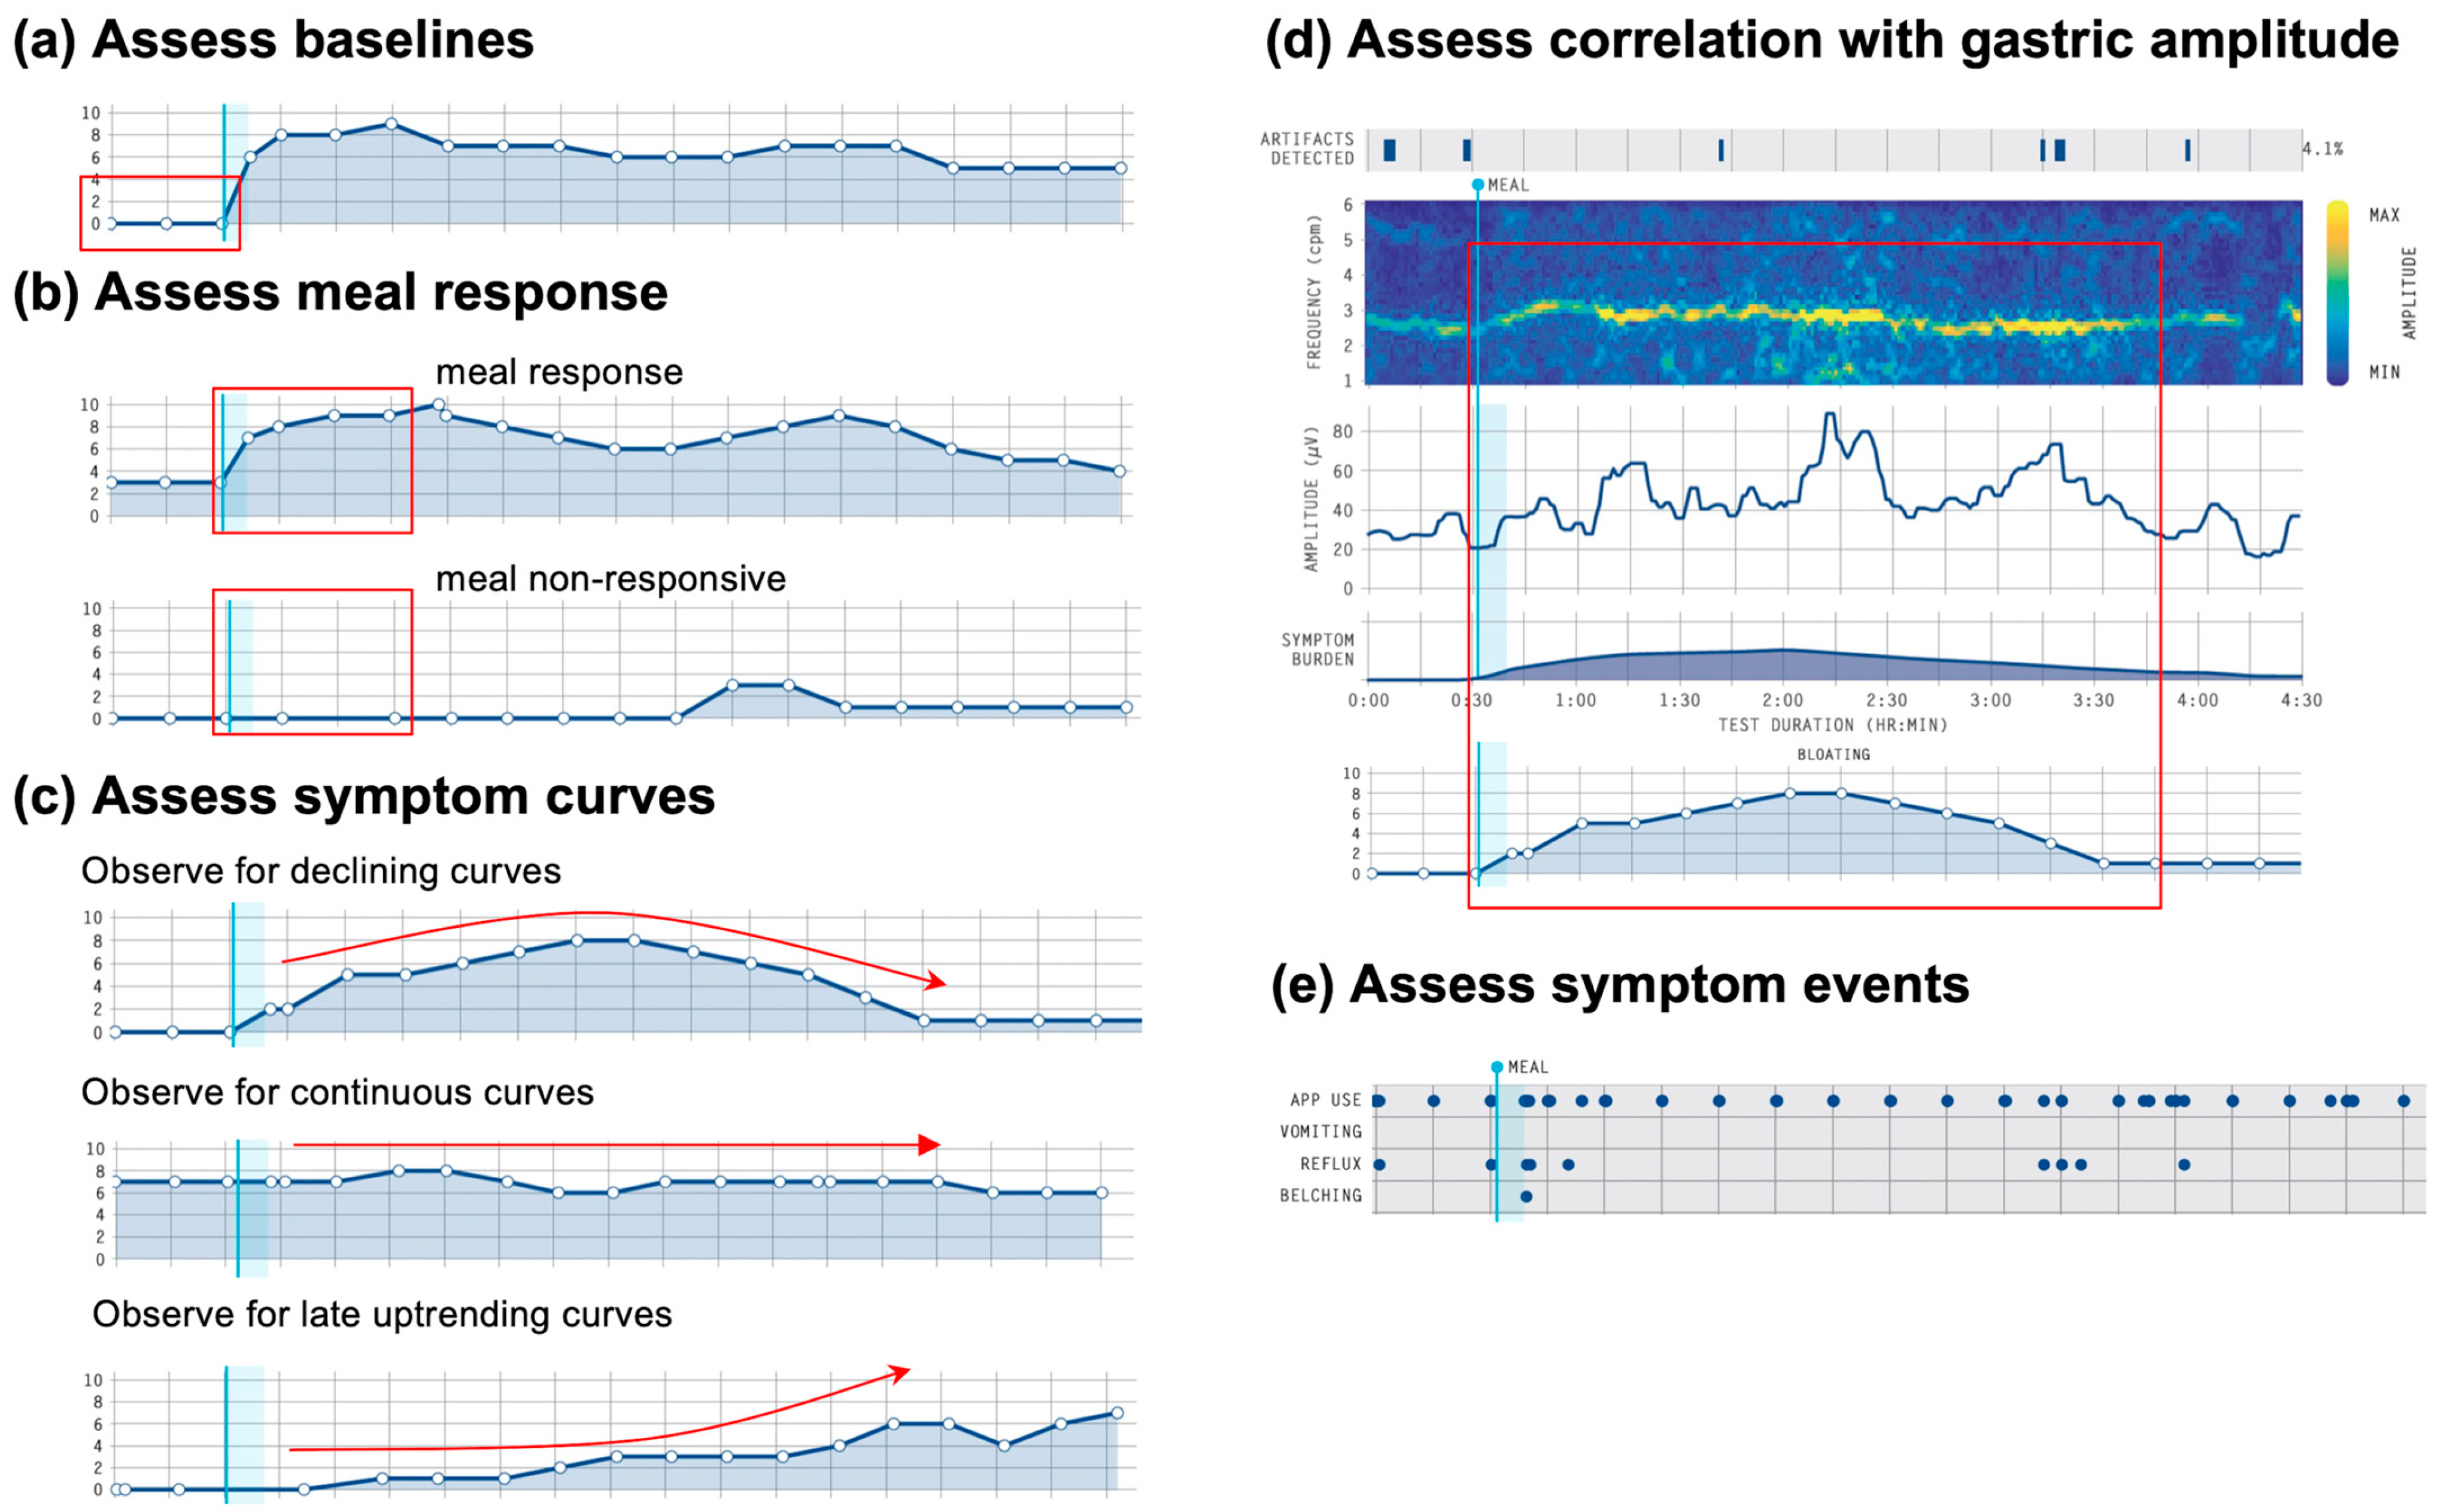
5. Step 3: Symptoms
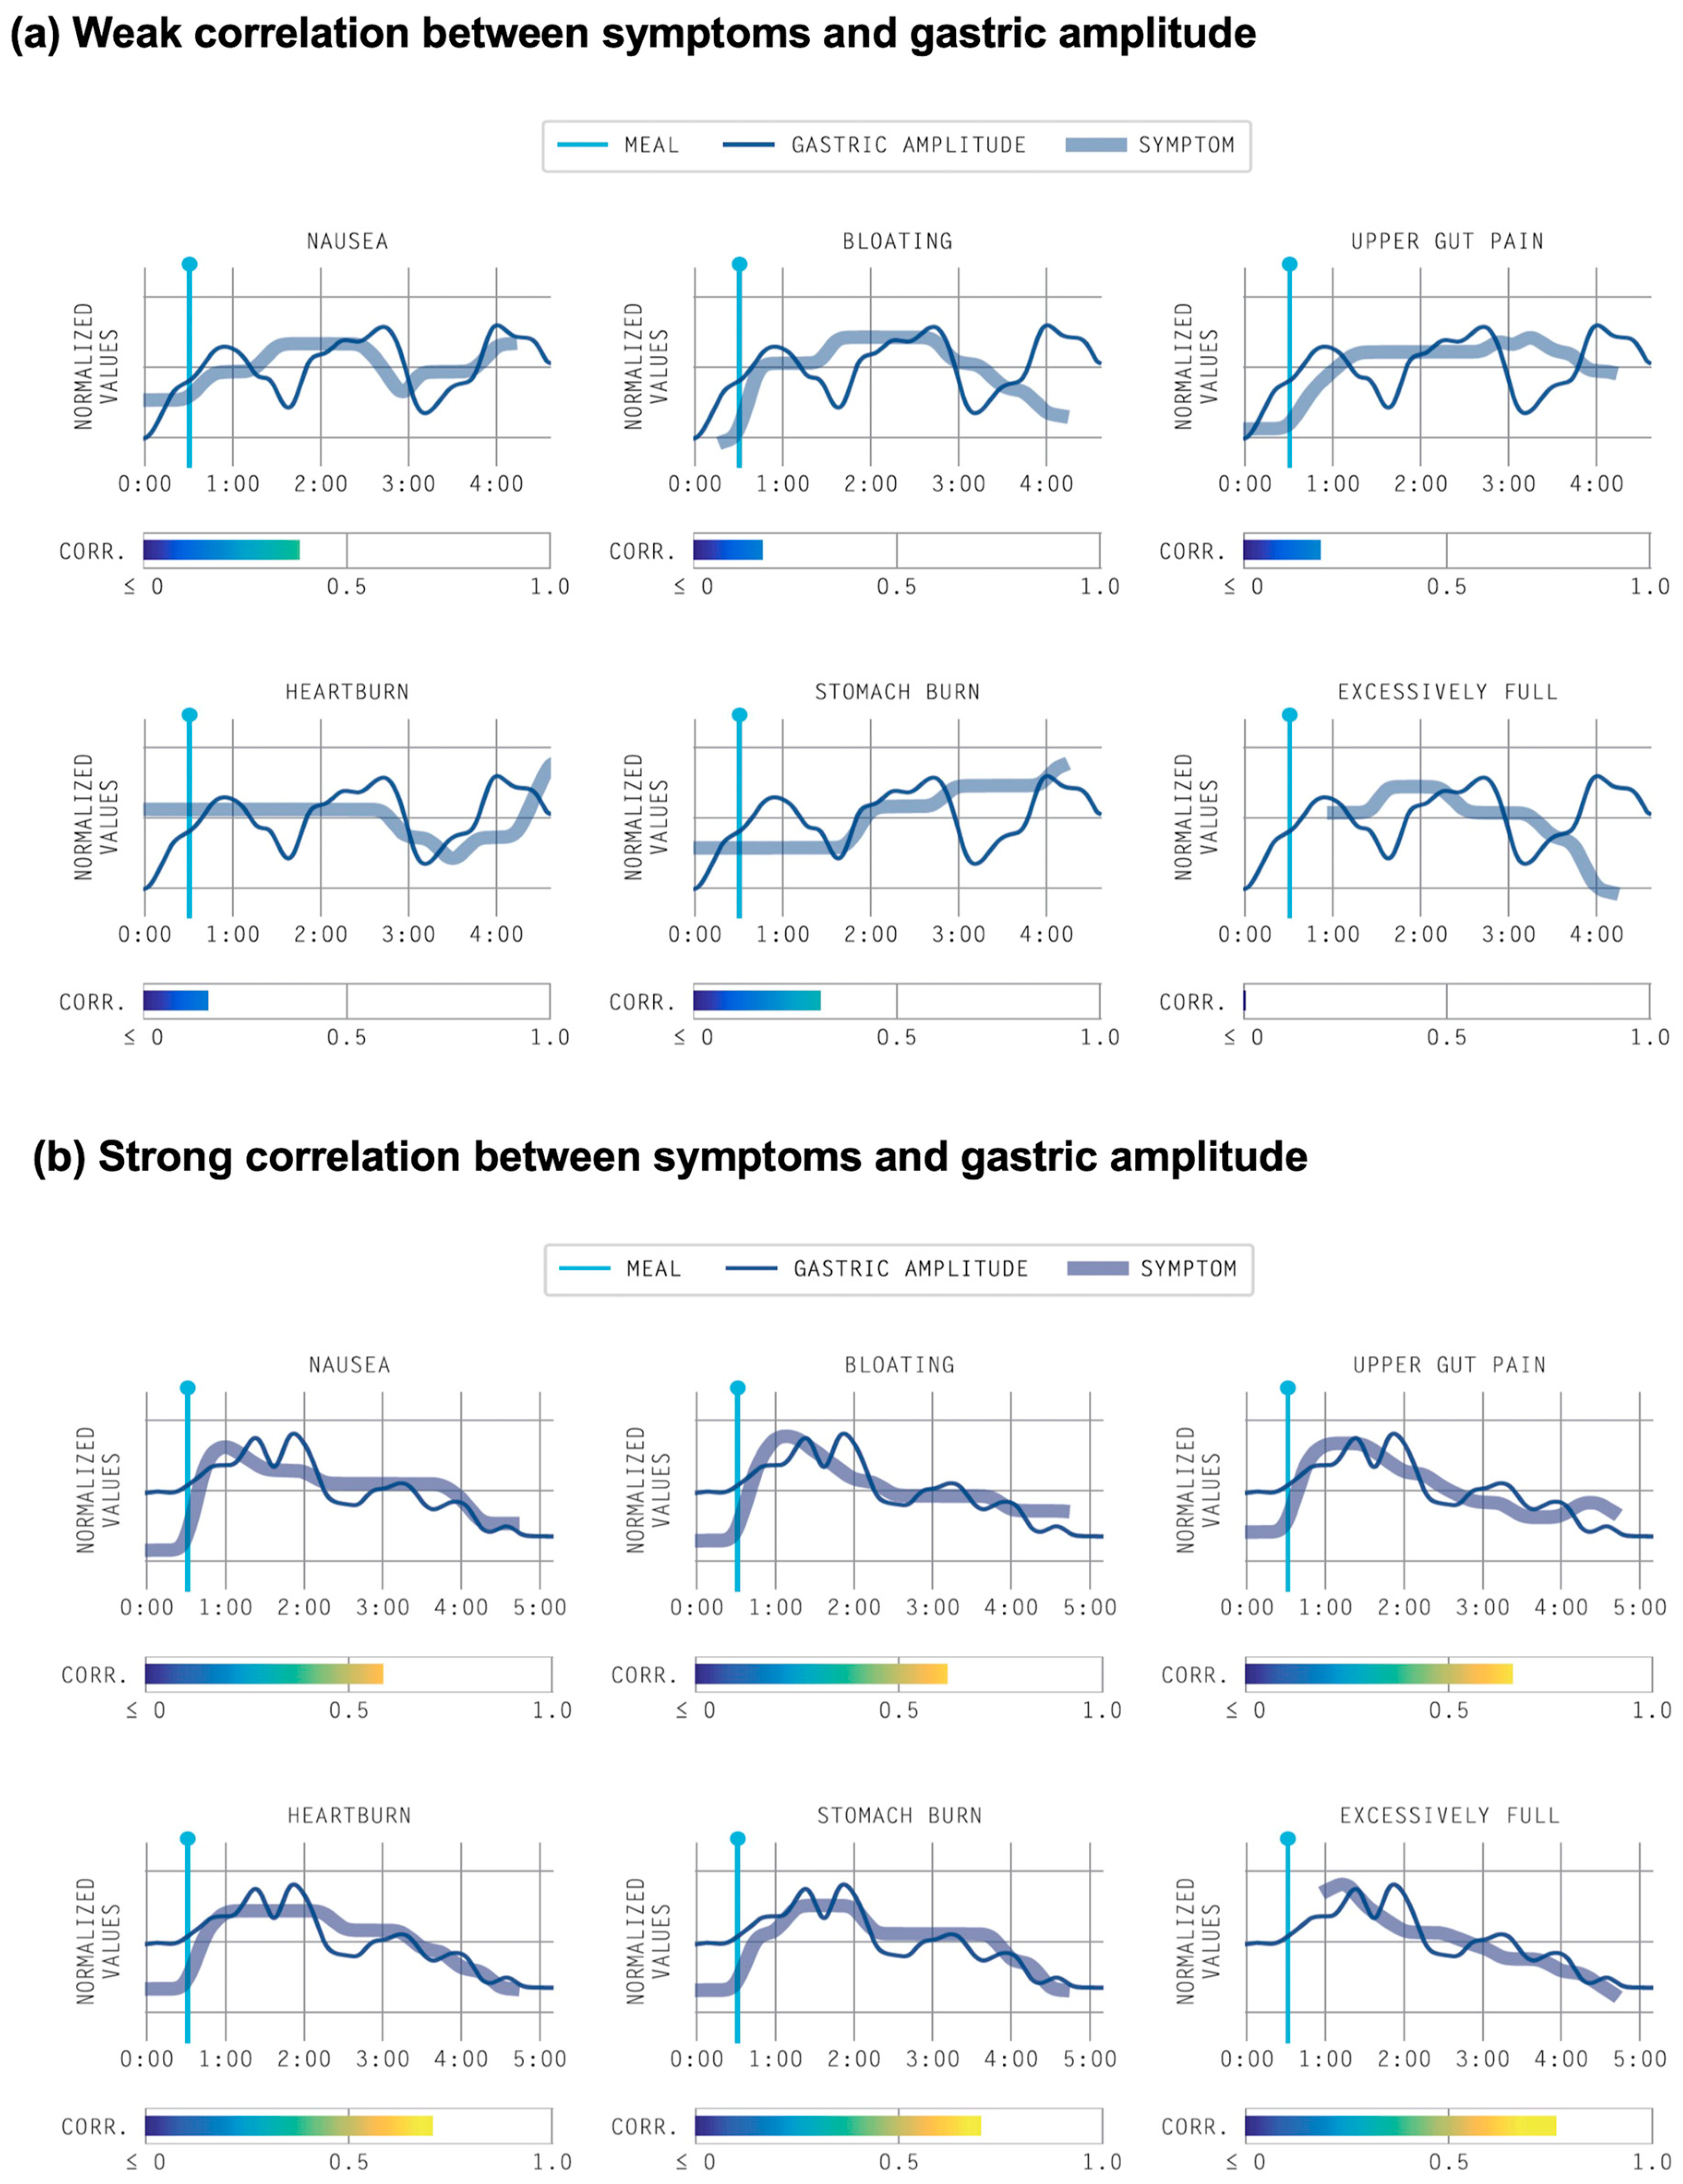
- Assess correlation with gastric activity (Figure 4d)
- Assess symptom events and correlation with gastric activity (Figure 4e)
5.1. Emerging Classification Scheme for Symptom Phenotypes
5.2. Symptom Correlations with Gastric Activity
6. Step 4: Reporting Conclusions
7. Recommended Gastric Alimetry Reporting Format and Considerations (see Box 1 and Box 2)
- The Gastric Alimetry test is currently validated for a BMI of up to 35; interpret results with caution when BMI > 35. In our experience, those with a BMI > 35 will most likely have a BMI-adjusted amplitude within normal ranges since it is challenging to distinguish between low amplitude and signal attenuation due to the abdominal adipose tissue (refer Test Quality).
- Additional comments can be made for any transient spectral abnormalities, e.g., an unstable rhythm index (< 0.25) noted in post-meal 2nd hour.
- If non-standard procedures were used (e.g., alternative meal), comments can be made under ‘Test Quality’, e.g., a non-standard meal was used; interpret with caution.
- It should be noted that Gastric Alimetry does not evaluate all features of gastric function, e.g., gastric accommodation, pyloric function or transit times are not measured using this test.
8. Gastric Alimetry Reporting Examples
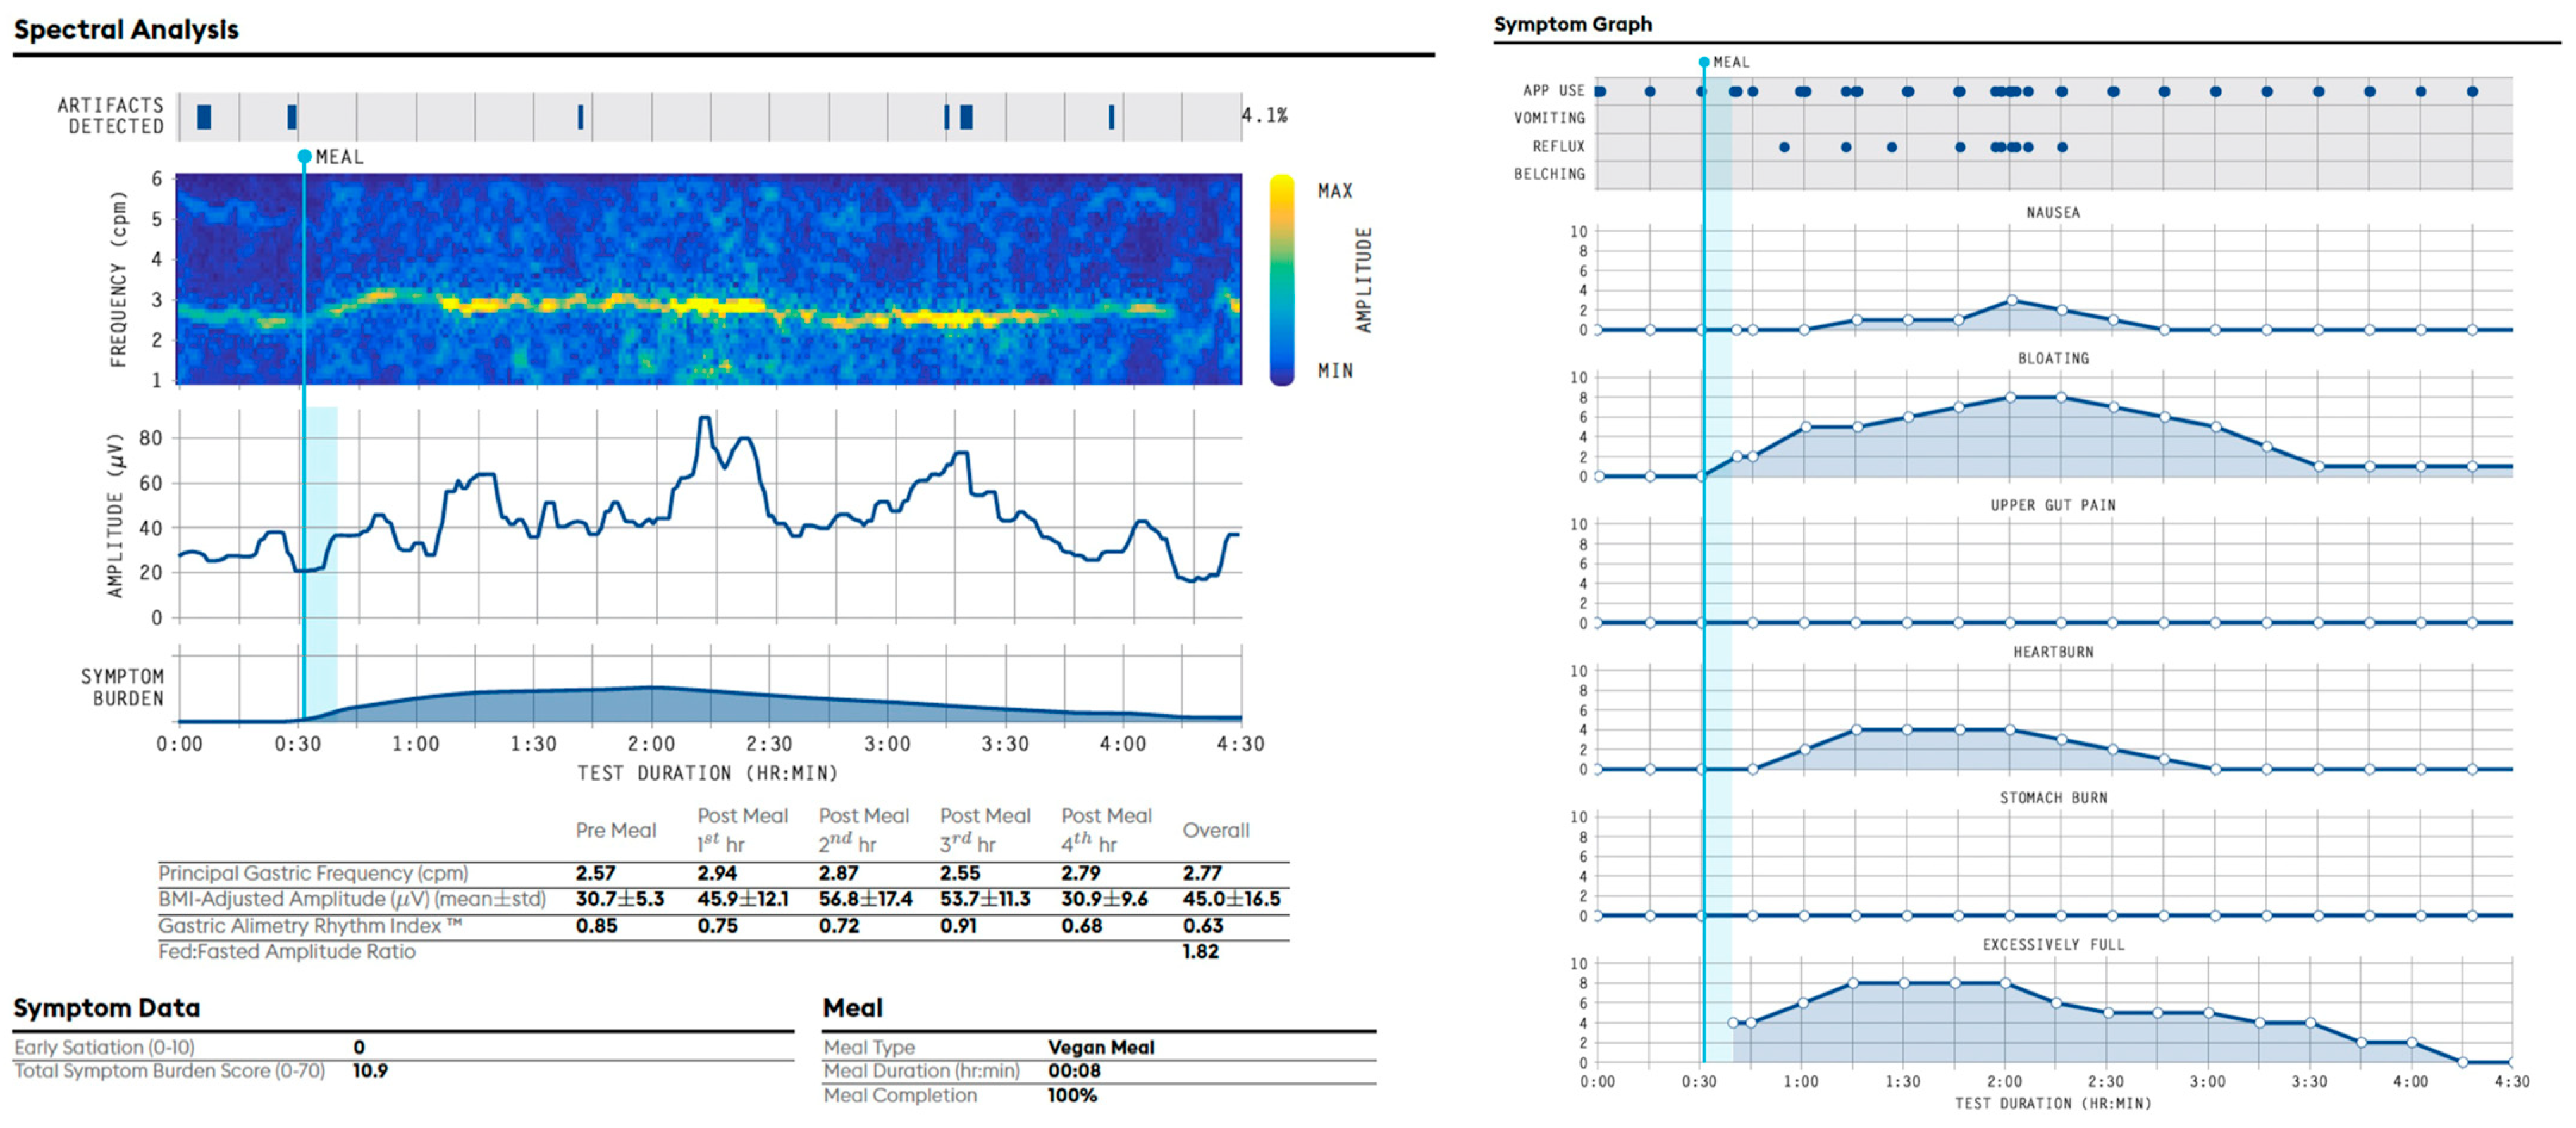
8.1. Example of a Gastric Alimetry Report with a Normal Spectral Analysis and a Sensorimotor Phenotype (Figure 6) [25]
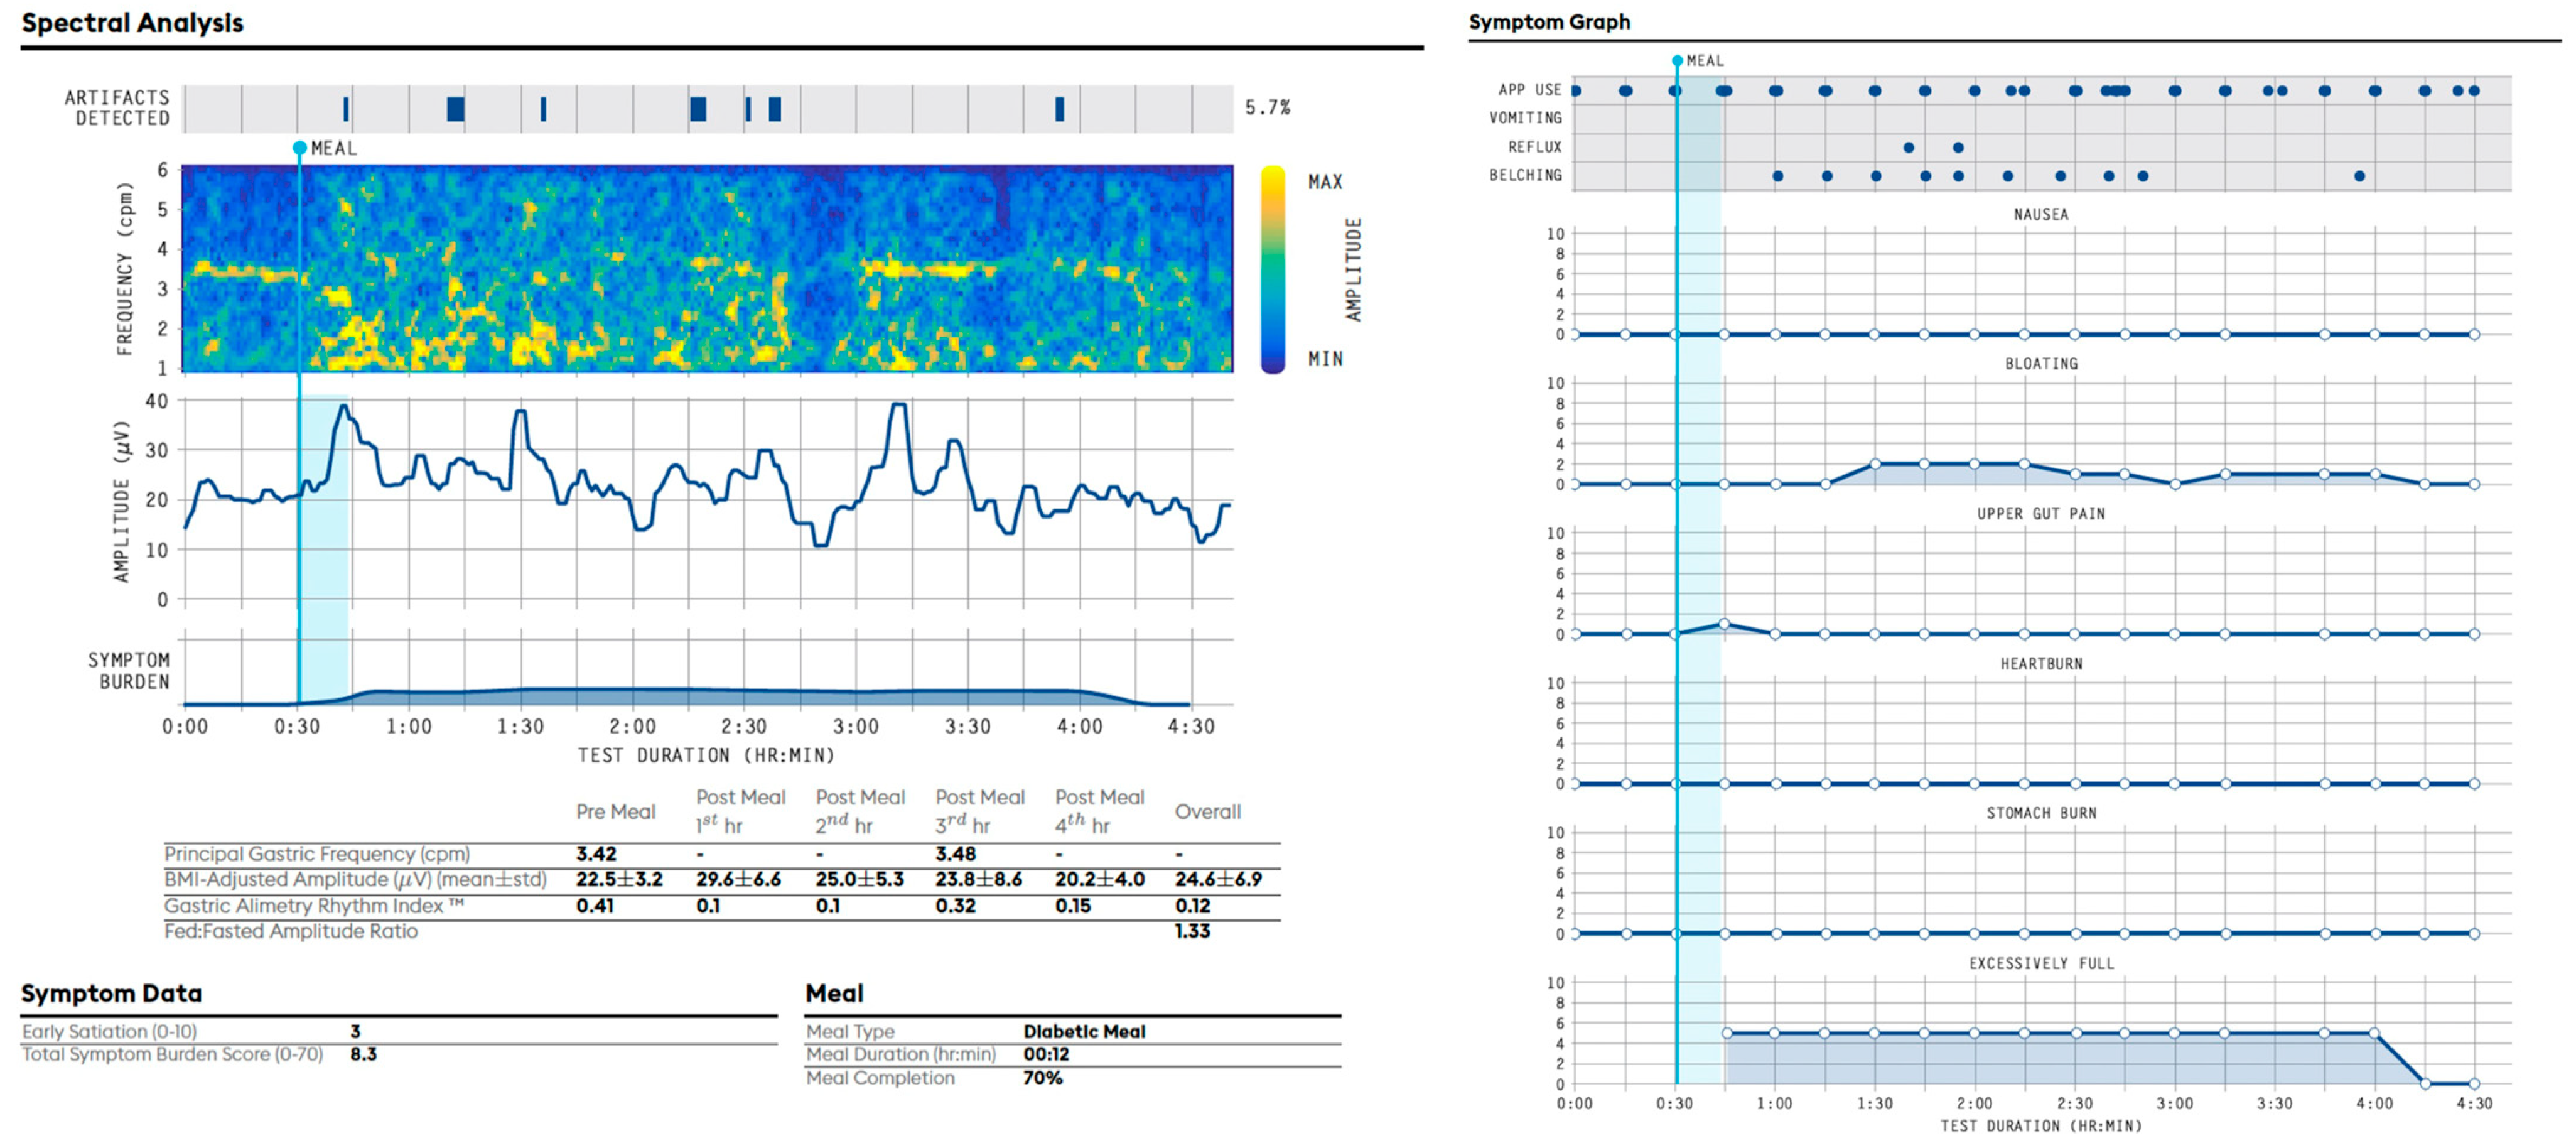
8.2. Example of an Abnormal Gastric Alimetry Spectral Analysis (Figure 7) [27,31]
9. Tips, Existing Limitations and Pitfalls
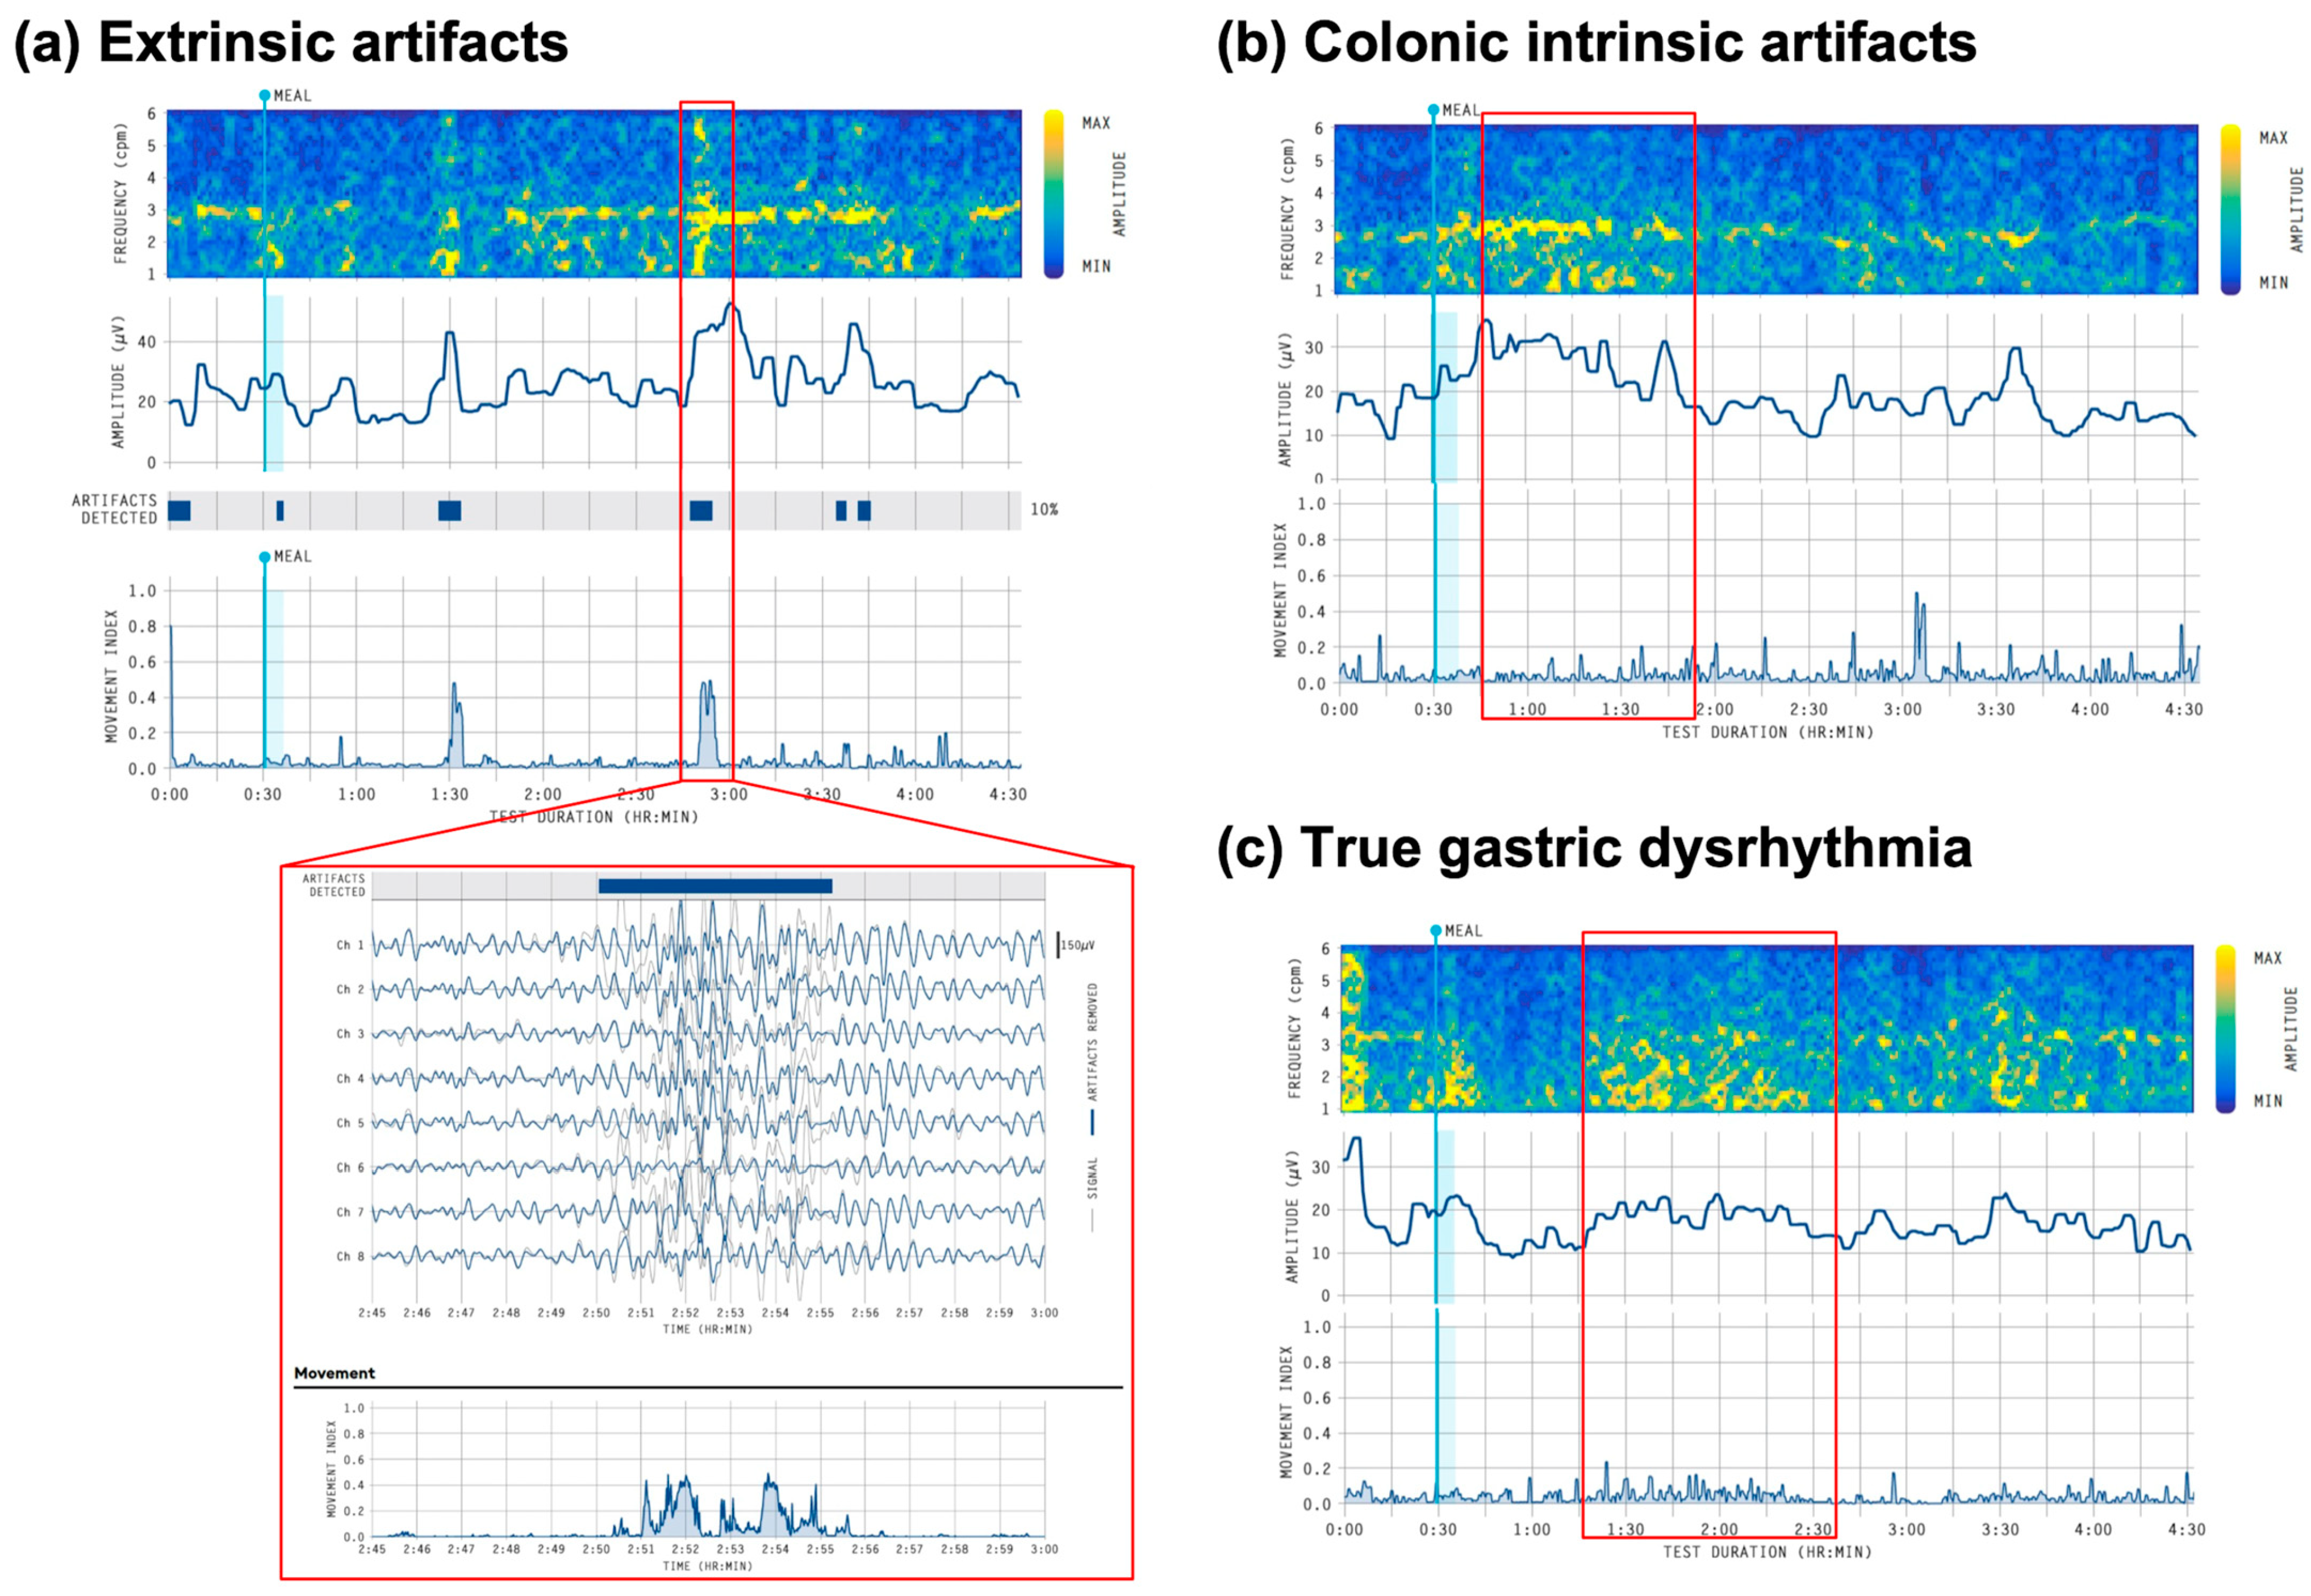
- Artifacts and Colonic Activity
- Application of Normative Reference Intervals
- Validation of symptom profiles
- Mixed Profiles
10. Discussion
Author Contributions
Funding
Institutional Review Board Statement
Informed Consent Statement
Data Availability Statement
Conflicts of Interest
References
- Sperber, A.D.; Bangdiwala, S.I.; Drossman, D.A.; Ghoshal, U.C.; Simren, M.; Tack, J.; Whitehead, W.E.; Dumitrascu, D.L.; Fang, X.; Fukudo, S.; et al. Worldwide Prevalence and Burden of Functional Gastrointestinal Disorders, Results of Rome Foundation Global Study. Gastroenterology 2021, 160, 99–114.e3. [Google Scholar] [CrossRef] [PubMed]
- Huang, I.-H.; Schol, J.; Khatun, R.; Carbone, F.; Van den Houte, K.; Colomier, E.; Balsiger, L.M.; Törnblom, H.; Vanuytsel, T.; Sundelin, E.; et al. Worldwide Prevalence and Burden of Gastroparesis-like Symptoms as Defined by the United European Gastroenterology (UEG) and European Society for Neurogastroenterology and Motility (ESNM) Consensus on Gastroparesis. United Eur. Gastroenterol. J. 2022, 10, 888–897. [Google Scholar] [CrossRef] [PubMed]
- Aziz, I.; Palsson, O.S.; Whitehead, W.E.; Sperber, A.D.; Simrén, M.; Törnblom, H. Epidemiology, Clinical Characteristics, and Associations for Rome IV Functional Nausea and Vomiting Disorders in Adults. Clin. Gastroenterol. Hepatol. 2019, 17, 878–886. [Google Scholar] [CrossRef] [PubMed]
- Ye, Y.; Jiang, B.; Manne, S.; Moses, P.L.; Almansa, C.; Bennett, D.; Dolin, P.; Ford, A.C. Epidemiology and Outcomes of Gastroparesis, as Documented in General Practice Records, in the United Kingdom. Gut 2021, 70, 644–653. [Google Scholar] [CrossRef]
- Pasricha, P.J.; Grover, M.; Yates, K.P.; Abell, T.L.; Bernard, C.E.; Koch, K.L.; McCallum, R.W.; Sarosiek, I.; Kuo, B.; Bulat, R.; et al. Functional Dyspepsia and Gastroparesis in Tertiary Care Are Interchangeable Syndromes With Common Clinical and Pathologic Features. Gastroenterology 2021, 160, 2006–2017. [Google Scholar] [CrossRef]
- Pasricha, P.J.; Colvin, R.; Yates, K.; Hasler, W.L.; Abell, T.L.; Unalp-Arida, A.; Nguyen, L.; Farrugia, G.; Koch, K.L.; Parkman, H.P.; et al. Characteristics of Patients with Chronic Unexplained Nausea and Vomiting and Normal Gastric Emptying. Clin. Gastroenterol. Hepatol. 2011, 9, 567–576. [Google Scholar] [CrossRef]
- Langworthy, J.; Parkman, H.P.; Schey, R. Emerging Strategies for the Treatment of Gastroparesis. Expert Rev. Gastroenterol. Hepatol. 2016, 10, 817–825. [Google Scholar] [CrossRef]
- Irvine, E.J.; Tack, J.; Crowell, M.D.; Gwee, K.A.; Ke, M.; Schmulson, M.J.; Whitehead, W.E.; Spiegel, B. Design of Treatment Trials for Functional Gastrointestinal Disorders. Gastroenterology 2016, 150, 1469–1480. [Google Scholar] [CrossRef]
- Pasricha, P.J.; Parkman, H.P. Gastroparesis: Definitions and Diagnosis. Gastroenterol. Clin. N. Am. 2015, 44, 1–7. [Google Scholar] [CrossRef]
- Stanghellini, V.; Tack, J. Gastroparesis: Separate Entity or Just a Part of Dyspepsia? Gut 2014, 63, 1972–1978. [Google Scholar] [CrossRef]
- Vijayvargiya, P.; Jameie-Oskooei, S.; Camilleri, M.; Chedid, V.; Erwin, P.J.; Murad, M.H. Association between Delayed Gastric Emptying and Upper Gastrointestinal Symptoms: A Systematic Review and Meta-Analysis. Gut 2019, 68, 804–813. [Google Scholar] [CrossRef]
- O’Grady, G.; Carbone, F.; Tack, J. Gastric Sensorimotor Function and Its Clinical Measurement. Neurogastroenterol. Motil. 2022, 34, e14489. [Google Scholar] [CrossRef] [PubMed]
- O’Grady, G.; Gharibans, A.A.; Du, P.; Huizinga, J.D. The Gastric Conduction System in Health and Disease: A Translational Review. Am. J. Physiol. Gastrointest. Liver Physiol. 2021, 321, G527–G542. [Google Scholar] [CrossRef] [PubMed]
- Huizinga, J.D.; Lammers, W.J.E.P. Gut Peristalsis Is Governed by a Multitude of Cooperating Mechanisms. Am. J. Physiol. Gastrointest. Liver Physiol. 2009, 296, G1–G8. [Google Scholar] [CrossRef] [PubMed]
- Parkman, H.P.; Hasler, W.L.; Barnett, J.L. Electrogastrography: A Document Prepared by the Gastric Section of the American Motility Society Clinical GI Motility Testing Task Force. Neurogastroenterol. Motil. 2003, 15, 89–102. [Google Scholar] [CrossRef] [PubMed]
- Schamberg, G.; Calder, S.; Varghese, C.; Xu, W.; Wang, W.J.; Ho, V.; Daker, C.; Andrews, C.N.; O’Grady, G.; Gharibans, A.A. Comparison of Gastric Alimetry® Body Surface Gastric Mapping versus Electrogastrography Spectral Analysis. Sci. Rep. 2023, 13, 14987. [Google Scholar] [CrossRef]
- Gharibans, A.A.; Hayes, T.C.L.; Carson, D.A.; Calder, S.; Varghese, C.; Du, P.; Yarmut, Y.; Waite, S.; Keane, C.; Woodhead, J.S.T.; et al. A Novel Scalable Electrode Array and System for Non-Invasively Assessing Gastric Function Using Flexible Electronics. Neurogastroenterol. Motil. 2022, 35, e14418. [Google Scholar] [CrossRef] [PubMed]
- Sebaratnam, G.; Karulkar, N.; Calder, S.; Woodhead, J.S.T.; Keane, C.; Carson, D.A.; Varghese, C.; Du, P.; Waite, S.J.; Tack, J.; et al. Standardized System and App for Continuous Patient Symptom Logging in Gastroduodenal Disorders: Design, Implementation, and Validation. Neurogastroenterol. Motil. 2022, 34, e14331. [Google Scholar] [CrossRef]
- Carson, D.A.; O’Grady, G.; Du, P.; Gharibans, A.A.; Andrews, C.N. Body Surface Mapping of the Stomach: New Directions for Clinically Evaluating Gastric Electrical Activity. Neurogastroenterol. Motil. 2021, 33, e14048. [Google Scholar] [CrossRef]
- Gharibans, A.A.; Coleman, T.P.; Mousa, H.; Kunkel, D.C. Spatial Patterns From High-Resolution Electrogastrography Correlate With Severity of Symptoms in Patients With Functional Dyspepsia and Gastroparesis. Clin. Gastroenterol. Hepatol. 2019, 17, 2668–2677. [Google Scholar] [CrossRef]
- Gharibans, A.A.; Smarr, B.L.; Kunkel, D.C.; Kriegsfeld, L.J.; Mousa, H.M.; Coleman, T.P. Artifact Rejection Methodology Enables Continuous, Noninvasive Measurement of Gastric Myoelectric Activity in Ambulatory Subjects. Sci. Rep. 2018, 8, 5019. [Google Scholar] [CrossRef]
- Varghese, C.; Schamberg, G.; Calder, S.; Waite, S.; Carson, D.; Foong, D.; Wang, W.J.; Ho, V.; Woodhead, J.; Daker, C.; et al. Normative Values for Body Surface Gastric Mapping Evaluations of Gastric Motility Using Gastric Alimetry: Spectral Analysis. Am. J. Gastroenterol. 2022, 118, 1047–1057. [Google Scholar] [CrossRef]
- Calder, S.; Schamberg, G.; Varghese, C.; Waite, S.; Sebaratnam, G.; Woodhead, J.S.T.; Du, P.; Andrews, C.N.; O’Grady, G.; Gharibans, A.A. An Automated Artifact Detection and Rejection System for Body Surface Gastric Mapping. Neurogastroenterol. Motil. 2022, 34, e14421. [Google Scholar] [CrossRef]
- Schamberg, G.; Varghese, C.; Calder, S.; Waite, S.; Erickson, J.; O’Grady, G.; Gharibans, A.A. Revised Spectral Metrics for Body Surface Measurements of Gastric Electrophysiology. Neurogastroenterol. Motil. 2023, 35, e14491. [Google Scholar] [CrossRef]
- O’Grady, G.; Varghese, C.; Schamberg, G.; Calder, S.; Du, P.; Xu, W.; Tack, J.; Daker, C.; Mousa, H.; Abell, T.L.; et al. Principles and Clinical Methods of Body Surface Gastric Mapping: Technical Review. Neurogastroenterol. Motil. 2023, 35, e14556. [Google Scholar] [CrossRef] [PubMed]
- Carson, D.A.; Robertson, S.; Wang, T.H.-H.; Varghese, C.; Gharibans, A.A.; Windsor, J.A.; O’Grady, G. The Impact and Clinical Implications of Gastric Surgery on the Gastric Conduction System. Foregut J. Am. Foregut Soc. 2023, 3, 29–44. [Google Scholar] [CrossRef]
- Gharibans, A.A.; Calder, S.; Varghese, C.; Waite, S.; Schamberg, G.; Daker, C.; Du, P.; Alighaleh, S.; Carson, D.; Woodhead, J.; et al. Gastric Dysfunction in Patients with Chronic Nausea and Vomiting Syndromes Defined by a Noninvasive Gastric Mapping Device. Sci. Transl. Med. 2022, 14, eabq3544. [Google Scholar] [CrossRef] [PubMed]
- Xu, W.; Gharibans, A.A.; Calder, S.; Schamberg, G.; Walters, A.J.J.; Varghese, C.; Carson, D.; Daker, C.; Waite, S.A.C.N. Defining and Phenotyping Gastric Abnormalities in Long-Term Type 1 Diabetes Using Body Surface Gastric Mapping. Gastro Hep Adv. 2023, in press. [Google Scholar] [CrossRef]
- Wang, T.H.-H.; Tokhi, A.; Gharibans, A.; Evennett, N.; Beban, G.; Schamberg, G.; Varghese, C.; Calder, S.; Duong, C.; O’Grady, G. Non-Invasive Thoracoabdominal Mapping of Postoesophagectomy Conduit Function. BJS Open 2023, 7, zrad036. [Google Scholar] [CrossRef] [PubMed]
- O’Grady, G.; Varghese, C.; Schamberg, G.; Foong, D.; Tack, J.; Xu, W.; Daker, C.; Ho, V.; Abell, T.; Parkman, H.; et al. An Initial Phenotype Set for the Assessment of Gastroduodenal Disorders with Gastric Alimetry®. SSRN 2023. [Google Scholar] [CrossRef]
- Wang, W.J.; Foong, D.; Calder, S.; Schamberg, G.; Varghese, C.; Tack, J.; Xu, W.; Daker, C.; Carson, D.; Waite, S.; et al. Gastric Alimetry® Improves Patient Phenotyping in Gastroduodenal Disorders Compared to Gastric Emptying Scintigraphy Alone. medRxiv 2023. [Google Scholar] [CrossRef]
- Varghese, C.; Daker, C.; Lim, A.; Sebaratnam, G.; Xu, W.; Kean, B.; Cederwall, C. Gastric Alimetry® in the Management of Chronic Gastroduodenal Disorders: Impact to Diagnosis and Healthcare Utilization. Clin. Transl. Gastroenterol. 2023. [Google Scholar] [CrossRef] [PubMed]
- O’Grady, G.; Angeli, T.R.; Paskaranandavadivel, N.; Erickson, J.C.; Wells, C.I.; Gharibans, A.A.; Cheng, L.K.; Du, P. Methods for High-Resolution Electrical Mapping in the Gastrointestinal Tract. IEEE Rev. Biomed. Eng. 2019, 12, 287–302. [Google Scholar] [CrossRef]
- Alimetry Ltd. Gastric Alimetry Report Guidelines. Available online: https://www.alimetry.com/gastric-alimetry-report-interpretation-guide (accessed on 25 April 2023).
- McAdams, E. Bioelectrodes. Encyclopedia of Medical Devices and Instrumentation; Wiley: Hoboken, NJ, USA, 2006. [Google Scholar]
- Yin, J.; Chen, J.D.Z. Electrogastrography: Methodology, Validation and Applications. J. Neurogastroenterol. Motil. 2013, 19, 5–17. [Google Scholar] [CrossRef]
- Koch, K.L.; Stern, R.M. Handbook of Electrogastrography; Oxford University Press: Oxford, UK, 2003; ISBN 9780199749003. [Google Scholar]
- Obioha, C.; Erickson, J.; Suseela, S.; Hajri, T.; Chung, E.; Richards, W.; Bradshaw, L.A. Effect of Body Mass Index on the Sensitivity of Magnetogastrogram and Electrogastrogram. J. Gastroenterol. Hepatol. Res. 2013, 2, 513–519. [Google Scholar]
- Varghese, C.; Carson, D.A.; Bhat, S.; Hayes, T.C.L.; Gharibans, A.A.; Andrews, C.N.; O’Grady, G. Clinical Associations of Functional Dyspepsia with Gastric Dysrhythmia on Electrogastrography: A Comprehensive Systematic Review and Meta-Analysis. Neurogastroenterol. Motil. 2021, 33, e14151. [Google Scholar] [CrossRef]
- Carson, D.A.; Bhat, S.; Hayes, T.C.L.; Gharibans, A.A.; Andrews, C.N.; O’Grady, G.; Varghese, C. Abnormalities on Electrogastrography in Nausea and Vomiting Syndromes: A Systematic Review, Meta-Analysis, and Comparison to Other Gastric Disorders. Dig. Dis. Sci. 2022, 67, 773–785. [Google Scholar] [CrossRef]
- Bhat, S.; Varghese, C.; Carson, D.A.; Hayes, T.C.L.; Gharibans, A.A.; Andrews, C.N.; O’Grady, G. Gastric Dysrhythmia in Gastroesophageal Reflux Disease: A Systematic Review and Meta-Analysis. Esophagus 2021, 18, 425–435. [Google Scholar] [CrossRef]
- Berry, R.; Cheng, L.K.; Du, P.; Paskaranandavadivel, N.; Angeli, T.R.; Mayne, T.; Beban, G.; O’Grady, G. Patterns of Abnormal Gastric Pacemaking After Sleeve Gastrectomy Defined by Laparoscopic High-Resolution Electrical Mapping. Obes. Surg. 2017, 27, 1929–1937. [Google Scholar] [CrossRef]
- Brzana, R.J.; Koch, K.L.; Bingaman, S. Gastric Myoelectrical Activity in Patients with Gastric Outlet Obstruction and Idiopathic Gastroparesis. Am. J. Gastroenterol. 1998, 93, 1803–1809. [Google Scholar] [CrossRef]
- Wellington, J.; Scott, B.; Kundu, S.; Stuart, P.; Koch, K.L. Effect of Endoscopic Pyloric Therapies for Patients with Nausea and Vomiting and Functional Obstructive Gastroparesis. Auton. Neurosci. 2017, 202, 56–61. [Google Scholar] [CrossRef] [PubMed]
- Walldén, J.; Lindberg, G.; Sandin, M.; Thörn, S.-E.; Wattwil, M. Effects of Fentanyl on Gastric Myoelectrical Activity: A Possible Association with Polymorphisms of the Mu-Opioid Receptor Gene? Acta Anaesthesiol. Scand. 2008, 52, 708–715. [Google Scholar] [CrossRef] [PubMed]
- Lin, Z.; Sarosiek, I.; Forster, J.; Damjanov, I.; Hou, Q.; McCallum, R.W. Association of the Status of Interstitial Cells of Cajal and Electrogastrogram Parameters, Gastric Emptying and Symptoms in Patients with Gastroparesis. Neurogastroenterol. Motil. 2010, 22, 56-e10. [Google Scholar]
- O’Grady, G.; Angeli, T.R.; Du, P.; Lahr, C.; Lammers, W.J.E.P.; Windsor, J.A.; Abell, T.L.; Farrugia, G.; Pullan, A.J.; Cheng, L.K. Abnormal Initiation and Conduction of Slow-Wave Activity in Gastroparesis, Defined by High-Resolution Electrical Mapping. Gastroenterology 2012, 143, 589–598. [Google Scholar] [CrossRef] [PubMed]
- Angeli, T.R.; Cheng, L.K.; Du, P.; Wang, T.H.-H.; Bernard, C.E.; Vannucchi, M.-G.; Faussone-Pellegrini, M.S.; Lahr, C.; Vather, R.; Windsor, J.A.; et al. Loss of Interstitial Cells of Cajal and Patterns of Gastric Dysrhythmia in Patients With Chronic Unexplained Nausea and Vomiting. Gastroenterology 2015, 149, 56–66. [Google Scholar] [CrossRef]
- Stanghellini, V.; Chan, F.K.L.; Hasler, W.L.; Malagelada, J.R.; Suzuki, H.; Tack, J.; Talley, N.J. Gastroduodenal Disorders. Gastroenterology 2016, 150, 1380–1392. [Google Scholar] [CrossRef]
- Vanheel, H.; Vanuytsel, T.; Van Oudenhove, L.; Farré, R.; Verbeke, K.; Tack, J. Postprandial Symptoms Originating from the Stomach in Functional Dyspepsia. Neurogastroenterol. Motil. 2013, 25, 911-e703. [Google Scholar] [CrossRef]
- Varghese, C.; Schamberg, G.; Uren, E.; Calder, S.; Law, M.; Foong, D.; Ho, V.; Du, P.; Daker, C.; Andrews, C.; et al. Standardized Mechanism-Based Digital Profiling of Gastroduodenal Symptoms. 2023. Available online: https://ssrn.com/abstract=4517181 (accessed on 20 July 2023).
- Law, M.; Bartlett, E.; Sebaratnam, G.; Pickering, I.; Simpson, K.; Keane, C.; Daker, C.; Gharibans, A.; O’Grady, G.; Andrews, C.N.; et al. “One More Tool in the Tool Belt”: A Qualitative Interview Study Investigating Patient and Clinician Opinions on the Integration of Psychometrics into Routine Testing for Disorders of Gut-Brain Interaction. medRxiv 2023. [Google Scholar] [CrossRef]
- Law, M.; Pickering, I.; Bartlett, E.; Sebaratnam, G.; Varghese, C.; Gharibans, A.; O’Grady, G.; Andrews, C.N.; Calder, S. Cognitive Behavioural Therapy-Based Interventions for Gastroduodenal Disorders of Gut-Brain Interaction: A Systematic Review. bioRxiv 2023. [Google Scholar] [CrossRef]
- Schamberg, G.; Varghese, C.; Uren, E.; Calder, S.; O’Grady, G.; Gharibans, A.A. Physiology-Guided Quantitative Symptom Analysis for Gastroduodenal Disorders. bioRxiv 2023. [Google Scholar] [CrossRef]
- Varghese, C.; Xu, W.; Daker, C.; Bissett, I.P.; Cederwall, C. Clinical Utility of Gastric Alimetry® in the Management of Intestinal Failure Patients with Possible Underlying Gut Motility Disorders. Clin. Nutr. Open Sci. 2023, 51, 15–25. [Google Scholar] [CrossRef]
- Wellington, J.; Stuart, P.; Westcott, C.; Koch, K.L. Obstructive Gastroparesis: Patient Selection and Effect of Laparoscopic Pyloroplasty. J. Gastrointest. Surg. 2020, 24, 1778–1784. [Google Scholar] [CrossRef] [PubMed]
- Verhagen, M.A.; Van Schelven, L.J.; Samsom, M.; Smout, A.J. Pitfalls in the Analysis of Electrogastrographic Recordings. Gastroenterology 1999, 117, 453–460. [Google Scholar] [CrossRef]
- Dinning, P.G.; Wiklendt, L.; Maslen, L.; Gibbins, I.; Patton, V.; Arkwright, J.W.; Lubowski, D.Z.; O’Grady, G.; Bampton, P.A.; Brookes, S.J.; et al. Quantification of in Vivo Colonic Motor Patterns in Healthy Humans before and after a Meal Revealed by High-Resolution Fiber-Optic Manometry. Neurogastroenterol. Motil. 2014, 26, 1443–1457. [Google Scholar] [CrossRef] [PubMed]
- Cheng, L.K.; O’Grady, G.; Du, P.; Egbuji, J.U.; Windsor, J.A.; Pullan, A.J. Gastrointestinal System. Wiley Interdiscip. Rev. Syst. Biol. Med. 2010, 2, 65–79. [Google Scholar] [CrossRef] [PubMed]
- Whyte, M.B.; Kelly, P. The Normal Range: It Is Not Normal and It Is Not a Range. Postgrad. Med. J. 2018, 94, 613–616. [Google Scholar] [CrossRef]
- Tack, J.; Caenepeel, P.; Piessevaux, H.; Cuomo, R.; Janssens, J. Assessment of Meal Induced Gastric Accommodation by a Satiety Drinking Test in Health and in Severe Functional Dyspepsia. Gut 2003, 52, 1271–1277. [Google Scholar] [CrossRef]
- Scarpellini, E.; Van den Houte, K.; Schol, J.; Huang, I.-H.; Colomier, E.; Carbone, F.; Tack, J. Nutrient Drinking Test as Biomarker in Functional Dyspepsia. Am. J. Gastroenterol. 2021, 116, 1387–1395. [Google Scholar] [CrossRef]
- Black, C.J.; Drossman, D.A.; Talley, N.J.; Ruddy, J.; Ford, A.C. Functional Gastrointestinal Disorders: Advances in Understanding and Management. Lancet 2020, 396, 1664–1674. [Google Scholar] [CrossRef]
- Calder, S.; Cheng, L.K.; Andrews, C.N.; Paskaranandavadivel, N.; Waite, S.; Alighaleh, S.; Erickson, J.C.; Gharibans, A.; O’Grady, G.; Du, P. Validation of Noninvasive Body-Surface Gastric Mapping for Detecting Gastric Slow-Wave Spatiotemporal Features by Simultaneous Serosal Mapping in Porcine. Am. J. Physiol. Gastrointest. Liver Physiol. 2022, 323, G295–G305. [Google Scholar] [CrossRef]
- Somarajan, S.; Muszynski, N.D.; Olson, J.D.; Comstock, A.; Russell, A.C.; Walker, L.S.; Acra, S.A.; Bradshaw, L.A. The Effect of Chronic Nausea on Gastric Slow Wave Spatiotemporal Dynamics in Children. Neurogastroenterol. Motil. 2021, 33, e14035. [Google Scholar] [CrossRef] [PubMed]
- Browning, K.N.; Travagli, R.A. Central Nervous System Control of Gastrointestinal Motility and Secretion and Modulation of Gastrointestinal Functions. Compr. Physiol. 2014, 4, 1339–1368. [Google Scholar] [PubMed]


| Feature | Criteria | Pathophysiology to Consider * |
|---|---|---|
| Dysrhythmic | GA-RI < 0.25 | Gastric neuromuscular disorder Dysrhythmic states |
| Low-amplitude | BMI-adjusted amplitude < 22 µV | Hypomotility Myopathy Gastric neuromuscular disorder or myopathy |
| High-amplitude | BMI-adjusted amplitude > 70 µV | Gastric outlet resistance |
| High-frequency | Frequency > 3.35 cpm | Long-term diabetes Vagal neuropathy or injury |
| Low-frequency | Frequency < 2.65 cpm | Impaired pacemaker function Resection of primary gastric pacemaker |
| Sensorimotor profile | Normal spectral analysis Meal-responsive symptoms that correlate with gastric amplitude | Hypersensitivity and/or impaired accommodation disorder |
| Continuous profile | Normal spectral analysis Non-meal-responsive symptoms that persist at a high severity throughout test, including before meal | Disorder of gut–brain axis or vagal neuropathy or non-gastric cause |
| Post-gastric profile | Normal spectral analysis Symptoms trend upwards late in the test as gastric amplitude decays | Consider small bowel pathophysiology |
Disclaimer/Publisher’s Note: The statements, opinions and data contained in all publications are solely those of the individual author(s) and contributor(s) and not of MDPI and/or the editor(s). MDPI and/or the editor(s) disclaim responsibility for any injury to people or property resulting from any ideas, methods, instructions or products referred to in the content. |
© 2023 by the authors. Licensee MDPI, Basel, Switzerland. This article is an open access article distributed under the terms and conditions of the Creative Commons Attribution (CC BY) license (https://creativecommons.org/licenses/by/4.0/).
Share and Cite
Foong, D.; Calder, S.; Varghese, C.; Schamberg, G.; Xu, W.; Daker, C.; Ho, V.; Andrews, C.N.; Gharibans, A.A.; O’Grady, G. Gastric Alimetry® Test Interpretation in Gastroduodenal Disorders: Review and Recommendations. J. Clin. Med. 2023, 12, 6436. https://doi.org/10.3390/jcm12206436
Foong D, Calder S, Varghese C, Schamberg G, Xu W, Daker C, Ho V, Andrews CN, Gharibans AA, O’Grady G. Gastric Alimetry® Test Interpretation in Gastroduodenal Disorders: Review and Recommendations. Journal of Clinical Medicine. 2023; 12(20):6436. https://doi.org/10.3390/jcm12206436
Chicago/Turabian StyleFoong, Daphne, Stefan Calder, Chris Varghese, Gabriel Schamberg, William Xu, Charlotte Daker, Vincent Ho, Christopher N. Andrews, Armen A. Gharibans, and Greg O’Grady. 2023. "Gastric Alimetry® Test Interpretation in Gastroduodenal Disorders: Review and Recommendations" Journal of Clinical Medicine 12, no. 20: 6436. https://doi.org/10.3390/jcm12206436