
Reference Values of the Quality of Life after Brain Injury (QOLIBRI) from a General Population Sample in Italy
 , ,
, ,  , ,
, ,
Abstract
:1. Introduction
2. Methods
2.1. Study Design
2.2. Ethical Approvals
2.2.1. General Population Sample
2.2.2. TBI Sample
2.3. Instruments
2.3.1. Quality of Life after Traumatic Brain Injury (QOLIBRI)
2.3.2. Sociodemographic and Health Status Data
2.4. Participants
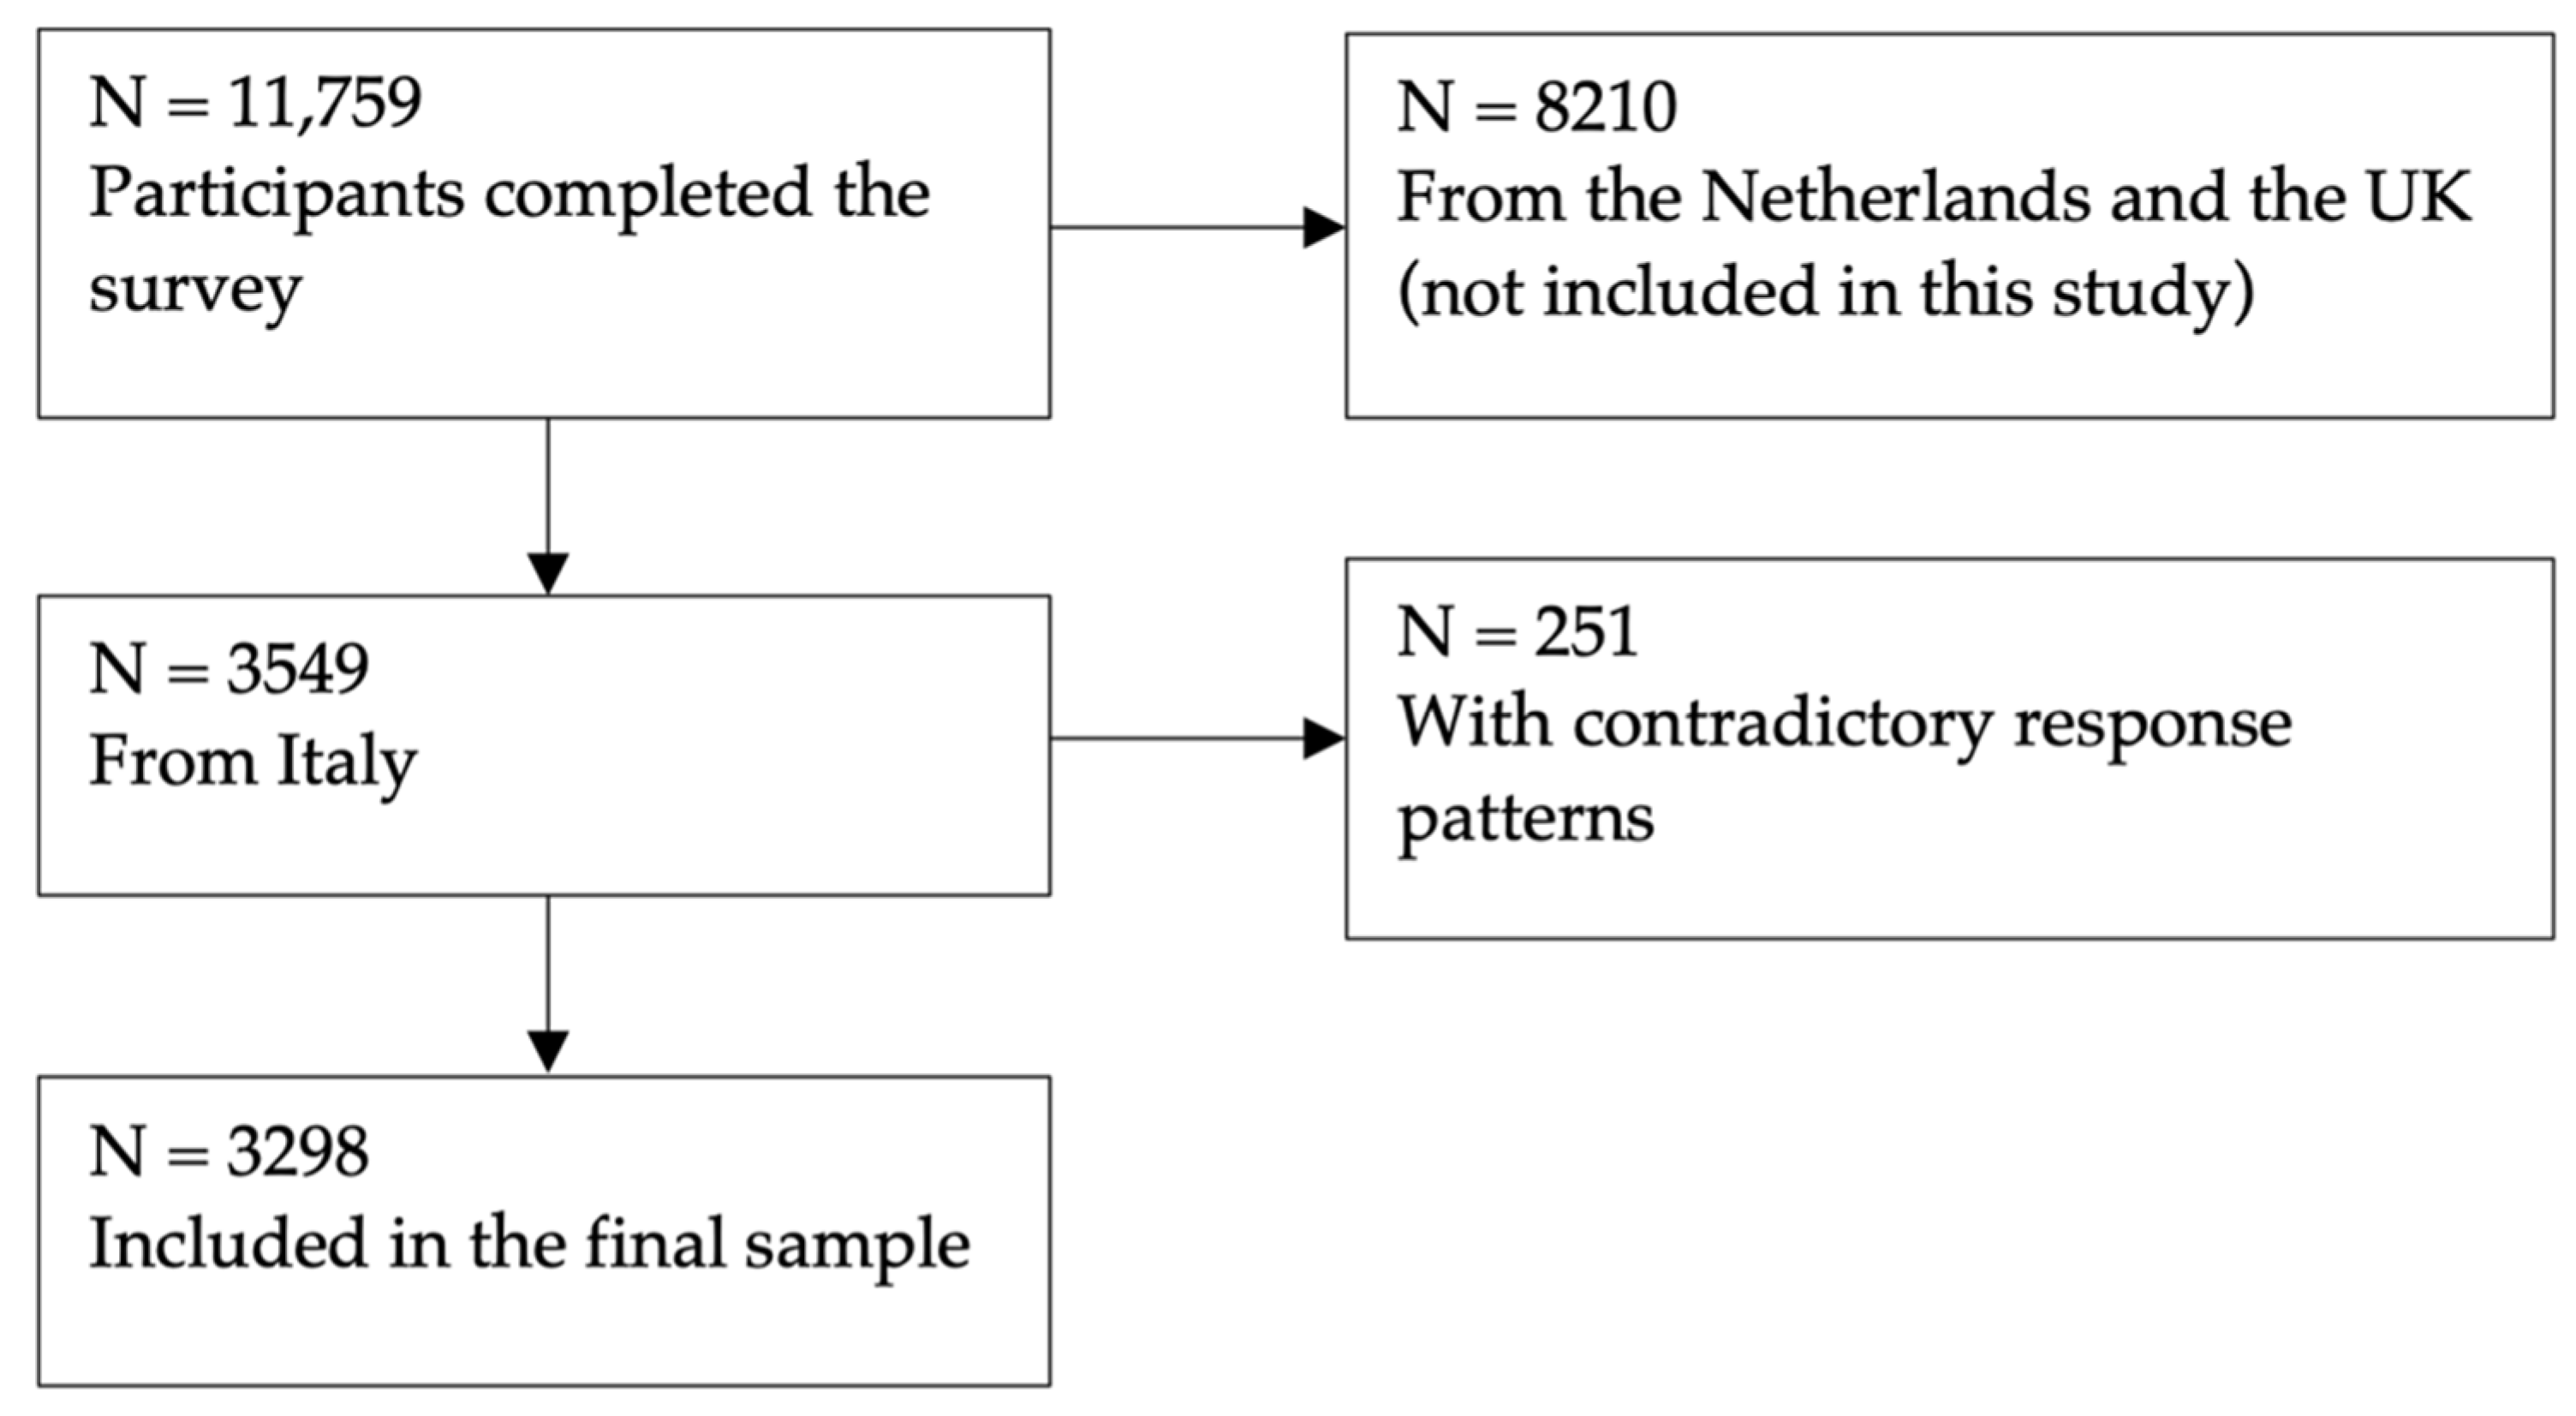
2.4.1. General Population Sample
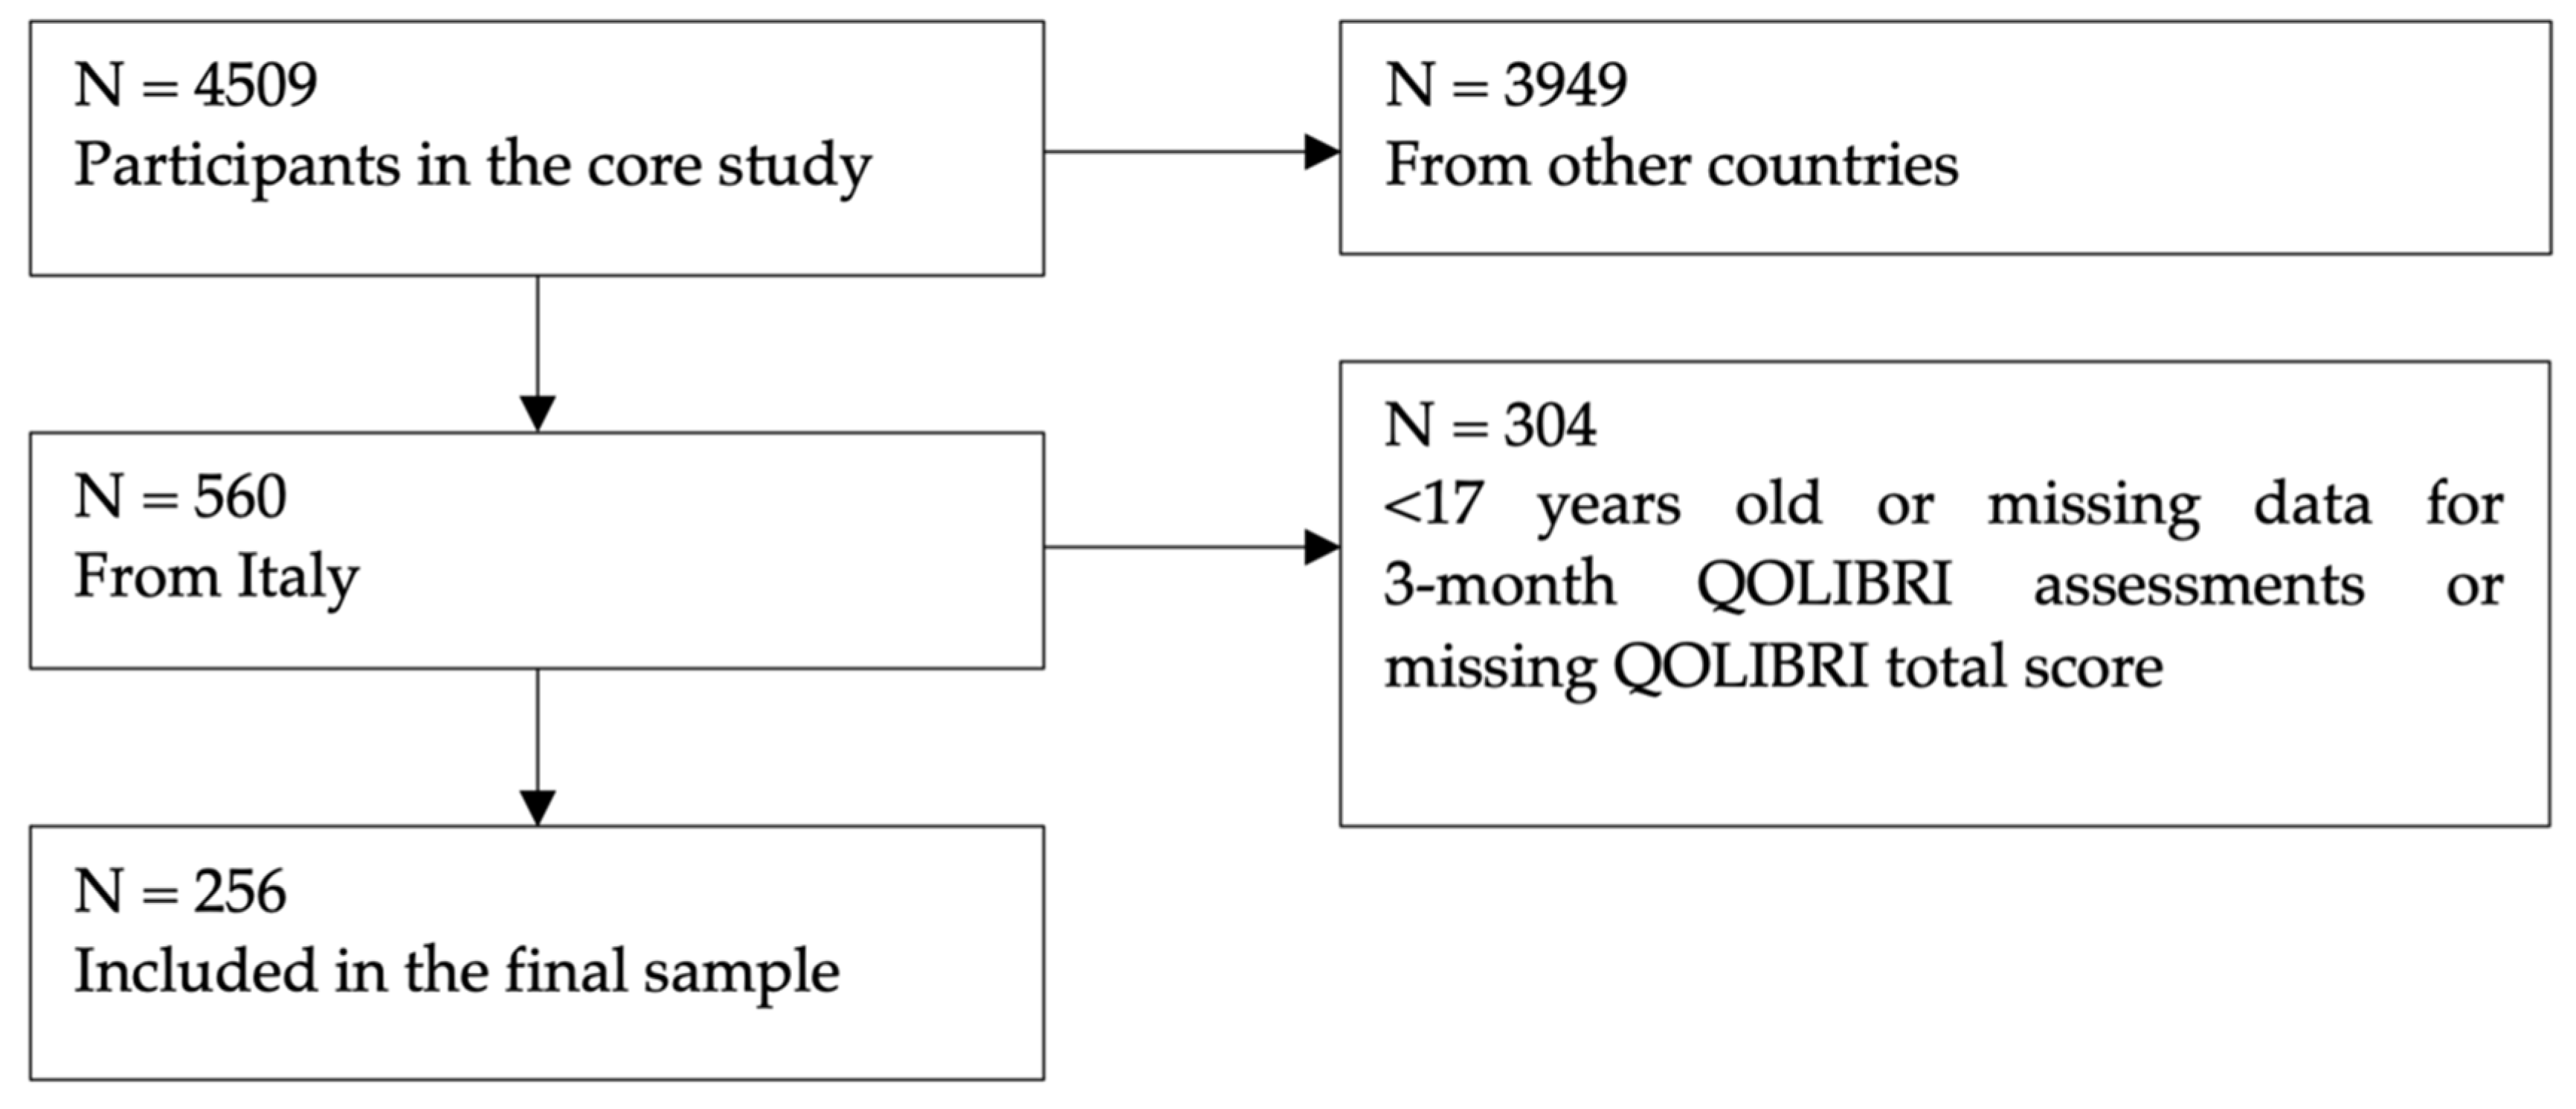
2.4.2. TBI Sample
2.5. Statistical Analyses
2.5.1. Item and Scale Characteristics of QOLIBRI in General Population
2.5.2. Construct Validity of QOLIBRI in General Population
2.5.3. Measurement Invariance between Samples
2.5.4. Regression Analysis
2.5.5. Reference Values from the General Population Sample
3. Results
3.1. Item and Scale Characteristics of QOLIBRI in the General Population
3.2. Construct Validity of the QOLIBRI in the General Population
3.3. Measurement Invariance
3.4. Linear Regression Analysis
3.5. QOLIBRI Reference Values for the Italian General Population
4. Discussion
4.1. Strengths and Limitations
4.2. Conclusions
Supplementary Materials
Author Contributions
Funding
Institutional Review Board Statement
Data Availability Statement
Acknowledgments
Conflicts of Interest
Appendix A

| CHC (N) | 18–24 (n = 310) | 25–34 (n = 565) | 35–44 (n = 741) | 45–54 (n = 664) | 55–64 (n = 586) | <65 (n = 432) | Total (n = 1518) |
|---|---|---|---|---|---|---|---|
| Asthma | 26 | 48 | 60 | 41 | 41 | 26 | 242 |
| Heart Disease | 2 | 7 | 5 | 10 | 18 | 20 | 62 |
| Stroke | 5 | 6 | 5 | 10 | 5 | 7 | 38 |
| Diabetes | 13 | 25 | 34 | 50 | 52 | 57 | 231 |
| Back Complaints | 12 | 31 | 43 | 50 | 43 | 28 | 207 |
| Arthritis | 6 | 32 | 49 | 64 | 101 | 68 | 320 |
| Rheumatism | 4 | 30 | 43 | 51 | 55 | 37 | 220 |
| Cancer | 5 | 6 | 11 | 11 | 11 | 18 | 62 |
| Memory Problems due to Dementia | 4 | 13 | 13 | 11 | 11 | 2 | 54 |
| Memory Problems due to Ageing | 5 | 7 | 11 | 25 | 47 | 44 | 139 |
| Depression | 57 | 95 | 111 | 105 | 81 | 50 | 499 |
| Other | 19 | 35 | 65 | 89 | 80 | 56 | 344 |
| General Population (TBI as a Ref.) | |
|---|---|
| COGNITION | Thresholds |
| Concentrate | 0.704 (0.000) |
| Expressing yourself | 0.757 (0.000) |
| Memory | 0.670 (0.004) |
| Plan and problem solving | 0.753 (0.000) |
| Decisions | 0.742 (−0.001) |
| Navigate | 0.754 (−0.004) |
| Speed of thinking | 0.766 (0.002) |
| SELF | |
| Energy | 0.597 (0.009) |
| Motivation | 0.628 (0.004) |
| Self-esteem | 0.576 (0.003) |
| Appearance | 0.518 (0.000) |
| Achievements | 0.541 (−0.011) |
| Self-perception | 0.580 (−0.001) |
| Future | 0.435(−0.004) |
| DAILY LIFE AND AUTONOMY | |
| Independence | 0.656 (−0.001) |
| Get out and about | 0.745 (0.002) |
| Domestic activities | 0.750 (0.002) |
| Run personal finances | 0.660 (−0.005) |
| Participation at work | 0.662 (0.001) |
| Social and leisure activities | 0.546 (0.002) |
| In charge of life | 0.628 (−0.002) |
| SOCIAL RELATIONSHIPS | |
| Affection towards others | 0.716 (0.000) |
| Family | 0.709 (−0.001) |
| Friends | 0.649 (−0.002) |
| Partner | 0.649 (0.000) |
| Sex life | 0.547(0.007) |
| Attitudes of others | 0.544 (−0.003) |
| EMOTIONS | |
| Loneliness | 0.482 (−0.004) |
| Boredom | 0.421 (0.000) |
| Anxiety | 0.407 (0.001) |
| Sadness | 0.413 (0.002) |
| Anger/Aggression | 0.378 (0.000) |
| PHYSICAL PROBLEMS | |
| Slow/clumsiness | 0.605 (0.006) |
| Effects other injuries | 0.592 (0.011) |
| Pain | 0.427 (−0.009) |
| Seeing/hearing | 0.534 (−0.005) |
| Effects health problems | 0.447 (−0.004) |
| Health Status × Age | |||||||||||||
|---|---|---|---|---|---|---|---|---|---|---|---|---|---|
| Low HRQoL | −1 SD | Md | +1 SD | High HRQoL | |||||||||
| Health Status | Age | N | 2.5% | 5% | 16% | 30% | 40% | 50% | 60% | 70% | 85% | 95% | 97.25% |
| Healthy | 18–24 | 199 | 39 | 45 | 50 | 56 | 61 | 64 | 67 | 70 | 79 | 91 | 95 |
| 25–34 | 346 | 37 | 42 | 51 | 57 | 62 | 65 | 69 | 73 | 82 | 91 | 98 | |
| 35–44 | 443 | 40 | 44 | 51 | 60 | 65 | 70 | 74 | 79 | 84 | 94 | 98 | |
| 45–54 | 337 | 43 | 48 | 55 | 62 | 67 | 71 | 76 | 80 | 88 | 97 | 100 | |
| 55–64 | 270 | 44 | 48 | 59 | 66 | 72 | 74 | 77 | 82 | 88 | 96 | 100 | |
| ≥65 | 185 | 52 | 55 | 62 | 70 | 74 | 77 | 81 | 85 | 92 | 99 | 100 | |
| At least one CHC | 18–24 | 111 | 24 | 32 | 44 | 48 | 51 | 53 | 58 | 64 | 72 | 85 | 91 |
| 25–34 | 219 | 18 | 27 | 38 | 48 | 50 | 53 | 56 | 61 | 72 | 84 | 89 | |
| 35–44 | 298 | 25 | 35 | 43 | 51 | 55 | 58 | 63 | 67 | 75 | 83 | 87 | |
| 45–54 | 327 | 27 | 31 | 42 | 51 | 55 | 59 | 64 | 69 | 78 | 87 | 90 | |
| 55–64 | 316 | 28 | 32 | 49 | 56 | 60 | 64 | 68 | 73 | 79 | 87 | 92 | |
| ≥65 | 247 | 39 | 42 | 52 | 59 | 63 | 69 | 72 | 77 | 83 | 91 | 94 | |
| Health Status × Education | |||||||||||||
| Low HRQoL | −1 SD | Md | +1 SD | High HRQoL | |||||||||
| Health Status | Education | N | 2.5% | 5% | 16% | 30% | 40% | 50% | 60% | 70% | 85% | 95% | 97.25% |
| Healthy | Low | 591 | 39 | 43 | 50 | 58 | 64 | 68 | 73 | 78 | 85 | 93 | 98 |
| Middle | 1021 | 42 | 47 | 55 | 62 | 67 | 71 | 75 | 79 | 87 | 96 | 100 | |
| High | 168 | 41 | 49 | 55 | 64 | 67 | 71 | 75 | 80 | 86 | 95 | 99 | |
| At least one CHC | Low | 520 | 30 | 35 | 45 | 52 | 56 | 61 | 65 | 70 | 78 | 87 | 89 |
| Middle | 824 | 25 | 30 | 44 | 52 | 56 | 60 | 65 | 70 | 79 | 87 | 92 | |
| High | 174 | 31 | 37 | 46 | 51 | 56 | 60 | 64 | 69 | 79 | 84 | 91 | |
| Sex × Health Status × Age | Low HRQoL | −1 SD | Md | +1 SD | High HRQoL | |||||||||
|---|---|---|---|---|---|---|---|---|---|---|---|---|---|---|
| Sex | Health Status | Age | N | 2.5% | 5% | 16% | 30% | 40% | 50% | 60% | 70% | 85% | 95% | 97.25% |
| Female | Healthy | 18–24 | 82 | 43 | 47 | 50 | 65 | 72 | 75 | 81 | 85 | 93 | 100 | 100 |
| 25–34 | 159 | 25 | 32 | 54 | 65 | 72 | 75 | 79 | 83 | 93 | 100 | 100 | ||
| 35–44 | 201 | 36 | 43 | 54 | 68 | 72 | 75 | 79 | 86 | 97 | 100 | 100 | ||
| 45–54 | 167 | 44 | 50 | 65 | 72 | 75 | 75 | 79 | 86 | 97 | 100 | 100 | ||
| 55–64 | 136 | 43 | 50 | 61 | 72 | 75 | 75 | 79 | 86 | 93 | 100 | 100 | ||
| ≥65 | 89 | 44 | 50 | 68 | 75 | 76 | 86 | 90 | 93 | 100 | 100 | 100 | ||
| At least one CHC | 18–24 | 63 | 29 | 36 | 50 | 58 | 61 | 65 | 68 | 75 | 83 | 93 | 99 | |
| 25–34 | 125 | 22 | 29 | 43 | 50 | 58 | 68 | 72 | 75 | 86 | 96 | 100 | ||
| 35–44 | 161 | 18 | 25 | 43 | 58 | 65 | 72 | 75 | 79 | 90 | 97 | 100 | ||
| 45–54 | 173 | 34 | 36 | 54 | 65 | 71 | 75 | 75 | 83 | 93 | 100 | 100 | ||
| 55–64 | 169 | 40 | 41 | 61 | 68 | 72 | 75 | 79 | 83 | 93 | 100 | 100 | ||
| ≥65 | 124 | 40 | 50 | 65 | 75 | 75 | 77 | 83 | 86 | 95 | 100 | 100 | ||
| Male | Healthy | 18–24 | 117 | 36 | 50 | 54 | 65 | 72 | 75 | 75 | 83 | 88 | 97 | 100 |
| 25–34 | 187 | 36 | 43 | 50 | 68 | 72 | 75 | 75 | 83 | 90 | 100 | 100 | ||
| 35–44 | 242 | 43 | 50 | 56 | 72 | 75 | 75 | 83 | 86 | 97 | 100 | 100 | ||
| 45–54 | 170 | 43 | 50 | 65 | 75 | 75 | 75 | 79 | 86 | 97 | 100 | 100 | ||
| 55–64 | 134 | 50 | 61 | 72 | 75 | 79 | 84 | 90 | 93 | 100 | 100 | 100 | ||
| ≥65 | 96 | 63 | 65 | 72 | 75 | 79 | 83 | 86 | 90 | 100 | 100 | 100 | ||
| At least one CHC | 18–24 | 48 | 26 | 29 | 50 | 61 | 68 | 75 | 83 | 86 | 90 | 96 | 100 | |
| 25–34 | 94 | 16 | 24 | 40 | 50 | 50 | 58 | 65 | 72 | 83 | 93 | 97 | ||
| 35–44 | 137 | 25 | 32 | 50 | 61 | 68 | 72 | 75 | 75 | 90 | 97 | 100 | ||
| 45–54 | 154 | 24 | 29 | 49 | 58 | 68 | 72 | 75 | 83 | 93 | 100 | 100 | ||
| 55–64 | 147 | 30 | 44 | 59 | 68 | 73 | 75 | 75 | 83 | 90 | 100 | 100 | ||
| ≥65 | 123 | 40 | 50 | 65 | 72 | 75 | 79 | 83 | 86 | 96 | 100 | 100 | ||
| Sex × Health Status × Education | Low HRQoL | −1 SD | MD | +1 SD | High HRQoL | |||||||||
| Sex | Health Status | Education | N | 2.5% | 5% | 16% | 30% | 40% | 50% | 60% | 70% | 85% | 95% | 97.25% |
| Female | Healthy | Low | 321 | 40 | 43 | 50 | 65 | 72 | 75 | 75 | 83 | 93 | 100 | 100 |
| Middle | 445 | 43 | 50 | 61 | 72 | 75 | 75 | 83 | 86 | 97 | 100 | 100 | ||
| High | 68 | 24 | 48 | 71 | 75 | 79 | 83 | 86 | 90 | 97 | 100 | 100 | ||
| At least one CHC | Low | 296 | 29 | 36 | 50 | 61 | 68 | 72 | 75 | 83 | 90 | 100 | 100 | |
| Middle | 439 | 25 | 33 | 50 | 65 | 68 | 72 | 75 | 83 | 90 | 100 | 100 | ||
| High | 80 | 50 | 50 | 61 | 72 | 75 | 75 | 79 | 86 | 93 | 100 | 100 | ||
| Male | Healthy | Low | 270 | 36 | 43 | 54 | 68 | 74 | 75 | 79 | 83 | 93 | 100 | 100 |
| Middle | 576 | 45 | 50 | 65 | 75 | 75 | 79 | 83 | 86 | 97 | 100 | 100 | ||
| High | 100 | 45 | 50 | 61 | 72 | 75 | 75 | 79 | 86 | 97 | 100 | 100 | ||
| At least one CHC | Low | 224 | 28 | 36 | 50 | 65 | 68 | 75 | 75 | 83 | 90 | 100 | 100 | |
| Middle | 385 | 23 | 33 | 50 | 65 | 72 | 75 | 75 | 83 | 90 | 100 | 100 | ||
| High | 94 | 23 | 28 | 47 | 54 | 58 | 68 | 75 | 83 | 90 | 97 | 100 | ||
| Sex × Health Status × Age | Low HRQoL | −1 SD | Md | +1 SD | High HRQoL | |||||||||
|---|---|---|---|---|---|---|---|---|---|---|---|---|---|---|
| Sex | Health Status | Age | N | 2.5% | 5% | 16% | 30% | 40% | 50% | 60% | 70% | 85% | 95% | 97.25% |
| Female | Healthy | 18–24 | 82 | 22 | 25 | 40 | 50 | 58 | 65 | 71 | 75 | 79 | 100 | 100 |
| 25–34 | 159 | 8 | 14 | 36 | 50 | 58 | 65 | 72 | 75 | 87 | 100 | 100 | ||
| 35–44 | 201 | 18 | 25 | 40 | 54 | 61 | 68 | 75 | 75 | 86 | 100 | 100 | ||
| 45–54 | 167 | 25 | 29 | 50 | 64 | 68 | 72 | 75 | 79 | 90 | 100 | 100 | ||
| 55–64 | 136 | 18 | 31 | 50 | 58 | 65 | 72 | 75 | 75 | 85 | 97 | 97 | ||
| ≥65 | 89 | 41 | 45 | 58 | 68 | 72 | 75 | 75 | 83 | 93 | 100 | 100 | ||
| At least one CHC | 18–24 | 63 | 8 | 11 | 22 | 36 | 43 | 50 | 55 | 61 | 65 | 75 | 79 | |
| 25–34 | 125 | 8 | 11 | 22 | 40 | 47 | 50 | 58 | 61 | 75 | 82 | 96 | ||
| 35–44 | 161 | 8 | 8 | 29 | 43 | 50 | 54 | 61 | 68 | 75 | 86 | 90 | ||
| 45–54 | 173 | 5 | 11 | 25 | 43 | 50 | 58 | 61 | 68 | 75 | 90 | 96 | ||
| 55–64 | 169 | 11 | 15 | 36 | 50 | 55 | 65 | 68 | 72 | 75 | 90 | 96 | ||
| ≥65 | 124 | 15 | 25 | 40 | 50 | 54 | 61 | 68 | 72 | 79 | 90 | 100 | ||
| Male | Healthy | 18–24 | 117 | 25 | 35 | 50 | 57 | 65 | 68 | 75 | 75 | 86 | 95 | 100 |
| 25–34 | 187 | 25 | 29 | 50 | 54 | 61 | 68 | 72 | 75 | 83 | 99 | 100 | ||
| 35–44 | 242 | 22 | 36 | 50 | 58 | 68 | 72 | 75 | 75 | 86 | 100 | 100 | ||
| 45–54 | 170 | 23 | 36 | 50 | 58 | 65 | 72 | 75 | 75 | 86 | 100 | 100 | ||
| 55–64 | 134 | 36 | 46 | 54 | 65 | 72 | 72 | 75 | 79 | 90 | 100 | 100 | ||
| ≥65 | 96 | 36 | 53 | 62 | 68 | 72 | 75 | 75 | 79 | 89 | 100 | 100 | ||
| At least one CHC | 18–24 | 48 | 11 | 25 | 38 | 50 | 53 | 61 | 68 | 72 | 79 | 94 | 100 | |
| 25–34 | 94 | 6 | 11 | 25 | 39 | 47 | 50 | 53 | 58 | 75 | 86 | 97 | ||
| 35–44 | 137 | 11 | 22 | 36 | 47 | 54 | 58 | 65 | 72 | 78 | 83 | 90 | ||
| 45–54 | 154 | 11 | 18 | 29 | 47 | 50 | 58 | 65 | 69 | 79 | 90 | 93 | ||
| 55–64 | 147 | 15 | 21 | 43 | 54 | 61 | 65 | 72 | 75 | 79 | 90 | 95 | ||
| ≥65 | 123 | 22 | 26 | 50 | 60 | 65 | 68 | 72 | 75 | 83 | 93 | 93 | ||
| Sex × Health Status × Education | Low HRQoL | −1 SD | MD | +1 SD | High HRQoL | |||||||||
| Sex | Health Status | Education | N | 2.5% | 5% | 16% | 30% | 40% | 50% | 60% | 70% | 85% | 95% | 97.25% |
| Female | Healthy | Low | 321 | 11 | 25 | 40 | 54 | 61 | 68 | 75 | 75 | 86 | 100 | 100 |
| Middle | 445 | 22 | 29 | 47 | 58 | 65 | 68 | 75 | 75 | 86 | 100 | 100 | ||
| High | 68 | 28 | 36 | 54 | 65 | 68 | 75 | 75 | 79 | 90 | 100 | 100 | ||
| At least one CHC | Low | 296 | 8 | 15 | 29 | 47 | 50 | 54 | 65 | 68 | 75 | 86 | 96 | |
| Middle | 439 | 8 | 11 | 29 | 43 | 50 | 58 | 61 | 68 | 75 | 90 | 97 | ||
| High | 80 | 15 | 22 | 36 | 50 | 56 | 58 | 65 | 68 | 79 | 83 | 86 | ||
| Male | Healthy | Low | 270 | 25 | 33 | 47 | 54 | 65 | 68 | 75 | 75 | 86 | 100 | 100 |
| Middle | 576 | 27 | 36 | 50 | 61 | 68 | 72 | 75 | 75 | 86 | 100 | 100 | ||
| High | 100 | 25 | 29 | 50 | 64 | 68 | 72 | 75 | 75 | 86 | 100 | 100 | ||
| At least one CHC | Low | 224 | 17 | 25 | 40 | 50 | 58 | 65 | 68 | 72 | 77 | 90 | 98 | |
| Middle | 385 | 11 | 22 | 34 | 47 | 54 | 61 | 65 | 72 | 79 | 89 | 93 | ||
| High | 94 | 6 | 14 | 32 | 43 | 50 | 54 | 65 | 68 | 79 | 93 | 96 | ||
| Sex × Health Status × Age | Low HRQoL | −1 SD | MD | +1 SD | High HRQoL | |||||||||
|---|---|---|---|---|---|---|---|---|---|---|---|---|---|---|
| Sex | Health Status | Age | N | 2.5% | 5% | 16% | 30% | 40% | 50% | 60% | 70% | 85% | 95% | 97.25% |
| Female | Healthy | 18–24 | 82 | 33 | 43 | 50 | 54 | 65 | 68 | 72 | 75 | 86 | 100 | 100 |
| 25–34 | 159 | 25 | 33 | 48 | 58 | 68 | 72 | 75 | 83 | 93 | 100 | 100 | ||
| 35–44 | 201 | 36 | 40 | 50 | 61 | 72 | 75 | 79 | 86 | 97 | 100 | 100 | ||
| 45–54 | 167 | 40 | 48 | 58 | 68 | 73 | 75 | 83 | 86 | 100 | 100 | 100 | ||
| 55–64 | 136 | 38 | 40 | 56 | 68 | 75 | 75 | 83 | 86 | 93 | 100 | 100 | ||
| ≥65 | 89 | 48 | 52 | 68 | 75 | 79 | 86 | 90 | 93 | 100 | 100 | 100 | ||
| At least one CHC | 18–24 | 63 | 12 | 18 | 40 | 50 | 50 | 58 | 61 | 68 | 82 | 93 | 95 | |
| 25–34 | 125 | 8 | 16 | 33 | 47 | 54 | 61 | 70 | 75 | 84 | 97 | 100 | ||
| 35–44 | 161 | 15 | 22 | 40 | 50 | 61 | 68 | 75 | 75 | 86 | 97 | 100 | ||
| 45–54 | 173 | 12 | 25 | 43 | 54 | 61 | 68 | 72 | 79 | 86 | 98 | 100 | ||
| 55–64 | 169 | 12 | 27 | 50 | 61 | 68 | 72 | 75 | 79 | 86 | 97 | 100 | ||
| ≥65 | 124 | 36 | 40 | 50 | 61 | 68 | 72 | 79 | 83 | 93 | 100 | 100 | ||
| Male | Healthy | 18–24 | 117 | 33 | 39 | 50 | 58 | 65 | 72 | 75 | 79 | 86 | 97 | 100 |
| 25–34 | 187 | 33 | 41 | 50 | 61 | 68 | 72 | 75 | 79 | 90 | 100 | 100 | ||
| 35–44 | 242 | 25 | 43 | 50 | 68 | 72 | 75 | 75 | 83 | 93 | 100 | 100 | ||
| 45–54 | 170 | 41 | 47 | 61 | 72 | 75 | 75 | 83 | 86 | 93 | 100 | 100 | ||
| 55–64 | 134 | 50 | 53 | 65 | 75 | 75 | 79 | 86 | 90 | 97 | 100 | 100 | ||
| ≥65 | 96 | 58 | 65 | 75 | 75 | 79 | 83 | 86 | 90 | 97 | 100 | 100 | ||
| At least one CHC | 18–24 | 48 | 19 | 24 | 43 | 51 | 54 | 68 | 75 | 75 | 90 | 97 | 100 | |
| 25–34 | 94 | 11 | 22 | 36 | 47 | 50 | 54 | 58 | 65 | 76 | 87 | 96 | ||
| 35–44 | 137 | 25 | 28 | 40 | 50 | 63 | 68 | 72 | 75 | 85 | 97 | 97 | ||
| 45–54 | 154 | 21 | 25 | 43 | 54 | 61 | 68 | 72 | 75 | 86 | 97 | 100 | ||
| 55–64 | 147 | 17 | 34 | 50 | 65 | 68 | 75 | 75 | 79 | 90 | 100 | 100 | ||
| ≥65 | 123 | 25 | 33 | 54 | 68 | 72 | 75 | 79 | 83 | 92 | 100 | 100 | ||
| Sex × Health Status × Education | Low HRQoL | −1 SD | MD | +1 SD | High HRQoL | |||||||||
| Sex | Health Status | Education | N | 2.5% | 5% | 16% | 30% | 40% | 50% | 60% | 70% | 85% | 95% | 97.25% |
| Female | Healthy | Low | 321 | 33 | 40 | 50 | 61 | 68 | 75 | 75 | 83 | 93 | 100 | 100 |
| Middle | 445 | 33 | 40 | 54 | 66 | 74 | 75 | 83 | 90 | 97 | 100 | 100 | ||
| High | 68 | 40 | 45 | 63 | 72 | 75 | 83 | 83 | 90 | 97 | 100 | 100 | ||
| At least one CHC | Low | 296 | 11 | 18 | 40 | 50 | 58 | 68 | 72 | 75 | 86 | 97 | 100 | |
| Middle | 439 | 15 | 22 | 43 | 54 | 61 | 68 | 75 | 79 | 90 | 97 | 100 | ||
| High | 80 | 18 | 36 | 50 | 58 | 68 | 72 | 79 | 83 | 90 | 100 | 100 | ||
| Male | Healthy | Low | 270 | 34 | 41 | 50 | 61 | 71 | 75 | 75 | 83 | 93 | 100 | 100 |
| Middle | 576 | 40 | 50 | 58 | 68 | 75 | 75 | 79 | 83 | 93 | 100 | 100 | ||
| High | 100 | 34 | 47 | 58 | 71 | 75 | 75 | 75 | 86 | 93 | 100 | 100 | ||
| At least one CHC | Low | 224 | 22 | 33 | 47 | 54 | 65 | 68 | 75 | 75 | 86 | 96 | 98 | |
| Middle | 385 | 18 | 25 | 43 | 54 | 65 | 68 | 75 | 75 | 86 | 97 | 100 | ||
| High | 94 | 25 | 31 | 40 | 50 | 58 | 65 | 68 | 75 | 90 | 100 | 100 | ||
| Sex × Health Status × Age | Low HRQoL | −1 SD | Md | +1 SD | High HRQoL | |||||||||
|---|---|---|---|---|---|---|---|---|---|---|---|---|---|---|
| Sex | Health Status | Age | N | 2.5% | 5% | 16% | 30% | 40% | 50% | 60% | 70% | 85% | 95% | 97.25% |
| Female | Healthy | 18–24 | 82 | 21 | 38 | 50 | 60 | 67 | 71 | 75 | 75 | 88 | 100 | 100 |
| 25–34 | 159 | 21 | 25 | 50 | 60 | 71 | 75 | 75 | 80 | 96 | 100 | 100 | ||
| 35–44 | 201 | 30 | 30 | 50 | 63 | 67 | 75 | 75 | 80 | 96 | 100 | 100 | ||
| 45–54 | 167 | 30 | 42 | 55 | 63 | 71 | 75 | 80 | 84 | 97 | 100 | 100 | ||
| 55–64 | 136 | 30 | 33 | 53 | 67 | 71 | 75 | 75 | 80 | 88 | 100 | 100 | ||
| ≥65 | 89 | 42 | 46 | 55 | 71 | 75 | 75 | 80 | 88 | 92 | 100 | 100 | ||
| At least one CHC | 18–24 | 63 | 15 | 21 | 38 | 46 | 50 | 55 | 63 | 71 | 78 | 95 | 96 | |
| 25–34 | 125 | 9 | 14 | 38 | 50 | 55 | 63 | 67 | 75 | 84 | 95 | 96 | ||
| 35–44 | 161 | 13 | 21 | 42 | 55 | 63 | 67 | 71 | 75 | 88 | 96 | 100 | ||
| 45–54 | 173 | 9 | 17 | 34 | 50 | 59 | 67 | 71 | 75 | 88 | 98 | 100 | ||
| 55–64 | 169 | 18 | 25 | 42 | 55 | 59 | 67 | 75 | 78 | 88 | 96 | 100 | ||
| ≥65 | 124 | 26 | 34 | 46 | 59 | 64 | 71 | 75 | 80 | 88 | 96 | 100 | ||
| Male | Healthy | 18–24 | 117 | 21 | 30 | 50 | 55 | 63 | 67 | 75 | 75 | 84 | 97 | 100 |
| 25–34 | 187 | 20 | 25 | 46 | 59 | 63 | 71 | 75 | 75 | 84 | 96 | 100 | ||
| 35–44 | 242 | 26 | 38 | 50 | 59 | 67 | 75 | 75 | 80 | 92 | 100 | 100 | ||
| 45–54 | 170 | 25 | 30 | 50 | 63 | 71 | 75 | 75 | 81 | 92 | 100 | 100 | ||
| 55–64 | 134 | 27 | 37 | 56 | 67 | 75 | 75 | 80 | 84 | 96 | 100 | 100 | ||
| ≥65 | 96 | 38 | 48 | 63 | 71 | 75 | 75 | 75 | 84 | 92 | 100 | 100 | ||
| At least one CHC | 18–24 | 48 | 14 | 24 | 38 | 46 | 55 | 59 | 65 | 80 | 88 | 96 | 100 | |
| 25–34 | 94 | 13 | 13 | 33 | 42 | 47 | 50 | 58 | 67 | 75 | 92 | 95 | ||
| 35–44 | 137 | 5 | 16 | 37 | 54 | 59 | 67 | 71 | 75 | 80 | 89 | 96 | ||
| 45–54 | 154 | 9 | 13 | 36 | 46 | 55 | 65 | 71 | 75 | 84 | 96 | 100 | ||
| 55–64 | 147 | 25 | 30 | 50 | 59 | 67 | 71 | 75 | 75 | 88 | 96 | 100 | ||
| ≥65 | 123 | 22 | 34 | 50 | 63 | 67 | 71 | 75 | 84 | 91 | 96 | 96 | ||
| Sex × Health Status × Education | Low HRQoL | −1 SD | MD | +1 SD | High HRQoL | |||||||||
| Sex | Health Status | Education | N | 2.5% | 5% | 16% | 30% | 40% | 50% | 60% | 70% | 85% | 95% | 97.25% |
| Female | Healthy | Low | 321 | 21 | 30 | 50 | 63 | 71 | 75 | 75 | 84 | 96 | 100 | 100 |
| Middle | 445 | 26 | 34 | 50 | 63 | 71 | 75 | 75 | 80 | 96 | 100 | 100 | ||
| High | 68 | 34 | 42 | 59 | 67 | 67 | 75 | 80 | 83 | 96 | 100 | 100 | ||
| At least one CHC | Low | 296 | 13 | 17 | 42 | 53 | 59 | 67 | 71 | 75 | 88 | 96 | 100 | |
| Middle | 439 | 9 | 17 | 38 | 50 | 59 | 67 | 71 | 75 | 88 | 96 | 100 | ||
| High | 80 | 25 | 38 | 46 | 55 | 59 | 65 | 71 | 75 | 80 | 92 | 92 | ||
| Male | Healthy | Low | 270 | 25 | 30 | 50 | 59 | 71 | 75 | 75 | 84 | 92 | 100 | 100 |
| Middle | 576 | 25 | 34 | 50 | 63 | 67 | 75 | 75 | 80 | 88 | 100 | 100 | ||
| High | 100 | 17 | 34 | 54 | 63 | 67 | 75 | 75 | 75 | 84 | 100 | 100 | ||
| At least one CHC | Low | 224 | 13 | 25 | 45 | 55 | 63 | 71 | 75 | 76 | 88 | 96 | 100 | |
| Middle | 385 | 11 | 14 | 38 | 50 | 59 | 67 | 71 | 75 | 85 | 96 | 96 | ||
| High | 94 | 14 | 21 | 37 | 50 | 51 | 59 | 66 | 75 | 88 | 98 | 100 | ||
| Sex × Health Status × Age | Low HRQoL | −1 SD | Md | +1 SD | High HRQoL | |||||||||
|---|---|---|---|---|---|---|---|---|---|---|---|---|---|---|
| Sex | Health Status | Age | N | 2.5% | 5% | 16% | 30% | 40% | 50% | 60% | 70% | 85% | 95% | 97.25% |
| Female | Healthy | 18–24 | 82 | 6 | 10 | 25 | 35 | 42 | 50 | 50 | 60 | 75 | 95 | 100 |
| 25–34 | 159 | 5 | 10 | 25 | 35 | 45 | 50 | 55 | 68 | 85 | 100 | 100 | ||
| 35–44 | 201 | 15 | 20 | 30 | 40 | 50 | 50 | 60 | 75 | 85 | 100 | 100 | ||
| 45–54 | 167 | 10 | 15 | 30 | 40 | 50 | 60 | 70 | 80 | 95 | 100 | 100 | ||
| 55–64 | 136 | 25 | 25 | 35 | 50 | 55 | 65 | 75 | 85 | 95 | 100 | 100 | ||
| ≥65 | 89 | 20 | 25 | 40 | 50 | 60 | 75 | 80 | 90 | 100 | 100 | 100 | ||
| At least one CHC | 18–24 | 63 | 0 | 0 | 15 | 23 | 30 | 35 | 36 | 45 | 54 | 80 | 95 | |
| 25–34 | 125 | 0 | 2 | 20 | 25 | 30 | 35 | 45 | 50 | 65 | 85 | 90 | ||
| 35–44 | 161 | 0 | 5 | 20 | 30 | 35 | 45 | 50 | 60 | 75 | 90 | 100 | ||
| 45–54 | 173 | 0 | 5 | 25 | 34 | 40 | 45 | 55 | 65 | 81 | 95 | 100 | ||
| 55–64 | 169 | 10 | 10 | 25 | 35 | 45 | 50 | 60 | 70 | 85 | 95 | 99 | ||
| ≥65 | 124 | 15 | 16 | 30 | 45 | 55 | 65 | 74 | 80 | 90 | 100 | 100 | ||
| Male | Healthy | 18–24 | 117 | 10 | 10 | 25 | 35 | 45 | 45 | 50 | 60 | 78 | 95 | 100 |
| 25–34 | 187 | 10 | 15 | 30 | 40 | 45 | 50 | 60 | 66 | 85 | 100 | 100 | ||
| 35–44 | 242 | 20 | 25 | 30 | 45 | 50 | 60 | 70 | 75 | 90 | 100 | 100 | ||
| 45–54 | 170 | 20 | 25 | 35 | 45 | 50 | 60 | 70 | 80 | 90 | 100 | 100 | ||
| 55–64 | 134 | 17 | 25 | 35 | 50 | 65 | 70 | 79 | 90 | 100 | 100 | 100 | ||
| ≥65 | 96 | 22 | 30 | 42 | 63 | 70 | 78 | 80 | 85 | 95 | 100 | 100 | ||
| At least one CHC | 18–24 | 48 | 10 | 10 | 25 | 30 | 35 | 40 | 50 | 55 | 60 | 84 | 90 | |
| 25–34 | 94 | 0 | 10 | 25 | 35 | 40 | 50 | 50 | 55 | 65 | 84 | 99 | ||
| 35–44 | 137 | 8 | 15 | 25 | 35 | 45 | 50 | 53 | 60 | 75 | 100 | 100 | ||
| 45–54 | 154 | 10 | 15 | 25 | 35 | 45 | 50 | 55 | 65 | 85 | 100 | 100 | ||
| 55–64 | 147 | 17 | 25 | 35 | 45 | 50 | 60 | 65 | 75 | 81 | 95 | 100 | ||
| ≥65 | 123 | 20 | 21 | 40 | 50 | 55 | 65 | 72 | 80 | 90 | 100 | 100 | ||
| Sex × Health Status × Education | Low HRQoL | −1 SD | Md | +1 SD | High HRQoL | |||||||||
| Sex | Health Status | Education | N | 2.5% | 5% | 16% | 30% | 40% | 50% | 60% | 70% | 85% | 95% | 97.25% |
| Female | Healthy | Low | 321 | 15 | 15 | 30 | 40 | 50 | 50 | 65 | 75 | 90 | 100 | 100 |
| Middle | 445 | 10 | 15 | 30 | 40 | 50 | 55 | 65 | 75 | 90 | 100 | 100 | ||
| High | 68 | 12 | 15 | 33 | 45 | 50 | 60 | 71 | 80 | 95 | 100 | 100 | ||
| At least one CHC | Low | 296 | 0 | 0 | 20 | 30 | 40 | 45 | 50 | 65 | 80 | 95 | 100 | |
| Middle | 439 | 5 | 10 | 25 | 30 | 40 | 45 | 55 | 65 | 80 | 95 | 100 | ||
| High | 80 | 10 | 15 | 25 | 35 | 44 | 50 | 55 | 65 | 80 | 85 | 96 | ||
| Male | Healthy | Low | 270 | 14 | 18 | 35 | 50 | 50 | 60 | 70 | 75 | 95 | 100 | 100 |
| Middle | 576 | 15 | 20 | 30 | 45 | 50 | 60 | 70 | 80 | 90 | 100 | 100 | ||
| High | 100 | 10 | 20 | 30 | 40 | 45 | 50 | 67 | 72 | 90 | 100 | 100 | ||
| At least one CHC | Low | 224 | 10 | 16 | 30 | 40 | 50 | 50 | 60 | 70 | 83 | 100 | 100 | |
| Middle | 385 | 10 | 15 | 25 | 40 | 45 | 50 | 55 | 65 | 80 | 95 | 100 | ||
| High | 94 | 5 | 14 | 30 | 40 | 40 | 50 | 55 | 60 | 75 | 90 | 94 | ||
| Sex × Health Status × Age | Low HRQoL | −1 SD | Md | +1 SD | High HRQoL | |||||||||
|---|---|---|---|---|---|---|---|---|---|---|---|---|---|---|
| Sex | Health Status | Age | N | 2.5% | 5% | 16% | 30% | 40% | 50% | 60% | 70% | 85% | 95% | 97.25% |
| Female | Healthy | 18–24 | 82 | 20 | 26 | 45 | 50 | 52 | 65 | 70 | 75 | 90 | 100 | 100 |
| 25–34 | 159 | 15 | 30 | 45 | 50 | 60 | 65 | 75 | 80 | 100 | 100 | 100 | ||
| 35–44 | 201 | 25 | 25 | 45 | 50 | 60 | 70 | 75 | 85 | 95 | 100 | 100 | ||
| 45–54 | 167 | 25 | 25 | 45 | 55 | 65 | 70 | 80 | 85 | 100 | 100 | 100 | ||
| 55–64 | 136 | 22 | 29 | 40 | 58 | 65 | 75 | 80 | 85 | 90 | 100 | 100 | ||
| ≥65 | 89 | 14 | 27 | 50 | 67 | 75 | 85 | 90 | 95 | 100 | 100 | 100 | ||
| At least one CHC | 18–24 | 63 | 18 | 25 | 30 | 45 | 50 | 55 | 61 | 70 | 80 | 95 | 98 | |
| 25–34 | 125 | 5 | 15 | 25 | 40 | 50 | 50 | 60 | 70 | 80 | 94 | 100 | ||
| 35–44 | 161 | 10 | 20 | 30 | 40 | 45 | 50 | 60 | 65 | 80 | 90 | 95 | ||
| 45–54 | 173 | 5 | 10 | 30 | 40 | 45 | 50 | 62 | 70 | 80 | 98 | 100 | ||
| 55–64 | 169 | 5 | 10 | 25 | 40 | 45 | 50 | 55 | 65 | 80 | 90 | 99 | ||
| ≥65 | 124 | 20 | 25 | 34 | 45 | 52 | 60 | 69 | 80 | 85 | 90 | 95 | ||
| Male | Healthy | 18–24 | 117 | 15 | 25 | 40 | 50 | 55 | 65 | 70 | 75 | 88 | 95 | 100 |
| 25–34 | 187 | 25 | 30 | 40 | 50 | 55 | 65 | 75 | 85 | 100 | 100 | 100 | ||
| 35–44 | 242 | 25 | 30 | 45 | 55 | 60 | 70 | 75 | 85 | 100 | 100 | 100 | ||
| 45–54 | 170 | 25 | 30 | 45 | 59 | 65 | 70 | 80 | 90 | 100 | 100 | 100 | ||
| 55–64 | 134 | 30 | 40 | 52 | 70 | 75 | 80 | 80 | 90 | 100 | 100 | 100 | ||
| ≥65 | 96 | 24 | 30 | 52 | 73 | 75 | 80 | 85 | 90 | 100 | 100 | 100 | ||
| At least one CHC | 18–24 | 48 | 30 | 30 | 40 | 46 | 55 | 65 | 70 | 75 | 80 | 94 | 95 | |
| 25–34 | 94 | 20 | 24 | 40 | 50 | 50 | 60 | 65 | 75 | 80 | 100 | 100 | ||
| 35–44 | 137 | 20 | 25 | 35 | 50 | 50 | 55 | 60 | 70 | 85 | 100 | 100 | ||
| 45–54 | 154 | 10 | 15 | 35 | 45 | 50 | 55 | 65 | 70 | 80 | 92 | 100 | ||
| 55–64 | 147 | 19 | 20 | 35 | 45 | 50 | 60 | 65 | 70 | 80 | 90 | 95 | ||
| ≥65 | 123 | 16 | 20 | 40 | 50 | 55 | 60 | 65 | 75 | 85 | 90 | 95 | ||
| Sex × Health Status × Education | Low HRQoL | −1 SD | Md | +1 SD | High HRQoL | |||||||||
| Sex | Health Status | Education | N | 2.5% | 5% | 16% | 30% | 40% | 50% | 60% | 70% | 85% | 95% | 97.25% |
| Female | Healthy | Low | 321 | 20 | 25 | 40 | 50 | 60 | 65 | 75 | 80 | 90 | 100 | 100 |
| Middle | 445 | 15 | 25 | 45 | 55 | 65 | 75 | 80 | 85 | 100 | 100 | 100 | ||
| High | 68 | 25 | 35 | 45 | 60 | 70 | 73 | 80 | 85 | 100 | 100 | 100 | ||
| At least one CHC | Low | 296 | 5 | 10 | 30 | 40 | 50 | 50 | 60 | 70 | 80 | 95 | 100 | |
| Middle | 439 | 10 | 15 | 30 | 40 | 45 | 50 | 60 | 70 | 80 | 95 | 100 | ||
| High | 80 | 10 | 20 | 35 | 44 | 50 | 60 | 65 | 70 | 80 | 86 | 91 | ||
| Male | Healthy | Low | 270 | 14 | 25 | 45 | 50 | 60 | 70 | 75 | 80 | 95 | 100 | 100 |
| Middle | 576 | 25 | 30 | 45 | 55 | 65 | 75 | 80 | 85 | 100 | 100 | 100 | ||
| High | 100 | 30 | 35 | 50 | 55 | 65 | 75 | 75 | 80 | 96 | 100 | 100 | ||
| At least one CHC | Low | 224 | 10 | 20 | 35 | 50 | 50 | 55 | 65 | 70 | 85 | 95 | 100 | |
| Middle | 385 | 15 | 20 | 35 | 45 | 50 | 60 | 65 | 75 | 80 | 90 | 100 | ||
| High | 94 | 25 | 25 | 40 | 45 | 50 | 55 | 60 | 70 | 85 | 95 | 95 | ||
References
- Maas, A.I.R.; Menon, D.K.; Adelson, P.D.; Andelic, N.; Bell, M.J.; Belli, A.; Bragge, P.; Brazinova, A.; Büki, A.; Chesnut, R.M.; et al. Traumatic Brain Injury: Integrated Approaches to Improve Prevention, Clinical Care, and Research. Lancet Neurol. 2017, 16, 987–1048. [Google Scholar] [CrossRef] [PubMed] [Green Version]
- Dewan, M.C.; Rattani, A.; Gupta, S.; Baticulon, R.E.; Hung, Y.-C.; Punchak, M.; Agrawal, A.; Adeleye, A.O.; Shrime, M.G.; Rubiano, A.M.; et al. Estimating the Global Incidence of Traumatic Brain Injury. J. Neurosurg. 2018, 130, 1080–1097. [Google Scholar] [CrossRef] [PubMed] [Green Version]
- Baldo, V.; Marcolongo, A.; Floreani, A.; Majori, S.; Cristofoletti, M.; Zotto, A.D.; Vazzoler, G.; Trivello, R. Epidemiological Aspect of Traumatic Brain Injury in Northeast Italy. Eur. J. Epidemiol. 2003, 18, 1059–1063. [Google Scholar] [CrossRef] [PubMed]
- Brazinova, A.; Rehorcikova, V.; Taylor, M.S.; Buckova, V.; Majdan, M.; Psota, M.; Peeters, W.; Feigin, V.; Theadom, A.; Holkovic, L.; et al. Epidemiology of Traumatic Brain Injury in Europe: A Living Systematic Review. J. Neurotrauma 2021, 38, 1411–1440. [Google Scholar] [CrossRef] [PubMed] [Green Version]
- Servadei, F.; Ciucci, G.; Piazza, G.; Bianchedi, G.; Rebucci, G.; Gaist, G.; Taggi, F. A Prospective Clinical and Epidemiological Study of Head Injuries in Northern Italy: The Comune of Ravenna. Ital. J. Neurol. Sci. 1988, 9, 449–457. [Google Scholar] [CrossRef]
- Langlois, J.A.; Rutland-Brown, W.; Wald, M.M. The Epidemiology and Impact of Traumatic Brain Injury: A Brief Overview. J. Head Trauma Rehabil. 2006, 21, 375–378. [Google Scholar] [CrossRef] [Green Version]
- Majdan, M.; Plancikova, D.; Brazinova, A.; Rusnak, M.; Nieboer, D.; Feigin, V.; Maas, A. Epidemiology of Traumatic Brain Injuries in Europe: A Cross-Sectional Analysis. Lancet Public Health 2016, 1, e76–e83. [Google Scholar] [CrossRef]
- Lefkovits, A.M.; Hicks, A.J.; Downing, M.; Ponsford, J. Surviving the “Silent Epidemic”: A Qualitative Exploration of the Long-Term Journey after Traumatic Brain Injury. Neuropsychol. Rehabil. 2021, 31, 1582–1606. [Google Scholar] [CrossRef]
- Antonis, T. Cognitive Consequences After Traumatic Brain Injury (TBI). Ann. Clin. Med. Case Rep. 2021, 6, 1–4. [Google Scholar]
- Weis, C.; Webb, E.K.; deRoon-Cassini, T.A.; Larson, C.L. Emotion Dysregulation Following Trauma: Shared Neurocircuitry of Traumatic Brain Injury and Trauma-Related Psychiatric Disorders. Biol. Psychiatry 2021, 91, 470–477. [Google Scholar] [CrossRef]
- Murphy, J.M.; Bennett, J.M.; de la Piedad Garcia, X.; Willis, M.L. Emotion Recognition and Traumatic Brain Injury: A Systematic Review and Meta-Analysis. Neuropsychol. Rev. 2022, 32, 520–536. [Google Scholar] [CrossRef] [PubMed]
- Villa, D.; Causer, H.; Riley, G.A. Experiences That Challenge Self-Identity Following Traumatic Brain Injury: A Meta-Synthesis of Qualitative Research. Disabil. Rehabil. 2021, 43, 3298–3314. [Google Scholar] [CrossRef] [PubMed]
- Milders, M. Relationship between Social Cognition and Social Behaviour Following Traumatic Brain Injury. Brain Inj. 2019, 33, 62–68. [Google Scholar] [CrossRef] [PubMed] [Green Version]
- Masel, B.E.; DeWitt, D.S. Traumatic Brain Injury: A Disease Process, Not an Event. J. Neurotrauma 2010, 27, 1529–1540. [Google Scholar] [CrossRef] [Green Version]
- Thyen, U. Vom Biomedizinischen Zum Biopsychosozialen Verständnis von Krankheit Und Gesundheit. In Sozialpädiatrie; Springer: Berlin/Heidelberg, Germany, 2009. [Google Scholar]
- Polinder, S. Health-Related Quality of Life after TBI: A Systematic Review of Study Design, Instruments, Measurement Propeties, and Outcome. Popul. Health Metrics 2015, 13, 4. [Google Scholar] [CrossRef] [Green Version]
- Gurková, E. Issues in the Definitions of HRQoL. Public Health Rehabil. 2011, 3, 190. [Google Scholar]
- Sherer, M.; Poritz, J.M.P.; Tulsky, D.; Kisala, P.; Leon-Novelo, L.; Ngan, E. Conceptual Structure of Health-Related Quality of Life for Persons With Traumatic Brain Injury: Confirmatory Factor Analysis of the TBI-QOL. Arch. Phys. Med. Rehabil. 2020, 101, 62–71. [Google Scholar] [CrossRef] [Green Version]
- Harfmann, E.J.; deRoon-Cassini, T.A.; McCrea, M.A.; Nader, A.M.; Nelson, L.D. Comparison of Four Quality of Life Inventories for Patients with Traumatic Brain Injuries and Orthopedic Injuries. J. Neurotrauma 2020, 37, 1408–1417. [Google Scholar] [CrossRef]
- Nichol, A.D.; Higgins, A.M.; Gabbe, B.J.; Murray, L.J.; Cooper, D.J.; Cameron, P.A. Measuring Functional and Quality of Life Outcomes Following Major Head Injury: Common Scales and Checklists. Injury 2011, 42, 281–287. [Google Scholar] [CrossRef]
- von Steinbüchel, N.; Meeuwsen, M.; Zeldovich, M.; Vester, J.C.; Maas, A.; Koskinen, S.; Covic, A. Differences in Health-Related Quality of Life after Traumatic Brain Injury between Varying Patient Groups: Sensitivity of a Disease-Specific (QOLIBRI) and a Generic (SF-36) Instrument. J. Neurotrauma 2020, 37, 1242–1254. [Google Scholar] [CrossRef]
- Winter, V.; Powell, J.H.; Greenwood, R. The Problem of Quality of Life after Traumatic Brain Injury: Conceptual and Measurement Issues. Acta Neuropsychiatr. 2005, 3, 36–47. [Google Scholar]
- Wiebe, S.; Guyatt, G.; Weaver, B.; Matijevic, S.; Sidwell, C. Comparative Responsiveness of Generic and Specific Quality-of-Life Instruments. J. Clin. Epidemiol. 2003, 56, 52–60. [Google Scholar] [CrossRef] [PubMed]
- von Steinbuechel, N.; Covic, A.; Polinder, S.; Kohlmann, T.; Cepulyte, U.; Poinstingl, H.; Backhaus, J.; Bakx, W.; Bullinger, M.; Christensen, A.-L.; et al. Assessment of Health-Related Quality of Life after TBI: Comparison of a Disease-Specific (QOLIBRI) with a Generic (SF-36) Instrument. Behav. Neurol. 2016, 2016, 1–14. [Google Scholar] [CrossRef]
- von Steinbuechel, N.; Wilson, L.; Gibbons, H.; Hawthorne, G.; Höfer, S.; Schmidt, S.; Bullinger, M.; Maas, A.; Neugebauer, E.; Powell, J.; et al. Quality of Life after Brain Injury (QOLIBRI): Scale Development and Metric Properties. J. Neurotrauma 2010, 27, 1167–1185. [Google Scholar] [CrossRef] [PubMed]
- von Steinbüchel, N.; Wilson, L.; Gibbons, H.; Hawthorne, G.; Höfer, S.; Schmidt, S.; Bullinger, M.; Maas, A.; Neugebauer, E.; Powell, J.; et al. Quality of Life after Brain Injury (QOLIBRI): Scale Validity and Correlates of Quality of Life. J. Neurotrauma 2010, 27, 1157–1165. [Google Scholar] [CrossRef] [PubMed]
- Giustini, M.; Longo, E.; Azicnuda, E.; Silvestro, D.; D’Ippolito, M.; Rigon, J.; Cedri, C.; Bivona, U.; Barba, C.; Formisano, R. Health-Related Quality of Life after Traumatic Brain Injury: Italian Validation of the QOLIBRI. Funct. Neurol. 2014, 29, 167–176. [Google Scholar]
- von Steinbuechel, N.; Real, R.G.L.; Sasse, N.; Wilson, L.; Otto, C.; Mullins, R.; Behr, R.; Deinsberger, W.; Martinez-Olivera, R.; Puschendorf, W.; et al. German Validation of Quality of Life after Brain Injury (QOLIBRI) Assessment and Associated Factors. PLoS ONE 2017, 12, e0176668. [Google Scholar] [CrossRef] [PubMed] [Green Version]
- Gopaul, R.; Wei, Z.D.; Yan, J.; Gong, F.Y.; Xiao, S.W. Clinical Study of Quality of Life of Traumatic Brain Injury Patients after Decompressive Craniectomy and Related Influencing Factors. Chin. Neurosurg. J. 2016, 2, 33. [Google Scholar] [CrossRef] [Green Version]
- Voormolen, D.C.; Zeldovich, M.; Haagsma, J.A.; Polinder, S.; Friedrich, S.; Maas, A.I.R.; Wilson, L.; Steyerberg, E.W.; Covic, A.; Andelic, N.; et al. Outcomes after Complicated and Uncomplicated Mild Traumatic Brain Injury at Three-and Six-Months Post-Injury: Results from the CENTER-TBI Study. J. Clin. Med. 2020, 9, 1525. [Google Scholar] [CrossRef]
- Siponkoski, S.; Wilson, L.; Steinbüchel, N.; Sarajuuri, J.; Koskinen, S. Quality of Life after Traumatic Brain Injury: Finnish Experience of the QOLIBRI in Residential Rehabilitation. J. Rehabil. Med. 2013, 45, 835–842. [Google Scholar] [CrossRef] [Green Version]
- Hawthorne, G.; Kaye, A.H.; Gruen, R.; Houseman, D.; Bauer, I. Traumatic Brain Injury and Quality of Life: Initial Australian Validation of the QOLIBRI. J. Clin. Neurosci. 2011, 18, 197–202. [Google Scholar] [CrossRef] [PubMed]
- Soberg, H.L.; Roe, C.; Brunborg, C.; von Steinbüchel, N.; Andelic, N. The Norwegian Version of the QOLIBRI – a Study of Metric Properties Based on a 12 Month Follow-up of Persons with Traumatic Brain Injury. Health Qual. Life Outcomes 2017, 15, 14. [Google Scholar] [CrossRef] [PubMed] [Green Version]
- Castaño-León, A.M.; Navarro-Main, B.; Gomez, P.A.; Gil, A.; Soler, M.D.; Lagares, A.; Bernabeu, M.v.; Steinbüchel, N.; Real, R.G.L. Quality of Life After Brain Injury: Psychometric Properties of the Spanish Translation of the QoLIBRI. Eval. Health Prof. 2018, 41, 456–473. [Google Scholar] [CrossRef] [PubMed]
- Steyerberg, E.W.; Wiegers, E.; Sewalt, C.; Buki, A.; Citerio, G.; De Keyser, V.; Ercole, A.; Kunzmann, K.; Lanyon, L.; Lecky, F.; et al. Case-Mix, Care Pathways, and Outcomes in Patients with Traumatic Brain Injury in CENTER-TBI: A European Prospective, Multicentre, Longitudinal, Cohort Study. Lancet Neurol. 2019, 18, 923–934. [Google Scholar] [CrossRef] [PubMed]
- Teasdale, G.; Jennett, B. Assessment of Coma and Impaired Consciousness. A Practical Scale. Lancet 1974, 2, 81–84. [Google Scholar] [CrossRef] [PubMed]
- Wilson, J.T.L.; Pettigrew, L.E.L.; Teasdale, G. Structured Interviews for the Glasgow Outcome Scale and the Extended Glasgow Outcome Scale: Guidelines for Their Use. J. Neurotrauma 1998, 15, 573–585. [Google Scholar] [CrossRef]
- The Organisation for Economic Co-Operation and Development (OECD). Available online: https://stats.oecd.org/ (accessed on 1 March 2022).
- Population by Educational Attainment Level, Sex and Age (%)—Main Indicators. Eurostat. Available online: https://Ec.Europa.Eu/Eurostat/Databrowser/View/EDAT_LFSE_03/Default/Table?Lang=en (accessed on 25 September 2020).
- Gorbunova, A.; Zeldovich, M.; Voormolen, D.C.; Krenz, U.; Polinder, S.; Haagsma, J.A.; Hagmayer, Y.; Covic, A.; Real, R.G.L.; Asendorf, T.; et al. Reference Values of the QOLIBRI from General Population Samples in the United Kingdom and The Netherlands. J. Clin. Med. 2020, 9, 2100. [Google Scholar] [CrossRef]
- RCore, Team. R Version 4.0. 3: A Language and Environment for Statistical Computing; R Foundation for Statistical Computing: Vienna, Austria, 2020. [Google Scholar]
- Rosseel, Y. Lavaan: An R Package for Structural Equation Modeling. J. Stat. Softw. 2012, 48, 1–36. [Google Scholar] [CrossRef] [Green Version]
- Jorgensen, T.D.; Pornprasertmanit, S.; Schoemann, A.M.; Rosseel, Y. SemTools: Useful Tools for Structural Equation Modeling. 2021. Available online: https://cran.r-project.org/web/packages/semTools/semTools.pdf (accessed on 1 July 2022).
- Bulmer, M.G. Principles of Statistics; Dover Publications: New York, NY, USA, 1979; ISBN 978-0-486-63760-0. [Google Scholar]
- The WHOQOL Group. Development of the World Health Organization WHOQOL-BREF Quality of Life Assessment. Psychol. Med. 1998, 28, 551–558. [Google Scholar] [CrossRef] [Green Version]
- Wu, H.; Estabrook, R. Identification of Confirmatory Factor Analysis Models of Different Levels of Invariance for Ordered Categorical Outcomes. Psychometrika 2016, 81, 1014–1045. [Google Scholar] [CrossRef] [Green Version]
- Nestvold, K.; Stavem, K. Determinants of Health-Related Quality of Life 22 Years after Hospitalization for Traumatic Brain Injury. Brain Inj. 2009, 23, 15–21. [Google Scholar] [CrossRef] [PubMed]
- Steadman-Pare, D.; Colantonio, A.; Ratcliff, G.; Chase, S.; Vernich, L. Factors Associated with Perceived Quality of Life Many Years after Traumatic Brain Injury. J. Head Trauma Rehabil. 2001, 16, 330–342. [Google Scholar] [CrossRef] [PubMed]
- Helmrich, I.R.A.R.; van Klaveren, D.; Dijkland, S.A.; Lingsma, H.F.; Polinder, S.; Wilson, L.; von Steinbuechel, N.; van der Naalt, J.; Maas, A.I.R.; Steyerberg, E.W.; et al. Development of Prognostic Models for Health-Related Quality of Life Following Traumatic Brain Injury. Qual. Life Res. 2021, 31, 451–471. [Google Scholar] [CrossRef] [PubMed]
- Michelson, H.; Bolund, C.; Brandberg, Y. Multiple Chronic Health Problems Are Negatively Associated with Health Related Quality of Life (HRQoL) Irrespective of Age. Qual. Life Res. 2000, 9, 1093–1104. [Google Scholar] [CrossRef] [PubMed]
- Megari, K. Quality of Life in Chronic Disease Patients. Heath Psychol. Res. 2013, 1, e27. [Google Scholar] [CrossRef]
- Wu, Y.-J.; Rauen, K.; Zeldovich, M.; Voormolen, D.C.; Covic, A.; Cunitz, K.; Plass, A.-M.; Polinder, S.; Haagsma, J.A.; von Steinbuechel, N. Reference Values and Psychometric Properties of the Quality of Life After Traumatic Brain Injury-Overall Scale in Italy, The Netherlands, and the United Kingdom. Value Health 2021, 24, 1319–1327. [Google Scholar] [CrossRef]
- Cronbach, L.J. Coefficient Alpha and the Internal Structure of Tests. Psychometrika 1951, 16, 297–334. [Google Scholar] [CrossRef] [Green Version]
- Hu, L.; Bentler, P.M. Cutoff Criteria for Fit Indexes in Covariance Structure Analysis: Conventional Criteria versus New Alternatives. Struct. Equ. Model. Multidiscip. J. 1999, 6, 1–55. [Google Scholar] [CrossRef]
- Mikolic, A.; Groeniger, J.O.; Zeldovich, M.; Wilson, L.; von Lennep, J.R.; van Klaveren, D. Explaining Outcome Differences between Men and Women Following Mild Traumatic Brain Injury. J. Neurotrauma 2021, 38, 3315–3331. [Google Scholar] [CrossRef]
- Bazarian, J.J.; Blyth, B.; Mookerjee, S.; He, H.; McDermott, M.P. Sex Differences in Outcome after Mild Traumatic Brain Injury. J. Neurotrauma 2010, 27, 527–539. [Google Scholar] [CrossRef] [Green Version]
- Gupte, R.; Brooks, W.; Vukas, R.; Pierce, J.; Harris, J. Sex Differences in Traumatic Brain Injury: What We Know and What We Should Know. J. Neurotrauma 2019, 36, 3063–3091. [Google Scholar] [CrossRef] [PubMed]
- König, H.-H.; Bernert, S.; Angermeyer, M.C.; Matschinger, H.; Martinez, M.; Vilagut, G.; Haro, J.M.; de Girolamo, G.; de Graaf, R.; Kovess, V.; et al. Comparison of Population Health Status in Six European Countries: Results of a Representative Survey Using the EQ-5D Questionnaire. Med. Care 2009, 47, 255–261. [Google Scholar] [CrossRef]
- Gandek, B.; Ware, J.E.; Aaronson, N.K.; Apolone, G.; Bjorner, J.B.; Brazier, J.E.; Bullinger, M.; Kaasa, S.; Leplege, A.; Prieto, L.; et al. Cross-Validation of Item Selection and Scoring for the SF-12 Health Survey in Nine Countries: Results from the IQOLA Project. J. Clin. Epidemiol. 1998, 51, 1171–1178. [Google Scholar] [CrossRef] [PubMed]
- Schmidt, S.; Debensason, D.; Mühlan, H.; Petersen, C.; Power, M.; Simeoni, M.C.; Bullinger, M. The DISABKIDS Generic Quality of Life Instrument Showed Cross-Cultural Validity. J. Clin. Epidemiol. 2006, 59, 587–598. [Google Scholar] [CrossRef] [PubMed]
- Alonso, J.; Ferrer, M.; Gandek, B.; Ware, J.E.; Aaronson, N.K.; Mosconi, P.; Rasmussen, N.K.; Bullinger, M.; Fukuhara, S.; Kaasa, S.; et al. Health-Related Quality of Life Associated with Chronic Conditions in Eight Countries: Results from the International Quality of Life Assessment (IQOLA) Project. Qual. Life Res. 2004, 13, 283–298. [Google Scholar] [CrossRef] [PubMed]
- Balestroni, G.; Bertolotti, G. EuroQol-5D (EQ-5D): An instrument for measuring quality of life. Monaldi Arch. Chest Dis. 2012, 78, 155–159. [Google Scholar] [CrossRef]
- Duke, J.; Leventhal, H.; Brownlee, S.; Leventhal, E.A. Giving Up and Replacing Activities in Response to Illness. J. Gerontol. B Psychol. Sci. Soc. Sci. 2002, 57, P367–P376. [Google Scholar] [CrossRef] [PubMed] [Green Version]
- Farace, E.; Alves, W.M. Do Women Fare Worse: A Metaanalysis of Gender Differences in Traumatic Brain Injury Outcome. J. Neurosurg. 2000, 93, 539–545. [Google Scholar] [CrossRef] [Green Version]
- Mushkudiani, N.A.; Engel, D.C.; Steyerberg, E.W.; Butcher, I.; Lu, J.; Marmarou, A.; Slieker, F.; McHugh, G.S.; Murray, G.D.; Maas, A.I.R. Prognostic Value of Demographic Characteristics in Traumatic Brain Injury: Results from The IMPACT Study. J. Neurotrauma 2007, 24, 259–269. [Google Scholar] [CrossRef]
- Cancelliere, C.; Donovan, J.; Cassidy, J.D. Is Sex an Indicator of Prognosis After Mild Traumatic Brain Injury: A Systematic Analysis of the Findings of the World Health Organization Collaborating Centre Task Force on Mild Traumatic Brain Injury and the International Collaboration on Mild Traumatic Brain Injury Prognosis. Arch. Phys. Med. Rehabil. 2016, 97, 5–18. [Google Scholar] [CrossRef] [Green Version]
- Wright, D.W.; Espinoza, T.R.; Merck, L.H.; Ratcliff, J.J.; Backster, A.; Stein, D.G. Gender Differences in Neurological Emergencies Part II: A Consensus Summary and Research Agenda on Traumatic Brain Injury. Acad. Emerg. Med. 2014, 21, 1414–1420. [Google Scholar] [CrossRef] [PubMed]
- Frost, R.B.; Farrer, T.J.; Primosch, M.; Hedges, D.W. Prevalence of Traumatic Brain Injury in the General Adult Population: A Meta-Analysis. Neuroepidemiology 2013, 40, 154–159. [Google Scholar] [CrossRef] [PubMed]
- Levin, H.S.; Temkin, N.R.; Barber, J.; Nelson, L.D.; Robertson, C.; Brennan, J.; Stein, M.B.; Yue, J.K.; Giacino, J.T.; McCrea, M.A.; et al. Association of Sex and Age With Mild Traumatic Brain Injury–Related Symptoms: A TRACK-TBI Study. JAMA Netw. Open 2021, 4, e213046. [Google Scholar] [CrossRef] [PubMed]
- Scholten, A.C.; Haagsma, J.A.; Cnossen, M.C.; Olff, M.; van Beeck, E.F.; Polinder, S. Prevalence of and Risk Factors for Anxiety and Depressive Disorders after Traumatic Brain Injury: A Systematic Review. J. Neurotrauma 2016, 33, 1969–1994. [Google Scholar] [CrossRef] [PubMed]
- Kirkness, C.J.; Burr, R.L.; Mitchell, P.H.; Newell, D.W. Is There a Sex Difference in the Course Following Traumatic Brain Injury? Biol. Res. Nurs. 2004, 5, 299–310. [Google Scholar] [CrossRef]
- Styrke, J.; Sojka, P.; Björnstig, U.; Bylund, P.; Stålnacke, B. Sex-Differences in Symptoms, Disability, and Life Satisfaction Three Years after Mild Traumatic Brain Injury: A Population-Based Cohort Study. J. Rehabil. Med. 2013, 45, 749–757. [Google Scholar] [CrossRef] [Green Version]
- Tseng, H.-Y.; Löckenhoff, C.; Lee, C.-Y.; Yu, S.-H.; Wu, I.-C.; Chang, H.-Y.; Chiu, Y.-F.; Hsiung, C.A. The Paradox of Aging and Health-Related Quality of Life in Asian Chinese: Results from the Healthy Aging Longitudinal Study in Taiwan. BMC Geriatr. 2020, 20, 91. [Google Scholar] [CrossRef]
- Kempen, G.I.J.M.; Jelicic, M.; Ormel, J. Personality, Chronic Medical Morbidity, and Health-Related Quality of Life among Older Persons. Health Psychol. 1997, 16, 539–546. [Google Scholar] [CrossRef]
- Fortin, M.; Lapointe, L.; Hudon, C.; Vanasse, A.; Ntetu, A.L.; Maltais, D. Multimorbidity and Quality of Life in Primary Care: A Systematic Review. Health Qual. Life Outcomes 2004, 2, 51. [Google Scholar] [CrossRef] [Green Version]
- Chapman, B.; Duberstein, P.; Lyness, J.M. Personality Traits, Education, and Health-Related Quality of Life Among Older Adult Primary Care Patients. J. Gerontol. Ser. B 2007, 62, 343–352. [Google Scholar] [CrossRef] [Green Version]
- Verdugo, M.A.; Fernández, M.; Gómez, L.E.; Amor, A.M.; Aza, A. Predictive Factors of Quality of Life in Acquired Brain Injury. Int. J. Clin. Health Psychol. 2019, 19, 189–197. [Google Scholar] [CrossRef] [PubMed]
- Forslund, M.V.; Roe, C.; Sigurdardottir, S.; Andelic, N. Predicting Health-Related Quality of Life 2 Years after Moderate-to-Severe Traumatic Brain Injury. Acta Neurol. Scand. 2013, 128, 220–227. [Google Scholar] [CrossRef] [PubMed]
- Mirowsky, J.; Ross, C.E. Education, Social Status, and Health; Routledge: New York, NY, USA, 2017; ISBN 978-1-351-32808-1. [Google Scholar]
- Didsbury, M.S.; Kim, S.; Medway, M.M.; Tong, A.; McTaggart, S.J.; Walker, A.M.; White, S.; Mackie, F.E.; Kara, T.; Craig, J.C.; et al. Socio-Economic Status and Quality of Life in Children with Chronic Disease: A Systematic Review. J. Paediatr. Child Health 2016, 52, 1062–1069. [Google Scholar] [CrossRef] [PubMed]
- Adler, N.E.; Boyce, T.; Chesney, M.A.; Cohen, S.; Folkman, S.; Kahn, R.L.; Syme, S.L. Socioeconomic Status and Health: The Challenge of the Gradient. Am. Psychol. 1994, 49, 15–24. [Google Scholar] [CrossRef]
- Evans, J.R.; Mathur, A. The Value of Online Surveys: A Look Back and a Look Ahead. Internet Res. 2018, 28, 854–887. [Google Scholar] [CrossRef] [Green Version]
- Hoonakker, P.; Carayon, P. Questionnaire Survey Nonresponse: A Comparison of Postal Mail and Internet Surveys. Int. J. Hum.-Comput. Interact. 2009, 25, 348–373. [Google Scholar] [CrossRef]
- Ward, M.K.; Meade, A.W.; Allred, C.M.; Pappalardo, G.; Stoughton, J.W. Careless Response and Attrition as Sources of Bias in Online Survey Assessments of Personality Traits and Performance. Comput. Hum. Behav. 2017, 76, 417–430. [Google Scholar] [CrossRef]
- Shentu, Y.; Xie, M. A Note on Dichotomization of Continuous Response Variable in the Presence of Contamination and Model Misspecification. Stat. Med. 2010, 29, 2200–2214. [Google Scholar] [CrossRef]
- Royston, P.; Altman, D.G.; Sauerbrei, W. Dichotomizing Continuous Predictors in Multiple Regression: A Bad Idea. Stat. Med. 2006, 25, 127–141. [Google Scholar] [CrossRef]


| Age (years) | Mean | SD | Range |
| 45.27 | 14.85 | 57 | |
| Group | N | % | |
| Sex | Male | 1649 | 50 |
| Female | 1649 | 50 | |
| Education level | Low | 1111 | 33.69 |
| Middle | 1845 | 55.94 | |
| High | 342 | 10.37 | |
| Number of chronic health complaints | None | 1780 | 53.98 |
| One | 948 | 28.74 | |
| Two and more | 570 | 17.28 |
| Age (years) | Mean | SD | Range |
| 50.63 | 20.75 | 75 | |
| Group | N | % | |
| Sex | Male | 176 | 68.8 |
| Female | 80 | 31.2 | |
| Education level | Low | 4 | 1.6 |
| Middle | 166 | 64.8 | |
| High | 51 | 19.9 | |
| Missing | 35 | 13.7 | |
| Mild | 182 | 71.1 | |
| TBI severity (GCS) | Moderate | 27 | 10.5 |
| Severe | 47 | 18.4 | |
| Missing | 35 | 13.7 | |
| Recovery status (GOSE) at 3 months post injury | Good recovery (7–8) | 135 | 53.7 |
| Moderate disability (5–6) | 52 | 20.3 | |
| Severe disability (2/3–4) | 69 | 27.0 |
| Mean | SD | Skewness | % in Cat. “Very” | % in Cat. “Not at All” and “Slightly” | |
|---|---|---|---|---|---|
| Cognition | |||||
| Concentrate | 3.83 | 0.93 | −0.79 | 23.4 | 8.2 |
| Expressing yourself | 3.97 | 0.91 | −0.87 | 29.6 | 6.9 |
| Memory | 3.78 | 0.92 | −0.63 | 21.3 | 8.7 |
| Plan and problem solving | 3.95 | 0.91 | −0.87 | 28.6 | 7.2 |
| Decisions | 3.96 | 0.94 | −0.87 | 30.9 | 7.1 |
| Navigate | 4.02 | 0.98 | −0.99 | 36.3 | 7.7 |
| Speed of thinking | 4.00 | 0.87 | −0.83 | 30.4 | 5.4 |
| Self | |||||
| Energy | 3.59 | 0.95 | −0.63 | 14.5 | 12.1 |
| Motivation | 3.66 | 0.99 | −0.67 | 18.8 | 12.0 |
| Self-esteem | 3.53 | 1.08 | −0.60 | 18.1 | 16.6 |
| Appearance | 3.38 | 1.07 | −0.54 | 12.1 | 19.1 |
| Achievements | 3.46 | 1.05 | −0.57 | 14.3 | 16.6 |
| Self-perception | 3.52 | 1.04 | −0.63 | 15.2 | 15.9 |
| Future | 3.17 | 1.14 | −0.39 | 10.0 | 25.0 |
| Daily Life and Autonomy | |||||
| Independence | 3.79 | 1.10 | −0.76 | 30.1 | 12.5 |
| Get out and about | 4.02 | 1.02 | −0.98 | 38.7 | 9.0 |
| Domestic activities | 4.02 | 0.97 | −0.92 | 36.2 | 7.4 |
| Run personal finances | 3.77 | 1.04 | −0.78 | 26.0 | 11.0 |
| Participation at work | 3.76 | 1.00 | −0.74 | 23.6 | 10.7 |
| Social and leisure activities | 3.47 | 1.09 | −0.51 | 17.1 | 18.5 |
| In charge of life | 3.67 | 1.04 | −0.69 | 21.6 | 12.9 |
| Social Relationships | |||||
| Affection towards others | 3.92 | 0.99 | −0.87 | 31.0 | 8.0 |
| Family | 3.86 | 1.01 | −0.89 | 28.4 | 9.8 |
| Friends | 3.69 | 1.03 | −0.75 | 21.3 | 12.8 |
| Partner | 3.71 | 1.20 | −0.82 | 29.9 | 15.6 |
| Sex life | 3.39 | 1.27 | −0.54 | 20.1 | 23.0 |
| Attitudes of others | 3.45 | 1.04 | −0.58 | 13.1 | 16.9 |
| Emotions | |||||
| Loneliness | 3.48 | 1.24 | −0.24 | 6.1 | 48.2 |
| Boredom | 3.22 | 1.25 | −0.06 | 8.7 | 42.1 |
| Anxiety | 3.14 | 1.34 | −0.03 | 13.1 | 40.7 |
| Sadness | 3.14 | 1.38 | −0.04 | 14.3 | 41.3 |
| Anger/Aggression | 3.11 | 1.26 | 0.00 | 11.2 | 37.8 |
| Physical Problems | |||||
| Slow/clumsiness | 3.80 | 1.24 | −0.62 | 4.9 | 60.5 |
| Effects other injuries | 3.72 | 1.15 | −0.51 | 3.7 | 59.2 |
| Pain | 3.21 | 1.22 | −0.14 | 9.2 | 42.7 |
| Seeing/hearing | 3.54 | 1.24 | −0.37 | 6.1 | 53.4 |
| Effects health problems | 3.30 | 1.20 | −0.21 | 8.2 | 44.7 |
| Cronbach’s Alpha | Item-Total Correlation Range | Correlations between Subscales Scores | |||||
|---|---|---|---|---|---|---|---|
| QOLIBRI Domains | (1) | (2) | (3) | (4) | (5) | ||
| (1) Cognition | 0.91 | 0.67–0.81 | 1 | ||||
| (2) Self | 0.92 | 0.69–0.89 | 0.69 | 1 | |||
| (3) Daily Life and Autonomy | 0.90 | 0.68–0.80 | 0.77 | 0.83 | 1 | ||
| (4) Social Relationships | 0.88 | 0.71–0.79 | 0.64 | 0.76 | 0.76 | 1 | |
| (5) Emotions | 0.87 | 0.62–0.87 | 0.35 | 0.42 | 0.38 | 0.39 | 1 |
| (6) Physical Problems | 0.88 | 0.66–0.83 | 0.38 | 0.43 | 0.42 | 0.31 | 0.55 |
| Model Comparison | |||||||
|---|---|---|---|---|---|---|---|
| Model | CFI | RMSEA (90% CI) | χ2 (df) | p | Comparison between Models | ∆χ2 (∆df) | p |
| One-factor | 0.932 | 0.187 (0.186; 0.188) | 73,414 (629) | <0.001 | |||
| Two-factor | 0.972 | 0.120 (0.119; 0.122) | 30,633 (628) | <0.001 | One- vs. Two-factor | 3009.9 (1) | <0.001 |
| Six-factor | 0.994 | 0.058 (0.057; 0.059) | 7473 (614) | <0.001 | Two- vs. Six-factor | 3496.9 (14) | <0.001 |
| Model Comparison | |||||||
|---|---|---|---|---|---|---|---|
| Model | CFI | RMSEA (90% CI) | χ2 (df) | p | Comparison between (Invariance Models) | ∆χ2 (∆df) | p |
| Configural | 0.986 | 0.030 (0.028; 0.031) | 3151.63 (1228) | <0.001 | |||
| Partial | 0.988 | 0.026 (0.025; 0.028) | 2795.62 (1253) | <0.001 | configural vs. partial | 7.94 (25) | 0.999 |
| Full | 0.988 | 0.027 (0.025; 0.028) | 2918.75 (1290) | <0.001 | partial vs. full | 92.95 (37) | <0.001 |
| Predictors and Interactions | Reference Group | β | SE |
|---|---|---|---|
| Intercept | 63.30 * | 1.21 | |
| Age (25–34) | Age (18–24) | 1.58 | 1.38 |
| Age (35–44) | 4.64 * | 1.32 | |
| Age (45–54) | 7.16 * | 1.39 | |
| Age (55–64) | 9.22 * | 1.45 | |
| Age (≥65) | 12.53 * | 1.58 | |
| Sex (female) | Sex (male) | −1.04 | 0.74 |
| CHC (yes) | CHC (no) | −7.66 * | 1.91 |
| Education (middle) | Education (low) | 1.16 | 0.59 |
| Education (high) | 1.98 * | 0.97 | |
| Sex (female) × CHCs (yes) | Sex (male) × CHCs (yes) | −0.56 | 1.08 |
| Age (25–34) × CHCs (yes) | Age (18–24) × CHCs (yes) | −3.51 | 2.27 |
| Age (35–44) × CHCs (yes) | −2.12 | 2.17 | |
| Age (45–54) × CHCs (yes) | −3.44 | 2.19 | |
| Age (55–64) × CHCs (yes) | −1.91 | 2.24 | |
| Age (≥65) × CHCs (yes) | −1.37 | 2.37 |
| Sex × Health Status × Age | Low HRQoL | −1 SD | Md | +1 SD | High HRQoL | |||||||||
|---|---|---|---|---|---|---|---|---|---|---|---|---|---|---|
| Sex | Health Status | Age | N | 2.5% | 5% | 16% | 30% | 40% | 50% | 60% | 70% | 85% | 95% | 97.25% |
| Female | Healthy | 18–24 | 82 | 38 | 43 | 50 | 57 | 61 | 63 | 66 | 69 | 78 | 94 | 96 |
| 25–34 35–44 45–54 55–64 | 159 201 167 136 | 32 39 42 43 | 40 43 47 46 | 51 50 54 55 | 57 59 64 64 | 62 64 68 68 | 66 68 71 73 | 70 74 76 76 | 74 79 79 79 | 82 84 88 86 | 92 93 98 93 | 99 95 100 95 | ||
| ≥65 | 89 | 49 | 52 | 58 | 68 | 73 | 76 | 82 | 88 | 93 | 99 | 100 | ||
| At least one CHC | 18–24 | 63 | 22 | 27 | 41 | 46 | 48 | 51 | 55 | 58 | 70 | 80 | 86 | |
| 25–34 35–44 45–54 55–64 | 125 161 173 169 | 18 25 28 28 | 25 31 32 31 | 37 42 42 47 | 49 50 51 56 | 51 54 55 59 | 54 57 59 61 | 58 62 63 65 | 62 66 69 71 | 73 76 78 78 | 85 82 87 87 | 88 85 90 93 | ||
| ≥65 | 124 | 38 | 41 | 50 | 58 | 62 | 68 | 72 | 77 | 83 | 91 | 97 | ||
| Male | Healthy | 18–24 | 117 | 44 | 46 | 50 | 55 | 60 | 65 | 67 | 71 | 79 | 88 | 94 |
| 25–34 35–44 45–54 55–64 | 187 242 170 134 | 40 41 44 50 | 44 45 48 53 | 51 52 56 63 | 58 61 62 68 | 61 67 67 72 | 65 71 71 75 | 68 74 75 79 | 72 79 80 83 | 82 84 87 91 | 89 95 96 98 | 96 98 99 100 | ||
| ≥65 | 96 | 56 | 58 | 65 | 72 | 74 | 77 | 79 | 83 | 89 | 99 | 100 | ||
| At least one CHC | 18–24 | 48 | 30 | 37 | 47 | 51 | 54 | 60 | 63 | 67 | 77 | 87 | 93 | |
| 25–34 35–44 45–54 55–64 | 94 137 154 147 | 22 28 25 29 | 33 36 29 41 | 42 45 45 49 | 48 52 51 58 | 50 56 55 62 | 52 60 59 66 | 55 64 65 71 | 60 68 69 75 | 69 75 78 80 | 81 84 88 86 | 87 90 90 89 | ||
| ≥65 | 123 | 41 | 43 | 56 | 61 | 66 | 69 | 73 | 77 | 83 | 91 | 92 | ||
| Sex × Health Status × Education | Low HRQoL | −1 SD | Md | +1 SD | High HRQoL | |||||||||
| Sex | Health Status | Education | N | 2.5% | 5% | 16% | 30% | 40% | 50% | 60% | 70% | 85% | 95% | 97.25% |
| Female | Healthy | Low | 321 | 39 | 43 | 50 | 58 | 63 | 67 | 72 | 77 | 84 | 94 | 100 |
| Middle | 445 | 39 | 45 | 53 | 61 | 65 | 71 | 75 | 79 | 88 | 95 | 99 | ||
| High | 68 | 43 | 51 | 59 | 65 | 70 | 74 | 79 | 82 | 87 | 92 | 95 | ||
| At least one CHC | Low | 296 | 28 | 32 | 42 | 49 | 54 | 58 | 63 | 68 | 78 | 86 | 89 | |
| Middle | 439 | 24 | 28 | 43 | 52 | 55 | 59 | 63 | 69 | 79 | 87 | 94 | ||
| High | 80 | 38 | 39 | 48 | 55 | 57 | 62 | 65 | 72 | 78 | 84 | 85 | ||
| Male | Healthy | Low | 270 | 39 | 45 | 51 | 59 | 65 | 69 | 73 | 79 | 86 | 93 | 96 |
| Middle | 576 | 44 | 49 | 55 | 63 | 67 | 71 | 75 | 79 | 86 | 96 | 100 | ||
| High | 100 | 43 | 48 | 55 | 61 | 65 | 68 | 74 | 78 | 85 | 97 | 99 | ||
| At least one CHC | Low | 224 | 33 | 39 | 49 | 55 | 60 | 63 | 67 | 71 | 78 | 87 | 90 | |
| Middle | 385 | 27 | 34 | 46 | 52 | 57 | 61 | 67 | 70 | 79 | 87 | 92 | ||
| High | 94 | 16 | 36 | 44 | 50 | 53 | 57 | 63 | 67 | 79 | 85 | 92 | ||
| Total | 3298 | 32 | 38 | 50 | 56 | 61 | 66 | 70 | 75 | 83 | 92 | 97 | ||
Disclaimer/Publisher’s Note: The statements, opinions and data contained in all publications are solely those of the individual author(s) and contributor(s) and not of MDPI and/or the editor(s). MDPI and/or the editor(s) disclaim responsibility for any injury to people or property resulting from any ideas, methods, instructions or products referred to in the content. |
© 2023 by the authors. Licensee MDPI, Basel, Switzerland. This article is an open access article distributed under the terms and conditions of the Creative Commons Attribution (CC BY) license (https://creativecommons.org/licenses/by/4.0/).
Share and Cite
Krenz, U.; Greving, S.; Zeldovich, M.; Haagsma, J.; Polinder, S.; von Steinbüchel, N.; on behalf of the CENTER-TBI Participants and Investigators. Reference Values of the Quality of Life after Brain Injury (QOLIBRI) from a General Population Sample in Italy. J. Clin. Med. 2023, 12, 491. https://doi.org/10.3390/jcm12020491
Krenz U, Greving S, Zeldovich M, Haagsma J, Polinder S, von Steinbüchel N, on behalf of the CENTER-TBI Participants and Investigators. Reference Values of the Quality of Life after Brain Injury (QOLIBRI) from a General Population Sample in Italy. Journal of Clinical Medicine. 2023; 12(2):491. https://doi.org/10.3390/jcm12020491
Chicago/Turabian StyleKrenz, Ugne, Sven Greving, Marina Zeldovich, Juanita Haagsma, Suzanne Polinder, Nicole von Steinbüchel, and on behalf of the CENTER-TBI Participants and Investigators. 2023. "Reference Values of the Quality of Life after Brain Injury (QOLIBRI) from a General Population Sample in Italy" Journal of Clinical Medicine 12, no. 2: 491. https://doi.org/10.3390/jcm12020491