
Inter-Rater Reliability of Collateral Status Assessment Based on CT Angiography: A Retrospective Study of Middle Cerebral Artery Ischaemic Stroke
 , ,
, ,
Abstract
:1. Introduction
2. Materials and Methods
2.1. Description of the Sample
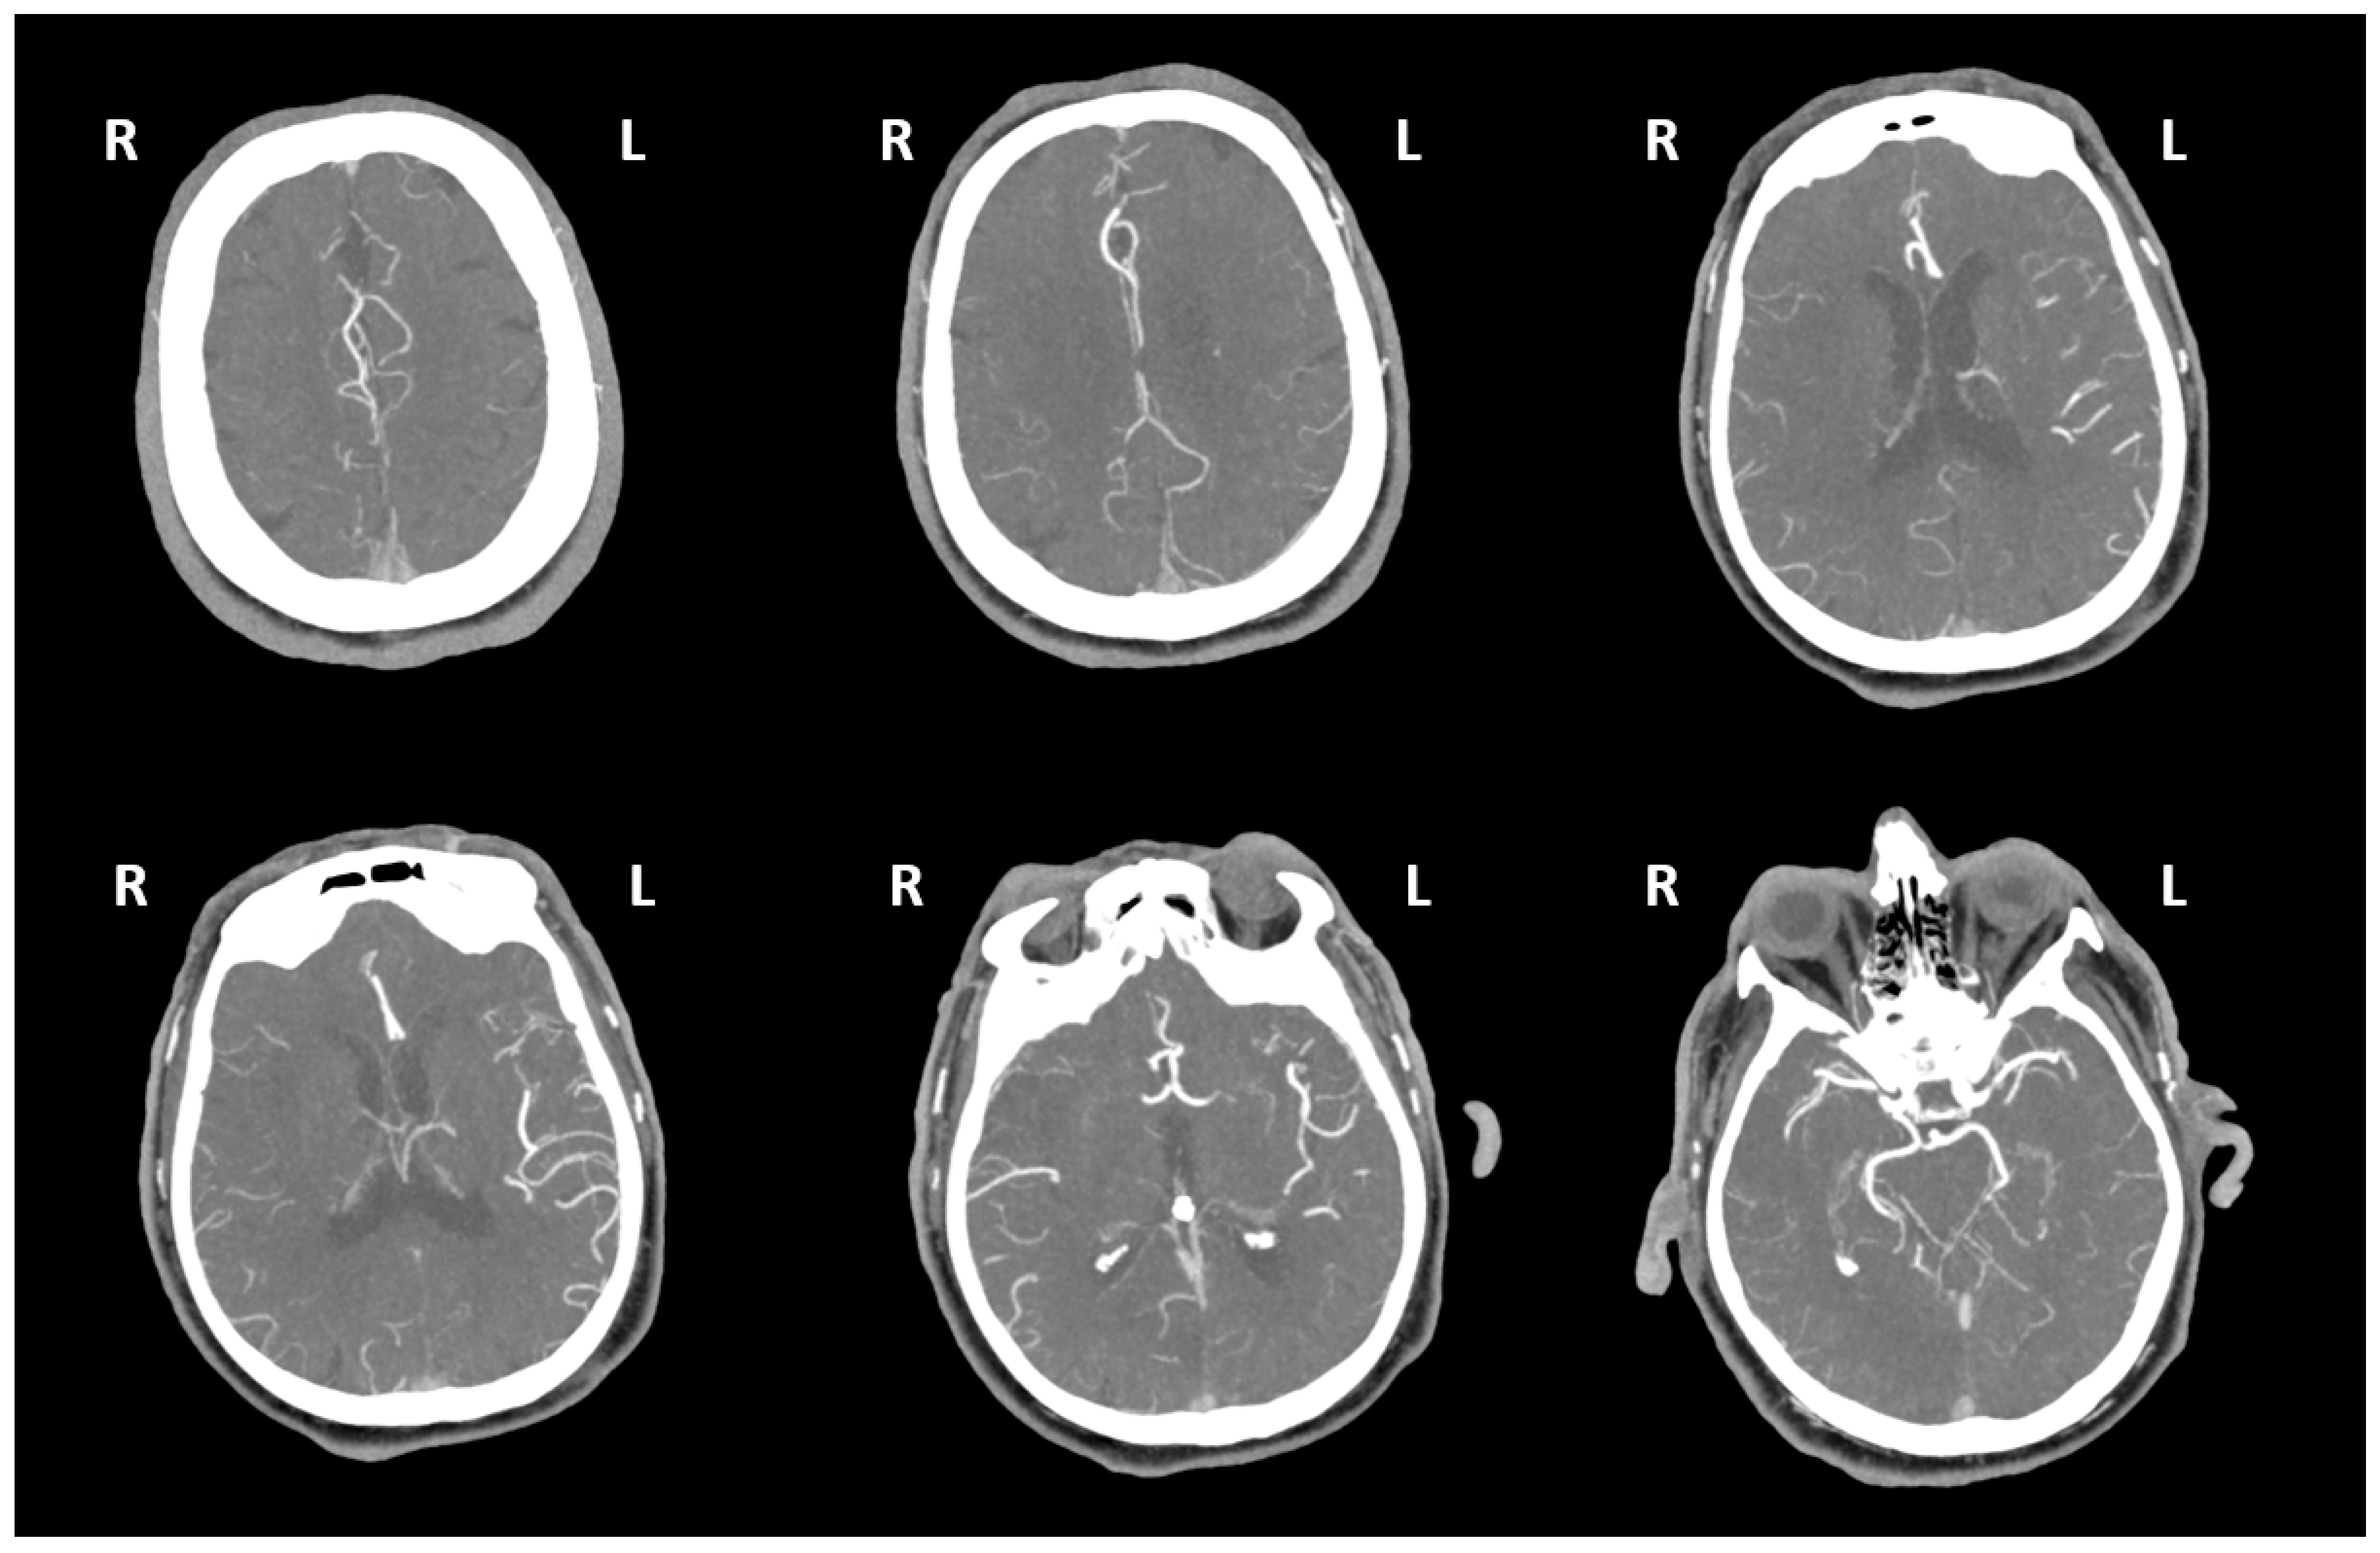
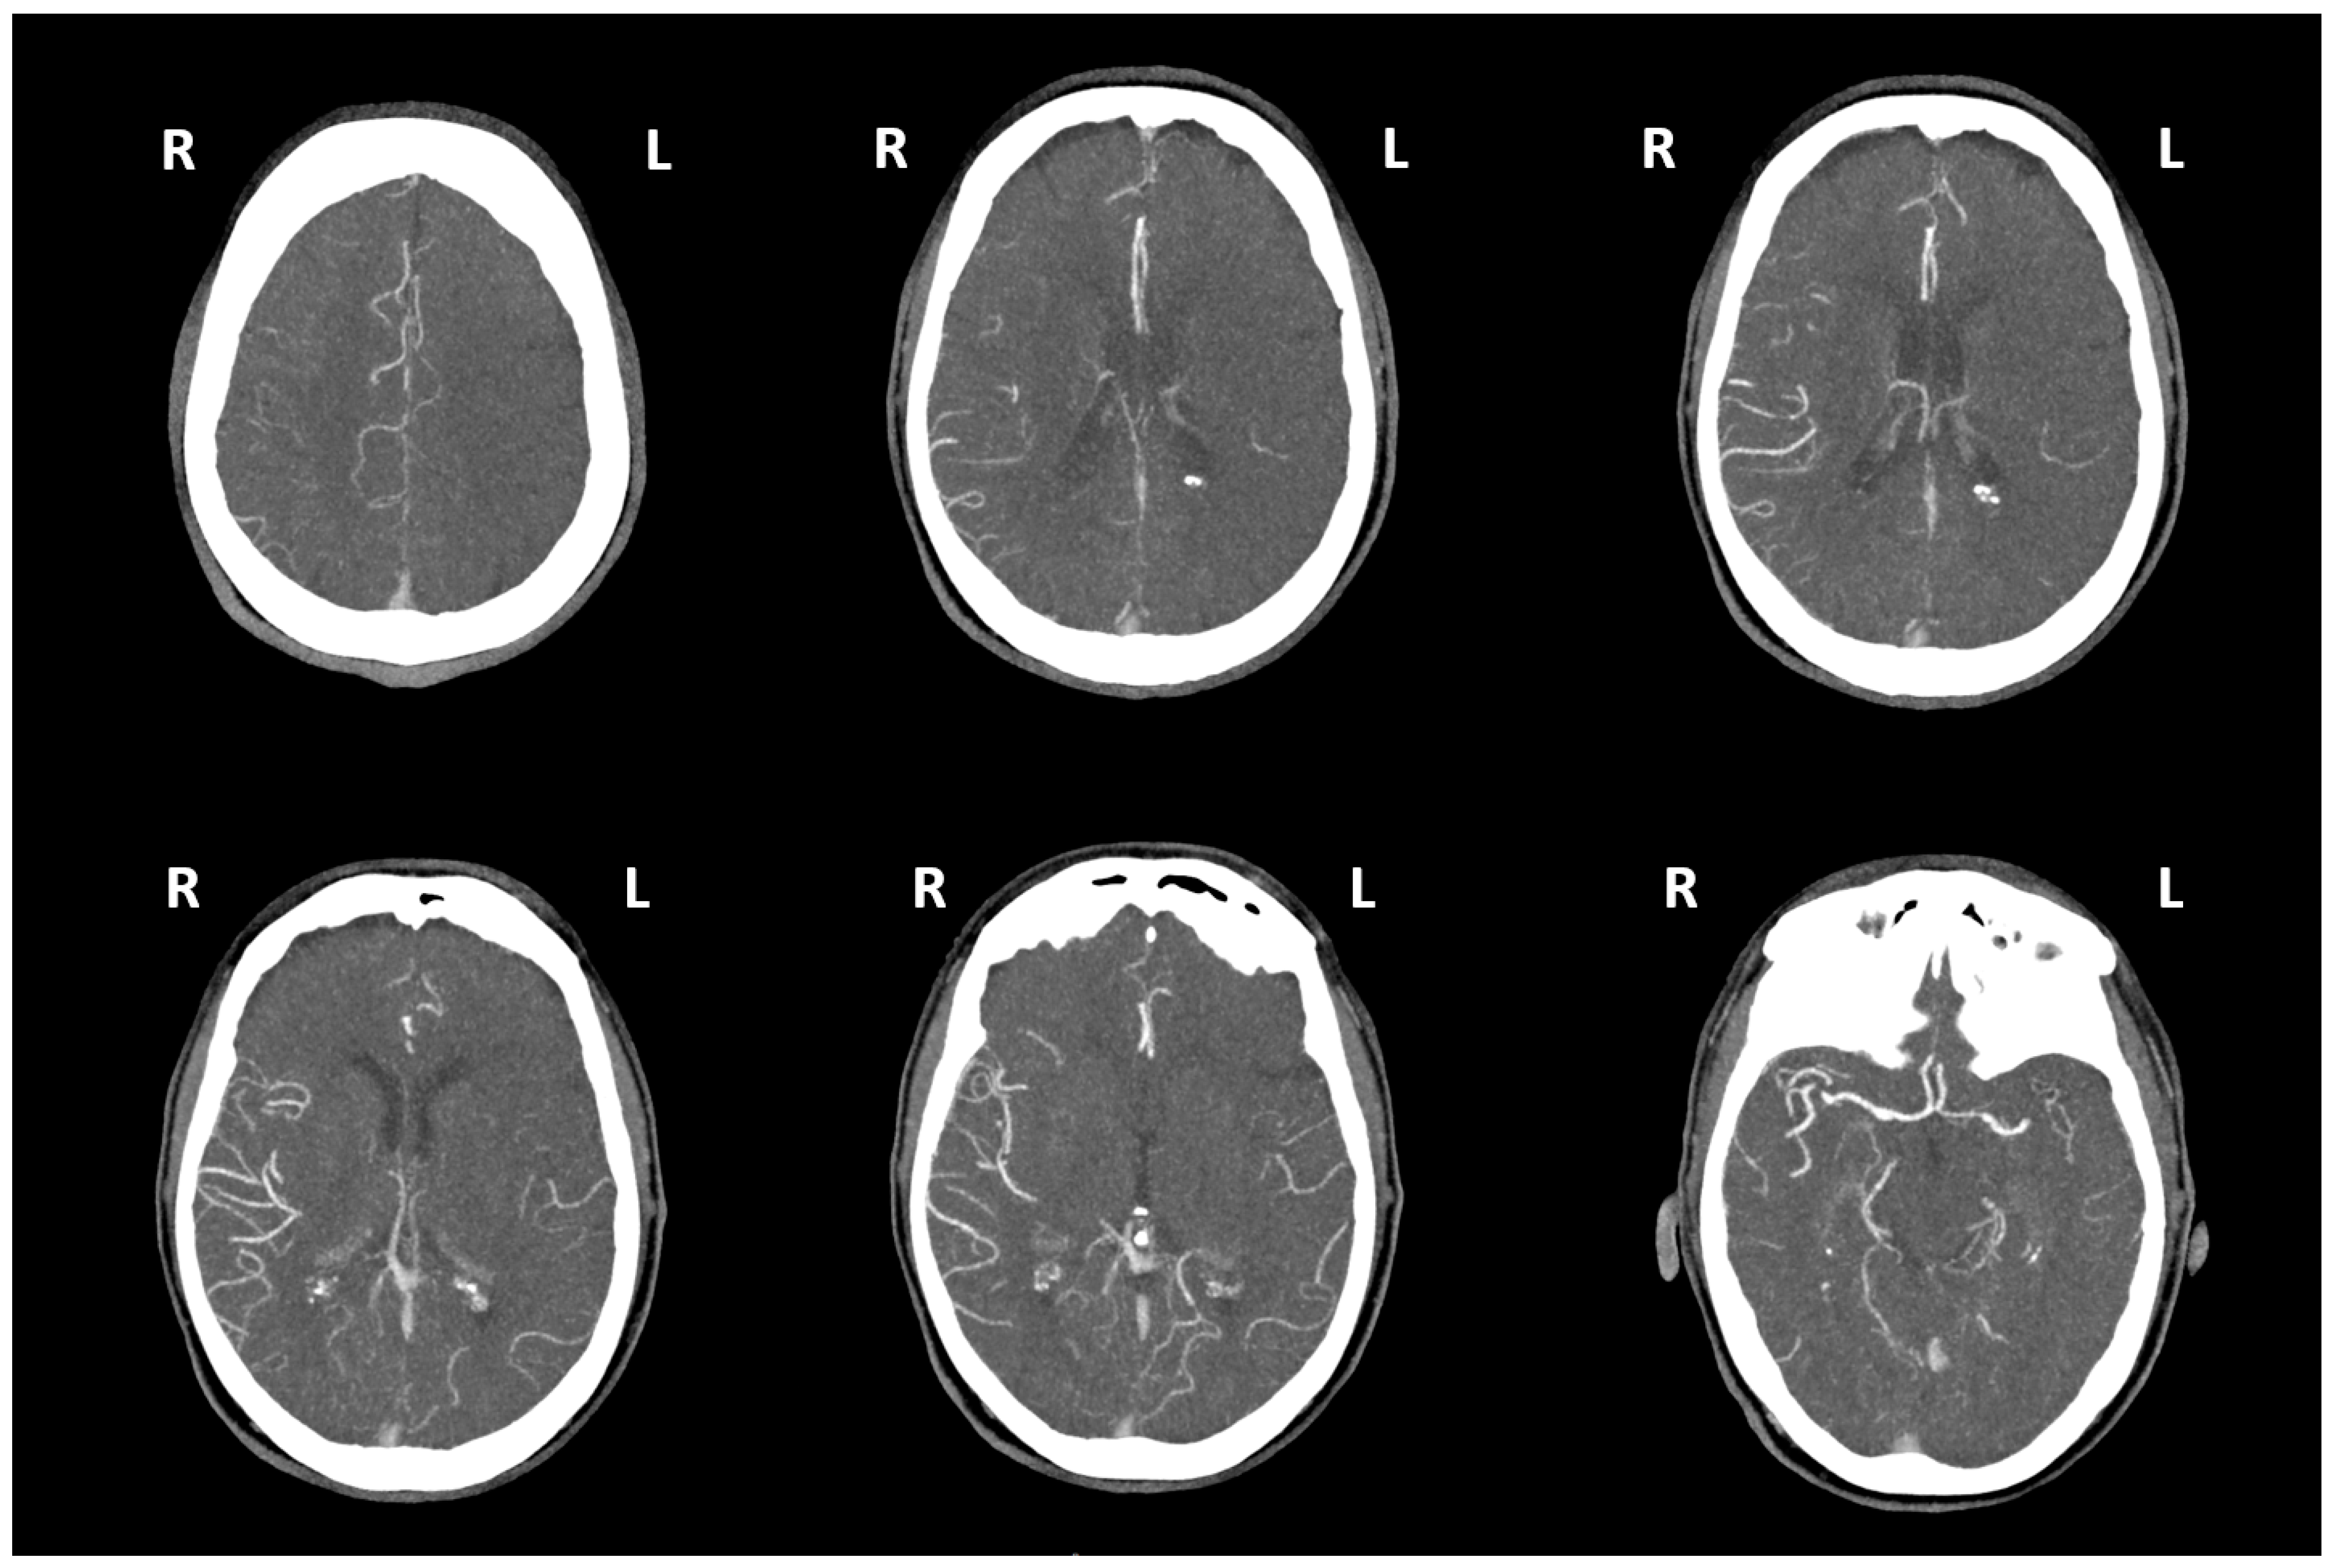
2.2. Assessment of Collateral Status with CTA Images
- (1)
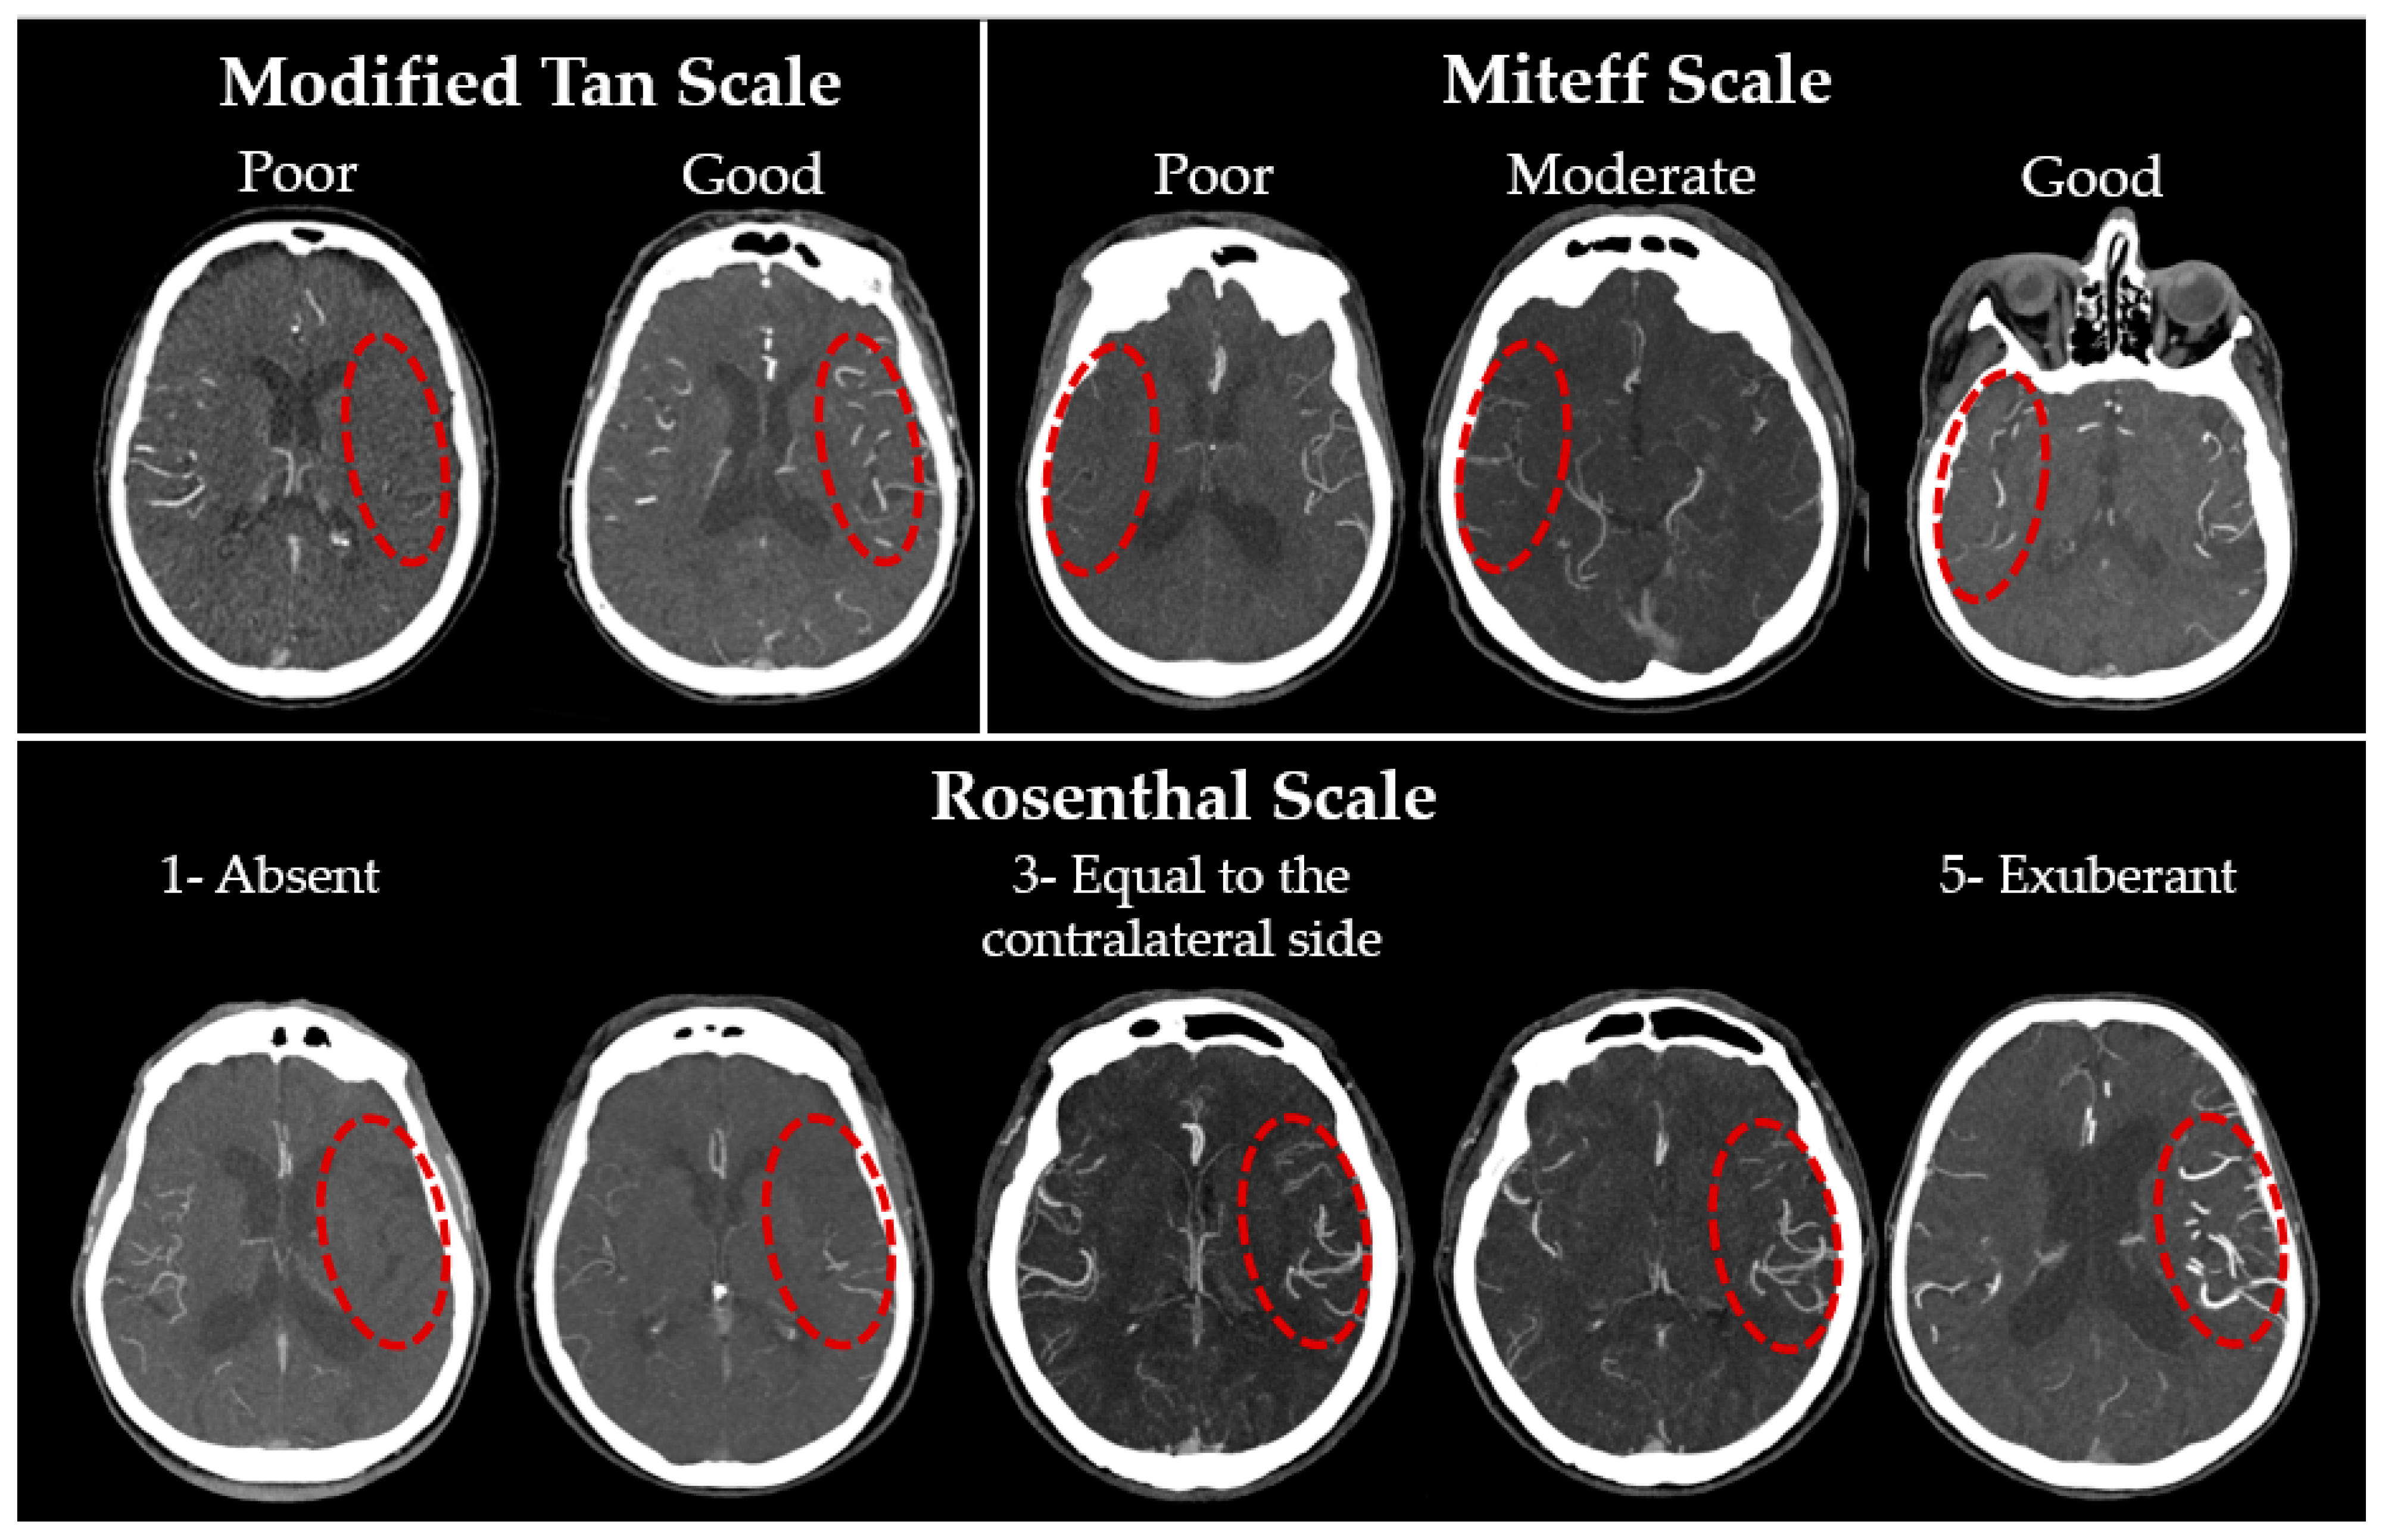
- The modified Tan scale [25] is based on the binary classification proposed in 2002 by Shramm et al. [21]. This classification is both the simplest and, according to the published works, one of the most reliable [38,39], probably due to the minimal number of grades. A ‘good’ grade is given if collaterals are seen on more than 50% of the MCA basin.
- (2)
- The Miteff scale [20]: the authors propose characterising CS on the basis of the maximum-intensity projection (MIP) according to the following three grades: poor collaterals—only distal superficial branches of the MCA are visible; moderate collaterals—in addition to superficial arteries, the branches of the MCA in the Sylvian sulcus are also visualised; good collaterals—MCA is visualised immediately after the occlusion site. Previously, this system also demonstrated a high inter-rater reliability [39].
- (3)
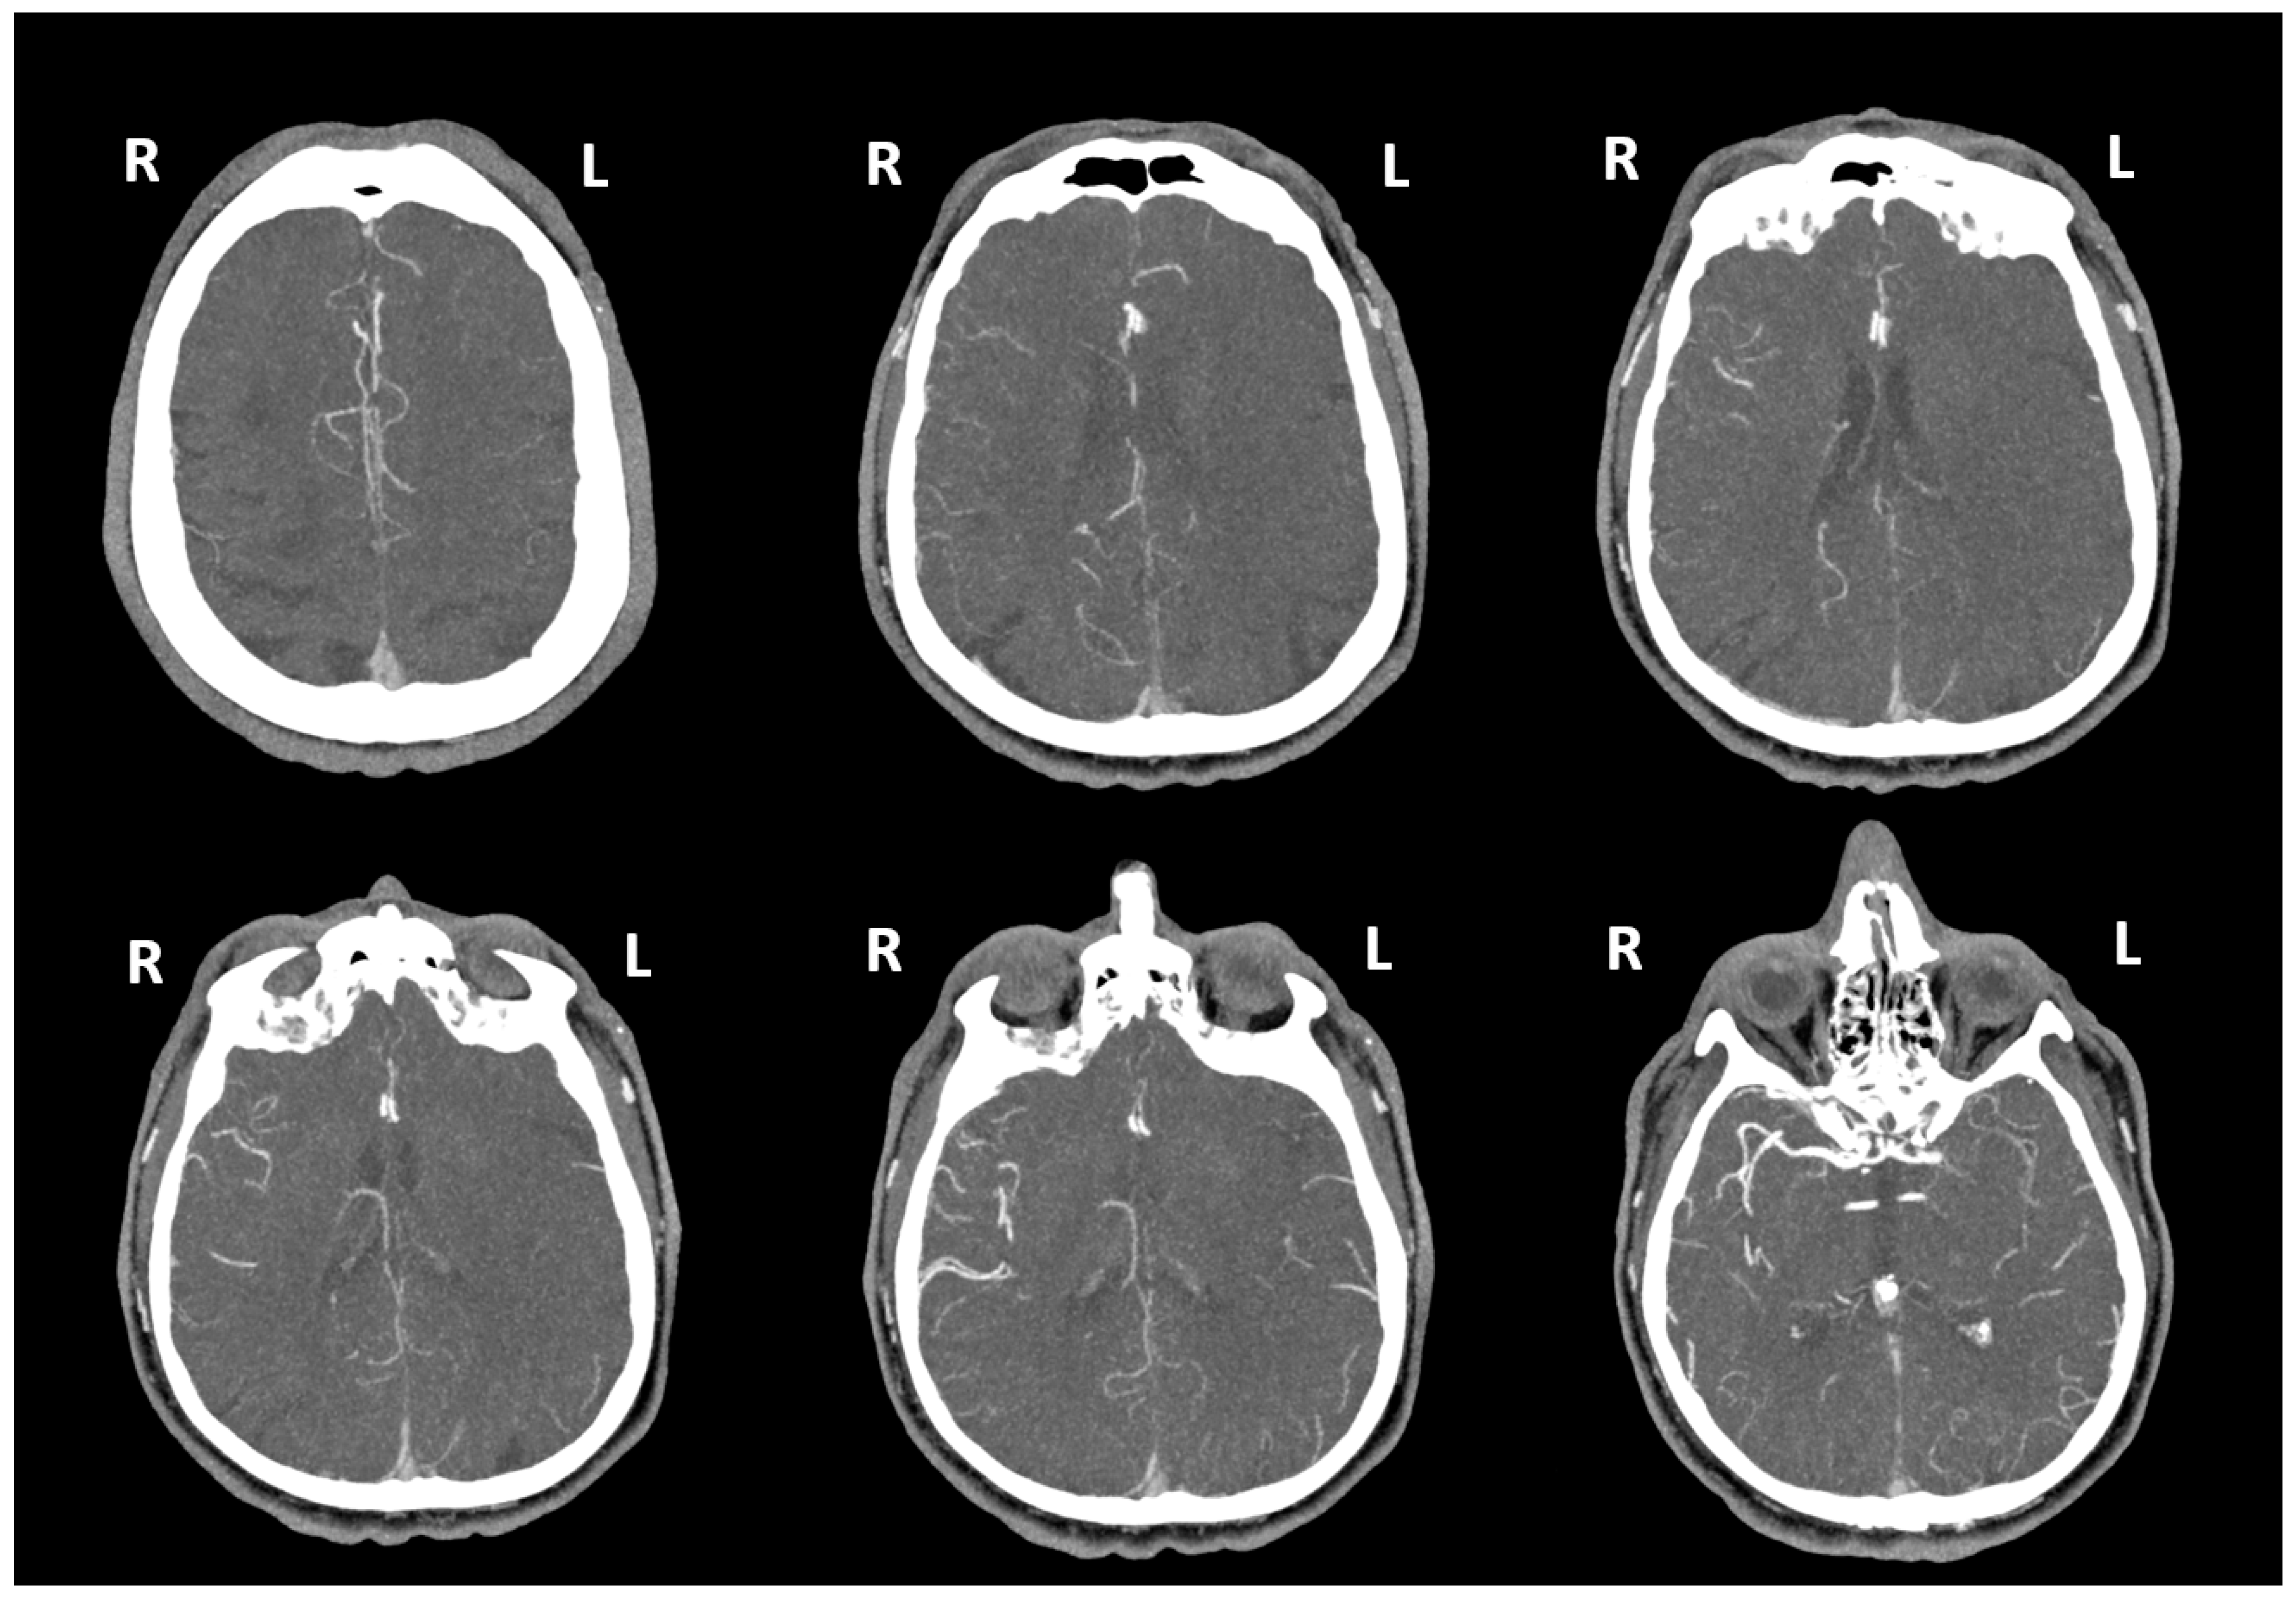
- The Rosenthal scale [27]: unlike the previous two, this classification is based on the comparison of the affected side with the intact one and includes five gradations: (1) absent vessels; (2) vessels are less than on the contralateral normal side; (3) vessels are represented to the same extent as on the intact side; (4) vessels are greater than on the contralateral normal side; (5) exuberant vessels on the affected side. The authors originally proposed using only CTA-SI, but as MIP and MPR are now firmly integrated into any workstation routine, they were also assessed. Examples of gradations for each scale are presented in Figure 1.
2.3. Methods for Assessing Inter-Rater Reliability
2.4. Statistical Processing of the Results
3. Results
4. Discussion
5. Conclusions
Author Contributions
Funding
Institutional Review Board Statement
Informed Consent Statement
Data Availability Statement
Acknowledgments
Conflicts of Interest
Appendix A

| Characteristics | Overall (n = 158) | No Reperfusion (n = 82) | Reperfusion (n = 76) | p-Value |
|---|---|---|---|---|
| Age, years, median (IQR) | 72 (63–81) p (S-W) ≪ 0.001 W = 0.965 | 72 (62–82) p (S-W) = 0.004 W = 0.953 | 71 (63–80) p (S-W) = 0.084 W = 0.971 | p (M-W) = 0.578 Z = −0.557 |
| Gender, male, n (%) | 74 (46.8%) | 37 (45.1%) | 37 (48.7%) | p (Fisher’s exact) = 0.750 |
| NIHSS score on the admission, median (IQR) | 11 (6–18) p (S-W) ≪ 0.001 W = 0.949 | 8 (4–18) p (S-W) ≪ 0.001 W = 0.894 | 14 (9–18) p (S-W) = 0.047 W = 0.967 | p (M-W) = 0.003 * Z = 2.941 |
| Time to CTA, minutes, median (IQR) | 117 (84–222) p (S-W) ≪ 0.001 W = 0.322 | 180 (101–306) p (S-W) ≪ 0.001 W = 0.424 | 95 (62–143) p (S-W) ≪ 0.001 W = 0.288 | p (M-W)≪0.001 * Z = −4.659 |
| ASPECTS score on the admission: | ||||
| No visible signs of ischaemia (ASPECTS = 10), n (%) | 130 (82.3%) | 64 (78.0%) | 33 (86.8%) | p (Fisher’s exact) = 0.211 |
| Visible signs of ischaemia (ASPECTS < 10), n (%) | 28 (17.7%) | 18 (22.0%) | 10 (13.2%) | |
| ASPECTS score, median (IQR) | 7 (6–8) p (S-W) = 0.006 W = 0.889 | 8 (7–8) p (S-W) = 0.002 W = 0.801 | 6 (6–7) p (S-W) = 0.286 W = 0.911 | p (M-W) = 0.038 * Z = −2.073 |
| IS subtypes according to the TOAST classification: | ||||
| Large-artery atherosclerosis, n (%) | 28 (17.7%) | 16 (19.5%) | 12 (15.8%) | p (Pearson’s χ2) =0.041 * χ2 = 6.394 |
| Cardioembolic, n (%) | 63 (39.9%) | 25 (30.5%) | 38 (50.0%) | |
| Stroke of undetermined aetiology, n (%) | 63 (39.9%) | 38 (46.3%) | 25 (32.9%) | |
| Stroke of other determined aetiology, n (%) | 4 (2.5%) | 3 (3.7%) | 1 (1.3%) | |
| State of major cerebral arteries: | ||||
| No visible occlusions, n (%) | 57 (36.1%) | 43 (52.4%) | 14 (18.4%) | p (Fisher’s exact) ≪ 0.001 * |
| Occlusion of the MCA, n (%) | 94 (59.5%) | 35 (42.7%) | 59 (77.6%) | |
| Occlusion only of the ICA, n (%) | 7 (4.4%) | 4 (4.9%) | 3 (3.9%) | |
| NIHSS score on the discharge, median (IQR) | 6 (2–14) p (S-W) ≪ 0.001 W = 0.848 | 5 (2–13) p (S-W) ≪ 0.001 W = 0.836 | 7 (2–16) p (S-W) ≪ 0.001 W = 0.856 | p (M-W) = 0.638 Z = 0.468 |
| Death, n (%) | 48 (30.4%) | 25 (30.5%) | 23 (30.3%) | p (Fisher’s exact) = 1.000 |
| Scale Name | No Reperfusion Therapy | Reperfusion Therapy | ||||
|---|---|---|---|---|---|---|
| Poor Collaterals | Good Collaterals | M-W Test | Poor Collaterals | Good Collaterals | M-W Test | |
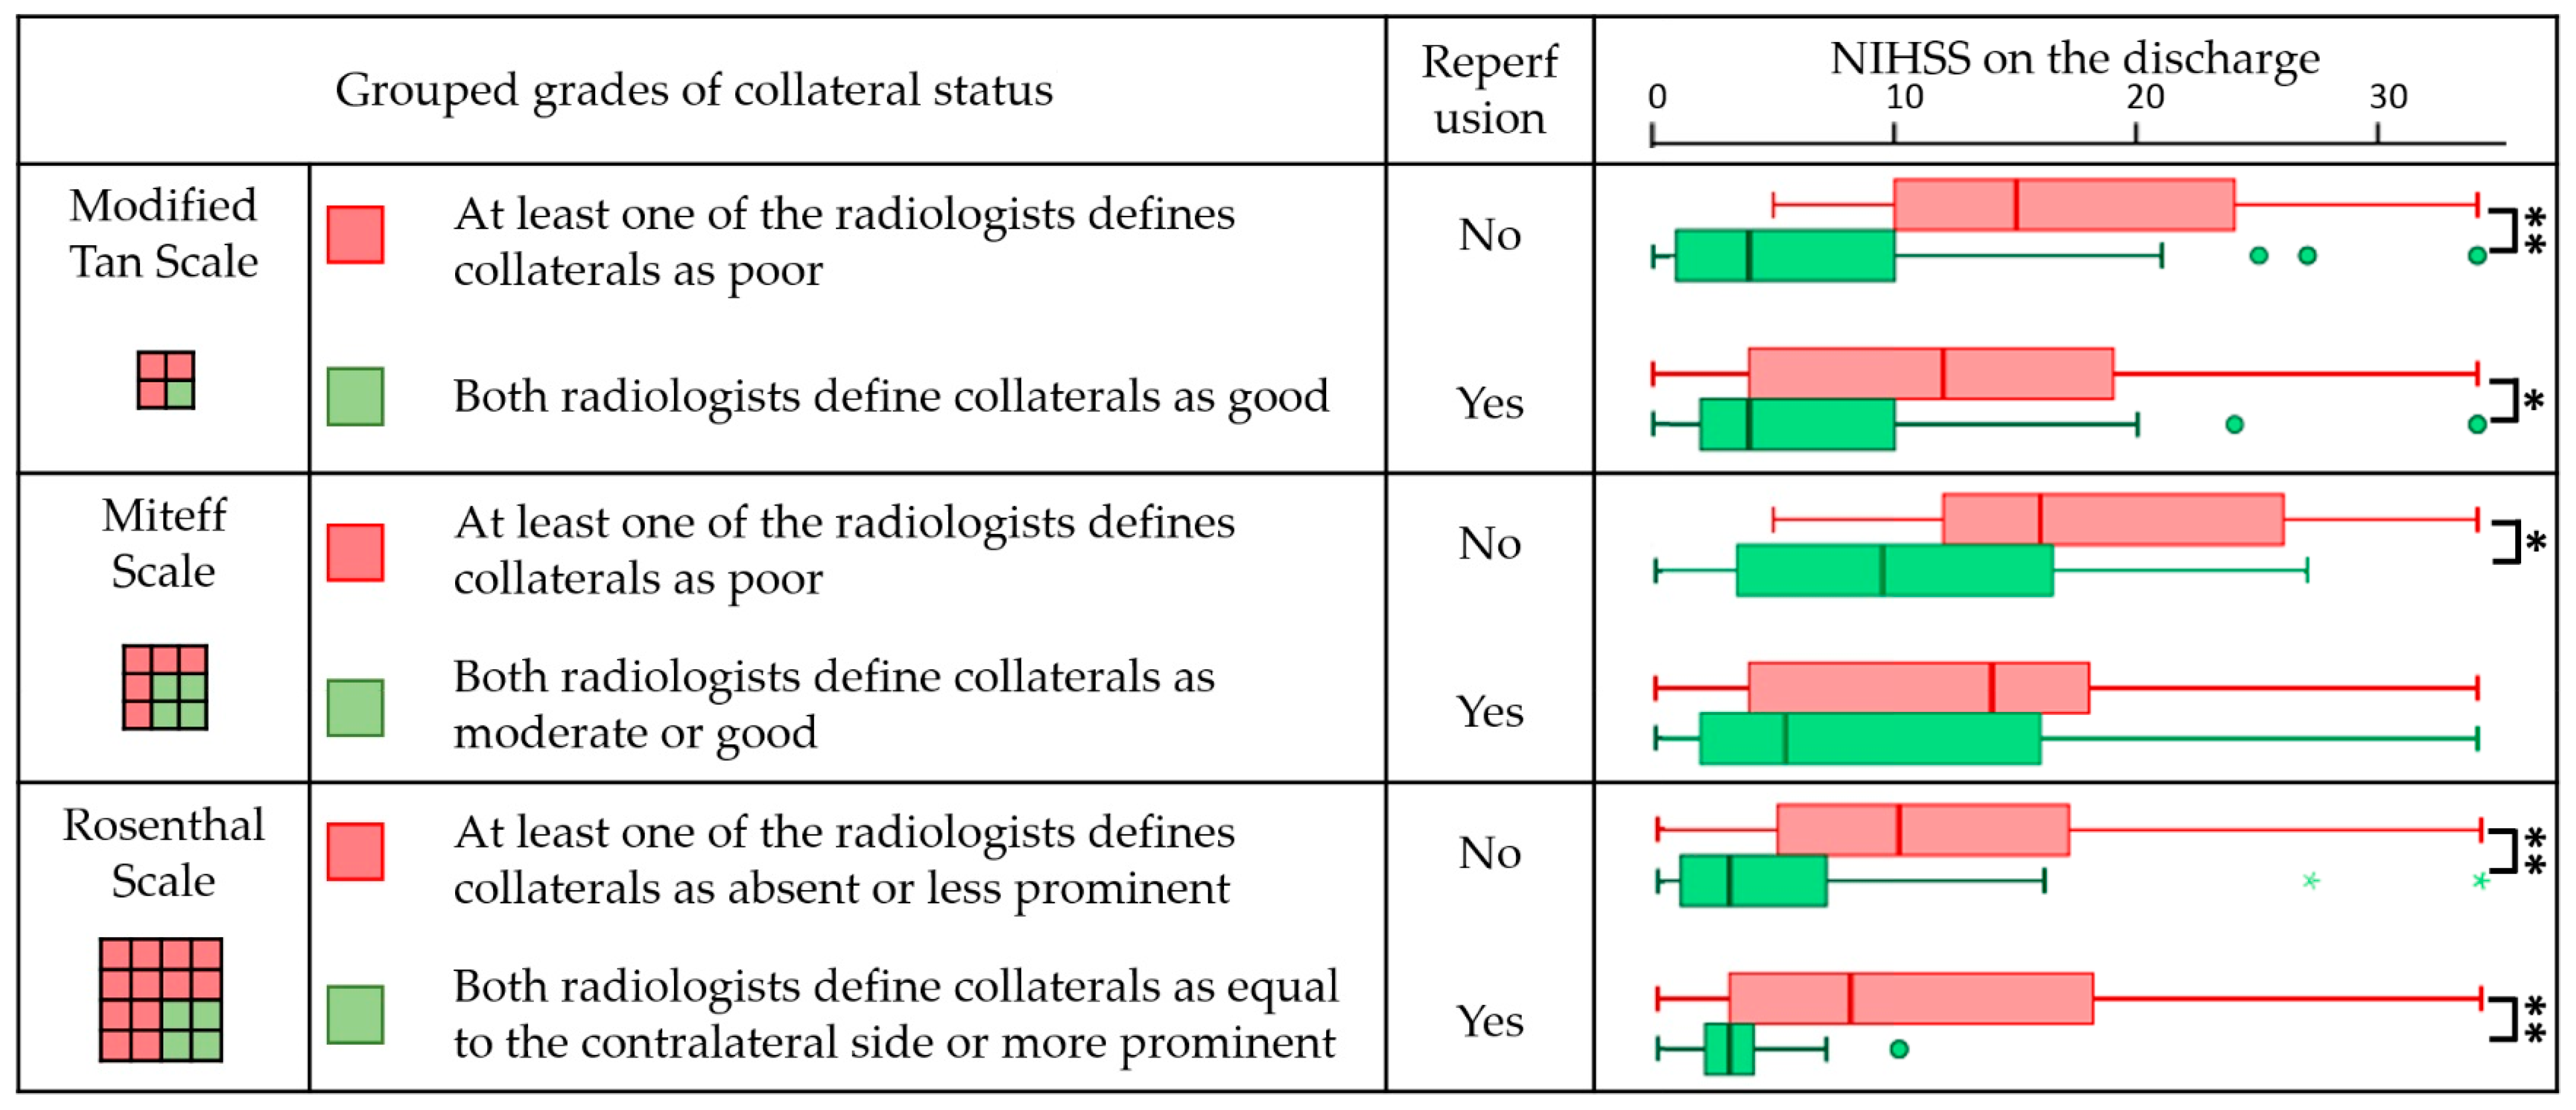
| Modified Tan scale | 15 (10–26) n = 15 p (S-W) = 0.200 W = 0.921 | 4 (1–10) n = 67 p (S-W) ≪ 0.001 W = 0.793 | p ≪ 0.001 ** Z = 3.845 | 12 (4–19) n = 34 p (S-W) = 0.021 W = 0.924 | 4 (2–10) n = 42 p (S-W) ≪ 0.001 W = 0.763 | 0.019 * Z = 2.347 |
| Miteff Scale | 16 (10–26) n = 11 p (S-W) = 0.599 W = 0.958 | 10 (3–17) n = 24 p (S-W) = 0.165 W = 0.926 | p = 0.031 * Z = 2.152 | 14 (4–19) n = 21 p (S-W) = 0.016 W = 0.924 | 6 (2–16) n = 38 p (S-W) = 0.001 W = 0.825 | 0.129 Z = 1.516 |
| Rosenthal Scale | 10 (5–18) n = 37 p (S-W) = 0.484 W = 0.961 | 3 (1–8) n = 45 p (S-W) ≪ 0.001 W = 0.749 | p = 0.001 ** Z = 3.473 | 8 (3–18) n = 57 p (S-W) = 0.005 W = 0.915 | 3 (2–4) n = 19 p (S-W) ≪ 0.001 W = 0.811 | 0.003 ** Z = 3.020 |
Appendix B


References
- Feigin, V.L.; Brainin, M.; Norrving, B.; Martins, S.; Sacco, R.L.; Hacke, W.; Fisher, M.; Pandian, J.; Lindsay, P. World Stroke Organization (WSO): Global stroke fact sheet 2022. Int. J. Stroke 2022, 17, 18–29. [Google Scholar] [CrossRef]
- Feigin, V.L.; Stark, B.A.; Johnson, C.O.; Roth, G.A.; Bisignano, C.; Abady, G.G.; Abbasifard, M.; Abbasi-Kangevari, M.; Abd-Allah, F.; Abedi, V.; et al. Global, Regional, and National Burden of Stroke and Its Risk Factors, 1990–2019: A Systematic Analysis for the Global Burden of Disease Study 2019. Lancet Neurol. 2021, 20, 795–820. [Google Scholar] [CrossRef] [PubMed]
- Tsao, C.W.; Aday, A.W.; Almarzooq, Z.I.; Alonso, A.; Beaton, A.Z.; Bittencourt, M.S.; Boehme, A.K.; Buxton, A.E.; Carson, A.P.; Commodore-Mensah, Y.; et al. Heart Disease and Stroke Statistics—2022 Update: A Report from the American Heart Association. Circulation 2022, 145, E153–E639. [Google Scholar] [CrossRef] [PubMed]
- Lv, Y.; Sun, Q.; Li, J.; Zhang, W.; He, Y.; Zhou, Y. Disability Status and Its Influencing Factors among Stroke Patients in Northeast China: A 3-Year Follow-up Study. Neuropsychiatr. Dis. Treat. 2021, 17, 2567–2573. [Google Scholar] [CrossRef]
- do Carmo, J.F.; Morelato, R.L.; Pinto, H.P.; de Oliveira, E.R.A. Disability after Stroke: A Systematic Review. Fisioter. Em Mov. 2015, 28, 407–418. [Google Scholar] [CrossRef]
- de Almeida Moraes, M.; Mussi, F.C.; Muniz, L.S.; Sampaio, E.E.S.; de Sena Leitão, T.; de Souza Teles Santos, C.A.; de Jesus, P.A.P. Clinical Characterization, Disability, and Mortality in People with Strokes during 90 Days. Rev. Bras. Enferm. 2022, 75, e20201383. [Google Scholar] [CrossRef]
- Imran, R.; Mohamed, G.A.; Nahab, F. Acute Reperfusion Therapies for Acute Ischemic Stroke. J. Clin. Med. 2021, 10, 3677. [Google Scholar] [CrossRef]
- Malhotra, K.; Liebeskind, D.S. Collaterals in Ischemic Stroke. Brain Hemorrhages 2020, 1, 6–12. [Google Scholar] [CrossRef]
- Maguida, G.; Shuaib, A. Collateral Circulation in Ischemic Stroke: An Updated Review. J. Stroke 2023, 25, 179–198. [Google Scholar] [CrossRef]
- Uniken Venema, S.M.; Wolff, L.; van den Berg, S.A.; Reinink, H.; Luijten, S.P.R.; Lingsma, H.F.; Marquering, H.A.; Boers, A.M.M.; Bot, J.; Hammer, S.; et al. Time Since Stroke Onset, Quantitative Collateral Score, and Functional Outcome after Endovascular Treatment for Acute Ischemic Stroke. Neurology 2022, 99, E1609–E1618. [Google Scholar] [CrossRef]
- Jung, S.; Wiest, R.; Gralla, J.; McKinley, R.; Mattle, H.; Liebeskind, D. Relevance of the Cerebral Collateral Circulation in Ischaemic Stroke: Time is Brain, but Collaterals Set the Pace. Swiss Med. Wkly 2017, 147, w14538. [Google Scholar] [CrossRef]
- Ravindran, A.V.; Killingsworth, M.C.; Bhaskar, S. Cerebral Collaterals in Acute Ischaemia: Implications for Acute Ischaemic Stroke Patients Receiving Reperfusion Therapy. Eur. J. Neurosci. 2020, 53, 1238–1261. [Google Scholar] [CrossRef]
- Kaloss, A.M.; Theus, M.H. Leptomeningeal Anastomoses: Mechanisms of Pial Collateral Remodeling in Ischemic Stroke. WIREs Mech. Dis. 2022, 14, e1553. [Google Scholar] [CrossRef]
- Shaban, S.; Huasen, B.; Haridas, A.; Killingsworth, M.; Worthington, J.; Jabbour, P.; Bhaskar, S.M.M. Digital Subtraction Angiography in Cerebrovascular Disease: Current Practice and Perspectives on Diagnosis, Acute Treatment and Prognosis. Acta Neurol. Belg. 2021, 122, 763–780. [Google Scholar] [CrossRef]
- Raymond, S.B.; Schaefer, P.W. Imaging Brain Collaterals. Top. Magn. Reson. Imaging 2017, 26, 67–75. [Google Scholar] [CrossRef]
- Lee, S.J.; Liu, B.; Rane, N.; Mitchell, P.; Dowling, R.; Yan, B. Correlation between CT Angiography and Digital Subtraction Angiography in Acute Ischemic Strokes. Clin. Neurol. Neurosurg. 2021, 200, 106399. [Google Scholar] [CrossRef]
- Lu, W.-Z.; Lin, H.-A.; Hou, S.-K.; Bai, C.-H.; Lin, S.-F. Diagnostic Test Accuracy of Pretreatment Collateral Score in Predicting Stroke Outcomes after Intra-Arterial Endovascular Thrombectomy: A Meta-Analysis in DSA and CTA. Eur. Radiol. 2022, 32, 6097–6107. [Google Scholar] [CrossRef]
- Jansen, I.E.; Berkhemer, O.A.; Yoo, A.J.; Vos, J.A.; Lycklama à Nijeholt, G.J.; Sprengers, M.E.S.; van Zwam, W.H.; Schonewille, W.J.; Boiten, J.; van Walderveen, M.A.A.; et al. Comparison of CTA- and DSA-Based Collateral Flow Assessment in Patients with Anterior Circulation Stroke. Am. J. Neuroradiol. 2016, 37, 2037–2042. [Google Scholar] [CrossRef]
- Kauw, F.; Dankbaar, J.W.; Martin, B.W.; Ding, V.Y.; Boothroyd, D.B.; van Ommen, F.; de Jong, H.; Kappelle, L.J.; Velthuis, B.K.; Heit, J.J.; et al. Collateral Status in Ischemic Stroke: A Comparison of Computed Tomography Angiography, Computed Tomography Perfusion, and Digital Subtraction Angiography. J. Comput. Assist. Tomogr. 2020, 44, 984–992. [Google Scholar] [CrossRef]
- Miteff, F.; Levi, C.R.; Bateman, G.A.; Spratt, N.; McElduff, P.; Parsons, M.W. The Independent Predictive Utility of Computed Tomography Angiographic Collateral Status in Acute Ischaemic Stroke. Brain 2009, 132, 2231–2238. [Google Scholar] [CrossRef]
- Schramm, P.; Schellinger, P.D.; Fiebach, J.B.; Heiland, S.; Jansen, O.; Knauth, M.; Hacke, W.; Sartor, K. Comparison of CT and CT Angiography Source Images with Diffusion-Weighted Imaging in Patients with Acute Stroke within 6 Hours after Onset. Stroke 2002, 33, 2426–2432. [Google Scholar] [CrossRef]
- Casault, C.; Al Sultan, A.S.; Trivedi, A.; Sohn, S.I.; Qazi, E.; Bokyo, M.; Almekhlafi, M.; d’Esterre, C.; Goyal, M.; Demchuk, A.M.; et al. Collateral Scoring on CT Angiogram Must Evaluate Phase and Regional Pattern. Can. J. Neurol. Sci. 2017, 44, 503–507. [Google Scholar] [CrossRef]
- Sundaram, S.; Kannoth, S.; Thomas, B.; Sarma, P.S.; Sylaja, P.N. Collateral Assessment by CT Angiography as a Predictor of Outcome in Symptomatic Cervical Internal Carotid Artery Occlusion. Am. J. Neuroradiol. 2016, 38, 52–57. [Google Scholar] [CrossRef]
- Jia, B.; Liebeskind, D.S.; Song, L.; Xu, X.; Sun, X.; Liu, L.; Wang, B.; Miao, Z. Performance of Computed Tomography Angiography to Determine Anterograde and Collateral Blood Flow Status in Patients with Symptomatic Middle Cerebral Artery Stenosis. Interv. Neuroradiol. 2017, 23, 267–273. [Google Scholar] [CrossRef]
- Tan, J.C.; Dillon, W.P.; Liu, S.; Adler, F.; Smith, W.S.; Wintermark, M. Systematic Comparison of Perfusion-CT and CT-Angiography in Acute Stroke Patients. Ann. Neurol. 2007, 61, 533–543. [Google Scholar] [CrossRef]
- Knauth, M.; von Kummer, R.; Jansen, O.; Hähnel, S.; Dörfler, A.; Sartor, K. Potential of CT Angiography in Acute Ischemic Stroke. Am. J. Neuroradiol. 1997, 18, 1001–1010. [Google Scholar]
- Rosenthal, E.; Schwamm, L.H.; Roccatagliata, L.; Coutts, S.B.; Demchuk, A.M.; Schaefer, P.W.; Gonzalez, R.G.; Hill, M.D.; Halpern, E.F.; Lev, M.H. Role of Recanalization in Acute Stroke Outcome: Rationale for a CT Angiogram-Based “Benefit of Recanalization” Model. Am. J. Neuroradiol. 2008, 29, 1471–1475. [Google Scholar] [CrossRef]
- Maas, M.B.; Lev, M.H.; Ay, H.; Singhal, A.B.; Greer, D.M.; Smith, W.S.; Harris, G.J.; Halpern, E.; Kemmling, A.; Koroshetz, W.J.; et al. Collateral Vessels on CT Angiography Predict Outcome in Acute Ischemic Stroke. Stroke 2009, 40, 3001–3005. [Google Scholar] [CrossRef]
- Menon, B.K.; Smith, E.J.; Modi, J.; Patel, S.R.; Bhatia, R.S.; Watson, T.F.; Hill, M.D.; Demchuk, A.M.; Goyal, M. Regional Leptomeningeal Score on CT Angiography Predicts Clinical and Imaging Outcomes in Patients with Acute Anterior Circulation Occlusions. Am. J. Neuroradiol. 2011, 32, 1640–1645. [Google Scholar] [CrossRef]
- Yang, W.; Soomro, J.; Jansen, H.; Venkatesh, A.; Yoo, A.J.; Lopes, D.K.; Beenen, M.; Emmer, B.J.; Majoie, C.B.L.M.; Marquering, H.A. Collateral Capacity Assessment. Clin. Neuroradiol. 2023, 33, 353–359. [Google Scholar] [CrossRef]
- Dolotova, D.D.; Blagosklonova, E.R.; Ramazanov, G.R.; Arkhipov, I.V.; Petrikov, S.S.; Gavrilov, A. Evaluation of Cerebral Collateral Status Using Computed Tomography Angiography in Ischemic Stroke: Review of Manual and Automated Methods. Nejrohirurgiâ 2022, 24, 113–121. [Google Scholar] [CrossRef]
- Menon, B.K.; d’Esterre, C.D.; Qazi, E.M.; Almekhlafi, M.; Hahn, L.; Demchuk, A.M.; Goyal, M. Multiphase CT Angiography: A New Tool for the Imaging Triage of Patients with Acute Ischemic Stroke. Radiology 2015, 275, 510–520. [Google Scholar] [CrossRef]
- Powers, W.J.; Rabinstein, A.A.; Ackerson, T.; Adeoye, O.M.; Bambakidis, N.C.; Becker, K.; Biller, J.; Brown, M.; Demaerschalk, B.M.; Hoh, B.; et al. Guidelines for the Early Management of Patients with Acute Ischemic Stroke: 2019 Update to the 2018 Guidelines for the Early Management of Acute Ischemic Stroke: A Guideline for Healthcare Professionals from the American Heart Association/American Stroke Association. Stroke 2019, 50, 344–418. [Google Scholar] [CrossRef]
- Liu, L.; Ding, J.; Leng, X.; Pu, Y.; Huang, L.-A.; Xu, A.; Wong, K.S.L.; Wang, X.; Wang, Y. Guidelines for Evaluation and Management of Cerebral Collateral Circulation in Ischaemic Stroke 2017. Stroke Vasc. Neurol. 2018, 3, 117–130. [Google Scholar] [CrossRef]
- Heran, M.; Lindsay, P.; Gubitz, G.; Yu, A.; Ganesh, A.; Lund, R.; Arsenault, S.; Bickford, D.; Derbyshire, D.; Doucette, S.; et al. Canadian Stroke Best Practice Recommendations: Acute Stroke Management, 7thEdition Practice Guidelines Update, 2022. Can. J. Neurol. Sci. 2022, 1–31. [Google Scholar] [CrossRef]
- Turc, G.; Bhogal, P.; Fischer, U.; Khatri, P.; Lobotesis, K.; Mazighi, M.; Schellinger, P.D.; Toni, D.; de Vries, J.; White, P.; et al. European Stroke Organisation (ESO)—European Society for Minimally Invasive Neurological Therapy (ESMINT) Guidelines on Mechanical Thrombectomy in Acute Ischaemic StrokeEndorsed by Stroke Alliance for Europe (SAFE). Eur. Stroke J. 2019, 4, 6–12. [Google Scholar] [CrossRef]
- Russian Sociaty of Neurologists. Clinical Guidlines of the Russian Ministry of Healthcare. Ischaemic Stroke and Transient Ischaemic Attack in Adults; Russian Sociaty of Neurologists: Moscow, Russia, 2021; p. 260. [Google Scholar]
- Wolff, L.; Su, J.; Van Loon, D.; van Es, A.; van Doormaal, P.J.; Majoie, C.; van Zwam, W.; Dippel, D.; van der Lugt, A.; van Walsum, T. Inter-Rater Reliability for Assessing Intracranial Collaterals in Patients with Acute Ischemic Stroke: Comparing 29 Raters and an Artificial Intelligence-Based Software. Neuroradiology 2022, 64, 2277–2284. [Google Scholar] [CrossRef]
- Yeo, L.L.L.; Paliwal, P.; Teoh, H.L.; Seet, R.C.; Chan, B.P.; Ting, E.; Venketasubramanian, N.; Leow, W.K.; Wakerley, B.; Kusama, Y.; et al. Assessment of Intracranial Collaterals on CT Angiography in Anterior Circulation Acute Ischemic Stroke. AJNR Am. J. Neuroradiol. 2014, 36, 289–294. [Google Scholar] [CrossRef]
- Weiss, D.J.; Kraus, B.; Rubbert, C.; Jander, S.; Gliem, M.; Lee, J.-I.; Haensch, C.-A.; Turowski, B.; Caspers, J. Systematic Evaluation of Computed Tomography Angiography Collateral Scores for Estimation of Long-Term Outcome after Mechanical Thrombectomy in Acute Ischaemic Stroke. Neuroradiol. J. 2019, 32, 277–286. [Google Scholar] [CrossRef]
- Bobak, C.A.; Barr, P.J.; O’Malley, A.J. Estimation of an Inter-Rater Intra-Class Correlation Coefficient That Overcomes Common Assumption Violations in the Assessment of HRealth Measurement Scales. BMC Med. Res. Methodol. 2018, 18, 93. [Google Scholar] [CrossRef]
- Grunwald, I.Q.; Kulikovski, J.; Reith, W.; Gerry, S.; Namias, R.; Politi, M.; Papanagiotou, P.; Essig, M.; Mathur, S.; Joly, O.; et al. Collateral Automation for Triage in Stroke: Evaluating Automated Scoring of Collaterals in Acute Stroke on Computed Tomography Scans. Cerebrovasc. Dis. 2019, 47, 217–222. [Google Scholar] [CrossRef] [PubMed]
- Berkhemer, O.A.; Jansen, I.G.H.; Beumer, D.; Fransen, P.S.S.; van den Berg, L.A.; Yoo, A.J.; Lingsma, H.F.; Sprengers, M.E.S.; Jenniskens, S.F.M.; Lycklama, À.; et al. Collateral Status on Baseline Computed Tomographic Angiography and Intra-Arterial Treatment Effect in Patients with Proximal Anterior Circulation Stroke. Stroke 2016, 47, 768–776. [Google Scholar] [CrossRef] [PubMed]
- Chalos, V.; van der Ende, N.A.M.; Lingsma, H.F.; Mulder, M.J.H.L.; Venema, E.; Dijkland, S.A.; Berkhemer, O.A.; Yoo, A.J.; Broderick, J.P.; Palesch, Y.Y.; et al. National Institutes of Health Stroke Scale. Stroke 2020, 51, 282–290. [Google Scholar] [CrossRef] [PubMed]
- Cohen, J. A Coefficient of Agreement for Nominal Scales. Educ. Psychol. Meas. 1960, 20, 37–46. [Google Scholar] [CrossRef]
- Maclure, M.; Willett, W.C. Misinterpretation and Misuse of the Kappa Statistic. Am. J. Epidemiol. 1987, 126, 161–169. [Google Scholar] [CrossRef]
- Fleiss, J.L.; Levin, B.; Paik, M.C. Statistical Methods for Rates and Proportions; John Wiley & Sons: Hoboken, NJ, USA, 2003; p. 768. [Google Scholar] [CrossRef]
- Fleiss, J.L.; Cohen, J.; Everitt, B.S. Large Sample Standard Errors of Kappa and Weighted Kappa. Psychol. Bull. 1969, 72, 323–327. [Google Scholar] [CrossRef]
- Krippendorff, K. Reliability in Content Analysis: Some Common Misconceptions and Recommendations. Hum. Commun. Res. 2004, 30, 411–433. [Google Scholar] [CrossRef]
- Holm, S. A Simple Sequentially Rejective Multiple Test Procedure. Scand. J. Stat. 1979, 6, 65–70. [Google Scholar]
- MedCalc Software Ltd. Inter-Rater Agreement. Available online: https://www.medcalc.org/calc/kappa.php (accessed on 1 July 2023).
- Kim, H.S.; Lee, S.-J.; Lee, T.-K. Pretreatment Collateral Status Predicts Malignant Stroke Evolution in Patients Undergoing Endovascular Thrombectomy. J. Neurosonol. Neuroimag. 2019, 11, 84–90. [Google Scholar] [CrossRef]
- Leng, X.; Lan, L.; Liu, L.; Leung, T.F.; Yau, H. Good Collateral Circulation Predicts Favorable Outcomes in Intravenous Thrombolysis: A Systematic Review and Meta-Analysis. Eur. J. Neurol. 2016, 23, 1738–1749. [Google Scholar] [CrossRef]
- Rebchuk, A.D.; Field, T.S.; Hill, M.D.; Goyal, M.; Demchuk, A.M.; Holodinsky, J.K.; Fainardi, E.; Shankar, J.; Najm, M.; Rubiera, M.; et al. Determinants of Leptomeningeal Collateral Status Variability in Ischemic Stroke Patients. Can. J. Neurol. Sci 2022, 49, 767–773. [Google Scholar] [CrossRef] [PubMed]
- Alqahtani, S.; Alnaami, I.; Alhazzani, A.; Alahmari, F.; Wassel, Y.I.; Elsayed, E.; Abdrabou, A.; Bassiouny Mohamed, A.-A. Correlation between Pre-Treatment Collateral Status and Short-Term Functional Outcome in Patients with Mild to Moderate Stroke after Reperfusion Therapy in a Local Primary Stroke Center in the Southwestern Part of Saudi Arabia. Cureus 2023, 15, e33997. [Google Scholar] [CrossRef] [PubMed]
- Faizy, T.D.; Mlynash, M.; Kabiri, R.; Christensen, S.; Kuraitis, G.; Meyer, L.; Bechstein, M.; van Horn, N.; Lansberg, M.G.; Albers, G.W.; et al. Favourable Arterial, Tissue-Level and Venous Collaterals Correlate with Early Neurological Improvement after Successful Thrombectomy Treatment of Acute Ischaemic Stroke. J. Neurol. Neurosurg. Psychiatry 2022, 93, 701–706. [Google Scholar] [CrossRef]
- Su, J.; Wolff, L.; van Es, A.C.G.M.; van Zwam, W.; Majoie, C.; Dippel, D.W.J.; van der Lugt, A.; Niessen, W.J.; Van Walsum, T. Automatic Collateral Scoring from 3D CTA Images. IEEE Trans. Med. Imaging 2020, 39, 2190–2200. [Google Scholar] [CrossRef] [PubMed]
- Kuang, H.; Wan, W.; Wang, Y.; Wang, J.; Qiu, W. Automated Collateral Scoring on CT Angiography of Patients with Acute Ischemic Stroke Using Hybrid CNN and Transformer Network. Biomedicines 2023, 11, 243. [Google Scholar] [CrossRef] [PubMed]
- Filep, R.C.; Mărginean, L.; Stoian, A.; Bajko, Z. Diagnostic and Prognostic Computed Tomography Imaging Markers in Basilar Artery Occlusion (Review). Exp. Ther. Med. 2021, 22, 954. [Google Scholar] [CrossRef]
- Alemseged, F.; Shah, D.G.; Diomedi, M.; Sallustio, F.; Bivard, A.; Sharma, G.; Mitchell, P.J.; Dowling, R.J.; Bush, S.; Yan, B.; et al. The Basilar Artery on Computed Tomography Angiography Prognostic Score for Basilar Artery Occlusion. Stroke 2017, 48, 631–637. [Google Scholar] [CrossRef]
- van der Hoeven, E.J.; McVerry, F.; Vos, J.A.; Algra, A.; Puetz, V.; Kappelle, L.J.; Schonewille, W.J. Collateral Flow Predicts Outcome after Basilar Artery Occlusion: The Posterior Circulation Collateral Score. Int. J. Stroke 2016, 11, 768–775. [Google Scholar] [CrossRef]
- Da Ros, V.; Meschini, A.; Gandini, R.; Del Giudice, C.; Garaci, F.; Stanzione, P.; Rizzato, B.; Diomedi, M.; Simonetti, G.; Floris, R.; et al. Proposal for a Vascular Computed Tomography-Based Grading System in Posterior Circulation Stroke: A Single-Center Experience. J. Stroke Cerebrovasc. Dis. 2016, 25, 368–377. [Google Scholar] [CrossRef]
- Shin, N.-Y.; Kim, K.; Park, M.; Kim, Y.D.; Kim, D.J.; Ahn, S.J.; Heo, J.H.; Lee, S.-K. Dual-Phase CT Collateral Score: A Predictor of Clinical Outcome in Patients with Acute Ischemic Stroke. PLoS ONE 2014, 9, e107379. [Google Scholar] [CrossRef]
- Wang, Z.; Xie, J.; Tang, T.-Y.; Zeng, C.-H.; Zhang, Y.; Zhao, Z.; Zhao, D.-L.; Geng, L.-Y.; Deng, G.; Zhang, Z.-J.; et al. Collateral Status at Single-Phase and Multiphase CT Angiography versus CT Perfusion for Outcome Prediction in Anterior Circulation Acute Ischemic Stroke. Radiology 2020, 296, 393–400. [Google Scholar] [CrossRef] [PubMed]
- Seker, F.; Pereira-Zimmermann, B.; Pfaff, J.; Purrucker, J.C.; Gumbinger, C.; Schönenberger, S.; Bendszus, M.; Möhlenbruch, M.A. Collateral Scores in Acute Ischemic Stroke. Clin. Neuroradiol. 2019, 30, 789–793. [Google Scholar] [CrossRef] [PubMed]
- Zhou, H.; Sun, J.; Ji, X.; Lin, J.; Tang, S.; Zeng, J.; Fan, Y. Correlation between the Integrity of the Circle of Willis and the Severity of Initial Noncardiac Cerebral Infarction and Clinical Prognosis. Medicine 2016, 95, e2892. [Google Scholar] [CrossRef] [PubMed]
- Oumer, M.; Alemayehu, M.; Muche, A. Association between Circle of Willis and Ischemic Stroke: A Systematic Review and Meta-Analysis. BMC Neurosci. 2021, 22, 3. [Google Scholar] [CrossRef] [PubMed]


| Characteristics | Overall (n = 158) | No Reperfusion (n = 82) | Reperfusion (n = 76) | p-Value |
|---|---|---|---|---|
| Age, years, median (IQR) | 72 (63–81) | 72 (62–82) | 71 (63–80) | 0.578 |
| Gender, male, n (%) | 74 (46.8%) | 37 (45.1%) | 37 (48.7%) | 0.750 |
| NIHSS score on the admission, median (IQR) | 11 (6–18) | 8 (4–18) | 14 (9–18) | 0.003 * |
| Time to CTA, minutes, median (IQR) | 117 (84–222) | 180 (101–306) | 95 (62–143) | ≪0.001 * |
| ASPECTS score on the admission: | ||||
| No visible signs of ischaemia (ASPECTS = 10), n (%) | 130 (82.3%) | 64 (78.0%) | 66 (86.8%) | 0.211 |
| Visible signs of ischaemia (ASPECTS < 10), n (%) | 28 (17.7%) | 18 (22.0%) | 10 (13.2%) | |
| ASPECTS score, median (IQR) | 7 (6–8) | 8 (7–8) | 6 (6–7) | 0.038 * |
| IS subtypes according to the TOAST classification: | ||||
| Large-artery atherosclerosis, n (%) | 28 (17.7%) | 16 (19.5%) | 12 (15.8%) | |
| Cardioembolic, n (%) | 63 (39.9%) | 25 (30.5%) | 38 (50.0%) | 0.041 * |
| Stroke of undetermined aetiology, n (%) | 63 (39.9%) | 38 (46.3%) | 25 (32.9%) | |
| Stroke of other determined aetiology, n (%) | 4 (2.5%) | 3 (3.7%) | 1 (1.3%) | |
| State of major cerebral arteries: | ||||
| No visible occlusions, n (%) | 57 (36.1%) | 43 (52.4%) | 14 (18.4%) | |
| Occlusion of the MCA, n (%) | 94 (59.5%) | 35 (42.7%) | 59 (77.6%) | ≪0.001 * |
| Occlusion only of the ICA, n (%) | 7 (4.4%) | 4 (4.9%) | 3 (3.9%) | |
| NIHSS score on the discharge, median (IQR) | 6 (2–14) | 5 (2–13) | 7 (2–16) | 0.638 |
| Death, n (%) | 48 (30.4%) | 25 (30.5%) | 23 (30.3%) | 1.000 |
| Radiologist #1 | Radiologist #2 | |
|---|---|---|
| Poor Collaterals | Good Collaterals | |
| Poor collaterals, n | 32 | 10 |
| Good collaterals, n | 7 | 109 |
| Radiologist #1 | Radiologist #2 | ||
|---|---|---|---|
| Poor Collaterals | Moderate Collaterals | Good Collaterals | |
| Poor collaterals, n | 16 | 2 | - |
| Moderate collaterals, n | 9 | 21 | 6 |
| Good collaterals, n | 5 | 14 | 21 |
| Radiologist #1 | Radiologist #2 | |||
|---|---|---|---|---|
| 1—Absent | 2—Less than the Contralateral Normal Side | 3—Equal to the Contralateral Normal Side | 4—Greater than the Contralateral Normal Side | |
| 1—Absent, n | 9 | 11 | - | - |
| 2—Less than the contralateral normal side, n | 3 | 41 | 8 | 1 |
| 3—Equal to the contralateral normal side, n | - | 21 | 57 | 2 |
| 4—Greater than the contralateral normal side, n | - | - | 2 | 3 |
| Consistency Measure | Modified Tan Scale | Miteff Scale | Rosenthal Scale |
|---|---|---|---|
| Cohen’s kappa (unweighted) | 0.72 (95% CI 0.59, 0.84) | 0.42 (95% CI 0.28, 0.57) | 0.51 (95% CI 0.40, 0.62) |
| Kappa with linear weighting | 0.72 (95% CI 0.59, 0.84) | 0.49 (95% CI 0.35, 0.63) | 0.59 (95% CI 0.49, 0.69) |
| Krippendorff’s alpha | 0.72 (95% CI 0.59, 0.83) | 0.55 (95% CI 0.38, 0.70) | 0.69 (95% CI 0.60, 0.76) |
| Scale Name | No Reperfusion Therapy | Reperfusion Therapy | |||||
|---|---|---|---|---|---|---|---|
| Poor Collaterals | Good Collaterals | M-W Test | Poor Collaterals | Good Collaterals | M-W Test | ||
| NIHSS score on discharge, median (IQR) | Modified Tan scale | 15 (10–26) n = 15 | 4 (1–10) n = 67 | ≪0.001 ** | 12 (4–19) n = 34 | 4 (2–10) n = 42 | 0.019 * |
| Miteff Scale | 16 (10–26) n = 11 | 10 (3–17) n = 24 | 0.031 * | 14 (4–19) n = 21 | 6 (2–16) n = 38 | 0.129 | |
| Rosenthal Scale | 10 (5–18) n = 37 | 3 (1–8) n = 45 | 0.001 ** | 8 (3–18) n = 57 | 3 (2–4) n = 19 | 0.003 ** | |
Disclaimer/Publisher’s Note: The statements, opinions and data contained in all publications are solely those of the individual author(s) and contributor(s) and not of MDPI and/or the editor(s). MDPI and/or the editor(s) disclaim responsibility for any injury to people or property resulting from any ideas, methods, instructions or products referred to in the content. |
© 2023 by the authors. Licensee MDPI, Basel, Switzerland. This article is an open access article distributed under the terms and conditions of the Creative Commons Attribution (CC BY) license (https://creativecommons.org/licenses/by/4.0/).
Share and Cite
Dolotova, D.D.; Blagosklonova, E.R.; Muslimov, R.S.; Ramazanov, G.R.; Zagryazkina, T.A.; Stepanov, V.N.; Gavrilov, A.V. Inter-Rater Reliability of Collateral Status Assessment Based on CT Angiography: A Retrospective Study of Middle Cerebral Artery Ischaemic Stroke. J. Clin. Med. 2023, 12, 5470. https://doi.org/10.3390/jcm12175470
Dolotova DD, Blagosklonova ER, Muslimov RS, Ramazanov GR, Zagryazkina TA, Stepanov VN, Gavrilov AV. Inter-Rater Reliability of Collateral Status Assessment Based on CT Angiography: A Retrospective Study of Middle Cerebral Artery Ischaemic Stroke. Journal of Clinical Medicine. 2023; 12(17):5470. https://doi.org/10.3390/jcm12175470
Chicago/Turabian StyleDolotova, Daria D., Evgenia R. Blagosklonova, Rustam Sh. Muslimov, Ganipa R. Ramazanov, Tatyana A. Zagryazkina, Valentin N. Stepanov, and Andrey V. Gavrilov. 2023. "Inter-Rater Reliability of Collateral Status Assessment Based on CT Angiography: A Retrospective Study of Middle Cerebral Artery Ischaemic Stroke" Journal of Clinical Medicine 12, no. 17: 5470. https://doi.org/10.3390/jcm12175470