
Perioperative Renal Ultrasonography of Arterio-to-Venous Coupling Predicts Postoperative Complications after Major Laparoscopic Urologic Surgery
 , , , , ,
Abstract
:
1. Introduction
2. Methods
2.1. Patients
2.2. Data Collection
2.3. Renal Ultrasound Assessment
2.4. Statistical Analysis
3. Results
3.1. Renal Doppler Assessment
3.2. Postoperative AKI
3.3. Postoperative Complications
3.4. Postoperative Monophasic IRVF
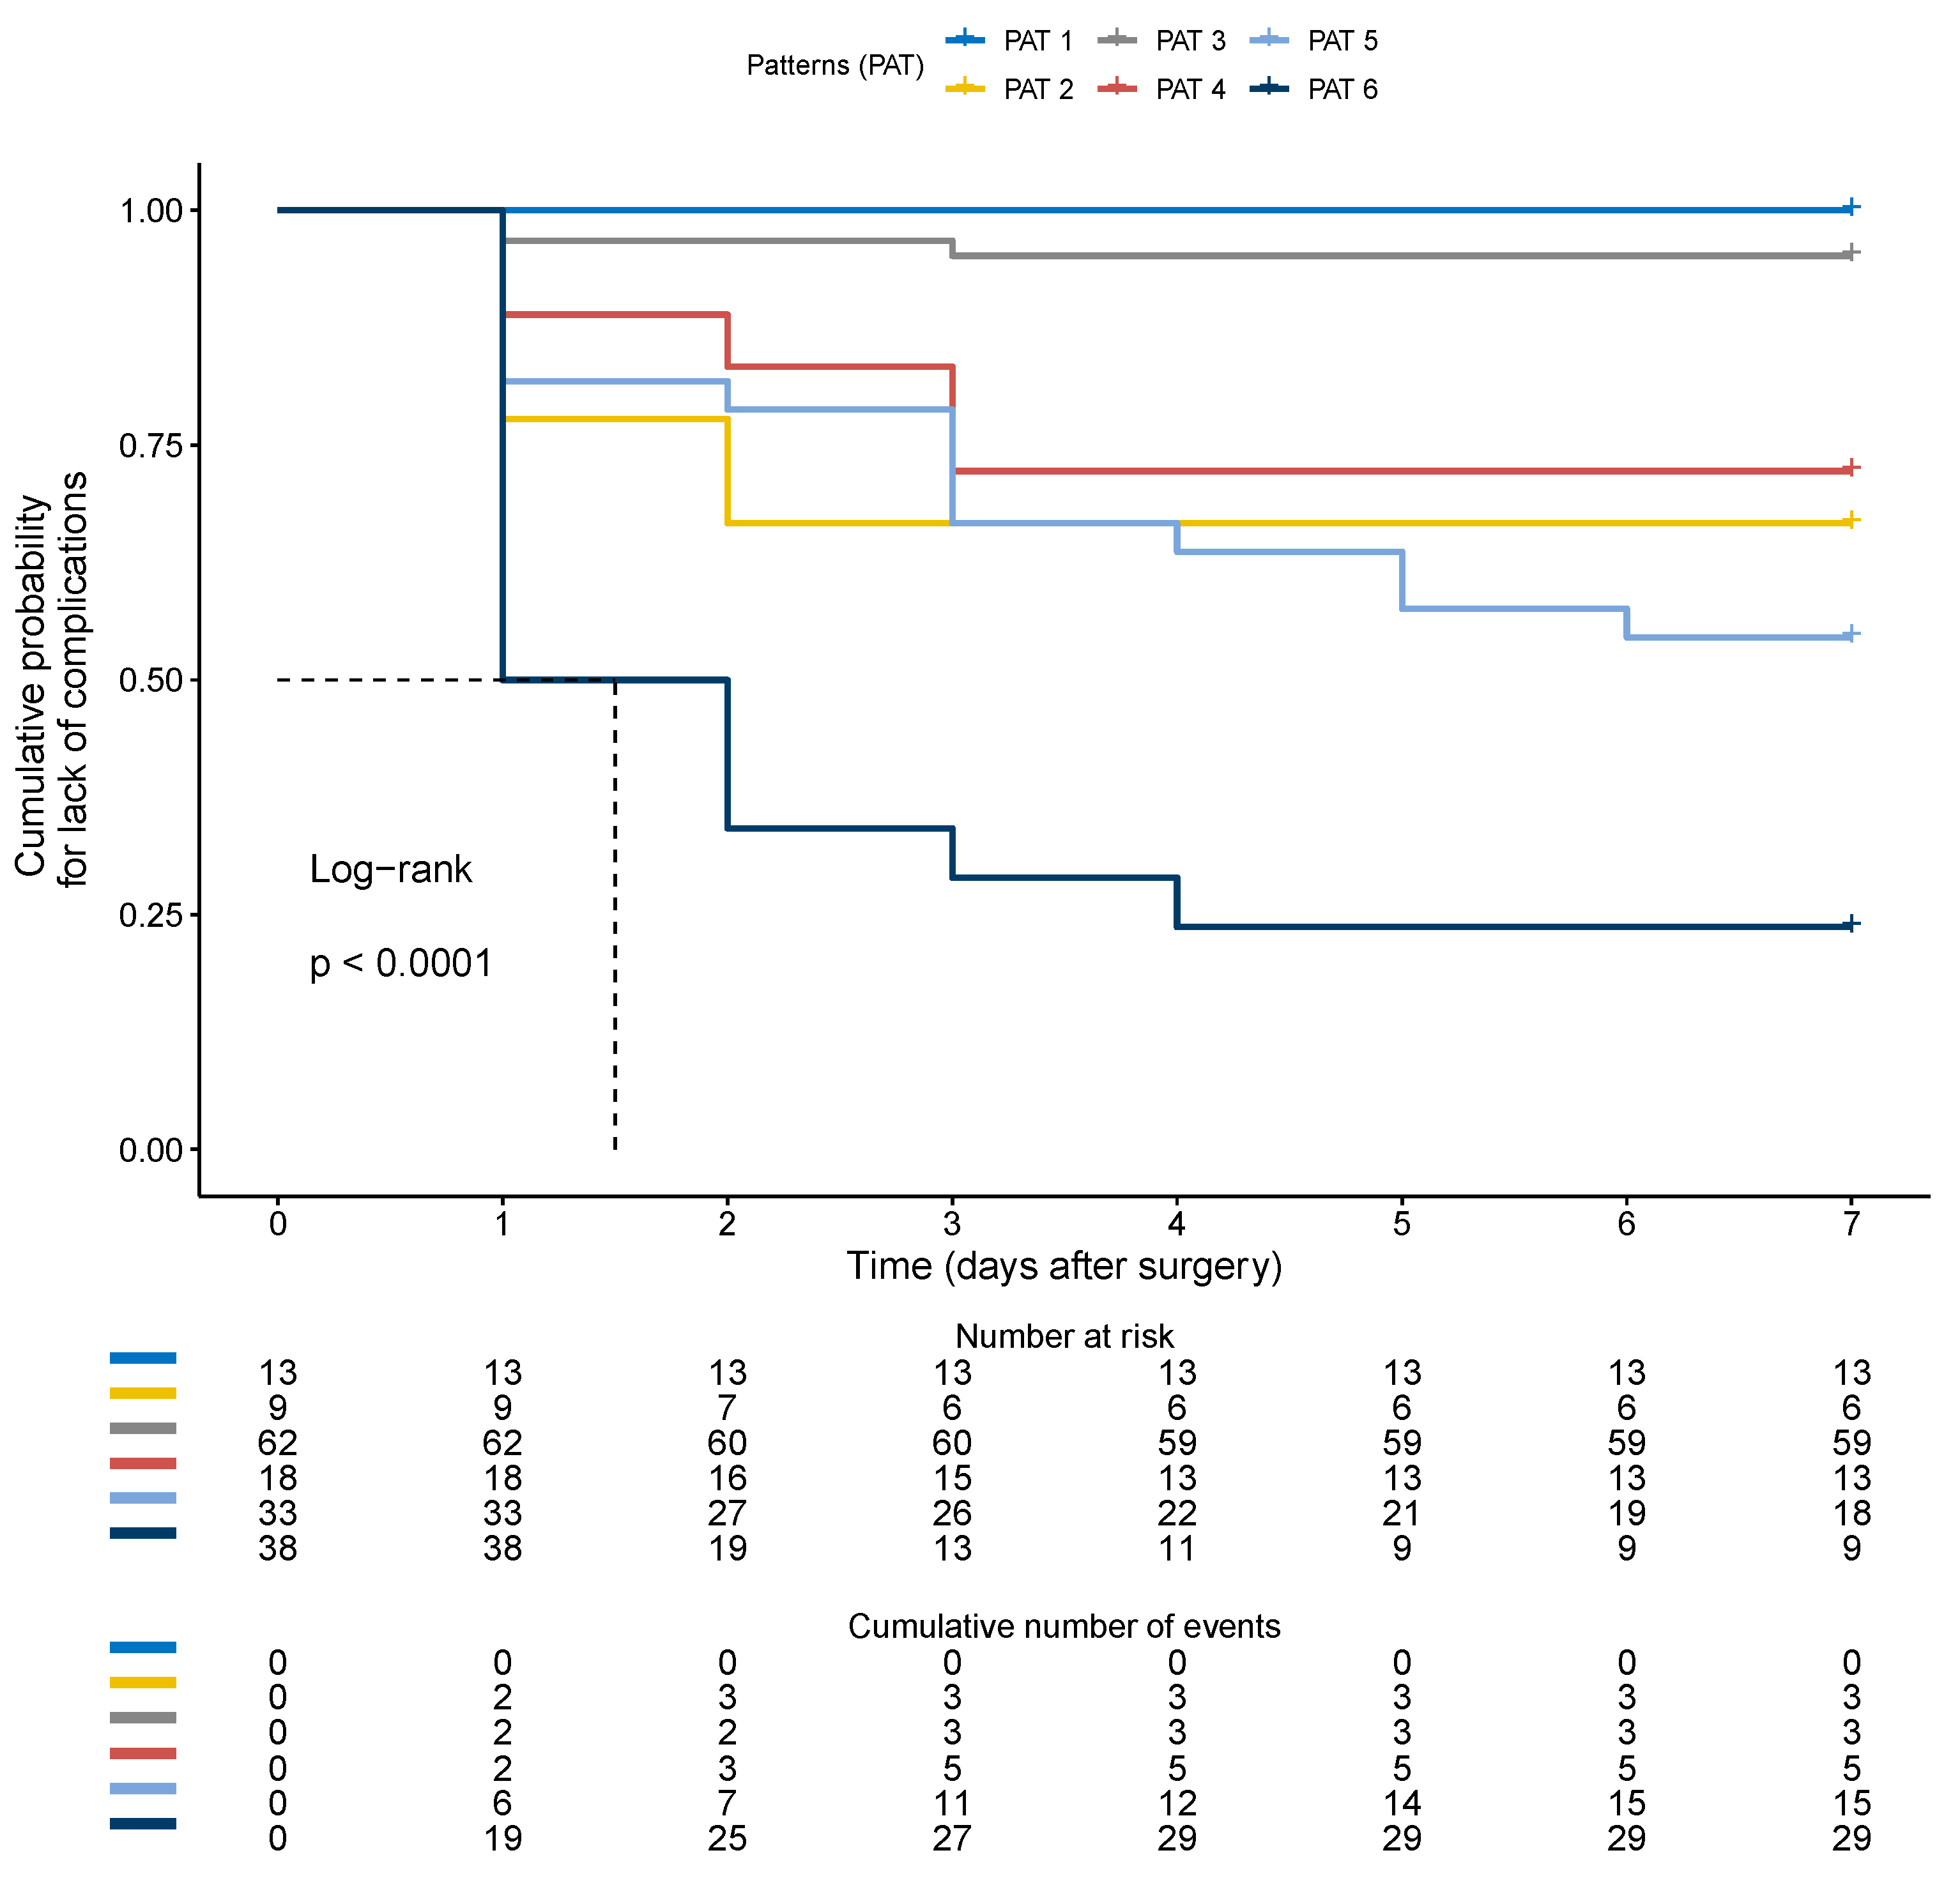
3.5. Arterial-to-Venous Coupling and Development of Complications
3.6. Reliability
4. Discussion
5. Conclusions
Supplementary Materials
Author Contributions
Funding
Institutional Review Board Statement
Informed Consent Statement
Data Availability Statement
Acknowledgments
Conflicts of Interest
References
- McKinlay, J.; Tyson, E.; Forni, L.G. Renal Complications of Anaesthesia. Anaesthesia 2018, 73 (Suppl. 1), 85–94. [Google Scholar] [CrossRef] [PubMed]
- Uchino, S.; Kellum, J.A.; Bellomo, R.; Doig, G.S.; Morimatsu, H.; Morgera, S.; Schetz, M.; Tan, I.; Bouman, C.; Macedo, E.; et al. Acute Renal Failure in Critically Ill Patients: A Multinational, Multicenter Study. JAMA 2005, 294, 813–818. [Google Scholar] [CrossRef] [PubMed]
- Thakar, C.V.; Christianson, A.; Freyberg, R.; Almenoff, P.; Render, M.L. Incidence and Outcomes of Acute Kidney Injury in Intensive Care Units: A Veterans Administration Study. Crit. Care Med. 2009, 37, 2552–2558. [Google Scholar] [CrossRef] [PubMed]
- Chawla, L.S.; Bellomo, R.; Bihorac, A.; Goldstein, S.L.; Siew, E.D.; Bagshaw, S.M.; Bittleman, D.; Cruz, D.; Endre, Z.; Fitzgerald, R.L.; et al. Acute kidney disease and renal recovery: Consensus report of the Acute Disease Quality Initiative (ADQI) 16 Workgroup. Nat. Rev. Nephrol. 2017, 13, 241–257. [Google Scholar] [CrossRef] [PubMed]
- O’Connor, M.E.; Kirwan, C.J.; Pearse, R.M.; Prowle, J.R. Incidence and Associations of Acute Kidney Injury after Major Abdominal Surgery. Intensive Care Med. 2016, 42, 521–530. [Google Scholar] [CrossRef] [PubMed]
- Kellum, J.A.; Romagnani, P.; Ashuntantang, G.; Ronco, C.; Zarbock, A.; Anders, H.-J. Acute Kidney Injury. Nat. Rev. Dis. Primers 2021, 7, 52. [Google Scholar] [CrossRef] [PubMed]
- Ronco, C.; Bellomo, R.; Kellum, J.A. Acute Kidney Injury. Lancet 2019, 394, 1949–1964. [Google Scholar] [CrossRef]
- Kopitkó, C.; Medve, L.; Gondos, T.; Soliman, K.M.M.; Fülöp, T. Mediators of Regional Kidney Perfusion during Surgical Pneumo-Peritoneum Creation and the Risk of Acute Kidney Injury—A Review of Basic Physiology. J. Clin. Med. 2022, 11, 2728. [Google Scholar] [CrossRef]
- Tavazzi, G.; Spiegel, R.; Rola, P.; Price, S.; Corradi, F.; Hockstein, M. Multiorgan Evaluation of Perfusion and Congestion Using Ultrasound in Patients with Shock. Eur. Heart J. Acute Cardiovasc. Care 2023, 12, 344–352. [Google Scholar] [CrossRef]
- Corradi, F.; Via, G.; Tavazzi, G. What’s New in Ultrasound-Based Assessment of Organ Perfusion in the Critically Ill: Expanding the Bedside Clinical Monitoring Window for Hypoperfusion in Shock. Intensive Care Med. 2020, 46, 775–779. [Google Scholar] [CrossRef]
- Schäfer, M.; Sägesser, H.; Reichen, J.; Krähenbühl, L. Alterations in Hemodynamics and Hepatic and Splanchnic Circulation during Laparoscopy in Rats. Surg. Endosc. 2001, 15, 1197–1201. [Google Scholar] [CrossRef]
- Prowle, J.R.; Forni, L.G.; Bell, M.; Chew, M.S.; Edwards, M.; Grams, M.E.; Grocott, M.P.W.; Liu, K.D.; McIlroy, D.; Murray, P.T.; et al. Postoperative Acute Kidney Injury in Adult Non-Cardiac Surgery: Joint Consensus Report of the Acute Disease Quality Initiative and PeriOperative Quality Initiative. Nat. Rev. Nephrol. 2021, 17, 605–618. [Google Scholar] [CrossRef]
- Levey, A.S.; Coresh, J.; Greene, T.; Stevens, L.A.; Zhang, Y.L.; Hendriksen, S.; Kusek, J.W.; Van Lente, F. Chronic Kidney Disease Epidemiology Collaboration Using Standardized Serum Creatinine Values in the Modification of Diet in Renal Disease Study Equation for Estimating Glomerular Filtration Rate. Ann. Intern. Med. 2006, 145, 247–254. [Google Scholar] [CrossRef]
- Ostermann, M.; Bellomo, R.; Burdmann, E.A.; Doi, K.; Endre, Z.H.; Goldstein, S.L.; Kane-Gill, S.L.; Liu, K.D.; Prowle, J.R.; Shaw, A.D.; et al. Controversies in Acute Kidney Injury: Conclusions from a Kidney Disease: Improving Global Outcomes (KDIGO) Conference. Kidney Int. 2020, 98, 294–309. [Google Scholar] [CrossRef]
- Corradi, F.; Brusasco, C.; Paparo, F.; Manca, T.; Santori, G.; Benassi, F.; Molardi, A.; Gallingani, A.; Ramelli, A.; Gherli, T.; et al. Renal Doppler Resistive Index as a Marker of Oxygen Supply and Demand Mismatch in Postoperative Cardiac Surgery Patients. BioMed Res. Int. 2015, 2015, 763940. [Google Scholar] [CrossRef]
- Corradi, F.; Brusasco, C.; Vezzani, A.; Palermo, S.; Altomonte, F.; Moscatelli, P.; Pelosi, P. Hemorrhagic Shock in Polytrauma Patients: Early Detection with Renal Doppler Resistive Index Measurements. Radiology 2011, 260, 112–118. [Google Scholar] [CrossRef] [PubMed]
- Planiol, T.; Pourcelot, L. Doppler Effect Study of the Carotid Circulation. In Ultrasonics in Medicine; de Vlieger, M., McCready, W.R., Eds.; Excerpta Medica: Amsterdam, The Netherlands, 1974. [Google Scholar]
- Iida, N.; Seo, Y.; Sai, S.; Machino-Ohtsuka, T.; Yamamoto, M.; Ishizu, T.; Kawakami, Y.; Aonuma, K. Clinical Implications of Intrarenal Hemodynamic Evaluation by Doppler Ultrasonography in Heart Failure. JACC Heart Fail. 2016, 4, 674–682. [Google Scholar] [CrossRef]
- Benjamini, Y.; Hochberg, Y. Controlling the False Discovery Rate: A Practical and Powerful Approach to Multiple Testing. J. R. Stat. Soc. Ser. B 1995, 57, 289–300. [Google Scholar] [CrossRef]
- Burnett, J.C.; Knox, F.G. Renal Interstitial Pressure and Sodium Excretion during Renal Vein Constriction. Am. J. Physiol. 1980, 238, F279–F282. [Google Scholar] [CrossRef]
- Di Nicolò, P.; Tavazzi, G.; Nannoni, L.; Corradi, F. Inferior Vena Cava Ultrasonography for Volume Status Evaluation: An Intriguing Promise Never Fulfilled. J. Clin. Med. 2023, 12, 2217. [Google Scholar] [CrossRef]
- Tavazzi, G.; Corradi, F.; Vandenbriele, C.; Alviar, C.L. Multimodality Imaging in Cardiogenic Shock: State-of-the Art. Curr. Opin. Crit. Care 2023, 29, 381–391. [Google Scholar] [CrossRef] [PubMed]
- Brandstrup, B.; Tønnesen, H.; Beier-Holgersen, R.; Hjortsø, E.; Ørding, H.; Lindorff-Larsen, K.; Rasmussen, M.S.; Lanng, C.; Wallin, L.; Iversen, L.H.; et al. Effects of Intravenous Fluid Restriction on Postoperative Complications: Comparison of Two Perioperative Fluid Regimens: A Randomized Assessor-Blinded Multicenter Trial. Ann. Surg. 2003, 238, 641–648. [Google Scholar] [CrossRef] [PubMed]
- Warrillow, S.J.; Weinberg, L.; Parker, F.; Calzavacca, P.; Licari, E.; Aly, A.; Bagshaw, S.; Christophi, C.; Bellomo, R. Perioperative Fluid Prescription, Complications and Outcomes in Major Elective Open Gastrointestinal Surgery. Anaesth. Intensive Care 2010, 38, 259–265. [Google Scholar] [CrossRef]
- Wuethrich, P.Y.; Burkhard, F.C. Improved Perioperative Outcome with Norepinephrine and a Restrictive Fluid Administration during Open Radical Cystectomy and Urinary Diversion. Urol. Oncol. 2015, 33, e21–e24. [Google Scholar] [CrossRef]
- Wuethrich, P.Y.; Burkhard, F.C.; Thalmann, G.N.; Stueber, F.; Studer, U.E. Restrictive Deferred Hydration Combined with Preemptive Norepinephrine Infusion during Radical Cystectomy Reduces Postoperative Complications and Hospitalization Time: A Randomized Clinical Trial. Anesthesiology 2014, 120, 365–377. [Google Scholar] [CrossRef]
- Brusasco, C.; Germinale, F.; Dotta, F.; Benelli, A.; Guano, G.; Campodonico, F.; Ennas, M.; Di Domenico, A.; Santori, G.; Introini, C.; et al. Low Intra-Abdominal Pressure with Complete Neuromuscular Blockage Reduces Post-Operative Complications in Major Laparoscopic Urologic Surgery: A before-after Study. J. Clin. Med. 2022, 11, 7201. [Google Scholar] [CrossRef]


| All Patients (n = 173) | |
|---|---|
| Demographics | |
| Age, y | 68 (60–73) |
| Male, n (%) | 157 (91) |
| Body mass index, kg/m2 | 25 (23–28) |
| Baseline clinical data | |
| Charlson Comorbidity Index | 4 (2–5) |
| Karnofsky index | 100 (90–100) |
| ECOG performance status scale | 0 (0–0) |
| ASA classification | 2 (2–2) |
| Baseline laboratory data | |
| Hemoglobin, g/dL | 14 (13–15) |
| Sodium, mmol/L | 140 (139–141) |
| Potassium, mmol/L | 4.2 (4–4.5) |
| Urea, mg/dL | 38 (31–44) |
| Serum Creatinine, mg/dL | 0.9 (0.8–1.1) |
| eGFR mL/min/1.73 m2 | 83 (65–101) |
| Comorbidities, n (%) | |
| Hypertension | 78 (49) |
| Diabetes mellitus | 15 (9) |
| Active smoker | 22 (14) |
| Chronic cardiovascular diseases | 21 (13) |
| Chronic Respiratory diseases | 13 (8) |
| Maintenance therapies | |
| ACEI, n (%) | 31 (19) |
| ARB, n (%) | 32 (20) |
| β-Blocker, n (%) | 35 (22) |
| Loop diuretic, n (%) | 20 (12) |
| Major laparoscopic surgery | |
| Radical nephrectomy, n (%) | 27 (16) |
| Partial nephrectomy, n (%) | 21 (12) |
| Radical prostatectomy, n (%) | 112 (65) |
| Adrenalectomy, n (%) | 2 (1) |
| Others, n (%) | 11 (6) |
| Postoperative AKI Group (n = 37) | No Postoperative AKI Group (n = 136) | p | |
|---|---|---|---|
| Demographics | |||
| Age, y | 70 (62–74) | 67 (59–73) | 0.271 |
| Male, n (%) | 49 (89) | 108 (92) | 0.540 |
| Body mass index, kg/m2 | 25 (23–29) | 25 (23–28) | 0.862 |
| Baseline clinical data | |||
| Charlson comorbidity index | 5 (4–6) | 4 (2–5) | 0.003 |
| ECOG performance status scale | 0 (0–0) | 0(0–0) | 0.074 |
| ASA classification | 2 (2–2) | 2 (2–2) | 0.236 |
| Baseline laboratory data | |||
| Hemoglobin, g/dL | 14 (13–15) | 15 (13–16) | 0.319 |
| Sodium, mmol/L | 141 (139–142) | 140 (139–141) | 0.575 |
| Potassium, mmol/L | 4.4 (4.1–5.0) | 4.2 (4.0–4.5) | 0.132 |
| Urea, mg/dL | 40 (32–50) | 37 (30–44) | 0.124 |
| Serum creatinine, mg/dL | 1.00 (0.90–1.20) | 0.90 (0.80–1.00) | 0.273 |
| eGFR mL/min/1.73 m2 | 69 (63–89) | 85 (67–104) | 0.074 |
| Comorbidities, n (%) | |||
| Hypertension | 25 (48) | 53 (47) | 0.449 |
| Diabetes mellitus | 7 (14) | 8 (7) | 0.094 |
| Active smoker | 3 (6) | 19 (17) | 0.418 |
| Chronic cardiovascular diseases | 9 (19) | 12 (11) | 0.026 |
| Chronic respiratory diseases | 5 (11) | 8 (7) | 0.493 |
| Maintenance therapies | |||
| ACEI/ARB, n (%) | 24 (44) | 39 (33) | 0.478 |
| β-Blocker | 14 (28) | 21 (19) | 0.019 |
| Loop diuretic, n (%) | 5 (10) | 15 (13) | 0.771 |
| Intraoperative period | |||
| MAP, mm Hg | 75 (80–85) | 79 (74–85) | 0.131 |
| Heart rate, beats/min | 59 (50–65) | 62 (54–65) | 0.149 |
| Intra-abdominal pressure, mmHg | 10 (10–12) | 10 (8–12) | 0.013 |
| Abdominal perfusion pressure, mmHg | 65 (60–73) | 69 (63–77) | 0.050 |
| Renal filtration gradient, mmHg | 55 (50–61) | 60 (52–66) | 0.020 |
| Length of surgery, minutes | 150 (89–171) | 140 (109–180) | 0.830 |
| Length of pneumoperitoneum, minutes | 120 (45–143) | 116 (80–151) | 0.353 |
| Trendelemburg, degrees (°) | 19 (15–24) | 20 (15–24) | 0.216 |
| Blood loss, mL | 200 (50–400) | 200 (50–375) | 0.585 |
| Intraoperative fluids, mL | 1300 (975–1700) | 1200 (900–1600) | 0.478 |
| Postoperative period | |||
| Hemoglobin, g/dL | 11 (10–12) | 12 (11–13) | 0.009 |
| Sodium, mmol/L | 139 (137–140) | 139 (137–141) | 0.376 |
| Potassium, mmol/L | 4.1 (3.9–4.3) | 4.1 (3.8–4.3) | 0.998 |
| Urea, mg/dL | 39 (30–49) | 31 (25–39) | <0.001 |
| Postoperative creatinine, mg/dL | 1.5 (1.3–2.0) | 1.0 (0.8–1.1) | <0.001 |
| eGFR mL/min/1.73 m2 | 47 (30–65) | 81 (63–95) | <0.001 |
| Preoperative renal Doppler ultrasonography | |||
| Renal Doppler resistive index | 0.68 (0.60–0.73) | 0.64 (0.57–0.68) | 0.027 |
| Intrarenal venous flow pattern continuous, n (%) | 6 (11) | 21 (18) | 0.205 |
| Intrarenal venous flow pattern biphasic, n (%) | 30 (55) | 68 (58) | 0.462 |
| Intrarenal venous flow pattern monophasic, n (%) | 19 (34) | 29 (24) | 0.836 |
| Postoperative renal Doppler ultrasonography | |||
| Renal Doppler resistive index | 0.73 (0.67–0.75) | 0.67 (0.62–0.73) | <0.001 |
| Intrarenal venous flow pattern continuous, n (%) | 4 (7) | 19 (16) | 0.170 |
| Intrarenal venous flow pattern biphasic, n (%) | 29 (53) | 72 (61) | <0.001 |
| Intrarenal venous flow pattern monophasic, n (%) | 22 (40) | 27 (23) | <0.001 |
| Worsened intrarenal venous flow pattern, n (%) | 32 (58) | 22 (19) | <0.001 |
| Postoperative inferior vena cava ultrasonography | |||
| Maximum diameter (mm) | 2.4 (2.2–2.6) | 2.4 (2.1–2.6) | 0.562 |
| Collapsibility Index (%) | 0.14 (0.09–0.16) | 0.13 (0.09–0.21) | 0.750 |
| Renal Doppler ultrasonography at hospital discharge | |||
| Renal Doppler resistive index | 0.66 (0.60–0.71) | 0.66 (0.58–0.70) | 0.915 |
| Intrarenal venous flow pattern continuous, n (%) | 8 (14) | 24 (20) | 0.478 |
| Intrarenal venous flow pattern biphasic, n (%) | 36 (66) | 80 (68) | 0.554 |
| Intrarenal venous flow pattern monophasic, n (%) | 11 (20) | 14 (12) | 0.430 |
| Outcomes | |||
| Hospital length of stay (days) | 5 (4–8) | 4 (3–5) | 0.003 |
| Clavien–Dindo | 1 (0–1) | 0 (0–0) | <0.001 |
| Variables | B | HR | CI | p | B | HR | CI | p | |
|---|---|---|---|---|---|---|---|---|---|
| Postoperative monophasic IRVF | 2.950 | 19.108 | 4.845–75.359 | <0.001 | 2.211 | 9.126 | 3.474–23.973 | <0.001 | |
| Age (years) | −0.017 | 0.983 | 0.943–1.026 | 0.430 | |||||
| Active smoker | −0.029 | 1.030 | 0.216–4.900 | 0.971 | |||||
| Sex | 0.039 | 1.040 | 0.219–4.924 | 0.961 | |||||
| Preoperative RDRI | −4.045 | 0.018 | 0.000–9.096 | 0.205 | |||||
| Intra-abdominal pressure | 0.083 | 1.087 | 0.745–1.586 | 0.665 | |||||
| Postoperative RDRI | 8.206 | 33.314 | 0.025–23.376 | 0.046 | 7.235 | 13.925 | 1.583–12.420 | 0.036 | |
| Preoperative monophasic IRVF | −0.891 | 0.410 | 0.138–1.220 | 0.109 | |||||
| Preoperative creatinine | 1.338 | 3.812 | 0.238–60.953 | 0.344 | |||||
| Charlson index | 0.317 | 1.373 | 0.952–1.980 | 0.090 | 0.166 | 1.181 | 0.978–1.425 | 0.084 | |
| Arterial hypertension | −0.353 | 0.703 | 0.200–2.470 | 0.582 | |||||
| Cadiovascular diseases | 0.342 | 1.408 | 0.369–5.366 | 0.617 | |||||
| Chronic respiratory diseases | −0.172 | 0.842 | 0.210–3.374 | 0.808 | |||||
| Diabetes | 0.058 | 1.059 | 0.272–4.124 | 0.934 | |||||
| Patients with complications, n (%) | 55 (32) |
| Number of complications, n | 70 |
| Types of complications, n | |
| Sepsis | 14 |
| Bleeding | 7 |
| Respiratory failure | 3 |
| Ileus | 4 |
| Acute kidney injury | 37 |
| Anastomotic leakage | 3 |
| Intraoperative complication | 1 |
| Surgical wound infection | 1 |
| Postoperative Complications Group (n = 55) | No Postoperative Complications Group (n = 118) | p | |
|---|---|---|---|
| Demographics | |||
| Age, y | 68 (60–73) | 68 (60–73) | 0.888 |
| Male, n (%) | 49 (89) | 108 (92) | 0.585 |
| Body mass index, kg/m2 | 25 (23–29) | 25 (23–28) | 0.862 |
| Baseline clinical data | |||
| Charlson comorbidity index | 4 (3–5) | 4 (2–5) | 0.057 |
| ECOG performance status scale | 0 (0–0) | 0(0–0) | 0.522 |
| ASA classification | 2 (2–2) | 2 (2–2) | 0.290 |
| Baseline Laboratory data | |||
| Hemoglobin, g/dL | 14 (13–15) | 15 (13–15) | 0.707 |
| Sodium, mmol/L | 140 (139–142) | 140 (139–141) | 0.575 |
| Potassium, mmol/L | 4.4 (4.1–4.6) | 4.2 (4.0–4.4) | 0.166 |
| Urea, mg/dL | 39 (31–48) | 37 (30–44) | 0.926 |
| Serum creatinine, mg/dL | 0.90 (0.90–1.10) | 0.90 (0.80–1.10) | 0.773 |
| eGFR mL/min/1.73 m2 | 74 (63–94) | 85 (67–104) | 0.113 |
| Comorbidities, n (%) | |||
| Hypertension | 25 (48) | 53 (47) | 0.608 |
| Diabetes mellitus | 7 (14) | 8 (7) | 0.238 |
| Active smoker | 3 (6) | 19 (17) | 0.083 |
| Chronic cardiovascular diseases | 9 (19) | 12 (11) | 0.200 |
| Chronic Respiratory diseases | 5 (11) | 8 (7) | 0.529 |
| Maintenance therapies | |||
| ACEI/ARB, n (%) | 24 (44) | 39 (33) | 0.235 |
| β-Blocker | 14 (28) | 21 (19) | 0.215 |
| Loop diuretic, n (%) | 5 (10) | 15 (13) | 0.796 |
| Intraoperative period | |||
| MAP, mm Hg | 77 (70–85) | 79 (75–85) | 0.143 |
| Heart rate, beats/min | 60 (51–66) | 61 (53–65) | 0.651 |
| Intra-abdominal pressure, mmHg | 10 (10–12) | 10 (8–12) | <0.001 |
| Abdominal perfusion pressure, mmHg | 66 (60–73) | 69 (63–77) | 0.030 |
| Renal filtration gradient, mmHg | 55 (50–61) | 60 (54–66) | 0.007 |
| Length of surgery, minutes | 150 (115–190) | 135 (100–180) | 0.402 |
| Length of pneumoperitoneum, minutes | 123 (66–150) | 110 (73–150) | 0.805 |
| Trendelemburg, degrees (°) | 20 (15–24) | 20 (15–24) | 0.430 |
| Blood loss, mL | 250 (50–500) | 190 (48–300) | 0.058 |
| Intraoperative Fluids, mL | 1400 (1100–1700) | 1200 (838–1500) | 0.059 |
| Postoperative period | |||
| Hemoglobin, g/dL | 11 (10–13) | 13 (11–13) | 0.002 |
| Sodium, mmol/L | 139 (136–140) | 139 (138–141) | 0.740 |
| Potassium, mmol/L | 4.1 (3.9–4.5) | 4.1 (3.8–4.3) | 0.994 |
| Urea, mg/dL | 38 (29–48) | 31 (25–39) | 0.081 |
| Postoperative Creatinine, mg/dL | 1.4 (1.00–1.80) | 1.0 (0.8–1.1) | <0.001 |
| eGFR mL/min/1.73 m2 | 59 (38–82) | 80 (63–95) | <0.001 |
| Preoperative renal Doppler ultrasonography | |||
| Renal Doppler resistive index | 0.67 (0.59–0.70) | 0.64 (0.57–0.68) | 0.081 |
| Intrarenal venous flow pattern continuous, n (%) | 6 (11) | 21 (18) | 0.271 |
| Intrarenal venous flow pattern biphasic, n (%) | 30 (55) | 68 (58) | 0.743 |
| Intrarenal venous flow pattern monophasic, n (%) | 19 (34) | 29 (24) | 0.203 |
| Postoperative renal Doppler ultrasonography | |||
| Renal Doppler resistive index | 0.74 (0.73–0.77) | 0.67 (0.61–0.71) | <0.001 |
| Intrarenal venous flow pattern continuous, n (%) | 4 (7) | 19 (16) | 0.054 |
| Intrarenal venous flow pattern biphasic, n (%) | 29 (53) | 72 (61) | 0.324 |
| Intrarenal venous flow pattern monophasic, n (%) | 22 (40) | 27 (23) | 0.029 |
| Worsened intrarenal venous flow pattern, n (%) | 32 (58) | 22 (19) | <0.001 |
| Postoperative inferior vena cava ultrasonography | |||
| Maximum diameter (mm) | 2.4 (2.2–2.6) | 2.4 (2.1–2.6) | 0.102 |
| Collapsibility Index (%) | 0.14 (0.09–0.19) | 0.13 (0.09–0.20) | 0.828 |
| Renal Doppler ultrasonography at hospital discharge | |||
| Renal Doppler resistive index | 0.66 (0.59–0.71) | 0.65 (0.60–0.71) | 0.886 |
| Intrarenal venous flow pattern continuous, n (%) | 8 (14) | 24 (20) | 0.407 |
| Intrarenal venous flow pattern biphasic, n (%) | 36 (66) | 80 (68) | 0.862 |
| Intrarenal venous flow pattern monophasic, n (%) | 11 (20) | 14 (12) | 0.169 |
| Outcomes | |||
| Hospital length of stay (days) | 7 (4–9) | 4 (3–5) | <0.001 |
| Clavien-Dindo | 1 (0–2) | 0 (0–0) | <0.001 |
| Variables | B | HR | CI | p | B | HR | CI | p | |
|---|---|---|---|---|---|---|---|---|---|
| Postoperative monophasic IRVF | 3.029 | 20.671 | 6.093–70.127 | 0.001 | 2.095 | 8.124 | 3.542–18.634 | <0.001 | |
| Age (years) | −0.083 | 0.920 | 0.852–0.993 | 0.033 | −0.021 | 0.135 | 0.953–1.006 | 0.135 | |
| Active smoker | −1.087 | 0.337 | 0.061–1.880 | 0.215 | |||||
| Sex | 1.149 | 3.155 | 0.730–13.630 | 0.124 | |||||
| Preoperative RDRI | −2.511 | 0.081 | 0.000–28.887 | 0.402 | |||||
| Intra-abdominal pressure | 0.108 | 1.114 | 0.766–1.619 | 0.572 | |||||
| Postoperative RDRI | 1.414 | 4.113 | 0.813–20.812 | 0.087 | 1.096 | 2.993 | 1.522–5.884 | 0.001 | |
| Preoperative monophasic IRVF | −0.608 | 0.544 | 0.442–1.447 | 0.223 | |||||
| Preoperative creatinine | 0.904 | 2.468 | 0.205–25.807 | 0.451 | |||||
| Charlson index | 0.528 | 1.695 | 1.087–2.644 | 0.020 | 0.104 | 1.109 | 0.939–1.311 | 0.223 | |
| Arterial hypertension | 0.883 | 2.417 | 0.758–7.711 | 0.136 | |||||
| Cadiovascular diseases | −0.431 | 0.650 | 0.166–2.537 | 0.535 | |||||
| Chronic respiratory diseases | −0.112 | 0.894 | 0.292–2.736 | 0.845 | |||||
| Diabetes | −0.834 | 0.434 | 0.128–1.479 | 0.182 | |||||
| Variables | Postoperative Monophasic IRVF Pattern (71) | Postoperative Continuous or Biphasic IRVF Pattern (102) | p |
|---|---|---|---|
| MAP, mm Hg | 76 (70–85) | 79 (75–85) | 0.358 |
| Heart rate, beats/min | 59 (51–66) | 62 (54–65) | 0.241 |
| Intra-abdominal pressure, mmHg | 10 (10–12) | 10 (8–11) | 0.016 |
| Abdominal perfusion pressure, mmHg | 66 (60–75) | 69 (64–76) | 0.246 |
| Renal filtration gradient, mmHg | 55 (50–63) | 60 (54–65) | 0.057 |
| Length of surgery, minutes | 144 (99–170) | 140 (110–180) | 0.920 |
| Length of pneumoperitoneum, minutes | 120 (65–145) | 114 (83–163) | 0.807 |
| Trendelemburg, degrees (°) | 20 (15–24) | 20 (15–24) | 0.257 |
| Blood loss, mL | 190 (48–313) | 200 (80–400) | 0.757 |
| Intraoperative Fluids, mL | 1500 (1200–1700) | 1150 (800–1500) | 0.029 |
| Variables | B | OR | CI | p | |
|---|---|---|---|---|---|
| MAP, mm Hg | −0.036 | 0.965 | 0.918 | 1.014 | 0.160 |
| Heart rate, beats/min | −0.023 | 0.977 | 0.929 | 1.028 | 0.375 |
| Intra-abdominal pressure, mmHg | 0.303 | 1.354 | 1.017 | 1.804 | 0.038 |
| Length of surgery, minutes | −0.002 | 0.998 | 0.973 | 1.025 | 0.898 |
| Length of pneumoperitoneum, minutes | 0.002 | 1.002 | 0.993 | 1.012 | 0.657 |
| Trendelemburg, degrees (°) | −0.015 | 0.985 | 0.929 | 1.044 | 0.603 |
| Blood loss, mL | 0.001 | 1.001 | 0.999 | 1.003 | 0.372 |
| Intraoperative fluids, mL | 0.001 | 1.001 | 1.000 | 1.002 | 0.248 |
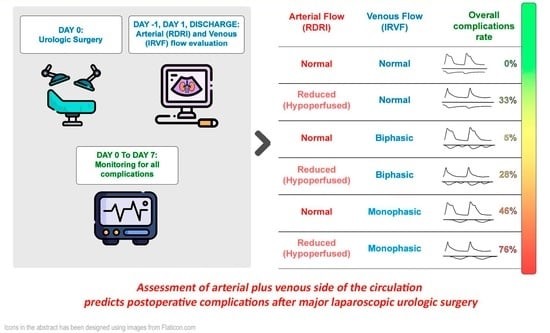
| Venous Pattern | RDRI | Number of Patients n, (%) | Patients with AKI n, (%) | Patients with any Complications n, (%) | Profiles Interpretation |
|---|---|---|---|---|---|
| Continuous | <0.72 | 13 (7.5) | 0 (0) | 0 (0) | Normal |
| >0.72 | 9 (5) | 2 (22) | 3 (33) | Pure hypo-perfused | |
| Biphasic | <0.72 | 62 (36) | 2 (3) | 3 (5) | Pure congestive compensated |
| >0.72 | 18 (10.5) | 3 (17) | 5 (28) | Mild mixed hypo-perfused and congestive | |
| Monophasic | <0.72 | 33 (19) | 12 (36) | 15 (46) | Severe congestive |
| >0.72 | 38 (22) | 18 (47) | 29 (76) | Mixed severe hypo-perfused and congestive |
Disclaimer/Publisher’s Note: The statements, opinions and data contained in all publications are solely those of the individual author(s) and contributor(s) and not of MDPI and/or the editor(s). MDPI and/or the editor(s) disclaim responsibility for any injury to people or property resulting from any ideas, methods, instructions or products referred to in the content. |
© 2023 by the authors. Licensee MDPI, Basel, Switzerland. This article is an open access article distributed under the terms and conditions of the Creative Commons Attribution (CC BY) license (https://creativecommons.org/licenses/by/4.0/).
Share and Cite
Brusasco, C.; Tavazzi, G.; Cucciolini, G.; Di Nicolò, P.; Wong, A.; Di Domenico, A.; Germinale, F.; Dotta, F.; Micali, M.; Coccolini, F.; et al. Perioperative Renal Ultrasonography of Arterio-to-Venous Coupling Predicts Postoperative Complications after Major Laparoscopic Urologic Surgery. J. Clin. Med. 2023, 12, 5013. https://doi.org/10.3390/jcm12155013
Brusasco C, Tavazzi G, Cucciolini G, Di Nicolò P, Wong A, Di Domenico A, Germinale F, Dotta F, Micali M, Coccolini F, et al. Perioperative Renal Ultrasonography of Arterio-to-Venous Coupling Predicts Postoperative Complications after Major Laparoscopic Urologic Surgery. Journal of Clinical Medicine. 2023; 12(15):5013. https://doi.org/10.3390/jcm12155013
Chicago/Turabian StyleBrusasco, Claudia, Guido Tavazzi, Giada Cucciolini, Pierpaolo Di Nicolò, Adrian Wong, Antonia Di Domenico, Federico Germinale, Federico Dotta, Marco Micali, Federico Coccolini, and et al. 2023. "Perioperative Renal Ultrasonography of Arterio-to-Venous Coupling Predicts Postoperative Complications after Major Laparoscopic Urologic Surgery" Journal of Clinical Medicine 12, no. 15: 5013. https://doi.org/10.3390/jcm12155013