
The Relationship between Body Mass Index and In-Hospital Mortality in Bacteremic Sepsis
 ,
,
Abstract
:1. Introduction
2. Materials and Methods
3. Results
3.1. Study Cohort
3.2. Patient Characteristics
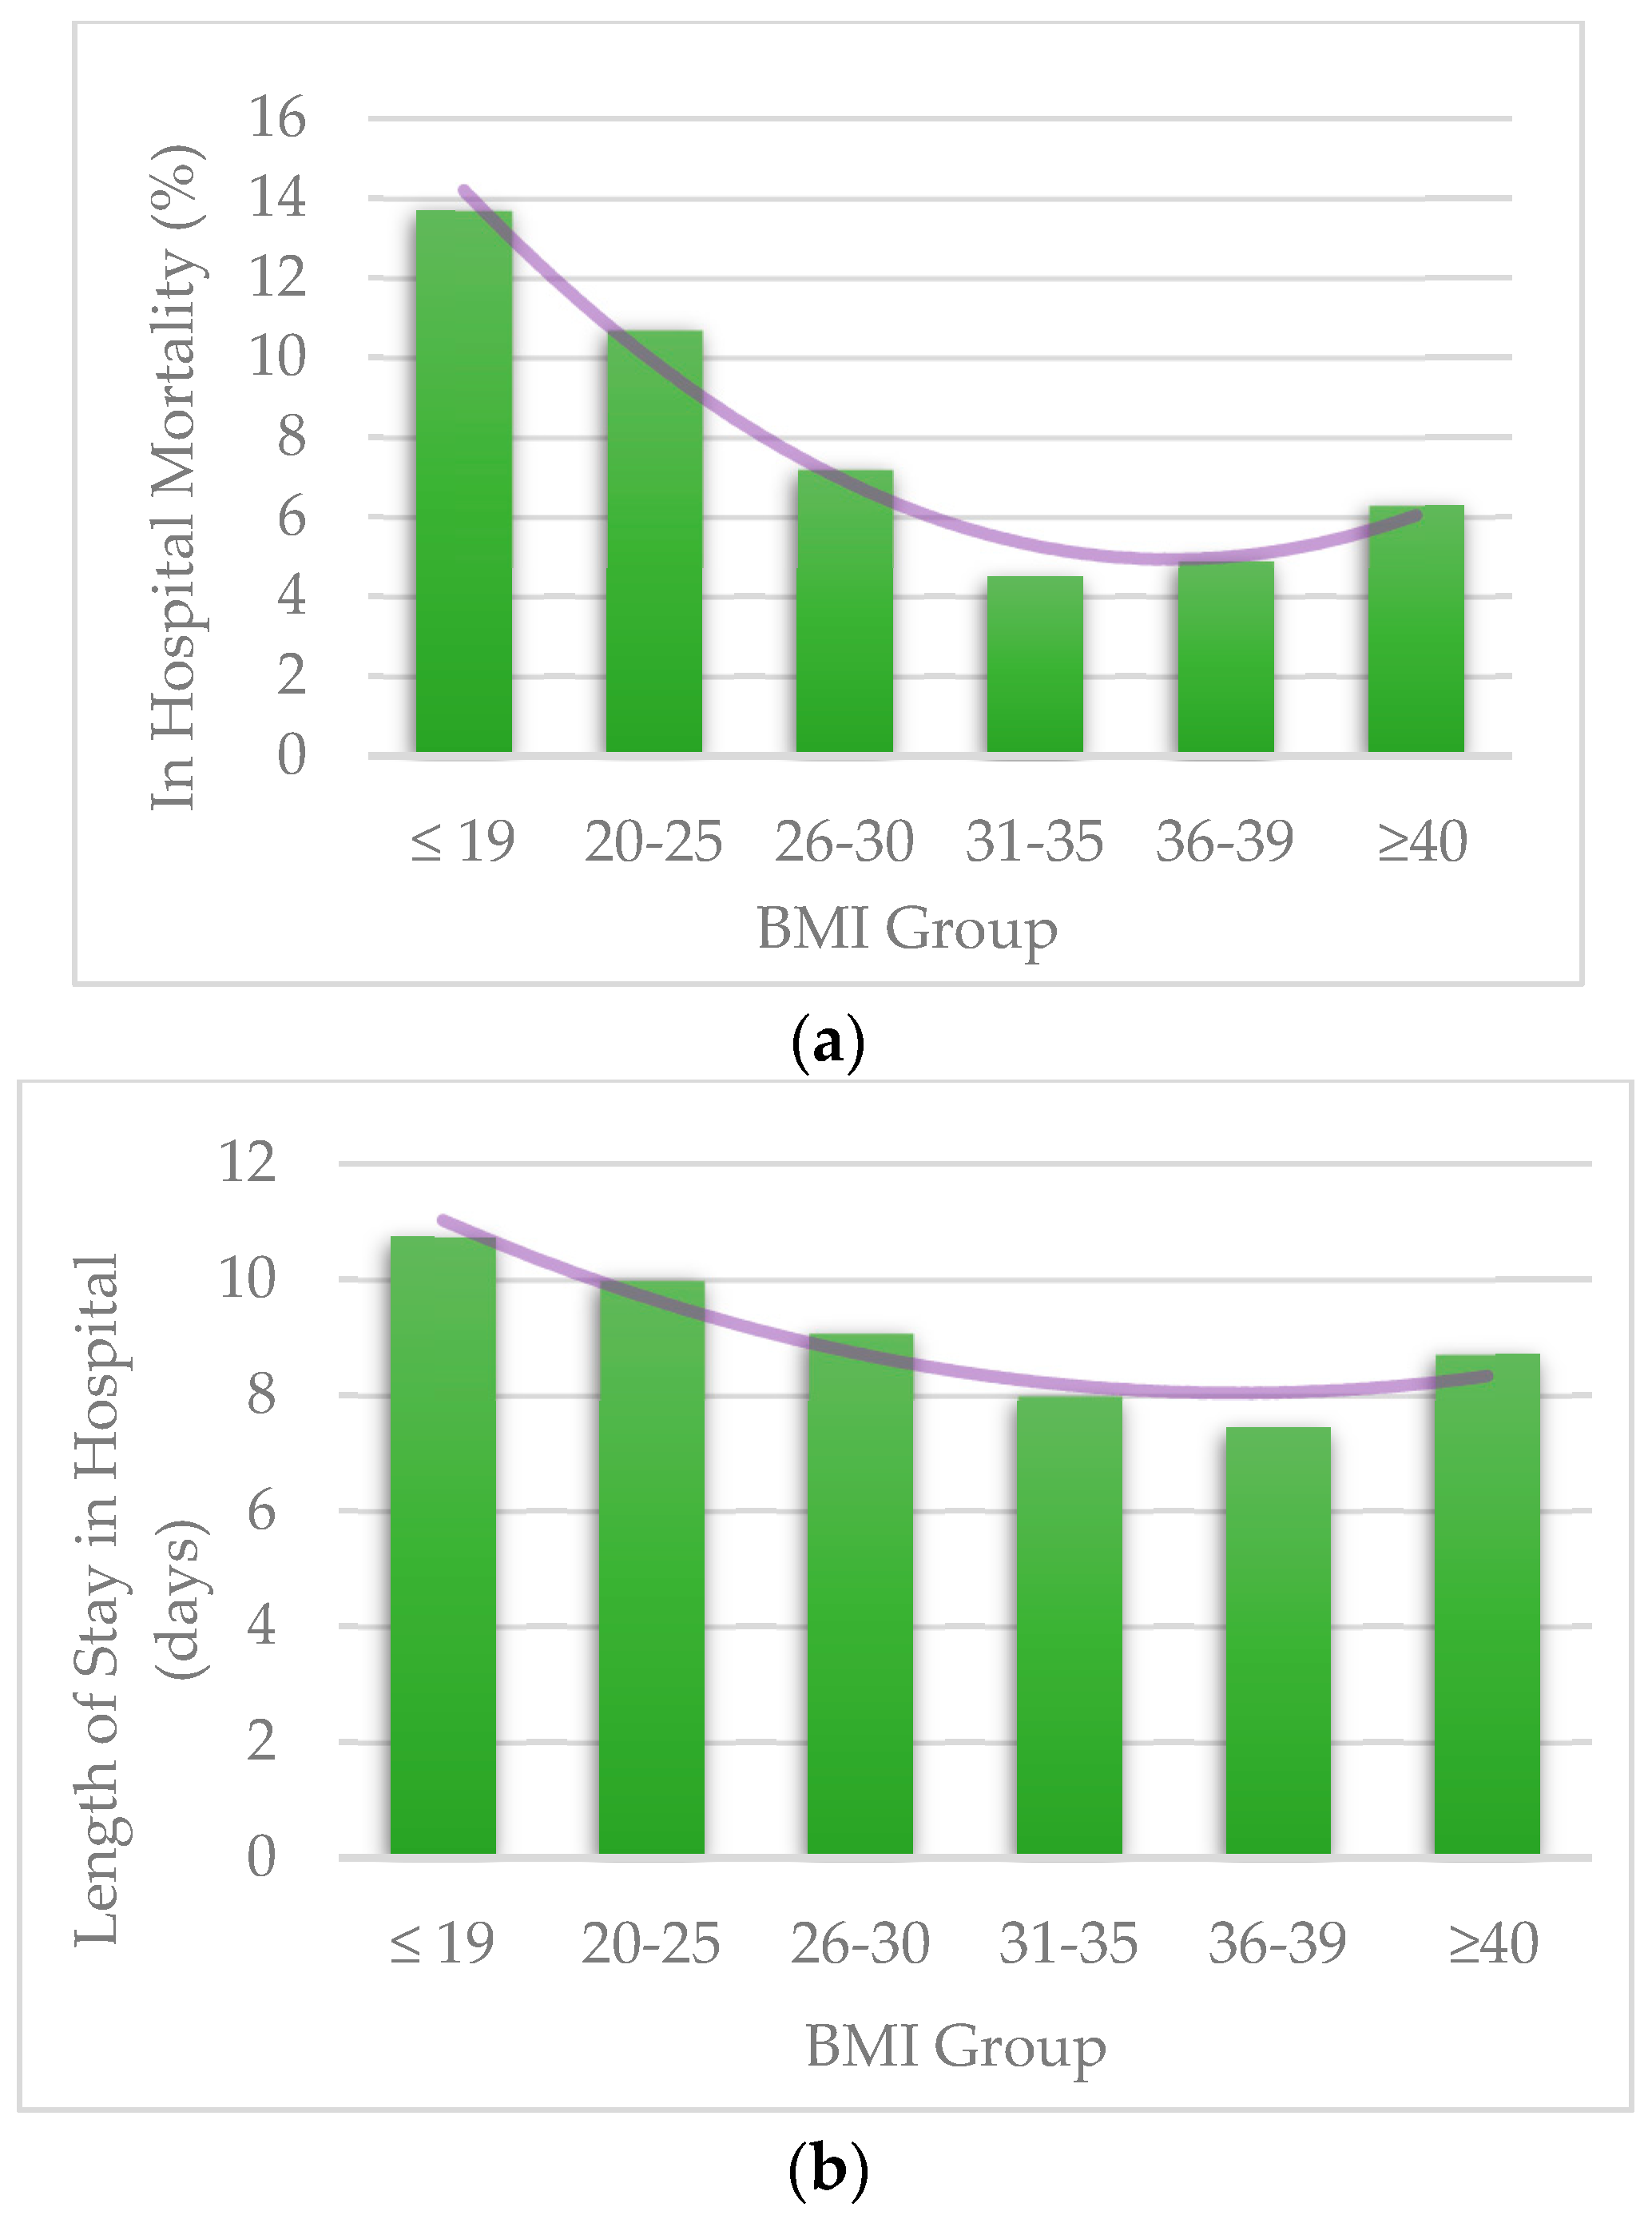
3.3. Length of Stay and Mortality Per BMI Groups
3.4. Predictors of In-Hospital Mortality
3.5. Predictors of Length of Stay in Hospital
4. Discussion
Author Contributions
Funding
Institutional Review Board Statement
Informed Consent Statement
Data Availability Statement
Acknowledgments
Conflicts of Interest
Appendix A

| ICD-10 CM Codes | Condition | Score |
|---|---|---|
| I21.x, I22.x, I25.2 | Myocardial infarction | 1 |
| I09.9, I11.0, I13.0, I13.2, I25.5, I42.0, I42.5-I42.9, I43.x, I50.x, P29.0 | Congestive heart failure | 1 |
| I70.x, I71.x, I73.1, I73.8, I73.9, I77.1, I79.0, I79.2, K55.1, K55.8, K55.9, Z95.8, Z95.9 | Peripheral vascular disease | 1 |
| G45.x, G46.x, H34.0, I60.x-I69.x | Cerebrovascular disease | 1 |
| F00.x-F03.x, F05.1, G30.x, G31.1 | Dementia | 1 |
| I27.8, I27.9, J40.x-J47.x, J60.x-J67.x, J68.4, J70.1, J70.3 | Chronic pulmonary disease | 1 |
| M05.x, M06.x, M31.5, M32.x-M34.x, M35.1, M35.3, M36.0 | Rheumatologic disease | 1 |
| K25.x-K28.x | Peptic ulcer disease | 1 |
| B18.x, K70.0-K70.3, K70.9, K71.3-K71.5, K71.7, K73.x, K74.x, K76.0, K76.2-K76.4, K76.8, K76.9, Z94.4 | Mild liver disease | 1 |
| E10.0, E10.l, E10.6, E10.8, E10.9, E11.0, E11.1, E11.6, E11.8, E11.9, E12.0, E12.1, E12.6, E12.8, E12.9, E13.0, E13.1, E13.6, E13.8, E13.9, E14.0, E14.1, E14.6, E14.8, E14.9 | Diabetes | 1 |
| E10.2-E10.5, E10.7, E11.2-E11.5, E11.7, E12.2-E12.5, E12.7, E13.2-E13.5, E13.7, E14.2-E14.5, E14.7 | Diabetes with chronic complications | 2 |
| G04.1, G11.4, G80.1, G80.2, G81.x, G82.x, G83.0-G83.4, G83.9 | Hemiplegia or paraplegia | 2 |
| I12.0, I13.1, N03.2-N03.7, N05.2-N05.7, N18.x, N19.x, N25.0, Z49.0-Z49.2, Z94.0, Z99.2 | Renal disease | 2 |
| C00.x-C26.x, C30.x-C34.x, C37.x-C41.x, C43.x, C45.x-C58.x, C60.x-C76.x, C81.x-C85.x, C88.x, C90.x-C97.x | Any malignancy including leukemia and lymphoma | 2 |
| I85.0, I85.9, I86.4, I98.2, K70.4, K71.1, K72.1, K72.9, K76.5, K76.6, K76.7 | Moderate or severe liver disease | 3 |
| C77.x-C80.x | Metastatic solid tumor | 6 |
| B20.x-B22.x, B24.x | Acquired Immunodeficiency syndrome (AIDS) | 6 |
| Predictors | Mean (95% CI) | p-Value |
|---|---|---|
| BMI Group | <0.001 | |
| Below 20 | 10.86 (10.53,11.20) | 0.002 |
| 20–25 | 10.09 (9.71,10.46) | N/A |
| 26–30 | 9.00 (8.60,9.40) | <0.001 |
| 31–35 | 7.96 (7.62,8.30) | <0.001 |
| 36–39 | 7.45 (7.06,7.84) | <0.001 |
| 40 and Above | 8.55 (8.34,8.76) | <0.001 |
| Age Group, yrs | <0.001 | |
| 18–44 yrs | 9.56 (9.18,9.94) | N/A |
| 45–59 yrs | 9.44 (9.19,9.70) | 0.623 |
| 60–74 yrs | 8.83 (8.62,9.04) | <0.001 |
| 75 yrs or older | 8.25 (8.00,8.51) | <0.001 |
| Gender | <0.001 | |
| Male | 9.42 (9.22,9.62) | N/A |
| Female | 8.56 (8.39,8.73) | <0.001 |
| Race | <0.001 | |
| Non-white | 9.51 (9.27,9.75) | N/A |
| White | 8.64 (8.48,8.79) | <0.001 |
| Deyo-CCI | <0.001 | |
| 1 | 8.15 (7.84,8.46) | N/A |
| 0 | 7.90 (7.54,8.25) | 0.296 |
| 2 or higher | 9.30 (9.15,9.46) | <0.001 |
| Comorbidities | ||
| Atrial Fibrillation/Flutter | <0.001 | |
| No | 8.65 (8.50,8.79) | N/A |
| Yes | 9.88 (9.61,10.15) | <0.001 |
| Chronic pulmonary disease | 0.052 | |
| No | 9.00 (8.85,9.16) | N/A |
| Yes | 8.72 (8.48,8.96) | 0.052 |
| Congestive heart failure | 0.072 | |
| No | 8.87 (8.73,9.01) | N/A |
| Yes | 9.19 (8.87,9.50) | 0.072 |
| Diabetes Mellitus | <0.001 | |
| No | 9.26 (9.10,9.42) | N/A |
| Yes | 8.31 (8.09,8.53) | <0.001 |
| Hypertension | <0.001 | |
| No | 9.62 (9.46,9.79) | N/A |
| Yes | 7.96 (7.76,8.16) | <0.001 |
| Peripheral vascular disorders | 0.016 | |
| No | 8.87 (8.73,9.01) | N/A |
| Yes | 9.41 (8.99,9.83) | 0.016 |
| Prior MI | <0.001 | |
| No | 8.99 (8.86,9.12) | N/A |
| Yes | 7.62 (7.05,8.19) | <0.001 |
| Renal failure | <0.001 | |
| No | 8.71 (8.56,8.86) | N/A |
| Yes | 9.44 (9.20,9.69) | <0.001 |
| Predictors | Mean (95% CI) | p-Value |
|---|---|---|
| BMI Group | <0.001 | |
| Below 20 | 9.73 (9.34,10.12) | 0.004 |
| 20–25 | 8.98 (8.55,9.41) | N/A |
| 26–30 | 7.91 (7.46,8.36) | <0.001 |
| 31–35 | 6.94 (6.55,7.33) | <0.001 |
| 36–39 | 6.32 (5.88,6.77) | <0.001 |
| 40 and Above | 7.34 (7.05,7.63) | <0.001 |
| Age Group, yrs | <0.001 | |
| 18–44 yrs | 8.56 (8.13,8.99) | N/A |
| 45–59 yrs | 8.38 (8.05,8.71) | 0.458 |
| 60–74 yrs | 7.81 (7.51,8.11) | 0.001 |
| 75 yrs or older | 6.73 (6.40,7.06) | <0.001 |
| Gender | <0.001 | |
| Female | 7.60 (7.34,7.86) | <0.001 |
| Male | 8.14 (7.86,8.43) | N/A |
| Race | 0.076 | |
| Non-white | 8.00 (7.69,8.32) | N/A |
| White | 7.73 (7.50,7.97) | 0.076 |
| Deyo-CCI | <0.001 | |
| 0 | 7.22 (6.82,7.62) | 0.103 |
| 1 | 7.62 (7.27,7.98) | N/A |
| 2 or higher | 8.77 (8.52,9.01) | <0.001 |
| Comorbidities | ||
| Atrial Fibrillation/Flutter | <0.001 | |
| No | 7.64 (7.40,7.88) | N/A |
| Yes | 9.35 (8.98,9.71) | <0.001 |
| Congestive heart failure | 0.033 | |
| No | 7.84 (7.61,8.08) | N/A |
| Yes | 8.24 (7.83,8.66) | 0.033 |
| Chronic pulmonary disease | 0.008 | |
| No | 7.93 (7.69,8.18) | N/A |
| Yes | 7.52 (7.18,7.87) | 0.008 |
| Diabetes Mellitus | <0.001 | |
| No | 8.07 (7.83,8.32) | N/A |
| Yes | 7.12 (6.78,7.45) | <0.001 |
| Hypertension | <0.001 | |
| No | 8.45 (8.18,8.72) | N/A |
| Yes | 7.18 (6.90,7.46) | <0.001 |
| Prior MI | <0.001 | |
| No | 7.90 (7.67,8.14) | N/A |
| Yes | 6.56 (5.93,7.18) | <0.001 |
| Peripheral vascular disorders | 0.154 | |
| No | 7.85 (7.61,8.09) | N/A |
| Yes | 8.18 (7.69,8.67) | 0.154 |
| Renal failure | <0.001 | |
| No | 7.78 (7.54,8.02) | N/A |
| Yes | 8.43 (8.06,8.79) | <0.001 |
References
- Khanna, R.; Wachsberg, K.; Marouni, A.; Feinglass, J.; Williams, M.V.; Wayne, D.B. The Association between Night or Weekend Admission and Hospitalization-Relevant Patient Outcomes. J. Hosp. Med. 2011, 6, 10–14. [Google Scholar] [CrossRef]
- Khan, S.S.; Ning, H.; Wilkins, J.T.; Allen, N.; Carnethon, M.; Berry, J.D.; Sweis, R.N.; Lloyd-Jones, D.M. Association of Body Mass Index With Lifetime Risk of Cardiovascular Disease and Compression of Morbidity. JAMA Cardiol. 2018, 3, 280–287. [Google Scholar] [CrossRef]
- WHO/Europe. Nutrition—Body Mass Index—BMI. Available online: https://www.euro.who.int/en/health-topics/disease-prevention/nutrition/a-healthy-lifestyle/body-mass-index-bmi (accessed on 22 April 2022).
- Twig, G.; Geva, N.; Levine, H.; Derazne, E.; Goldberger, N.; Haklai, Z.; Leiba, A.; Kark, J.D. Body Mass Index and Infectious Disease Mortality in Midlife in a Cohort of 2.3 Million Adolescents. Int. J. Obes. 2017, 42, 801–807. [Google Scholar] [CrossRef] [PubMed]
- Trivedi, V.; Bavishi, C.; Jean, R. Impact of Obesity on Sepsis Mortality: A Systematic Review. J. Crit. Care 2015, 30, 518–524. [Google Scholar] [CrossRef] [PubMed]
- Huttunen, R.; Laine, J.; Lumio, J.; Vuento, R.; Syrjänen, J. Obesity and Smoking Are Factors Associated with Poor Prognosis in Patients with Bacteraemia. BMC Infect. Dis. 2007, 7, 13. [Google Scholar] [CrossRef] [Green Version]
- Pepper, D.J.; Demirkale, C.Y.; Sun, J.; Rhee, C.; Fram, D.; Eichacker, P.; Klompas, M.; Suffredini, A.F.; Kadri, S.S. Does Obesity Protect Against Death in Sepsis? A Retrospective Cohort Study of 55,038 Adult Patients. Crit. Care Med. 2019, 47, 643–650. [Google Scholar] [CrossRef] [PubMed]
- Arabi, Y.M.; Dara, S.I.; Tamim, H.M.; Rishu, A.H.; Bouchama, A.; Khedr, M.K.; Feinstein, D.; Parrillo, J.E.; Wood, K.E.; Keenan, S.P.; et al. Clinical Characteristics, Sepsis Interventions and Outcomes in the Obese Patients with Septic Shock: An International Multicenter Cohort Study. Crit Care 2013, 17, R72. [Google Scholar] [CrossRef] [PubMed] [Green Version]
- Prescott, H.C.; Chang, V.W.; O’Brien, J.M.; Langa, K.M.; Iwashyna, T.J. Obesity and One-Year Outcomes in Older Americans with Severe Sepsis. Crit. Care Med. 2014, 42, 1766. [Google Scholar] [CrossRef]
- HCUP-US NIS Overview. Available online: https://www.hcup-us.ahrq.gov/nisoverview.jsp (accessed on 22 April 2022).
- Steiner, C.; Elixhauser, A.; Schnaier, J. The Healthcare Cost and Utilization Project: An Overview DATABASE. Healthcare Cost and Utilization Project (HCUP)-a Family of Databases Including the State Inpatient Databases (SID), the Nationwide Inpatient Sample (NIS), the Kids’ Inpatient Database (KID), and the Outpatient Databases State Ambulatory Surgery Data (SASD) and State Emergency Department Data (SEDD). SPECIAL TOPIC. Eff. Clin. Pract. 1988, 5, 143–151. [Google Scholar]
- Rozen, G.; Elbaz-Greener, G.; Marai, I.; Heist, E.K.; Ruskin, J.N.; Carasso, S.; Birati, E.Y.; Amir, O. The Relationship between the Body Mass Index and In-Hospital Mortality in Patients Admitted for Sudden Cardiac Death in the United States. Clin. Cardiol. 2021, 44, 1673–1682. [Google Scholar] [CrossRef]
- Elbaz-Greener, G.; Rozen, G.; Carasso, S.; Kusniec, F.; Marai, I.; Sud, M.; Strauss, B.; Smart, F.W.; Planer, D.; Amir, O. The Relationship between Body Mass Index and In-Hospital Mortality in the Contemporary Era of an Acute Myocardial Infarction Management. Vasc. Health Risk Manag. 2021, 17, 551–559. [Google Scholar] [CrossRef] [PubMed]
- Rozen, G.; Elbaz-Greener, G.; Margolis, G.; Marai, I.; Heist, E.K.; Ruskin, J.N.; Carasso, S.; Roguin, A.; Birati, E.Y.; Amir, O. The Obesity Paradox in Real-World Nation-Wide Cohort of Patients Admitted for a Stroke in the U.S. J. Clin. Med. 2022, 11, 1678. [Google Scholar] [CrossRef] [PubMed]
- Elbaz-Greener, G.; Rozen, G.; Carasso, S.; Kusniec, F.; Yarkoni, M.; Marai, I.; Strauss, B.; Wijeysundera, H.C.; Smart, F.W.; Erez, E.; et al. The Relationship Between Body Mass Index and In-Hospital Mortality in Patients Following Coronary Artery Bypass Grafting Surgery. Front. Cardiovasc. Med. 2021, 8, 754934. [Google Scholar] [CrossRef]
- Deyo, R.A.; Cherkin, D.C.; Ciol, M.A. Adapting a Clinical Comorbidity Index for Use with ICD-9-CM Administrative Databases. J. Clin. Epidemiol. 1992, 45, 613–619. [Google Scholar] [CrossRef]
- Chu, Y.T.; Ng, Y.Y.; Wu, S.C. Comparison of Different Comorbidity Measures for Use with Administrative Data in Predicting Short- and Long-Term Mortality. BMC Health Serv. Res. 2010, 10, 140. [Google Scholar] [CrossRef] [Green Version]
- Radovanovic, D.; Seifert, B.; Urban, P.; Eberli, F.R.; Rickli, H.; Bertel, O.; Puhan, M.A.; Erne, P. Validity of Charlson Comorbidity Index in Patients Hospitalised with Acute Coronary Syndrome. Insights from the Nationwide AMIS Plus Registry 2002–2012. Heart 2014, 100, 288–294. [Google Scholar] [CrossRef] [PubMed] [Green Version]
- HCUP Methods Series Nationwide Inpatient Sample (NIS) Redesign Final Report Report # 2014-04. Available online: https://hcup-us.ahrq.gov/reports/methods/2014-04.pdf (accessed on 11 January 2022).
- Wacharasint, P.; Boyd, J.H.; Russell, J.A.; Walley, K.R. One Size Does Not Fit All in Severe Infection: Obesity Alters Outcome, Susceptibility, Treatment, and Inflammatory Response. Crit. Care 2013, 17, R122. [Google Scholar] [CrossRef] [Green Version]
- Harris, K.; Zhou, J.; Liu, X.; Hassan, E.; Badawi, O. The Obesity Paradox Is Not Observed in Critically III Patients on Early Enteral Nutrition. Crit. Care Med. 2017, 45, 828–834. [Google Scholar] [CrossRef] [PubMed]
- Ward, M.A.; Kuttab, H.I.; Lykins, V.J.D.; Wroblewski, K.; Hughes, M.D.; Keast, E.P.; Kopec, J.A.; Rourke, E.M.; Purakal, J. The Effect of Body Mass Index and Weight-Adjusted Fluid Dosing on Mortality in Sepsis. J. Intensive Care Med. 2022, 37, 83–91. [Google Scholar] [CrossRef]
- Peterson, S.J.; Braunschweig, C.A. Prevalence of Sarcopenia and Associated Outcomes in the Clinical Setting. Nutr. Clin. Pract. 2016, 31, 40–48. [Google Scholar] [CrossRef] [Green Version]
- Oh, H.J.; Kim, J.H.; Kim, H.R.; Ahn, J.Y.; Jeong, S.J.; Ku, N.S.; Choi, J.Y.; Yeom, J.S.; Song, Y.G. The Impact of Sarcopenia on Short-Term and Long-Term Mortality in Patients with Septic Shock. J. Cachexia Sarcopenia Muscle 2022, 13, 2054–2063. [Google Scholar] [CrossRef] [PubMed]
- Martin, L.; Birdsell, L.; MacDonald, N.; Reiman, T.; Clandinin, M.T.; McCargar, L.J.; Murphy, R.; Ghosh, S.; Sawyer, M.B.; Baracos, V.E. Cancer Cachexia in the Age of Obesity: Skeletal Muscle Depletion Is a Powerful Prognostic Factor, Independent of Body Mass Index. J. Clin. Oncol. 2013, 31, 1539–1547. [Google Scholar] [CrossRef] [PubMed]
- Moisey, L.L.; Mourtzakis, M.; Cotton, B.A.; Premji, T.; Heyland, D.K.; Wade, C.E.; Bulger, E.; Kozar, R.A. Skeletal Muscle Predicts Ventilator-Free Days, ICU-Free Days, and Mortality in Elderly ICU Patients. Crit. Care 2013, 17, R206. [Google Scholar] [CrossRef] [PubMed] [Green Version]

| BMI, n | ≤19 | 20–25 | 26–30 | 31–35 | 36–39 | >40 | Total | p-Value |
|---|---|---|---|---|---|---|---|---|
| Unweighted | 2888 | 2234 | 1852 | 2519 | 1890 | 6769 | 18,152 | |
| Weighted | 14,440 | 11,170 | 9260 | 12,595 | 9450 | 33,845 | 90,760 | |
| Age Group, % | <0.001 | |||||||
| 18–44 yrs | 10.9 | 9.2 | 7.9 | 10.6 | 11.0 | 13.3 | 11.3 | |
| 45–59 yrs | 19.1 | 19.2 | 21.2 | 21.1 | 25.0 | 30.6 | 24.5 | |
| 60–74 yrs | 29.5 | 31.0 | 38.0 | 40.8 | 42.4 | 42.3 | 38.2 | |
| 75 yrs or older | 40.5 | 40.5 | 32.9 | 27.4 | 21.6 | 13.8 | 26.0 | |
| Gender, % | <0.001 | |||||||
| Female | 52.4 | 44.7 | 53.5 | 55.1 | 58.4 | 64.4 | 57.0 | |
| Male | 47.6 | 55.1 | 46.4 | 44.9 | 41.5 | 35.5 | 42.9 | |
| Race, % | <0.001 | |||||||
| White | 61.1 | 62.7 | 62.7 | 64.2 | 66.3 | 69.4 | 65.5 | |
| Non-white | 33.1 | 30.4 | 31.2 | 29.1 | 26.9 | 25.0 | 28.4 | |
| Comorbidity, % | ||||||||
| Hypertension | 31.5 | 35.8 | 42.2 | 45.3 | 48.0 | 43.4 | 41.2 | <0.001 |
| Congestive Heart Failure | 12.9 | 12.0 | 13.4 | 15.4 | 17.7 | 21.7 | 17.0 | <0.001 |
| Diabetes Mellitus | 14.8 | 20.1 | 30.8 | 39.1 | 42.4 | 44.9 | 34.6 | <0.001 |
| Renal Failure | 22.5 | 24.9 | 29.9 | 31.3 | 29.6 | 32.4 | 29.2 | <0.001 |
| Chronic Pulmonary Disease | 30.5 | 19.4 | 23.7 | 25.2 | 29.5 | 32.4 | 28.3 | <0.001 |
| Peripheral Vascular Disorders | 9.7 | 9.8 | 10.5 | 10.5 | 10.1 | 8.5 | 9.5 | <0.001 |
| Atrial Fibrillation/Flutter | 20.6 | 22.1 | 21.6 | 23.0 | 23.1 | 24.8 | 23.0 | <0.001 |
| Prior MI | 3.8 | 4.7 | 5.3 | 7.1 | 5.8 | 4.7 | 5.1 | <0.001 |
| VT/VF | 2.4 | 1.8 | 1.9 | 2.0 | 1.6 | 2.3 | 2.1 | <0.001 |
| Deyo-CCI, % | <0.001 | |||||||
| 0 | 12.7 | 12.7 | 13.6 | 13.4 | 13.1 | 12.1 | 12.7 | |
| 1 | 15.9 | 15.2 | 15.7 | 18.4 | 18.5 | 16.6 | 16.7 | |
| 2 or higher | 71.4 | 72.2 | 70.7 | 68.2 | 68.5 | 71.3 | 70.6 | |
| Mortality, % | 13.7 | 10.7 | 7.2 | 4.5 | 4.9 | 6.3 | 7.7 | <0.0001 |
| Length of Stay (days), Mean + SEM | 10.74 ± 0.21 | 9.99 ± 0.19 | 9.08 ± 0.19 | 7.99 ± 0.16 | 7.45 ± 0.16 | 8.71 ± 0.11 | 9.00 ± 0.07 | <0.0001 |
| Predictors | Odds Ratio (95% CI) | p-Value |
|---|---|---|
| Age Group, yrs | <0.001 | |
| 18–44 yrs | 1.00 (reference) | N/A |
| 45–59 yrs | 1.31 (1.18,1.46) | <0.001 |
| 60–74 yrs | 1.73 (1.57,1.91) | <0.001 |
| 75 yrs or older | 2.28 (2.06,2.52) | <0.001 |
| BMI Group | <0.001 | |
| Below 20 | 1.33 (1.23,1.43) | <0.001 |
| 20–25 | 1.00 (reference) | N/A |
| 26–30 | 0.65 (0.58,0.71) | <0.001 |
| 31–35 | 0.39 (0.35,0.43) | <0.001 |
| 36–39 | 0.43 (0.39,0.48) | <0.001 |
| 40 and above | 0.56 (0.52,0.61) | <0.001 |
| Deyo-CCI | <0.001 | |
| 1 | 1.00 (reference) | N/A |
| 0 | 0.83 (0.73,0.93) | 0.001 |
| 2 or higher | 1.85 (1.72,2.00) | <0.001 |
| Gender | <0.001 | |
| Male | 1.00 (reference) | N/A |
| Female | 0.78 (0.75,0.82) | <0.001 |
| Race | <0.001 | |
| Non-white | 1.00 (reference) | N/A |
| White | 0.85 (0.80,0.89) | <0.001 |
| Comorbidities | ||
| Atrial Fibrillation/Flutter | <0.001 | |
| No | 1.00 (reference) | N/A |
| Yes | 1.69 (1.61,1.79) | <0.001 |
| Chronic pulmonary disease | <0.001 | |
| No | 1.00 (reference) | N/A |
| Yes | 0.90 (0.85,0.95) | <0.001 |
| Congestive heart failure | <0.001 | |
| No | 1.00 (reference) | N/A |
| Yes | 1.28 (1.20,1.36) | <0.001 |
| Diabetes Mellitus | <0.001 | |
| No | 1.00 (reference) | N/A |
| Yes | 0.66 (0.63,0.70) | <0.001 |
| Hypertension | <0.001 | |
| No | 1.00 (reference) | N/A |
| Yes | 0.58 (0.55,0.62) | <0.001 |
| Peripheral vascular disorders | 0.697 | |
| No | 1.00 (reference) | N/A |
| Yes | 1.02 (0.94,1.10) | 0.697 |
| Renal failure | <0.001 | |
| No | 1.00 (reference) | N/A |
| Yes | 1.36 (1.29,1.43) | <0.001 |
| Predictors | Odds Ratio (95% CI) | p-Value |
|---|---|---|
| Age Group, yrs | <0.001 | |
| 18–44 yrs | 1.00 (reference) | N/A |
| 45–59 yrs | 1.27 (1.13,1.43) | <0.001 |
| 60–74 yrs | 1.72 (1.54,1.92) | <0.001 |
| 75 yrs or older | 1.91 (1.70,2.14) | <0.001 |
| BMI Group | <0.001 | |
| Below 20 | 1.35 (1.25,1.47) | <0.001 |
| 20–25 | 1.00 (reference) | N/A |
| 26–30 | 0.66 (0.59,0.73) | <0.001 |
| 31–35 | 0.42 (0.38,0.47) | <0.001 |
| 36–39 | 0.48 (0.43,0.54) | <0.001 |
| 40 and above | 0.66 (0.61,0.72) | <0.001 |
| Gender | <0.001 | |
| Male | 1.00 (reference) | N/A |
| Female | 0.84 (0.80,0.89) | <0.001 |
| Race | 0.004 | |
| Non-white | 1.00 (reference) | N/A |
| White | 0.92 (0.87,0.97) | 0.004 |
| Deyo-CCI | <0.001 | |
| 1 | 1.00 (reference) | N/A |
| 0 | 0.91 (0.81,1.03) | 0.149 |
| 2 or higher | 1.74 (1.60,1.89) | <0.001 |
| Comorbidities | ||
| Atrial Fibrillation/Flutter | <0.001 | |
| No | 1.00 (reference) | N/A |
| Yes | 1.58 (1.49,1.67) | <0.001 |
| Congestive heart failure | 0.006 | |
| No | 1.00 (reference) | N/A |
| Yes | 1.10 (1.03,1.17) | 0.006 |
| Chronic pulmonary disease | <0.001 | |
| No | 1.00 (reference) | N/A |
| Yes | 0.82 (0.77,0.87) | <0.001 |
| Diabetes Mellitus | <0.001 | |
| No | 1.00 (reference) | N/A |
| Yes | 0.66 (0.62,0.70) | <0.001 |
| Hypertension | <0.001 | |
| No | 1.00 (reference) | N/A |
| Yes | 0.69 (0.65,0.73) | <0.001 |
| Peripheral vascular disease | <0.001 | |
| No | 1.00 (reference) | N/A |
| Yes | 0.80 (0.73,0.87) | <0.001 |
| Renal failure | <0.001 | |
| No | 1.00 (reference) | N/A |
| Yes | 1.15 (1.08,1.22) | <0.001 |
Disclaimer/Publisher’s Note: The statements, opinions and data contained in all publications are solely those of the individual author(s) and contributor(s) and not of MDPI and/or the editor(s). MDPI and/or the editor(s) disclaim responsibility for any injury to people or property resulting from any ideas, methods, instructions or products referred to in the content. |
© 2023 by the authors. Licensee MDPI, Basel, Switzerland. This article is an open access article distributed under the terms and conditions of the Creative Commons Attribution (CC BY) license (https://creativecommons.org/licenses/by/4.0/).
Share and Cite
Lebovitz, S.; Rozen, G.; Abu Ghosh, Z.; Korem, M.; Elinav, H.; Zayyad, H.; Carasso, S.; Planer, D.; Amir, O.; Elbaz-Greener, G. The Relationship between Body Mass Index and In-Hospital Mortality in Bacteremic Sepsis. J. Clin. Med. 2023, 12, 3848. https://doi.org/10.3390/jcm12113848
Lebovitz S, Rozen G, Abu Ghosh Z, Korem M, Elinav H, Zayyad H, Carasso S, Planer D, Amir O, Elbaz-Greener G. The Relationship between Body Mass Index and In-Hospital Mortality in Bacteremic Sepsis. Journal of Clinical Medicine. 2023; 12(11):3848. https://doi.org/10.3390/jcm12113848
Chicago/Turabian StyleLebovitz, Shalom, Guy Rozen, Zahi Abu Ghosh, Maya Korem, Hila Elinav, Hiba Zayyad, Shemy Carasso, David Planer, Offer Amir, and Gabby Elbaz-Greener. 2023. "The Relationship between Body Mass Index and In-Hospital Mortality in Bacteremic Sepsis" Journal of Clinical Medicine 12, no. 11: 3848. https://doi.org/10.3390/jcm12113848