
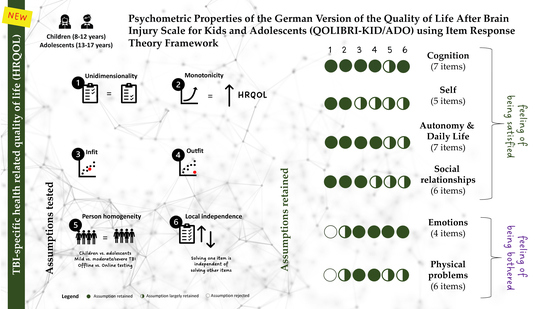
Psychometric Properties of the German Version of the Quality of Life after Brain Injury Scale for Kids and Adolescents (QOLIBRI-KID/ADO) Using Item Response Theory Framework: Results from the Pilot Study

 , , , , , ,
Abstract
:
1. Introduction
2. Materials and Methods
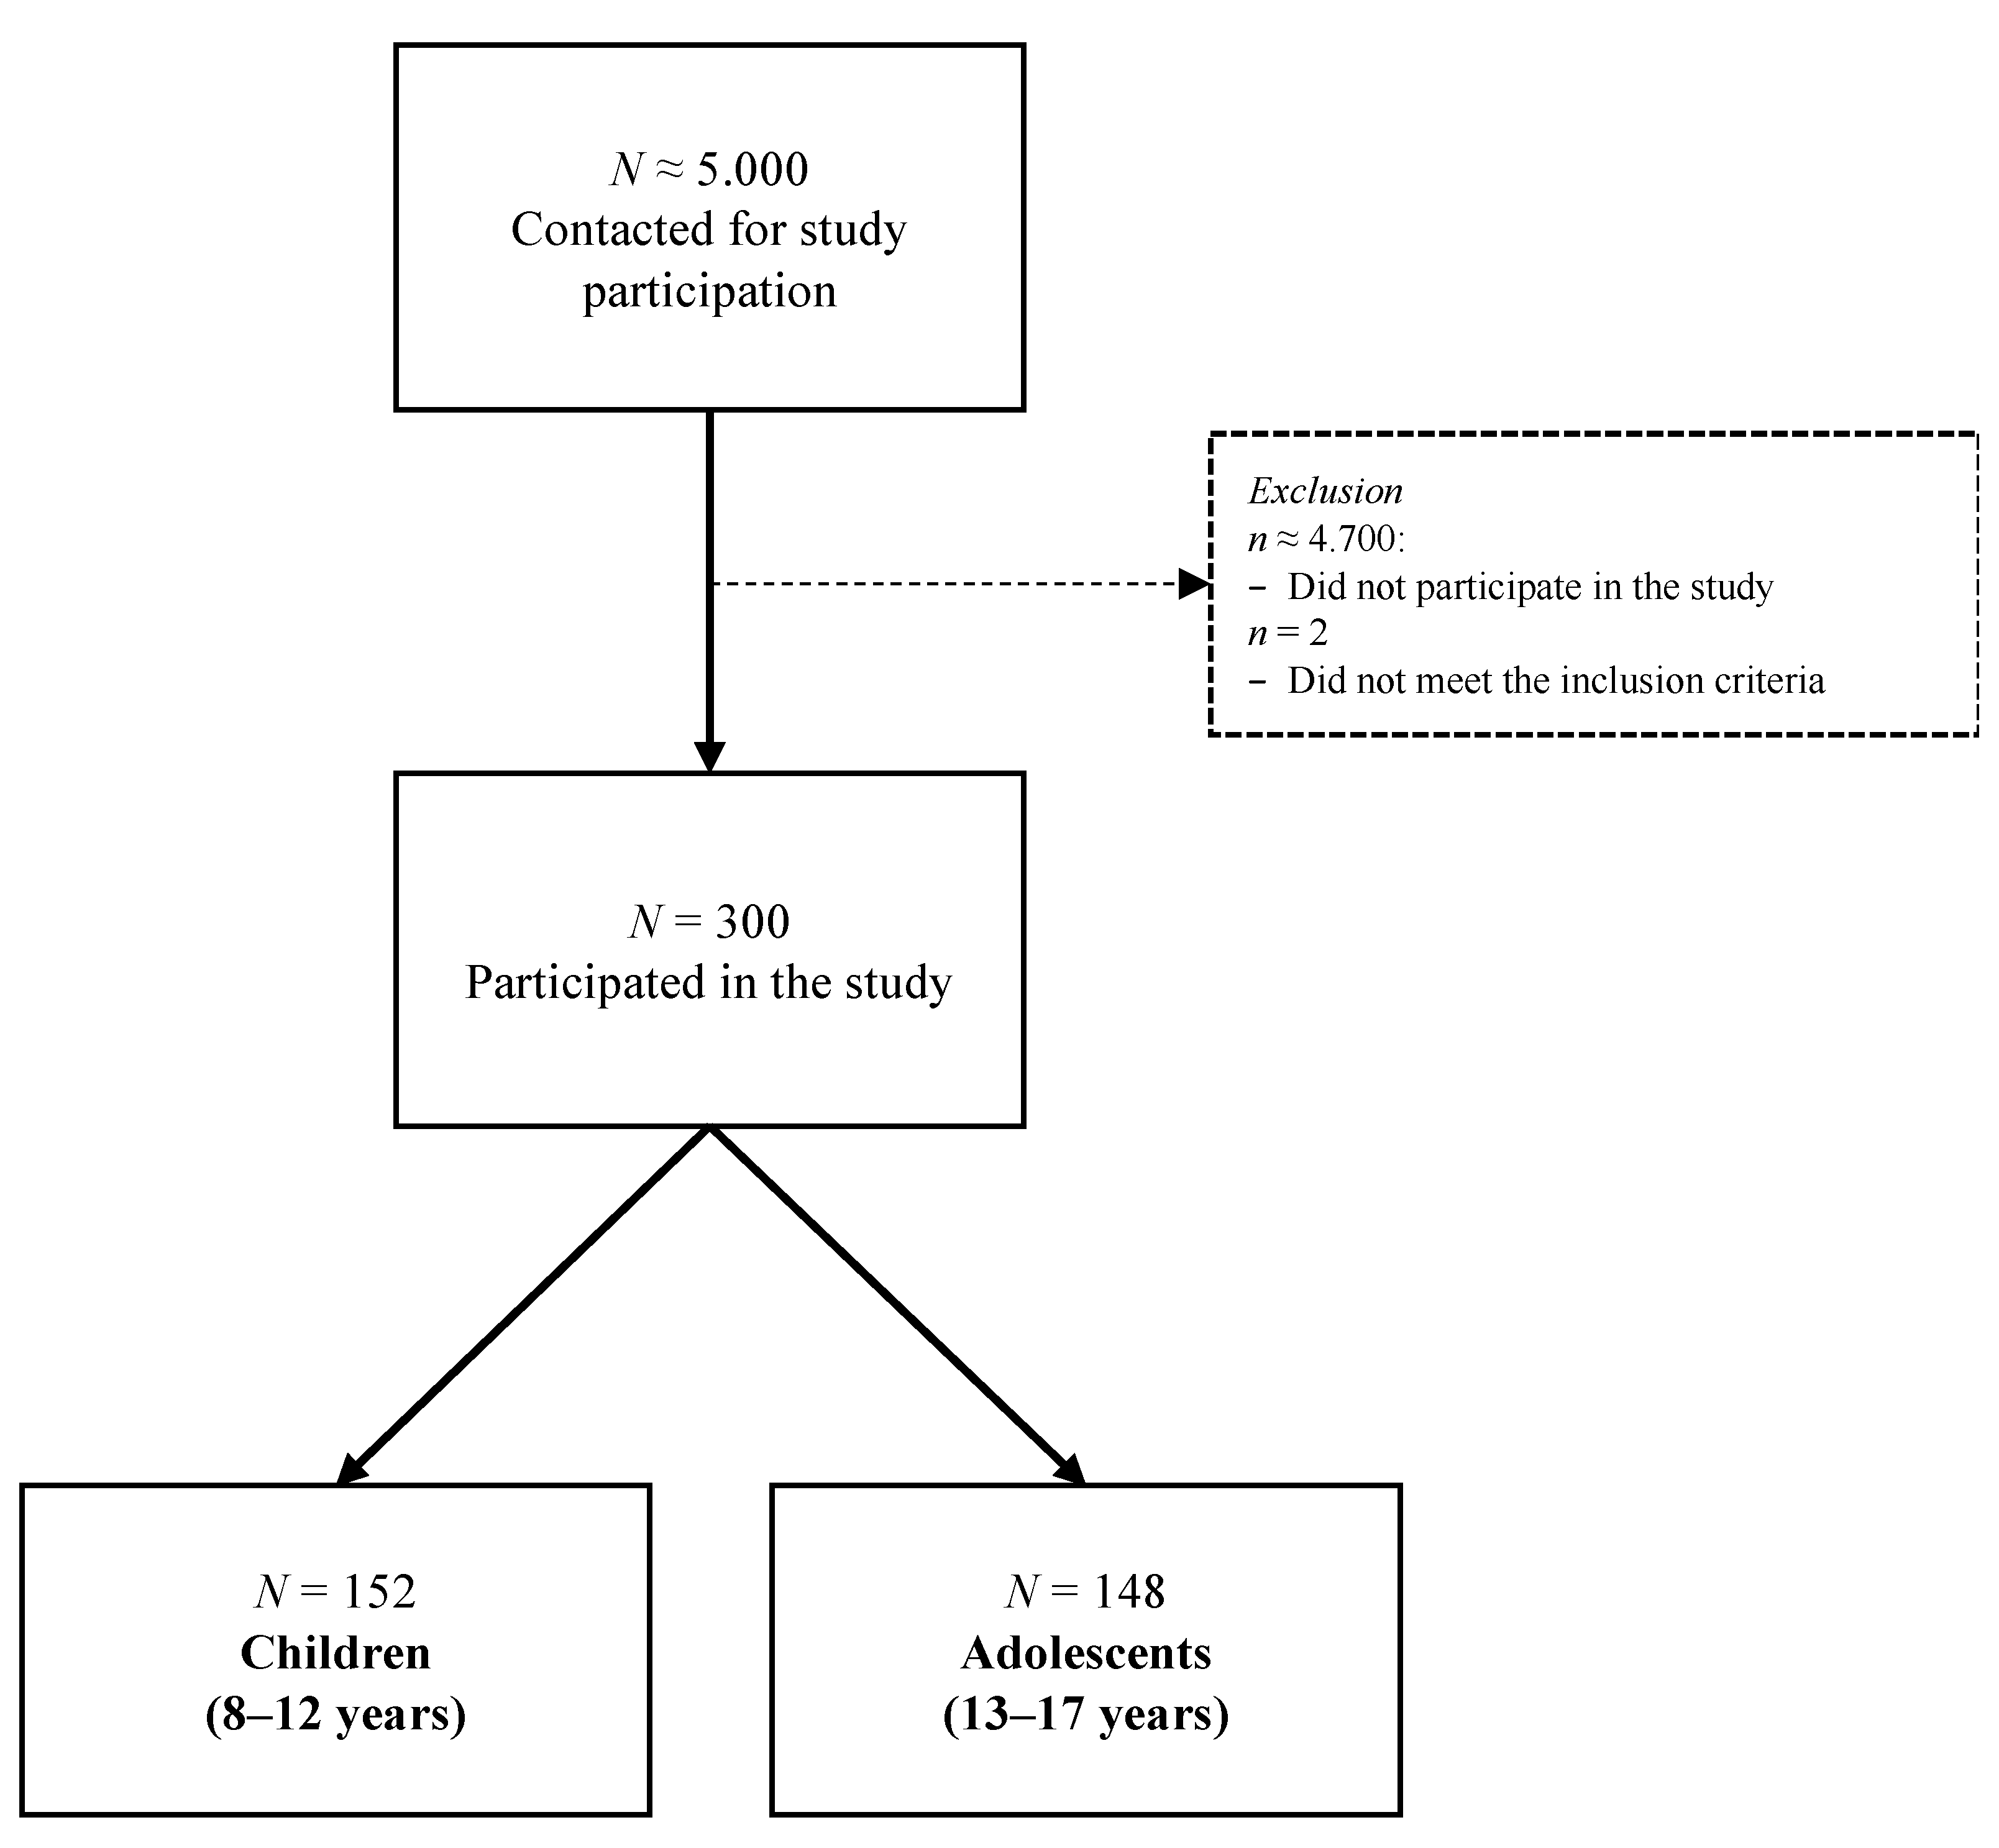
2.1. Participants
2.2. Ethical Approval
2.3. Sociodemographic and Injury-Related Data
2.4. QOLIBRI-Kid/Ado
2.5. Statistical Analyses
3. Results
3.1. Sample Characteristics
3.2. Response Behavior
3.3. Threshold Disorder
3.4. Unidimensionality
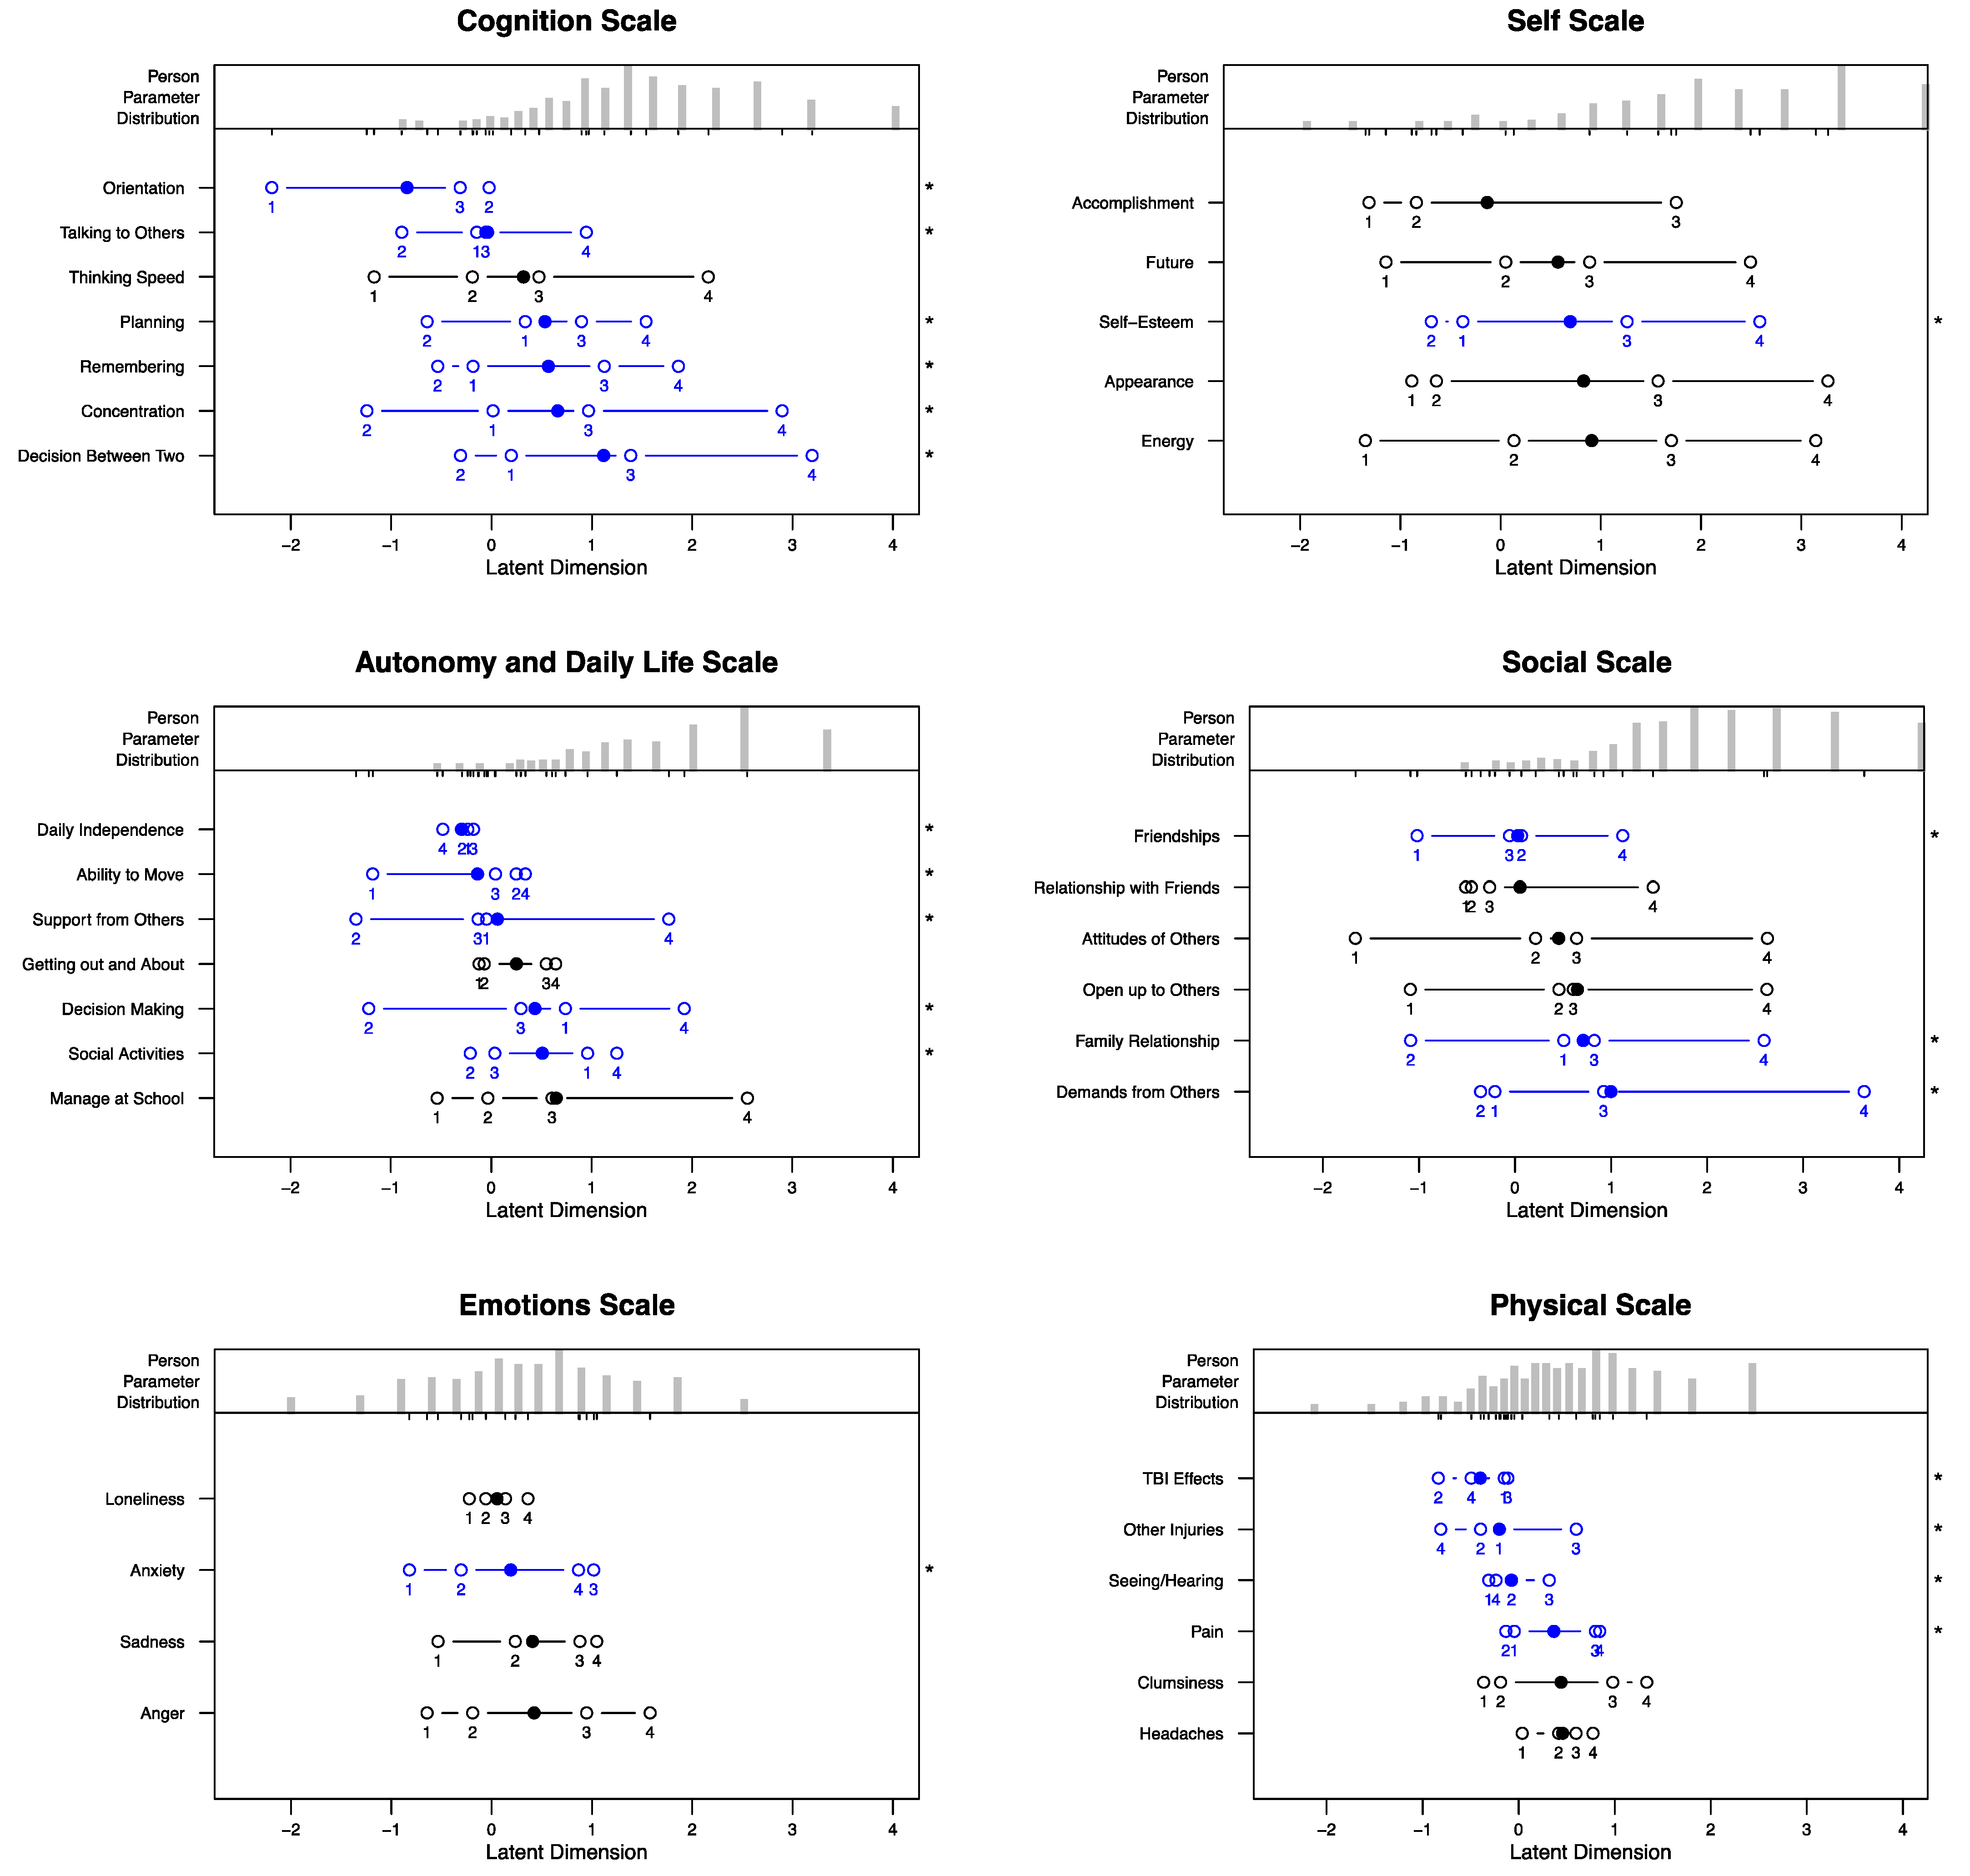
3.5. Monotonicity
3.6. Item Fit Statistics
3.7. Person Homogeneity and DIF
3.8. Local Independence
4. Discussion
4.1. Strengths and Limitations
4.2. Future Perspectives
5. Conclusions
Supplementary Materials
Author Contributions
Funding
Institutional Review Board Statement
Informed Consent Statement
Data Availability Statement
Acknowledgments
Conflicts of Interest
Appendix A. QOLIBRI-KID/ADO Items

| Part | Type | Scale Label | Scale Title | Item # | Item Label | Item Text (Original: German) | Item Text (English) * | Item Abbreviation |
|---|---|---|---|---|---|---|---|---|
| 1 | S | A | Cognition | 1 | A1 | wie Du Dich in der Schule konzentrieren kannst? | how you are able to concentrate at school? | Concentration |
| 1 | S | A | Cognition | 2 | A2 | wie Du mit anderen reden kannst? | how you can talk with others? | Talking to Others |
| 1 | S | A | Cognition | 3 | A3 | wie Du Dich an etwas erinnern kannst (zum Beispiel, was Du im Unterricht gemacht hast)? | how you are able to remember things (for example, what you did in class)? | Remembering |
| 1 | S | A | Cognition | 4 | A4 | wie Du Deine Hausaufgaben und Freizeit (zum Beispiel Sport) planst? | how you plan your homework and leisure time (for example, sports)? | Planning |
| 1 | S | A | Cognition | 5 | A5 | wie Du Dich zwischen zwei Dingen entscheiden kannst, wenn Du auswählen musst? | how you are able to decide between two things when you have to choose? | Decision between Two |
| 1 | S | A | Cognition | 6 | A6 | wie Du Dich zurechtfindest (zum Beispiel den Weg zur Schule findest)? | how you are able to find your way around (for example, finding your way to school)? | Orientation |
| 1 | S | A | Cognition | 7 | A7 | wie schnell Du denken kannst (zum Beispiel, wie lange Du nachdenken musst, um eine Antwort zu geben)? | how fast you are able to think (for example, how long you have to think to give an answer)? | Thinking Speed |
| 1 | S | B | Self | 8 | B1 | mit Deiner Energie (zum Beispiel, wie Du in der letzten Schulstunde mitmachen kannst)? | with your energy (for example, how you are able to participate in the last lesson of the day)? | Energy |
| 1 | S | B | Self | 9 | B2 | damit, wie Du etwas hinbekommst? | with how you manage to do something? | Accomplishment |
| 1 | S | B | Self | 10 | B3 | damit, wie Du aussiehst? | with the way you look? | Appearance |
| 1 | S | B | Self | 11 | B4 | mit Dir, so wie Du bist? | with yourself as you are? | Self-Esteem |
| 1 | S | B | Self | 12 | B5 | damit, wie Du Dir Deine Zukunft vorstellst? | with how you imagine your future? | Future |
| 1 | S | C | Autonomy & Daily Life | 13 | C1 | ohne Hilfe Dinge zu tun, die Du jeden Tag machst (zum Beispiel Dich anzuziehen)? | being able to do things you do every day without help (for example, getting dressed)? | Daily Independence |
| 1 | S | C | Autonomy & Daily Life | 14 | C2 | wie Du draußen unterwegs sein kannst? | how you are able to be out and about? | Getting out and About |
| 1 | S | C | Autonomy & Daily Life | 15 | C3 | wie Du in der Schule zurechtkommst? | how you manage at school? | Manage at school |
| 1 | S | C | Autonomy & Daily Life | 16 | C4 | wie Du mit Deinen Freunden spielen/etwas unternehmen kannst? | how you are able to play/do things with your friends? | Social Activities |
| 1 | S | C | Autonomy & Daily Life | 17 | C5 | zu entscheiden, was Du nach dem Schultag machen möchtest? | deciding what you want to do after the school day is over? | Decision Making |
| 1 | S | C | Autonomy & Daily Life | 18 | C6 | wie andere Dich unterstützen oder Dir helfen? | how others support or help you? | Support from Others |
| 1 | S | C | Autonomy & Daily Life | 19 | C7 | wie Du Dich bewegen kannst (zum Beispiel zu gehen, zu rennen, mit dem Rollstuhl zu fahren)? | how you are able to move around (for example, walk, run, use a wheelchair)? | Ability to Move |
| 1 | S | D | Social Relationships | 20 | D1 | wie Du Dich anderen anvertrauen kannst? | how you are able to confide in others? | Open up to Others |
| 1 | S | D | Social Relationships | 21 | D2 | wie Du Dich mit Deiner Familie verträgst? | how you get along with your family? | Family Relationship |
| 1 | S | D | Social Relationships | 22 | D3 | wie Du Dich mit Deinen Freunden verträgst? | how you get along with your friends? | Relationship with Friends |
| 1 | S | D | Social Relationships | 23 | D4 | wie Du mit jemandem befreundet bleiben kannst? | how you are able to stay friends with someone? | Friendships |
| 1 | S | D | Social Relationships | 24 | D5 | wie andere Dich behandeln? | how others treat you? | Attitudes of Others |
| 1 | S | D | Social Relationships | 25 | D6 | was andere von Dir verlangen? | what others demand of you? | Demands from Others |
| 2 | B | E | Emotions | 26 | E1 | Dich einsam zu fühlen, selbst wenn andere bei Dir sind? | feeling lonely even though you are with other people? | Loneliness |
| 2 | B | E | Emotions | 27 | E2 | ängstlich zu sein? | feeling anxious? | Anxiety |
| 2 | B | E | Emotions | 28 | E3 | traurig zu sein? | feeling sad? | Sadness |
| 2 | B | E | Emotions | 29 | E4 | wütend zu werden? | getting angry? | Anger |
| 2 | B | F | Physical Problems | 30 | F1 | wenn Du ungeschickt bist (zum Beispiel, wenn Du stolperst, Dir etwas runterfällt)? | being clumsy (for example, when you trip or drop something)? | Clumsiness |
| 2 | B | F | Physical Problems | 31 | F2 | andere Verletzungen, die Du gleichzeitig bei Deinem Unfall/Deiner Hirnverletzung abbekommen hast? | other injuries you got at the same time as your accident/brain injury? | Other Injuries |
| 2 | B | F | Physical Problems | 32 | F3 | Kopfschmerzen? | headaches? | Headaches |
| 2 | B | F | Physical Problems | 33 | F4 | andere Schmerzen (außer Kopfschmerzen)? | other pain (apart from headaches)? | Pain |
| 2 | B | F | Physical Problems | 34 | F5 | Probleme beim Sehen/Hören? | problems seeing/hearing? | Seeing/Hearing |
| 2 | B | F | Physical Problems | 35 | F6 | Veränderungen in Deinem Leben nach Deinem Unfall/Deiner Hirnverletzung? | changes in your life after your accident/brain injury? | TBI Effects |
Appendix B. Response Behavior
| Cognition | Age Group | TBI Severity | Study Setting | ||||||
|---|---|---|---|---|---|---|---|---|---|
| Children | Adolescents | Mild | Moderate | Severe | Offline | Online | Total | ||
| Item | Response | (N = 152) | (N = 148) | (N = 215) | (N = 25) | (N = 60) | (N = 224) | (N = 76) | (N = 300) |
| Concentration | not at all | 0 (0%) | 5 (3.4%) | 0 (0%) | 1 (4.0%) | 4 (6.7%) | 4 (1.8%) | 1 (1.3%) | 5 (1.7%) |
| slightly | 3 (2.0%) | 9 (6.1%) | 9 (4.2%) | 0 (0%) | 3 (5.0%) | 9 (4.0%) | 3 (3.9%) | 12 (4.0%) | |
| moderately | 44 (28.9%) | 41 (27.7%) | 60 (27.9%) | 5 (20.0%) | 20 (33.3%) | 62 (27.7%) | 23 (30.3%) | 85 (28.3%) | |
| quite | 70 (46.1%) | 69 (46.6%) | 100 (46.5%) | 13 (52.0%) | 26 (43.3%) | 105 (46.9%) | 34 (44.7%) | 139 (46.3%) | |
| very | 35 (23.0%) | 19 (12.8%) | 41 (19.1%) | 6 (24.0%) | 7 (11.7%) | 40 (17.9%) | 14 (18.4%) | 54 (18.0%) | |
| missing | 0 (0%) | 5 (3.4%) | 5 (2.3%) | 0 (0%) | 0 (0%) | 4 (1.8%) | 1 (1.3%) | 5 (1.7%) | |
| Talking to Others | not at all | 0 (0%) | 3 (2.0%) | 1 (0.5%) | 0 (0%) | 2 (3.3%) | 2 (0.9%) | 1 (1.3%) | 3 (1.0%) |
| slightly | 1 (0.7%) | 5 (3.4%) | 3 (1.4%) | 1 (4.0%) | 2 (3.3%) | 5 (2.2%) | 1 (1.3%) | 6 (2.0%) | |
| moderately | 11 (7.2%) | 18 (12.2%) | 23 (10.7%) | 1 (4.0%) | 5 (8.3%) | 24 (10.7%) | 5 (6.6%) | 29 (9.7%) | |
| quite | 40 (26.3%) | 56 (37.8%) | 77 (35.8%) | 5 (20.0%) | 14 (23.3%) | 66 (29.5%) | 30 (39.5%) | 96 (32.0%) | |
| very | 100 (65.8%) | 66 (44.6%) | 111 (51.6%) | 18 (72.0%) | 37 (61.7%) | 127 (56.7%) | 39 (51.3%) | 166 (55.3%) | |
| missing | 0 (0%) | 0 (0%) | 0 (0%) | 0 (0%) | 0 (0%) | 0 (0%) | 0 (0%) | 0 (0%) | |
| Remembering | not at all | 3 (2.0%) | 5 (3.4%) | 5 (2.3%) | 0 (0%) | 3 (5.0%) | 7 (3.1%) | 1 (1.3%) | 8 (2.7%) |
| slightly | 5 (3.3%) | 12 (8.1%) | 10 (4.7%) | 1 (4.0%) | 6 (10.0%) | 13 (5.8%) | 4 (5.3%) | 17 (5.7%) | |
| moderately | 36 (23.7%) | 43 (29.1%) | 56 (26.0%) | 5 (20.0%) | 18 (30.0%) | 55 (24.6%) | 24 (31.6%) | 79 (26.3%) | |
| quite | 50 (32.9%) | 52 (35.1%) | 75 (34.9%) | 11 (44.0%) | 16 (26.7%) | 75 (33.5%) | 27 (35.5%) | 102 (34.0%) | |
| very | 58 (38.2%) | 33 (22.3%) | 67 (31.2%) | 8 (32.0%) | 16 (26.7%) | 71 (31.7%) | 20 (26.3%) | 91 (30.3%) | |
| missing | 0 (0%) | 3 (2.0%) | 2 (0.9%) | 0 (0%) | 1 (1.7%) | 3 (1.3%) | 0 (0%) | 3 (1.0%) | |
| Planning | not at all | 1 (0.7%) | 9 (6.1%) | 5 (2.3%) | 1 (4.0%) | 4 (6.7%) | 8 (3.6%) | 2 (2.6%) | 10 (3.3%) |
| slightly | 3 (2.0%) | 10 (6.8%) | 11 (5.1%) | 1 (4.0%) | 1 (1.7%) | 10 (4.5%) | 3 (3.9%) | 13 (4.3%) | |
| moderately | 24 (15.8%) | 45 (30.4%) | 51 (23.7%) | 2 (8.0%) | 16 (26.7%) | 54 (24.1%) | 15 (19.7%) | 69 (23.0%) | |
| quite | 51 (33.6%) | 49 (33.1%) | 77 (35.8%) | 8 (32.0%) | 15 (25.0%) | 67 (29.9%) | 33 (43.4%) | 100 (33.3%) | |
| very | 73 (48.0%) | 34 (23.0%) | 71 (33.0%) | 13 (52.0%) | 23 (38.3%) | 84 (37.5%) | 23 (30.3%) | 107 (35.7%) | |
| missing | 0 (0%) | 1 (0.7%) | 0 (0%) | 0 (0%) | 1 (1.7%) | 1 (0.4%) | 0 (0%) | 1 (0.3%) | |
| Decision Between Two | not at all | 8 (5.3%) | 8 (5.4%) | 11 (5.1%) | 0 (0%) | 5 (8.3%) | 12 (5.4%) | 4 (5.3%) | 16 (5.3%) |
| slightly | 10 (6.6%) | 15 (10.1%) | 17 (7.9%) | 3 (12.0%) | 5 (8.3%) | 17 (7.6%) | 8 (10.5%) | 25 (8.3%) | |
| moderately | 55 (36.2%) | 49 (33.1%) | 73 (34.0%) | 8 (32.0%) | 23 (38.3%) | 79 (35.3%) | 25 (32.9%) | 104 (34.7%) | |
| quite | 60 (39.5%) | 57 (38.5%) | 90 (41.9%) | 8 (32.0%) | 19 (31.7%) | 83 (37.1%) | 34 (44.7%) | 117 (39.0%) | |
| very | 19 (12.5%) | 19 (12.8%) | 24 (11.2%) | 6 (24.0%) | 8 (13.3%) | 33 (14.7%) | 5 (6.6%) | 38 (12.7%) | |
| missing | 0 (0%) | 0 (0%) | 0 (0%) | 0 (0%) | 0 (0%) | 0 (0%) | 0 (0%) | 0 (0%) | |
| Orientation | not at all | 0 (0%) | 0 (0%) | 0 (0%) | 0 (0%) | 0 (0%) | 0 (0%) | 0 (0%) | 0 (0%) |
| slightly | 1 (0.7%) | 0 (0%) | 0 (0%) | 0 (0%) | 1 (1.7%) | 1 (0.4%) | 0 (0%) | 1 (0.3%) | |
| moderately | 8 (5.3%) | 8 (5.4%) | 7 (3.3%) | 2 (8.0%) | 7 (11.7%) | 10 (4.5%) | 6 (7.9%) | 16 (5.3%) | |
| quite | 21 (13.8%) | 24 (16.2%) | 25 (11.6%) | 5 (20.0%) | 15 (25.0%) | 34 (15.2%) | 11 (14.5%) | 45 (15.0%) | |
| very | 122 (80.3%) | 116 (78.4%) | 183 (85.1%) | 18 (72.0%) | 37 (61.7%) | 179 (79.9%) | 59 (77.6%) | 238 (79.3%) | |
| missing | 0 (0%) | 0 (0%) | 0 (0%) | 0 (0%) | 0 (0%) | 0 (0%) | 0 (0%) | 0 (0%) | |
| Thinking Speed | not at all | 2 (1.3%) | 1 (0.7%) | 1 (0.5%) | 0 (0%) | 2 (3.3%) | 2 (0.9%) | 1 (1.3%) | 3 (1.0%) |
| slightly | 8 (5.3%) | 11 (7.4%) | 11 (5.1%) | 1 (4.0%) | 7 (11.7%) | 13 (5.8%) | 6 (7.9%) | 19 (6.3%) | |
| moderately | 24 (15.8%) | 34 (23.0%) | 40 (18.6%) | 4 (16.0%) | 14 (23.3%) | 46 (20.5%) | 12 (15.8%) | 58 (19.3%) | |
| quite | 64 (42.1%) | 68 (45.9%) | 99 (46.0%) | 11 (44.0%) | 22 (36.7%) | 102 (45.5%) | 30 (39.5%) | 132 (44.0%) | |
| very | 54 (35.5%) | 34 (23.0%) | 64 (29.8%) | 9 (36.0%) | 15 (25.0%) | 61 (27.2%) | 27 (35.5%) | 88 (29.3%) | |
| missing | 0 (0%) | 0 (0%) | 0 (0%) | 0 (0%) | 0 (0%) | 0 (0%) | 0 (0%) | 0 (0%) | |
| Self | Age Group | TBI Severity | Study Setting | ||||||
|---|---|---|---|---|---|---|---|---|---|
| Children | Adolescents | Mild | Moderate | Severe | Offline | Online | Total | ||
| Item | Response | (N = 152) | (N = 148) | (N = 215) | (N = 25) | (N = 60) | (N = 224) | (N = 76) | (N = 300) |
| Energy | not at all | 1 (0.7%) | 2 (1.4%) | 2 (0.9%) | 0 (0%) | 1 (1.7%) | 2 (0.9%) | 1 (1.3%) | 3 (1.0%) |
| slightly | 3 (2.0%) | 17 (11.5%) | 16 (7.4%) | 1 (4.0%) | 3 (5.0%) | 15 (6.7%) | 5 (6.6%) | 20 (6.7%) | |
| moderately | 21 (13.8%) | 45 (30.4%) | 51 (23.7%) | 4 (16.0%) | 11 (18.3%) | 45 (20.1%) | 21 (27.6%) | 66 (22.0%) | |
| quite | 53 (34.9%) | 52 (35.1%) | 73 (34.0%) | 9 (36.0%) | 23 (38.3%) | 82 (36.6%) | 23 (30.3%) | 105 (35.0%) | |
| very | 74 (48.7%) | 29 (19.6%) | 70 (32.6%) | 11 (44.0%) | 22 (36.7%) | 77 (34.4%) | 26 (34.2%) | 103 (34.3%) | |
| missing | 0 (0%) | 3 (2.0%) | 3 (1.4%) | 0 (0%) | 0 (0%) | 3 (1.3%) | 0 (0%) | 3 (1.0%) | |
| Accomplishment | not at all | 0 (0%) | 0 (0%) | 0 (0%) | 0 (0%) | 0 (0%) | 0 (0%) | 0 (0%) | 0 (0%) |
| slightly | 0 (0%) | 2 (1.4%) | 1 (0.5%) | 0 (0%) | 1 (1.7%) | 0 (0%) | 2 (2.6%) | 2 (0.7%) | |
| moderately | 3 (2.0%) | 7 (4.7%) | 7 (3.3%) | 1 (4.0%) | 2 (3.3%) | 5 (2.2%) | 5 (6.6%) | 10 (3.3%) | |
| quite | 39 (25.7%) | 58 (39.2%) | 65 (30.2%) | 6 (24.0%) | 26 (43.3%) | 72 (32.1%) | 25 (32.9%) | 97 (32.3%) | |
| very | 110 (72.4%) | 81 (54.7%) | 142 (66.0%) | 18 (72.0%) | 31 (51.7%) | 147 (65.6%) | 44 (57.9%) | 191 (63.7%) | |
| missing | 0 (0%) | 0 (0%) | 0 (0%) | 0 (0%) | 0 (0%) | 0 (0%) | 0 (0%) | 0 (0%) | |
| Appearance | not at all | 0 (0%) | 3 (2.0%) | 2 (0.9%) | 0 (0%) | 1 (1.7%) | 2 (0.9%) | 1 (1.3%) | 3 (1.0%) |
| slightly | 2 (1.3%) | 8 (5.4%) | 6 (2.8%) | 0 (0%) | 4 (6.7%) | 6 (2.7%) | 4 (5.3%) | 10 (3.3%) | |
| moderately | 21 (13.8%) | 44 (29.7%) | 53 (24.7%) | 5 (20.0%) | 7 (11.7%) | 48 (21.4%) | 17 (22.4%) | 65 (21.7%) | |
| quite | 55 (36.2%) | 65 (43.9%) | 88 (40.9%) | 10 (40.0%) | 22 (36.7%) | 86 (38.4%) | 34 (44.7%) | 120 (40.0%) | |
| very | 74 (48.7%) | 27 (18.2%) | 66 (30.7%) | 10 (40.0%) | 25 (41.7%) | 81 (36.2%) | 20 (26.3%) | 101 (33.7%) | |
| missing | 0 (0%) | 1 (0.7%) | 0 (0%) | 0 (0%) | 1 (1.7%) | 1 (0.4%) | 0 (0%) | 1 (0.3%) | |
| Self-Esteem | not at all | 1 (0.7%) | 3 (2.0%) | 2 (0.9%) | 0 (0%) | 2 (3.3%) | 1 (0.4%) | 3 (3.9%) | 4 (1.3%) |
| slightly | 1 (0.7%) | 7 (4.7%) | 7 (3.3%) | 0 (0%) | 1 (1.7%) | 4 (1.8%) | 4 (5.3%) | 8 (2.7%) | |
| moderately | 17 (11.2%) | 32 (21.6%) | 34 (15.8%) | 2 (8.0%) | 13 (21.7%) | 40 (17.9%) | 9 (11.8%) | 49 (16.3%) | |
| quite | 43 (28.3%) | 58 (39.2%) | 80 (37.2%) | 7 (28.0%) | 14 (23.3%) | 72 (32.1%) | 29 (38.2%) | 101 (33.7%) | |
| very | 90 (59.2%) | 47 (31.8%) | 91 (42.3%) | 16 (64.0%) | 30 (50.0%) | 106 (47.3%) | 31 (40.8%) | 137 (45.7%) | |
| missing | 0 (0%) | 1 (0.7%) | 1 (0.5%) | 0 (0%) | 0 (0%) | 1 (0.4%) | 0 (0%) | 1 (0.3%) | |
| Future | not at all | 0 (0%) | 3 (2.0%) | 1 (0.5%) | 0 (0%) | 2 (3.3%) | 2 (0.9%) | 1 (1.3%) | 3 (1.0%) |
| slightly | 1 (0.7%) | 10 (6.8%) | 6 (2.8%) | 0 (0%) | 5 (8.3%) | 7 (3.1%) | 4 (5.3%) | 11 (3.7%) | |
| moderately | 11 (7.2%) | 27 (18.2%) | 30 (14.0%) | 0 (0%) | 8 (13.3%) | 28 (12.5%) | 10 (13.2%) | 38 (12.7%) | |
| quite | 50 (32.9%) | 54 (36.5%) | 72 (33.5%) | 13 (52.0%) | 19 (31.7%) | 75 (33.5%) | 29 (38.2%) | 104 (34.7%) | |
| very | 89 (58.6%) | 53 (35.8%) | 104 (48.4%) | 12 (48.0%) | 26 (43.3%) | 110 (49.1%) | 32 (42.1%) | 142 (47.3%) | |
| missing | 1 (0.7%) | 1 (0.7%) | 2 (0.9%) | 0 (0%) | 0 (0%) | 2 (0.9%) | 0 (0%) | 2 (0.7%) | |
| Autonomy & Daily Life | Age Group | TBI Severity | Study Setting | ||||||
|---|---|---|---|---|---|---|---|---|---|
| Children | Adolescents | Mild | Moderate | Severe | Offline | Online | Total | ||
| Item | Response | (N = 152) | (N = 148) | (N = 215) | (N = 25) | (N = 60) | (N = 224) | (N = 76) | (N = 300) |
| Daily Independence | not at all | 0 (0%) | 1 (0.7%) | 1 (0.5%) | 0 (0%) | 0 (0%) | 1 (0.4%) | 0 (0%) | 1 (0.3%) |
| slightly | 1 (0.7%) | 1 (0.7%) | 2 (0.9%) | 0 (0%) | 0 (0%) | 2 (0.9%) | 0 (0%) | 2 (0.7%) | |
| moderately | 5 (3.3%) | 1 (0.7%) | 4 (1.9%) | 2 (8.0%) | 0 (0%) | 4 (1.8%) | 2 (2.6%) | 6 (2.0%) | |
| quite | 19 (12.5%) | 9 (6.1%) | 15 (7.0%) | 4 (16.0%) | 9 (15.0%) | 19 (8.5%) | 9 (11.8%) | 28 (9.3%) | |
| very | 124 (81.6%) | 133 (89.9%) | 189 (87.9%) | 19 (76.0%) | 49 (81.7%) | 193 (86.2%) | 64 (84.2%) | 257 (85.7%) | |
| missing | 3 (2.0%) | 3 (2.0%) | 4 (1.9%) | 0 (0%) | 2 (3.3%) | 5 (2.2%) | 1 (1.3%) | 6 (2.0%) | |
| Getting out and About | not at all | 1 (0.7%) | 2 (1.4%) | 2 (0.9%) | 0 (0%) | 1 (1.7%) | 3 (1.3%) | 0 (0%) | 3 (1.0%) |
| slightly | 5 (3.3%) | 4 (2.7%) | 7 (3.3%) | 1 (4.0%) | 1 (1.7%) | 7 (3.1%) | 2 (2.6%) | 9 (3.0%) | |
| moderately | 9 (5.9%) | 16 (10.8%) | 19 (8.8%) | 1 (4.0%) | 5 (8.3%) | 20 (8.9%) | 5 (6.6%) | 25 (8.3%) | |
| quite | 25 (16.4%) | 27 (18.2%) | 38 (17.7%) | 5 (20.0%) | 9 (15.0%) | 33 (14.7%) | 19 (25.0%) | 52 (17.3%) | |
| very | 111 (73.0%) | 96 (64.9%) | 145 (67.4%) | 18 (72.0%) | 44 (73.3%) | 157 (70.1%) | 50 (65.8%) | 207 (69.0%) | |
| missing | 1 (0.7%) | 3 (2.0%) | 4 (1.9%) | 0 (0%) | 0 (0%) | 4 (1.8%) | 0 (0%) | 4 (1.3%) | |
| Manage at School | not at all | 0 (0%) | 3 (2.0%) | 0 (0%) | 0 (0%) | 3 (5.0%) | 2 (0.9%) | 1 (1.3%) | 3 (1.0%) |
| slightly | 6 (3.9%) | 6 (4.1%) | 8 (3.7%) | 0 (0%) | 4 (6.7%) | 9 (4.0%) | 3 (3.9%) | 12 (4.0%) | |
| moderately | 19 (12.5%) | 28 (18.9%) | 32 (14.9%) | 3 (12.0%) | 12 (20.0%) | 35 (15.6%) | 12 (15.8%) | 47 (15.7%) | |
| quite | 59 (38.8%) | 72 (48.6%) | 105 (48.8%) | 6 (24.0%) | 20 (33.3%) | 98 (43.8%) | 33 (43.4%) | 131 (43.7%) | |
| very | 68 (44.7%) | 34 (23.0%) | 65 (30.2%) | 16 (64.0%) | 21 (35.0%) | 76 (33.9%) | 26 (34.2%) | 102 (34.0%) | |
| missing | 0 (0%) | 5 (3.4%) | 5 (2.3%) | 0 (0%) | 0 (0%) | 4 (1.8%) | 1 (1.3%) | 5 (1.7%) | |
| Social Activities | not at all | 3 (2.0%) | 3 (2.0%) | 1 (0.5%) | 1 (4.0%) | 4 (6.7%) | 5 (2.2%) | 1 (1.3%) | 6 (2.0%) |
| slightly | 1 (0.7%) | 4 (2.7%) | 3 (1.4%) | 0 (0%) | 2 (3.3%) | 4 (1.8%) | 1 (1.3%) | 5 (1.7%) | |
| moderately | 6 (3.9%) | 19 (12.8%) | 17 (7.9%) | 0 (0%) | 8 (13.3%) | 17 (7.6%) | 8 (10.5%) | 25 (8.3%) | |
| quite | 37 (24.3%) | 44 (29.7%) | 67 (31.2%) | 4 (16.0%) | 10 (16.7%) | 58 (25.9%) | 23 (30.3%) | 81 (27.0%) | |
| very | 105 (69.1%) | 76 (51.4%) | 126 (58.6%) | 20 (80.0%) | 35 (58.3%) | 138 (61.6%) | 43 (56.6%) | 181 (60.3%) | |
| missing | 0 (0%) | 2 (1.4%) | 1 (0.5%) | 0 (0%) | 1 (1.7%) | 2 (0.9%) | 0 (0%) | 2 (0.7%) | |
| Decision Making | not at all | 1 (0.7%) | 2 (1.4%) | 1 (0.5%) | 0 (0%) | 2 (3.3%) | 2 (0.9%) | 1 (1.3%) | 3 (1.0%) |
| slightly | 1 (0.7%) | 2 (1.4%) | 2 (0.9%) | 0 (0%) | 1 (1.7%) | 2 (0.9%) | 1 (1.3%) | 3 (1.0%) | |
| moderately | 14 (9.2%) | 20 (13.5%) | 27 (12.6%) | 1 (4.0%) | 6 (10.0%) | 22 (9.8%) | 12 (15.8%) | 34 (11.3%) | |
| quite | 57 (37.5%) | 59 (39.9%) | 79 (36.7%) | 12 (48.0%) | 25 (41.7%) | 89 (39.7%) | 27 (35.5%) | 116 (38.7%) | |
| very | 79 (52.0%) | 61 (41.2%) | 103 (47.9%) | 12 (48.0%) | 25 (41.7%) | 106 (47.3%) | 34 (44.7%) | 140 (46.7%) | |
| missing | 0 (0%) | 4 (2.7%) | 3 (1.4%) | 0 (0%) | 1 (1.7%) | 3 (1.3%) | 1 (1.3%) | 4 (1.3%) | |
| Support from Others | not at all | 1 (0.7%) | 0 (0%) | 0 (0%) | 1 (4.0%) | 0 (0%) | 1 (0.4%) | 0 (0%) | 1 (0.3%) |
| slightly | 1 (0.7%) | 1 (0.7%) | 2 (0.9%) | 0 (0%) | 0 (0%) | 2 (0.9%) | 0 (0%) | 2 (0.7%) | |
| moderately | 7 (4.6%) | 16 (10.8%) | 14 (6.5%) | 1 (4.0%) | 8 (13.3%) | 15 (6.7%) | 8 (10.5%) | 23 (7.7%) | |
| quite | 48 (31.6%) | 63 (42.6%) | 81 (37.7%) | 7 (28.0%) | 23 (38.3%) | 82 (36.6%) | 29 (38.2%) | 111 (37.0%) | |
| very | 95 (62.5%) | 66 (44.6%) | 117 (54.4%) | 16 (64.0%) | 28 (46.7%) | 122 (54.5%) | 39 (51.3%) | 161 (53.7%) | |
| missing | 0 (0%) | 2 (1.4%) | 1 (0.5%) | 0 (0%) | 1 (1.7%) | 2 (0.9%) | 0 (0%) | 2 (0.7%) | |
| Ability to Move | not at all | 0 (0%) | 1 (0.7%) | 1 (0.5%) | 0 (0%) | 0 (0%) | 1 (0.4%) | 0 (0%) | 1 (0.3%) |
| slightly | 3 (2.0%) | 3 (2.0%) | 2 (0.9%) | 1 (4.0%) | 3 (5.0%) | 5 (2.2%) | 1 (1.3%) | 6 (2.0%) | |
| moderately | 5 (3.3%) | 11 (7.4%) | 12 (5.6%) | 0 (0%) | 4 (6.7%) | 9 (4.0%) | 7 (9.2%) | 16 (5.3%) | |
| quite | 25 (16.4%) | 25 (16.9%) | 38 (17.7%) | 2 (8.0%) | 10 (16.7%) | 37 (16.5%) | 13 (17.1%) | 50 (16.7%) | |
| very | 118 (77.6%) | 107 (72.3%) | 160 (74.4%) | 22 (88.0%) | 43 (71.7%) | 170 (75.9%) | 55 (72.4%) | 225 (75.0%) | |
| missing | 1 (0.7%) | 1 (0.7%) | 2 (0.9%) | 0 (0%) | 0 (0%) | 2 (0.9%) | 0 (0%) | 2 (0.7%) | |
| Social | Age Group | TBI Severity | Study Setting | ||||||
|---|---|---|---|---|---|---|---|---|---|
| Children | Adolescents | Mild | Moderate | Severe | Offline | Online | Total | ||
| Item | Response | (N = 152) | (N = 148) | (N = 215) | (N = 25) | (N = 60) | (N = 224) | (N = 76) | (N = 300) |
| Open up to Others | not at all | 1 (0.7%) | 1 (0.7%) | 1 (0.5%) | 0 (0%) | 1 (1.7%) | 1 (0.4%) | 1 (1.3%) | 2 (0.7%) |
| slightly | 2 (1.3%) | 13 (8.8%) | 13 (6.0%) | 1 (4.0%) | 1 (1.7%) | 14 (6.3%) | 1 (1.3%) | 15 (5.0%) | |
| moderately | 11 (7.2%) | 28 (18.9%) | 29 (13.5%) | 2 (8.0%) | 8 (13.3%) | 28 (12.5%) | 11 (14.5%) | 39 (13.0%) | |
| quite | 69 (45.4%) | 54 (36.5%) | 83 (38.6%) | 11 (44.0%) | 29 (48.3%) | 83 (37.1%) | 40 (52.6%) | 123 (41.0%) | |
| very | 69 (45.4%) | 50 (33.8%) | 88 (40.9%) | 11 (44.0%) | 20 (33.3%) | 96 (42.9%) | 23 (30.3%) | 119 (39.7%) | |
| missing | 0 (0%) | 2 (1.4%) | 1 (0.5%) | 0 (0%) | 1 (1.7%) | 2 (0.9%) | 0 (0%) | 2 (0.7%) | |
| Family Relationship | not at all | 1 (0.7%) | 2 (1.4%) | 2 (0.9%) | 0 (0%) | 1 (1.7%) | 3 (1.3%) | 0 (0%) | 3 (1.0%) |
| slightly | 2 (1.3%) | 2 (1.4%) | 4 (1.9%) | 0 (0%) | 0 (0%) | 3 (1.3%) | 1 (1.3%) | 4 (1.3%) | |
| moderately | 25 (16.4%) | 25 (16.9%) | 34 (15.8%) | 2 (8.0%) | 14 (23.3%) | 36 (16.1%) | 14 (18.4%) | 50 (16.7%) | |
| quite | 57 (37.5%) | 67 (45.3%) | 102 (47.4%) | 9 (36.0%) | 13 (21.7%) | 93 (41.5%) | 31 (40.8%) | 124 (41.3%) | |
| very | 67 (44.1%) | 50 (33.8%) | 72 (33.5%) | 14 (56.0%) | 31 (51.7%) | 87 (38.8%) | 30 (39.5%) | 117 (39.0%) | |
| missing | 0 (0%) | 2 (1.4%) | 1 (0.5%) | 0 (0%) | 1 (1.7%) | 2 (0.9%) | 0 (0%) | 2 (0.7%) | |
| Relationship with Friends | not at all | 0 (0%) | 1 (0.7%) | 0 (0%) | 0 (0%) | 1 (1.7%) | 0 (0%) | 1 (1.3%) | 1 (0.3%) |
| slightly | 2 (1.3%) | 1 (0.7%) | 2 (0.9%) | 1 (4.0%) | 0 (0%) | 3 (1.3%) | 0 (0%) | 3 (1.0%) | |
| moderately | 9 (5.9%) | 5 (3.4%) | 9 (4.2%) | 0 (0%) | 5 (8.3%) | 8 (3.6%) | 6 (7.9%) | 14 (4.7%) | |
| quite | 37 (24.3%) | 53 (35.8%) | 70 (32.6%) | 6 (24.0%) | 14 (23.3%) | 70 (31.3%) | 20 (26.3%) | 90 (30.0%) | |
| very | 104 (68.4%) | 88 (59.5%) | 134 (62.3%) | 18 (72.0%) | 40 (66.7%) | 143 (63.8%) | 49 (64.5%) | 192 (64.0%) | |
| missing | 0 (0%) | 0 (0%) | 0 (0%) | 0 (0%) | 0 (0%) | 0 (0%) | 0 (0%) | 0 (0%) | |
| Friendships | not at all | 0 (0%) | 1 (0.7%) | 0 (0%) | 0 (0%) | 1 (1.7%) | 0 (0%) | 1 (1.3%) | 1 (0.3%) |
| slightly | 2 (1.3%) | 3 (2.0%) | 2 (0.9%) | 1 (4.0%) | 2 (3.3%) | 5 (2.2%) | 0 (0%) | 5 (1.7%) | |
| moderately | 4 (2.6%) | 9 (6.1%) | 11 (5.1%) | 1 (4.0%) | 1 (1.7%) | 9 (4.0%) | 4 (5.3%) | 13 (4.3%) | |
| quite | 28 (18.4%) | 45 (30.4%) | 59 (27.4%) | 3 (12.0%) | 11 (18.3%) | 52 (23.2%) | 21 (27.6%) | 73 (24.3%) | |
| very | 118 (77.6%) | 90 (60.8%) | 143 (66.5%) | 20 (80.0%) | 45 (75.0%) | 158 (70.5%) | 50 (65.8%) | 208 (69.3%) | |
| missing | 0 (0%) | 0 (0%) | 0 (0%) | 0 (0%) | 0 (0%) | 0 (0%) | 0 (0%) | 0 (0%) | |
| Attitudes of Others | not at all | 0 (0%) | 1 (0.7%) | 0 (0%) | 0 (0%) | 1 (1.7%) | 1 (0.4%) | 0 (0%) | 1 (0.3%) |
| slightly | 6 (3.9%) | 6 (4.1%) | 5 (2.3%) | 2 (8.0%) | 5 (8.3%) | 9 (4.0%) | 3 (3.9%) | 12 (4.0%) | |
| moderately | 18 (11.8%) | 22 (14.9%) | 25 (11.6%) | 2 (8.0%) | 13 (21.7%) | 25 (11.2%) | 15 (19.7%) | 40 (13.3%) | |
| quite | 62 (40.8%) | 68 (45.9%) | 98 (45.6%) | 10 (40.0%) | 22 (36.7%) | 99 (44.2%) | 31 (40.8%) | 130 (43.3%) | |
| very | 66 (43.4%) | 50 (33.8%) | 86 (40.0%) | 11 (44.0%) | 19 (31.7%) | 89 (39.7%) | 27 (35.5%) | 116 (38.7%) | |
| missing | 0 (0%) | 1 (0.7%) | 1 (0.5%) | 0 (0%) | 0 (0%) | 1 (0.4%) | 0 (0%) | 1 (0.3%) | |
| Demands from Others | not at all | 1 (0.7%) | 2 (1.4%) | 0 (0%) | 0 (0%) | 3 (5.0%) | 3 (1.3%) | 0 (0%) | 3 (1.0%) |
| slightly | 3 (2.0%) | 7 (4.7%) | 7 (3.3%) | 1 (4.0%) | 2 (3.3%) | 7 (3.1%) | 3 (3.9%) | 10 (3.3%) | |
| moderately | 26 (17.1%) | 30 (20.3%) | 40 (18.6%) | 2 (8.0%) | 14 (23.3%) | 41 (18.3%) | 15 (19.7%) | 56 (18.7%) | |
| quite | 80 (52.6%) | 80 (54.1%) | 116 (54.0%) | 15 (60.0%) | 29 (48.3%) | 119 (53.1%) | 41 (53.9%) | 160 (53.3%) | |
| very | 42 (27.6%) | 29 (19.6%) | 52 (24.2%) | 7 (28.0%) | 12 (20.0%) | 54 (24.1%) | 17 (22.4%) | 71 (23.7%) | |
| missing | 0 (0%) | 0 (0%) | 0 (0%) | 0 (0%) | 0 (0%) | 0 (0%) | 0 (0%) | 0 (0%) | |
| Emotions * | Age Group | TBI Severity | Study Setting | ||||||
|---|---|---|---|---|---|---|---|---|---|
| Children | Adolescents | Mild | Moderate | Severe | Offline | Online | Total | ||
| Item | Response | (N = 152) | (N = 148) | (N = 215) | (N = 25) | (N = 60) | (N = 224) | (N = 76) | (N = 300) |
| Loneliness | very | 26 (17.1%) | 18 (12.2%) | 33 (15.3%) | 2 (8.0%) | 9 (15.0%) | 34 (15.2%) | 10 (13.2%) | 44 (14.7%) |
| quite | 19 (12.5%) | 24 (16.2%) | 35 (16.3%) | 4 (16.0%) | 4 (6.7%) | 32 (14.3%) | 11 (14.5%) | 43 (14.3%) | |
| moderately | 21 (13.8%) | 28 (18.9%) | 35 (16.3%) | 4 (16.0%) | 10 (16.7%) | 38 (17.0%) | 11 (14.5%) | 49 (16.3%) | |
| slightly | 33 (21.7%) | 32 (21.6%) | 45 (20.9%) | 4 (16.0%) | 16 (26.7%) | 41 (18.3%) | 24 (31.6%) | 65 (21.7%) | |
| not at all | 51 (33.6%) | 44 (29.7%) | 63 (29.3%) | 11 (44.0%) | 21 (35.0%) | 78 (34.8%) | 17 (22.4%) | 95 (31.7%) | |
| missing | 2 (1.3%) | 2 (1.4%) | 4 (1.9%) | 0 (0%) | 0 (0%) | 1 (0.4%) | 3 (3.9%) | 4 (1.3%) | |
| Anxiety | very | 16 (10.5%) | 18 (12.2%) | 29 (13.5%) | 1 (4.0%) | 4 (6.7%) | 28 (12.5%) | 6 (7.9%) | 34 (11.3%) |
| quite | 23 (15.1%) | 34 (23.0%) | 41 (19.1%) | 5 (20.0%) | 11 (18.3%) | 41 (18.3%) | 16 (21.1%) | 57 (19.0%) | |
| moderately | 52 (34.2%) | 42 (28.4%) | 62 (28.8%) | 8 (32.0%) | 24 (40.0%) | 69 (30.8%) | 25 (32.9%) | 94 (31.3%) | |
| slightly | 26 (17.1%) | 30 (20.3%) | 42 (19.5%) | 7 (28.0%) | 7 (11.7%) | 43 (19.2%) | 13 (17.1%) | 56 (18.7%) | |
| not at all | 35 (23.0%) | 23 (15.5%) | 40 (18.6%) | 4 (16.0%) | 14 (23.3%) | 42 (18.8%) | 16 (21.1%) | 58 (19.3%) | |
| missing | 0 (0%) | 1 (0.7%) | 1 (0.5%) | 0 (0%) | 0 (0%) | 1 (0.4%) | 0 (0%) | 1 (0.3%) | |
| Sadness | very | 30 (19.7%) | 18 (12.2%) | 32 (14.9%) | 3 (12.0%) | 13 (21.7%) | 40 (17.9%) | 8 (10.5%) | 48 (16.0%) |
| quite | 36 (23.7%) | 41 (27.7%) | 58 (27.0%) | 4 (16.0%) | 15 (25.0%) | 56 (25.0%) | 21 (27.6%) | 77 (25.7%) | |
| moderately | 38 (25.0%) | 33 (22.3%) | 49 (22.8%) | 9 (36.0%) | 13 (21.7%) | 53 (23.7%) | 18 (23.7%) | 71 (23.7%) | |
| slightly | 23 (15.1%) | 29 (19.6%) | 38 (17.7%) | 4 (16.0%) | 10 (16.7%) | 39 (17.4%) | 13 (17.1%) | 52 (17.3%) | |
| not at all | 25 (16.4%) | 27 (18.2%) | 38 (17.7%) | 5 (20.0%) | 9 (15.0%) | 36 (16.1%) | 16 (21.1%) | 52 (17.3%) | |
| missing | 0 (0%) | 0 (0%) | 0 (0%) | 0 (0%) | 0 (0%) | 0 (0%) | 0 (0%) | 0 (0%) | |
| Anger | very | 25 (16.4%) | 14 (9.5%) | 29 (13.5%) | 2 (8.0%) | 8 (13.3%) | 29 (12.9%) | 10 (13.2%) | 39 (13.0%) |
| quite | 31 (20.4%) | 36 (24.3%) | 47 (21.9%) | 4 (16.0%) | 16 (26.7%) | 46 (20.5%) | 21 (27.6%) | 67 (22.3%) | |
| moderately | 50 (32.9%) | 46 (31.1%) | 67 (31.2%) | 12 (48.0%) | 17 (28.3%) | 74 (33.0%) | 22 (28.9%) | 96 (32.0%) | |
| slightly | 29 (19.1%) | 32 (21.6%) | 50 (23.3%) | 3 (12.0%) | 8 (13.3%) | 48 (21.4%) | 13 (17.1%) | 61 (20.3%) | |
| not at all | 17 (11.2%) | 20 (13.5%) | 22 (10.2%) | 4 (16.0%) | 11 (18.3%) | 27 (12.1%) | 10 (13.2%) | 37 (12.3%) | |
| missing | 0 (0%) | 0 (0%) | 0 (0%) | 0 (0%) | 0 (0%) | 0 (0%) | 0 (0%) | 0 (0%) | |
| Physical * | Age Group | TBI Severity | Study Setting | ||||||
|---|---|---|---|---|---|---|---|---|---|
| Children | Adolescents | Mild | Moderate | Severe | Offline | Online | Total | ||
| Item | Response | (N = 152) | (N = 148) | (N = 215) | (N = 25) | (N = 60) | (N = 224) | (N = 76) | (N = 300) |
| Clumsiness | very | 20 (13.2%) | 16 (10.8%) | 26 (12.1%) | 0 (0%) | 10 (16.7%) | 27 (12.1%) | 9 (11.8%) | 36 (12.0%) |
| quite | 27 (17.8%) | 29 (19.6%) | 42 (19.5%) | 4 (16.0%) | 10 (16.7%) | 42 (18.8%) | 14 (18.4%) | 56 (18.7%) | |
| moderately | 44 (28.9%) | 47 (31.8%) | 67 (31.2%) | 11 (44.0%) | 13 (21.7%) | 68 (30.4%) | 23 (30.3%) | 91 (30.3%) | |
| slightly | 36 (23.7%) | 33 (22.3%) | 47 (21.9%) | 6 (24.0%) | 16 (26.7%) | 49 (21.9%) | 20 (26.3%) | 69 (23.0%) | |
| not at all | 24 (15.8%) | 23 (15.5%) | 32 (14.9%) | 4 (16.0%) | 11 (18.3%) | 37 (16.5%) | 10 (13.2%) | 47 (15.7%) | |
| missing | 1 (0.7%) | 0 (0%) | 1 (0.5%) | 0 (0%) | 0 (0%) | 1 (0.4%) | 0 (0%) | 1 (0.3%) | |
| Other Injuries | very | 16 (10.5%) | 8 (5.4%) | 13 (6.0%) | 2 (8.0%) | 9 (15.0%) | 16 (7.1%) | 8 (10.5%) | 24 (8.0%) |
| quite | 14 (9.2%) | 12 (8.1%) | 15 (7.0%) | 4 (16.0%) | 7 (11.7%) | 20 (8.9%) | 6 (7.9%) | 26 (8.7%) | |
| moderately | 23 (15.1%) | 21 (14.2%) | 26 (12.1%) | 3 (12.0%) | 15 (25.0%) | 31 (13.8%) | 13 (17.1%) | 44 (14.7%) | |
| slightly | 18 (11.8%) | 19 (12.8%) | 26 (12.1%) | 4 (16.0%) | 7 (11.7%) | 28 (12.5%) | 9 (11.8%) | 37 (12.3%) | |
| not at all | 78 (51.3%) | 83 (56.1%) | 127 (59.1%) | 12 (48.0%) | 22 (36.7%) | 123 (54.9%) | 38 (50.0%) | 161 (53.7%) | |
| missing | 3 (2.0%) | 5 (3.4%) | 8 (3.7%) | 0 (0%) | 0 (0%) | 6 (2.7%) | 2 (2.6%) | 8 (2.7%) | |
| Headaches | very | 36 (23.7%) | 22 (14.9%) | 40 (18.6%) | 4 (16.0%) | 14 (23.3%) | 43 (19.2%) | 15 (19.7%) | 58 (19.3%) |
| quite | 33 (21.7%) | 32 (21.6%) | 47 (21.9%) | 5 (20.0%) | 13 (21.7%) | 52 (23.2%) | 13 (17.1%) | 65 (21.7%) | |
| moderately | 24 (15.8%) | 31 (20.9%) | 40 (18.6%) | 5 (20.0%) | 10 (16.7%) | 34 (15.2%) | 21 (27.6%) | 55 (18.3%) | |
| slightly | 24 (15.8%) | 30 (20.3%) | 39 (18.1%) | 7 (28.0%) | 8 (13.3%) | 42 (18.8%) | 12 (15.8%) | 54 (18.0%) | |
| not at all | 35 (23.0%) | 33 (22.3%) | 49 (22.8%) | 4 (16.0%) | 15 (25.0%) | 53 (23.7%) | 15 (19.7%) | 68 (22.7%) | |
| missing | 0 (0%) | 0 (0%) | 0 (0%) | 0 (0%) | 0 (0%) | 0 (0%) | 0 (0%) | 0 (0%) | |
| Pain | very | 27 (17.8%) | 15 (10.1%) | 31 (14.4%) | 2 (8.0%) | 9 (15.0%) | 33 (14.7%) | 9 (11.8%) | 42 (14.0%) |
| quite | 30 (19.7%) | 19 (12.8%) | 42 (19.5%) | 2 (8.0%) | 5 (8.3%) | 34 (15.2%) | 15 (19.7%) | 49 (16.3%) | |
| moderately | 38 (25.0%) | 41 (27.7%) | 55 (25.6%) | 5 (20.0%) | 19 (31.7%) | 59 (26.3%) | 20 (26.3%) | 79 (26.3%) | |
| slightly | 23 (15.1%) | 40 (27.0%) | 44 (20.5%) | 10 (40.0%) | 9 (15.0%) | 44 (19.6%) | 19 (25.0%) | 63 (21.0%) | |
| not at all | 32 (21.1%) | 31 (20.9%) | 39 (18.1%) | 6 (24.0%) | 18 (30.0%) | 50 (22.3%) | 13 (17.1%) | 63 (21.0%) | |
| missing | 2 (1.3%) | 2 (1.4%) | 4 (1.9%) | 0 (0%) | 0 (0%) | 4 (1.8%) | 0 (0%) | 4 (1.3%) | |
| Seeing/Hearing | very | 14 (9.2%) | 14 (9.5%) | 21 (9.8%) | 0 (0%) | 7 (11.7%) | 20 (8.9%) | 8 (10.5%) | 28 (9.3%) |
| quite | 16 (10.5%) | 21 (14.2%) | 25 (11.6%) | 4 (16.0%) | 8 (13.3%) | 27 (12.1%) | 10 (13.2%) | 37 (12.3%) | |
| moderately | 25 (16.4%) | 22 (14.9%) | 32 (14.9%) | 5 (20.0%) | 10 (16.7%) | 36 (16.1%) | 11 (14.5%) | 47 (15.7%) | |
| slightly | 21 (13.8%) | 29 (19.6%) | 40 (18.6%) | 3 (12.0%) | 7 (11.7%) | 37 (16.5%) | 13 (17.1%) | 50 (16.7%) | |
| not at all | 76 (50.0%) | 61 (41.2%) | 96 (44.7%) | 13 (52.0%) | 28 (46.7%) | 103 (46.0%) | 34 (44.7%) | 137 (45.7%) | |
| missing | 0 (0%) | 1 (0.7%) | 1 (0.5%) | 0 (0%) | 0 (0%) | 1 (0.4%) | 0 (0%) | 1 (0.3%) | |
| TBI Effects | very | 11 (7.2%) | 8 (5.4%) | 11 (5.1%) | 0 (0%) | 8 (13.3%) | 15 (6.7%) | 4 (5.3%) | 19 (6.3%) |
| quite | 7 (4.6%) | 8 (5.4%) | 3 (1.4%) | 3 (12.0%) | 9 (15.0%) | 10 (4.5%) | 5 (6.6%) | 15 (5.0%) | |
| moderately | 26 (17.1%) | 10 (6.8%) | 24 (11.2%) | 3 (12.0%) | 9 (15.0%) | 24 (10.7%) | 12 (15.8%) | 36 (12.0%) | |
| slightly | 23 (15.1%) | 34 (23.0%) | 39 (18.1%) | 5 (20.0%) | 13 (21.7%) | 39 (17.4%) | 18 (23.7%) | 57 (19.0%) | |
| not at all | 85 (55.9%) | 88 (59.5%) | 138 (64.2%) | 14 (56.0%) | 21 (35.0%) | 136 (60.7%) | 37 (48.7%) | 173 (57.7%) | |
| missing | 0 (0%) | 0 (0%) | 0 (0%) | 0 (0%) | 0 (0%) | 0 (0%) | 0 (0%) | 0 (0%) | |
Appendix C. Threshold Parameters
| Location | T1 | T2 | T3 | T4 | D1 | D2 | D3 | No. | ||
|---|---|---|---|---|---|---|---|---|---|---|
| Cognition | Concentration | 0.66 | 0.01 | −1.24 | 0.97 | 2.90 | 1 | 0 | 0 | 1 |
| Talking to Others | −0.04 | −0.15 | −0.89 | −0.06 | 0.94 | 1 | 0 | 0 | 1 | |
| Remembering | 0.57 | −0.18 | −0.54 | 1.13 | 1.86 | 1 | 0 | 0 | 1 | |
| Thinking Speed | 0.32 | −1.17 | −0.19 | 0.47 | 2.16 | 0 | 0 | 0 | 0 | |
| Planning | 0.53 | 0.34 | −0.64 | 0.90 | 1.54 | 1 | 0 | 0 | 1 | |
| Orientation | −0.84 | −2.19 | −0.02 | −0.31 | n.a. | 0 | 1 | n.a. | 1 | |
| Decision Between Two | 1.12 | 0.20 | −0.31 | 1.39 | 3.19 | 1 | 0 | 0 | 1 | |
| Self | Appearance | 0.83 | −0.89 | −0.64 | 1.57 | 3.27 | 0 | 0 | 0 | 0 |
| Self-Esteem | 0.69 | −0.38 | −0.69 | 1.26 | 2.58 | 1 | 0 | 0 | 1 | |
| Accomplishment | −0.13 | −1.31 | −0.84 | 1.75 | n.a. | 0 | 0 | n.a. | 0 | |
| Future | 0.57 | −1.14 | 0.05 | 0.89 | 2.49 | 0 | 0 | 0 | 0 | |
| Energy | 0.91 | −1.35 | 0.13 | 1.70 | 3.14 | 0 | 0 | 0 | 0 | |
| Autonomy & Daily Life | Manage at School | 0.65 | −0.54 | −0.03 | 0.61 | 2.55 | 0 | 0 | 0 | 0 |
| Decision Making | 0.43 | 0.74 | −1.22 | 0.30 | 1.92 | 1 | 0 | 0 | 1 | |
| Daily Independence | −0.30 | −0.23 | −0.29 | −0.18 | −0.48 | 1 | 0 | 1 | 2 | |
| Getting out and About | 0.25 | −0.12 | −0.07 | 0.55 | 0.64 | 0 | 0 | 0 | 0 | |
| Social Activities | 0.51 | 0.96 | −0.21 | 0.03 | 1.25 | 1 | 0 | 0 | 1 | |
| Support from Others | 0.06 | −0.05 | −1.35 | −0.13 | 1.77 | 1 | 0 | 0 | 1 | |
| Ability to Move | −0.14 | −1.18 | 0.25 | 0.04 | 0.34 | 0 | 1 | 0 | 1 | |
| Social | Family Relationship | 0.71 | 0.51 | −1.09 | 0.83 | 2.59 | 1 | 0 | 0 | 1 |
| Relationship with Friends | 0.05 | −0.51 | −0.45 | −0.26 | 1.44 | 0 | 0 | 0 | 0 | |
| Attitudes of Others | 0.46 | −1.66 | 0.21 | 0.64 | 2.63 | 0 | 0 | 0 | 0 | |
| Friendships | 0.03 | −1.02 | 0.07 | −0.06 | 1.12 | 0 | 1 | 0 | 1 | |
| Open up to Others | 0.65 | −1.09 | 0.46 | 0.61 | 2.62 | 0 | 0 | 0 | 0 | |
| Demands from Others | 1.00 | −0.21 | −0.36 | 0.92 | 3.63 | 1 | 0 | 0 | 1 | |
| Emotions | Anger | 0.42 | −0.64 | −0.19 | 0.95 | 1.58 | 0 | 0 | 0 | 0 |
| Anxiety | 0.19 | −0.82 | −0.30 | 1.02 | 0.87 | 0 | 0 | 1 | 1 | |
| Sadness | 0.41 | −0.53 | 0.24 | 0.88 | 1.05 | 0 | 0 | 0 | 0 | |
| Loneliness | 0.05 | −0.22 | −0.06 | 0.14 | 0.36 | 0 | 0 | 0 | 0 | |
| Physical | TBI Effects | −0.40 | −0.15 | −0.84 | −0.11 | −0.49 | 1 | 0 | 1 | 2 |
| Headaches | 0.46 | 0.04 | 0.42 | 0.60 | 0.77 | 0 | 0 | 0 | 0 | |
| Pain | 0.37 | −0.04 | −0.13 | 0.80 | 0.84 | 1 | 0 | 0 | 1 | |
| Clumsiness | 0.44 | −0.36 | −0.19 | 0.98 | 1.33 | 0 | 0 | 0 | 0 | |
| Seeing/Hearing | −0.08 | −0.31 | −0.07 | 0.32 | −0.24 | 0 | 0 | 1 | 1 | |
| Other Injuries | −0.20 | −0.20 | −0.40 | 0.60 | −0.81 | 1 | 0 | 1 | 2 |
References
- Araki, T.; Yokota, H.; Morita, A. Pediatric Traumatic Brain Injury: Characteristic Features, Diagnosis, and Management. Neurol. Med. Chir. 2017, 57, 82–93. [Google Scholar] [CrossRef]
- Babikian, T.; Merkley, T.; Savage, R.C.; Giza, C.C.; Levin, H. Chronic Aspects of Pediatric Traumatic Brain Injury: Review of the Literature. J. Neurotrauma 2015, 32, 1849–1860. [Google Scholar] [CrossRef]
- Babikian, T.; Asarnow, R. Neurocognitive Outcomes and Recovery after Pediatric TBI: Meta-Analytic Review of the Literature. Neuropsychology 2009, 23, 283–296. [Google Scholar] [CrossRef]
- Li, L.; Liu, J. The Effect of Pediatric Traumatic Brain Injury on Behavioral Outcomes: A Systematic Review. Dev. Med. Child Neurol. 2013, 55, 37–45. [Google Scholar] [CrossRef]
- Ravens-Sieberer, U.; Patrick, P.D.; Benz, B.; Calaminus, G.; Flechtner, H.; Melchers, P.; Patrick, P.; Schäfer, B.; Suhr, L.; Schrod, L.; et al. Quality of Life in Children with Traumatic Brain Injury—Basic Issues, Assessment, and Recommendations. Restor. Neurol. Neurosci. 2002, 20, 151–159. [Google Scholar] [PubMed]
- Rashid, M.; Goez, H.R.; Mabood, N.; Damanhoury, S.; Yager, J.Y.; Joyce, A.S.; Newton, A.S. The Impact of Pediatric Traumatic Brain Injury (TBI) on Family Functioning: A Systematic Review. J. Pediatr. Rehabil. Med. 2014, 7, 241–254. [Google Scholar] [CrossRef]
- Ravens-Sieberer, U.; Erhart, M.; Wille, N.; Wetzel, R.; Nickel, J.; Bullinger, M. Generic Health-Related Quality-of-Life Assessment in Children and Adolescents. Pharmacoeconomics 2006, 24, 1199–1220. [Google Scholar] [CrossRef] [PubMed]
- Solans, M.; Pane, S.; Estrada, M.-D.; Serra-Sutton, V.; Berra, S.; Herdman, M.; Alonso, J.; Rajmil, L. Health-Related Quality of Life Measurement in Children and Adolescents: A Systematic Review of Generic and Disease-Specific Instruments. Value Health 2008, 11, 742–764. [Google Scholar] [CrossRef] [PubMed]
- von Steinbuechel, N.; Covic, A.; Polinder, S.; Kohlmann, T.; Cepulyte, U.; Poinstingl, H.; Backhaus, J.; Bakx, W.; Bullinger, M.; Christensen, A.-L.; et al. Assessment of Health-Related Quality of Life after TBI: Comparison of a Disease-Specific (QOLIBRI) with a Generic (SF-36) Instrument. Behav. Neurol. 2016, 2016, 7928014. [Google Scholar] [CrossRef]
- Wiebe, S.; Guyatt, G.; Weaver, B.; Matijevic, S.; Sidwell, C. Comparative Responsiveness of Generic and Specific Quality-of-Life Instruments. J. Clin. Epidemiol. 2003, 56, 52–60. [Google Scholar] [CrossRef]
- Varni, J.W.; Seid, M.; Rode, C.A. The PedsQLTM: Measurement Model for the Pediatric Quality of Life Inventory. Med. Care 1999, 37, 126–139. [Google Scholar] [CrossRef]
- Ravens-Sieberer, U.; Gosch, A.; Rajmil, L.; Erhart, M.; Bruil, J.; Duer, W.; Auquier, P.; Power, M.; Abel, T.; Czemy, L.; et al. KIDSCREEN-52 Quality-of-Life Measure for Children and Adolescents. Expert Rev. Pharm. Outcomes Res. 2005, 5, 353–364. [Google Scholar] [CrossRef] [PubMed]
- von Steinbuechel, N.; Wilson, L.; Gibbons, H.; Hawthorne, G.; Höfer, S.; Schmidt, S.; Bullinger, M.; Maas, A.; Neugebauer, E.; Powell, J.; et al. Quality of Life after Brain Injury (QOLIBRI): Scale Development and Metric Properties. J. Neurotrauma 2010, 27, 1167–1185. [Google Scholar] [CrossRef] [PubMed]
- von Steinbuechel, N.; Wilson, L.; Gibbons, H.; Hawthorne, G.; Höfer, S.; Schmidt, S.; Bullinger, M.; Maas, A.; Neugebauer, E.; Powell, J.; et al. Quality of Life after Brain Injury (QOLIBRI): Scale Validity and Correlates of Quality of Life. J. Neurotrauma 2010, 27, 1157–1165. [Google Scholar] [CrossRef]
- Giustini, M.; Longo, E.; Azicnuda, E.; Silvestro, D.; D’Ippolito, M.; Rigon, J.; Cedri, C.; Bivona, U.; Barba, C.; Formisano, R. Health-Related Quality of Life after Traumatic Brain Injury: Italian Validation of the QOLIBRI. Funct. Neurol. 2014, 29, 167–176. [Google Scholar] [PubMed]
- Castaño-León, A.M.; Navarro-Main, B.; Gomez, P.A.; Gil, A.; Soler, M.D.; Lagares, A.; Bernabeu, M.; Steinbüchel, N.; Real, R.G.L. Quality of Life After Brain Injury: Psychometric Properties of the Spanish Translation of the QoLIBRI. Eval. Health Prof. 2018, 41, 456–473. [Google Scholar] [CrossRef]
- von Steinbuechel, N.; Rauen, K.; Krenz, U.; Wu, Y.-J.; Covic, A.; Plass, A.M.; Cunitz, K.; Mueller, I.; Bockhop, F.; Polinder, S.; et al. Translation and Linguistic Validation of Outcome Instruments for Traumatic Brain Injury Research and Clinical Practice: A Step-by-Step Approach within the Observational CENTER-TBI Study. J. Clin. Med. 2021, 10, 2863. [Google Scholar] [CrossRef]
- McDonald, R.P. Test Theory: A Unified Treatment; L. Erlbaum Associates: Mahwah, NJ, USA, 1999; ISBN 978-0-8058-3075-0. [Google Scholar]
- von Steinbuechel, N.; Greving, S.; Landa, L.O.; Zeldovich, M.; Krenz, U.; Timmermann, D.; Koerte, I.K.; Bonfert, M.V.; Berweck, S.; Kieslich, M.; et al. Quality of Life after Brain Injury in Children and Adolescents (QOLIBRI-Kid/Ado)—The First Specific Self-Report Measure after Traumatic Brain Injury. 2023; under review. [Google Scholar]
- Hays, R.D.; Morales, L.S.; Reise, S.P. Item Response Theory and Health Outcomes Measurement in the 21st Century. Med. Care 2000, 38, II28–II42. [Google Scholar] [CrossRef]
- Nguyen, T.H.; Han, H.-R.; Kim, M.T.; Chan, K.S. An Introduction to Item Response Theory for Patient-Reported Outcome Measurement. Patient 2014, 7, 23–35. [Google Scholar] [CrossRef]
- Teasdale, G.; Jennett, B. Assessment of Coma and Impaired Consciousness. A Practical Scale. Lancet 1974, 2, 81–84. [Google Scholar] [CrossRef]
- Crouchman, M. A Practical Outcome Scale for Paediatric Head Injury. Arch. Dis. Child. 2001, 84, 120–124. [Google Scholar] [CrossRef] [PubMed]
- Masters, G.N. A Rasch Model for Partial Credit Scoring. Psychometrika 1982, 47, 149–174. [Google Scholar] [CrossRef]
- De Ayala, R.J. The Theory and Practice of Item Response Theory; Methodology in the Social Sciences; Guilford Press: New York, NY, USA, 2009; ISBN 978-1-59385-869-8. [Google Scholar]
- Martin-Löf, P. Statistika Modeller: Anteckningar Från Seminarier Lasåret 1969–1970, Utarbetade Av Rolf Sunberg [Statistical Models: Notes from Seminars of the Academic Year 1969–1970, Elaborated by Rolf Sunberg]; Obetydigt Ändrat Nytryck; Institutet för Säkringsmatematik och Matematisk Statistik vid Stockholms Universitet: Stockholm, Sweden, 1973. [Google Scholar]
- Junker, B.W.; Sijtsma, K. Latent and Manifest Monotonicity in Item Response Models. Appl. Psychol. Meas. 2000, 24, 65–81. [Google Scholar] [CrossRef]
- Kang, H.-A.; Su, Y.-H.; Chang, H.-H. A Note on Monotonicity of Item Response Functions for Ordered Polytomous Item Response Theory Models. Br. J. Math. Stat. Psychol. 2018, 71, 523–535. [Google Scholar] [CrossRef] [PubMed]
- Molenaar, I.W.; Sijtsma, K.; Boer, P. MSP5 for Windows: A Program for Mokken Scale Analysis for Polytomous Items; Version 5.0: User’s Manual; Iec ProGAMMA: Groningen, The Netherlands, 2000; ISBN 978-90-5144-054-6. [Google Scholar]
- Wright, B.D.; Stone, M.H. Best Test Design: Rasch Measurement; Mesa Press: Chicago, IL, USA, 1979; ISBN 978-0-941938-00-6. [Google Scholar]
- Linacre, J.M. What Do Infit and Outfit, Mean-Square and Standardized Mean? Rasch Meas. Trans. 2002, 16, 878. [Google Scholar]
- Andersen, E.B. The Numerical Solution of a Set of Conditional Estimation Equations. J. R. Stat. Soc. Ser. B 1972, 34, 42–54. [Google Scholar] [CrossRef]
- Chen, W.-H.; Thissen, D. Local Dependence Indexes for Item Pairs Using Item Response Theory. J. Educ. Behav. Stat. 1997, 22, 265. [Google Scholar] [CrossRef]
- Røe, C.; Damsgård, E.; Fors, T.; Anke, A. Psychometric Properties of the Pain Stages of Change Questionnaire as Evaluated by Rasch Analysis in Patients with Chronic Musculoskeletal Pain. BMC Musculoskelet. Disord. 2014, 15, 95. [Google Scholar] [CrossRef]
- Ramp, M.; Khan, F.; Misajon, R.A.; Pallant, J.F. Rasch Analysis of the Multiple Sclerosis Impact Scale (MSIS-29). Health Qual. Life Outcomes 2009, 7, 58. [Google Scholar] [CrossRef]
- R Core Team R: A Language and Environment for Statistical Computing 2020. Vienna, Austria. Available online: https://www.r-project.org (accessed on 20 March 2023).
- Rich, B. Table1: Tables of Descriptive Statistics in HTML 2023. R package version 1.4.3. Available online: https://CRAN.R-project.org/package=table1 (accessed on 20 March 2023).
- Mair, P.; Hatzinger, R.; Maier, M.J. ERm: Extended Rasch Modeling 2021. R package version 1.0-2. Available online: https://cran.r-project.org/package=eRm (accessed on 20 March 2023).
- Mueller, M. iarm: Item Analysis in Rasch Models 2022. R Package Version 0.4.3. Available online: https://CRAN.R-project.org/package=iarm (accessed on 20 March 2023).
- van der Ark, L.A. Mokken Scale Analysis in R. J. Stat. Soft. 2007, 20, 1–19. [Google Scholar] [CrossRef]
- van der Ark, L.A. New Developments in Mokken Scale Analysis in R. J. Stat. Soft. 2012, 48, 1–27. [Google Scholar] [CrossRef]
- Robitsch, A.; Kiefer, T.; Wu, M. TAM: Test Analysis Modules 2022. R package version 4.1-4. Available online: https://CRAN.R-project.org/package=TAM (accessed on 20 March 2023).
- Plourde, V.; Yeates, K.O.; Brooks, B.L. Predictors of Long-Term Psychosocial Functioning and Health-Related Quality of Life in Children and Adolescents with Prior Concussions. J. Int. Neuropsychol. Soc. 2018, 24, 540–548. [Google Scholar] [CrossRef]
- Houben-van Herten, M.; Bai, G.; Hafkamp, E.; Landgraf, J.M.; Raat, H. Determinants of Health-Related Quality of Life in School-Aged Children: A General Population Study in the Netherlands. PLoS ONE 2015, 10, e0125083. [Google Scholar] [CrossRef]
- Verrips, E. International Child Health. Measuring Health-Related Quality of Life in a Child Population. Eur. J. Public Health 1999, 9, 188–193. [Google Scholar] [CrossRef]
- von Steinbuechel, N.; Wilson, L.; Gibbons, H.; Muehlan, H.; Schmidt, H.; Schmidt, S.; Sasse, N.; Koskinen, S.; Sarajuuri, J.; Höfer, S.; et al. QOLIBRI Overall Scale: A Brief Index of Health-Related Quality of Life after Traumatic Brain Injury. J. Neurol. Neurosurg. Psychiatry 2012, 83, 1041–1047. [Google Scholar] [CrossRef]
- Wilson, L.; Marsden-Loftus, I.; Koskinen, S.; Bakx, W.; Bullinger, M.; Formisano, R.; Maas, A.; Neugebauer, E.; Powell, J.; Sarajuuri, J.; et al. Interpreting Quality of Life after Brain Injury Scores: Cross-Walk with the Short Form-36. J. Neurotrauma 2017, 34, 59–65. [Google Scholar] [CrossRef]
- Di Battista, A.; Soo, C.; Catroppa, C.; Anderson, V. Quality of Life in Children and Adolescents Post-TBI: A Systematic Review and Meta-Analysis. J. Neurotrauma 2012, 29, 1717–1727. [Google Scholar] [CrossRef]
- Powers, S.W.; Patton, S.R.; Hommel, K.A.; Hershey, A.D. Quality of Life in Childhood Migraines: Clinical Impact and Comparison to Other Chronic Illnesses. Pediatrics 2003, 112, e1–e5. [Google Scholar] [CrossRef]
- Rabbitts, J.A.; Holley, A.L.; Groenewald, C.B.; Palermo, T.M. Association Between Widespread Pain Scores and Functional Impairment and Health-Related Quality of Life in Clinical Samples of Children. J. Pain 2016, 17, 678–684. [Google Scholar] [CrossRef]
- Sveen, J.; Sjöberg, F.; Öster, C. Health-Related Quality of Life in Swedish Pediatric Burn Patients and Associations with Burn and Family Characteristics. Burns 2014, 40, 987–994. [Google Scholar] [CrossRef]
- Liebs, T.R.; Burgard, M.; Kaiser, N.; Slongo, T.; Berger, S.; Ryser, B.; Ziebarth, K. Health-Related Quality of Life after Paediatric Supracondylar Humeral Fractures. Bone Jt. J. 2020, 102-B, 755–765. [Google Scholar] [CrossRef] [PubMed]
- Winthrop, A.L. Health-Related Quality of Life after Pediatric Trauma. Curr. Opin. Pediatr. 2010, 22, 346–351. [Google Scholar] [CrossRef]
- Kwan, V.; Vo, M.; Noel, M.; Yeates, K. A Scoping Review of Pain in Children after Traumatic Brain Injury: Is There More Than Headache? J. Neurotrauma 2018, 35, 877–888. [Google Scholar] [CrossRef] [PubMed]
- Herzog, A.R.; Bachman, J.G. Effects of Questionnaire Length on Response Quality. Public Opin. Q. 1981, 45, 549. [Google Scholar] [CrossRef]
- Adams, R.J.; Wilson, M.; Wang, W. The Multidimensional Random Coefficients Multinomial Logit Model. Appl. Psychol. Meas. 1997, 21, 1–23. [Google Scholar] [CrossRef]
- Fischer, G.H.; Molenaar, I.W. Rasch Models: Foundations, Recent Developments, and Applications; Springer: New York, NY, USA, 1995; ISBN 978-1-4612-4230-7. [Google Scholar]


| Children | Adolescents | Total | ||
|---|---|---|---|---|
| n = 152 | n = 148 | N = 300 | ||
| Study setting | Offline | 113 (74%) | 111 (75%) | 224 (75%) |
| Online | 39 (26%) | 37 (25%) | 76 (25%) | |
| Gender | Female | 58 (38%) | 62 (42%) | 120 (40%) |
| Male | 94 (62%) | 85 (57%) | 179 (60%) | |
| Diverse | 0 (0%) | 1 (1%) | 1 (%) | |
| TBI severity | Mild | 106 (70%) | 109 (74%) | 215 (72%) |
| Moderate | 16 (11%) | 9 (6%) | 25 (8%) | |
| Severe | 30 (20%) | 30 (20%) | 60 (20%) | |
| Presence of lesion(s) | No | 108 (71%) | 100 (68%) | 208 (69%) |
| Yes | 43 (28%) | 43 (29%) | 86 (29%) | |
| Missing | 1 (1%) | 5 (3 %) | 6 (2%) | |
| KOSCHI disability score | 3a | 0 (0%) | 0 (0%) | 0 (%) |
| 3b | 1 (1%) | 0 (0%) | 1 (%) | |
| 4a | 3 (2%) | 5 (3%) | 8 (3%) | |
| 4b | 4 (3%) | 18 (12%) | 22 (7%) | |
| 5a | 15 (10%) | 25 (17%) | 40 (13%) | |
| 5b | 129 (85%) | 100 (68%) | 229 (76%) | |
| Years since TBI | <1 | 4 (3%) | 3 (2%) | 7 (2%) |
| 1–<2 | 24 (16%) | 20 (14%) | 44 (15%) | |
| 2–<4 | 45 (30%) | 36 (24%) | 81 (27%) | |
| 4–10 | 79 (52%) | 88 (59%) | 167 (56%) | |
| Missing | 0 (0%) | 1 (1%) | 1 (%) |
| Scale | Item | # of Response Categories Used | # of Disordered Thresholds | Unidimensionality (Median Split) | Monotonicity | Outfit | Infit | Person Homogeneity | Local Independence (Adjusted Q3) | |||||
|---|---|---|---|---|---|---|---|---|---|---|---|---|---|---|
| (DIF: Age) | (DIF: TBI Severity) | (DIF: Offline vs. Online) | ||||||||||||
| Desired Results → | 5 All Item Responses Exhausted | 0 No Disorder (1 < 2 < 3 < 4) | p > 0.05 Martin-Loef LRT | <0.03 No Violations | padj > 0.05 | padj > 0.05 | 1 Item Included in the Analyses | p > 0.05 AndersenLRT | 1 Item Included in the Analyses | p > 0.05 AndersenLRT | 1 Item Included in the Analyses | p > 0.05 AndersenLRT | Adjusted Q3 < 0.20 | |
| Cognition (7 items) | Concentration | 5 | 1 | LR = 81.75 df = 179 p > 0.99 | 0 | 0.641 | 0.53 | 0 d | LR = 22.91 df = 15 p = 0.086 | 1 | LR = 24.49 df = 19 p = 0.178 | 1 | LR = 31.74 df = 23 p = 0.106 | M = 0.00 (SD = 0.08) R: −0.17–0.16 |
| Talking to Others | 5 | 1 | 0 | >0.99 | >0.99 | 0 d | 1 | 1 | ||||||
| Remembering | 5 | 1 | 0 | >0.99 | >0.99 | 1 | 1 | 1 | ||||||
| Planning | 5 | 1 | 0 | >0.99 | >0.99 | 1 | 1 | 1 | ||||||
| Decision Between Two Things | 5 | 1 | 0 | 0.641 | 0.53 | 1 | 1 | 1 | ||||||
| Orientation | 4 a | 1 | 0 | >0.99 | >0.99 | 0 d | 1 | 1 | ||||||
| Thinking Speed | 5 | 0 | 0 | 0.667 | 0.53 | 1 | 1 | 1 | ||||||
| Self (5 items) | Energy | 5 | 0 | LR = 56.96 df = 87 p = 0.995 | 0 | 0.002 c | 0.0063 | 0 d | LR = 5.86 df = 7 p = 0.557 | 1 | LR = 26.63 df = 18 p = 0.086 | 1 | LR = 17.76 df = 15 p = 0.275 | M = 0.00 (SD = 0.13) R: −0.24–0.18 e |
| Accomplishment | 4 a | 0 | 0 | 0.666 | >0.99 | 0 d | 1 | 1 | ||||||
| Appearance | 5 | 0 | 0 | 0.048 c | 0.0403 | 0 d | 1 | 1 | ||||||
| Self-Esteem | 5 | 1 | 0 | 0.206 | 0.086 | 1 | 1 | 1 | ||||||
| Future | 5 | 0 | 0 | >0.99 | >0.99 | 1 | 1 | 1 | ||||||
| Autonomy & Daily life (7 items) | Daily Independence | 5 | 2 | LR = 96.12 df = 191 p > 0.99 | 0 | 0.651 | >0.99 | 0 d | LR = 10.92 df = 11 p = 0.450 | 1 | LR = 15.74 df = 11 p = 0.151 | 1 | LR = 10.13 df = 11 p = 0.519 | M = 0.00 (SD = 0.12) R: −0.22–0.17 e |
| Getting out and About | 5 | 0 | 0 | 0.86 | >0.99 | 1 | 1 | 1 | ||||||
| Manage at School | 5 | 0 | 0 | 0.651 | >0.99 | 0 d | 1 | 1 | ||||||
| Social Activities | 5 | 1 | 0 | 0.902 | >0.99 | 1 | 1 | 1 | ||||||
| Decision Making | 5 | 1 | 0 | >0.99 | >0.99 | 1 | 1 | 1 | ||||||
| Support from Others | 5 | 1 | 0 | >0.99 | >0.99 | 0 d | 1 | 1 | ||||||
| Ability to Move | 5 | 1 | 0 | 0.651 | >0.99 | 0 d | 1 | 1 | ||||||
| Social (6 items) | Open up to Others | 5 | 0 | LR = 79.45 df = 143 >0.99 | 0 | >0.99 | >0.99 | 1 | LR = 11.91 df = 11 p = 0.370 | 0 d | n.a. | 0 d | n.a. | M = 0.00 (SD = 0.12) R: −0.19–0.25 e |
| Family Relationship | 5 | 1 | 0 | 0.059 | 0.0423 | 1 | 0 d | 0 d | ||||||
| Relationship with Friends | 5 | 0 | 0 | 0.617 | 0.37 | 0 d | 0 d | 0 d | ||||||
| Friendships | 5 | 1 | 0 | 0.526 | 0.37 | 0 d | 0 d | 0 d | ||||||
| Attitudes of Others | 5 | 0 | 0 | 0.366 | 0.37 | 0 d | 0 d | 0 d | ||||||
| Demands from Others | 5 | 1 | 0 | 0.366 | 0.37 | 1 | 0 d | 0 d | ||||||
| Emotions (4 items) | Loneliness | 5 | 0 | LR = 93.31 df = 63 p = 0.008 | 0 | 0.832 | >0.99 | 1 | LR = 14.70 df = 15 p = 0.473 | 1 | LR = 13.23 df = 15 p = 0.585 | 1 | LR = 14.20 df = 15 p = 0.511 | M = 0.00 (SD = 0.11) −0.14–0.20 |
| Anxiety | 5 | 1 | 0 | 0.832 | >0.99 | 1 | 1 | 1 | ||||||
| Sadness | 5 | 0 | 0 | 0.832 | >0.99 | 1 | 1 | 1 | ||||||
| Anger | 5 | 0 | 0.08 b | 0.832 | >0.99 | 1 | 1 | 1 | ||||||
| Physical (6 items) | Clumsiness | 5 | 0 | LR = 177.27 df = 143 p = 0.027 | 0 | >0.99 | 0.703 | 1 | LR = 27.85 df = 23 p = 0.222 | 1 | LR = 59.53 df = 23 p < 0.001 | 1 | LR = 18.09 df = 23 p = 0.752 | M = 0.00 (SD = 0.16) R: −0.21–0.29 e |
| Other Injuries | 5 | 2 | 0 | >0.99 | >0.99 | 1 | 1 | 1 | ||||||
| Headaches | 5 | 0 | 0 | >0.99 | >0.99 | 1 | 1 | 1 | ||||||
| Pain | 5 | 1 | 0 | 0.435 | 0.173 | 1 | 1 | 1 | ||||||
| Seeing/Hearing | 5 | 1 | 0.05 b | >0.99 | >0.99 | 1 | 1 | 1 | ||||||
| TBI effects | 5 | 2 | 0 | 0.256 | 0.316 | 1 | 1 | 1 | ||||||
Disclaimer/Publisher’s Note: The statements, opinions and data contained in all publications are solely those of the individual author(s) and contributor(s) and not of MDPI and/or the editor(s). MDPI and/or the editor(s) disclaim responsibility for any injury to people or property resulting from any ideas, methods, instructions or products referred to in the content. |
© 2023 by the authors. Licensee MDPI, Basel, Switzerland. This article is an open access article distributed under the terms and conditions of the Creative Commons Attribution (CC BY) license (https://creativecommons.org/licenses/by/4.0/).
Share and Cite
Zeldovich, M.; Cunitz, K.; Greving, S.; Muehlan, H.; Bockhop, F.; Krenz, U.; Timmermann, D.; Koerte, I.K.; Rojczyk, P.; Roediger, M.; et al. Psychometric Properties of the German Version of the Quality of Life after Brain Injury Scale for Kids and Adolescents (QOLIBRI-KID/ADO) Using Item Response Theory Framework: Results from the Pilot Study. J. Clin. Med. 2023, 12, 3716. https://doi.org/10.3390/jcm12113716
Zeldovich M, Cunitz K, Greving S, Muehlan H, Bockhop F, Krenz U, Timmermann D, Koerte IK, Rojczyk P, Roediger M, et al. Psychometric Properties of the German Version of the Quality of Life after Brain Injury Scale for Kids and Adolescents (QOLIBRI-KID/ADO) Using Item Response Theory Framework: Results from the Pilot Study. Journal of Clinical Medicine. 2023; 12(11):3716. https://doi.org/10.3390/jcm12113716
Chicago/Turabian StyleZeldovich, Marina, Katrin Cunitz, Sven Greving, Holger Muehlan, Fabian Bockhop, Ugne Krenz, Dagmar Timmermann, Inga K. Koerte, Philine Rojczyk, Maike Roediger, and et al. 2023. "Psychometric Properties of the German Version of the Quality of Life after Brain Injury Scale for Kids and Adolescents (QOLIBRI-KID/ADO) Using Item Response Theory Framework: Results from the Pilot Study" Journal of Clinical Medicine 12, no. 11: 3716. https://doi.org/10.3390/jcm12113716