
Individualized Prediction of Drug Resistance in People with Post-Stroke Epilepsy: A Retrospective Study
 ,
,  , and
, and
Abstract
:1. Introduction
2. Material and Methods
2.1. Participants, Study Outcome and Predictors
2.2. Statistical Analysis
3. Results
4. Discussion
Author Contributions
Funding
Institutional Review Board Statement
Informed Consent Statement
Data Availability Statement
Conflicts of Interest
References
- Béjot, Y.; Daubail, B.; Giroud, M. Epidemiology of stroke and transient ischemic attacks: Current knowledge and perspectives. Rev. Neurol. 2015, 172, 59–68. [Google Scholar] [CrossRef] [PubMed]
- Zelano, J.; Holtkamp, M.; Agarwal, N.; Lattanzi, S.; Trinka, E.; Brigo, F. How to diagnose and treat post-stroke seizures and epilepsy. Epileptic Disord. 2020, 22, 252–263. [Google Scholar] [CrossRef] [PubMed]
- Lattanzi, S.; Rinaldi, C.; Cagnetti, C.; Foschi, N.; Norata, D.; Broggi, S.; Rocchi, C.; Silvestrini, M. Predictors of Pharmaco-Resistance in Patients with Post-Stroke Epilepsy. Brain Sci. 2021, 11, 418. [Google Scholar] [CrossRef] [PubMed]
- de Greef, B.T.; Schreuder, F.H.; Vlooswijk, M.C.; Schreuder, A.H.C.M.L.; Rooyer, F.A.; van Oostenbrugge, R.J.; Rouhl, R.P. Early seizures after intracerebral hemorrhage predict drug-resistant epilepsy. J. Neurol. 2015, 262, 541–546. [Google Scholar] [CrossRef] [PubMed]
- Burneo, J.G.; Antaya, T.C.; Allen, B.N.; Belisle, A.; Shariff, S.Z.; Saposnik, G. The risk of new-onset epilepsy and refractory epilepsy in older adult stroke survivors. Neurology 2019, 93, e568–e577. [Google Scholar] [CrossRef]
- Lattanzi, S.; Trinka, E.; Turcato, G.; Rinaldi, C.; Cagnetti, C.; Foschi, N.; Broggi, S.; Norata, D.; Brigo, F.; Silvestrini, M. Latency of poststroke epilepsy can predict drug resistance. Eur. J. Neurol. 2022, 29, 2481–2485. [Google Scholar] [CrossRef] [PubMed]
- Beghi, E.; Carpio, A.; Forsgren, L.; Hesdorffer, D.C.; Malmgren, K.; Sander, J.W.; Tomson, T.; Hauser, W.A. Recommendation for a definition of acute symptomatic seizure. Epilepsia 2010, 51, 671–675. [Google Scholar] [CrossRef] [PubMed]
- Kwan, P.; Arzimanoglou, A.; Berg, A.T.; Brodie, M.J.; Allen Hauser, W.; Mathern, G.; Moshé, S.L.; Perucca, E.; Wiebe, S.; French, J. Definition of drug resistant epilepsy: Consensus proposal by the ad hoc Task Force of the ILAE Commission on Therapeutic Strategies. Epilepsia 2010, 51, 1069–1077. [Google Scholar] [CrossRef] [PubMed]
- Wityk, R.J.; Pessin, M.S.; Kaplan, R.F.; Caplan, L.R. Serial assessment of acute stroke using the NIH Stroke Scale. Stroke 1994, 25, 362–365. [Google Scholar] [CrossRef] [PubMed]
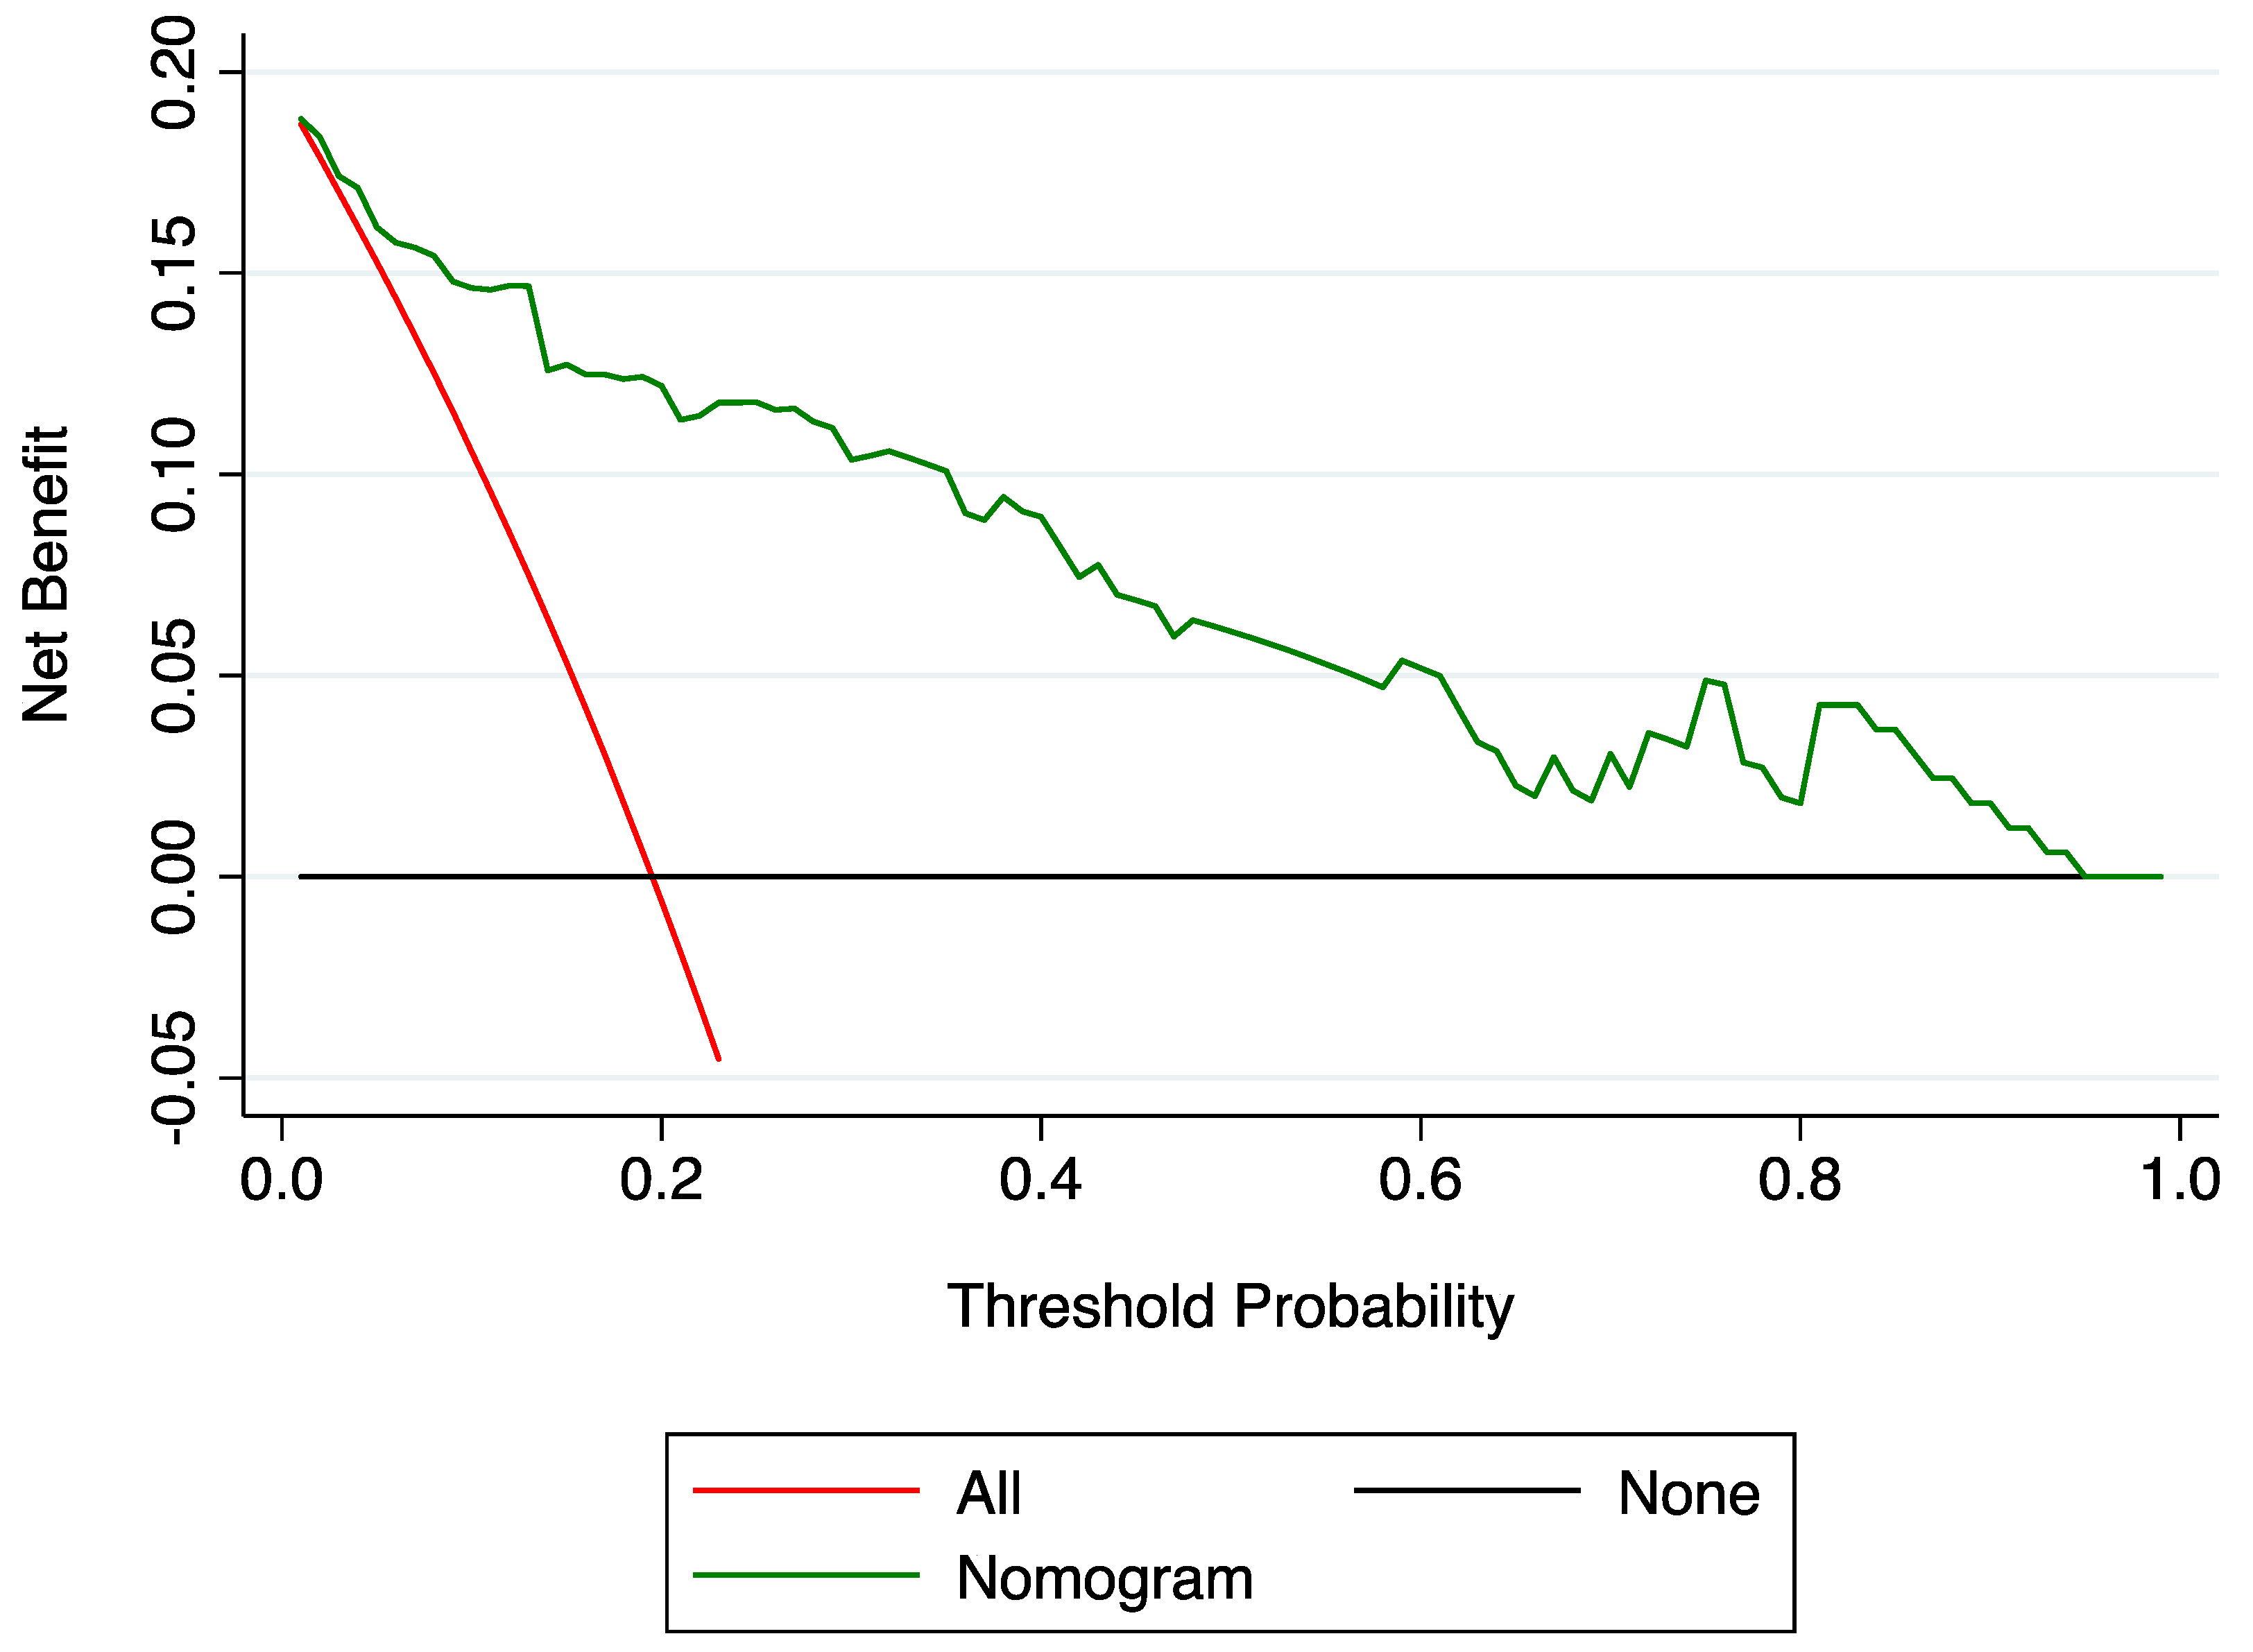
- Vickers, A.J.; Elkin, E.B. Decision curve analysis: A novel method for evaluating prediction models. Med. Decis. Making 2006, 26, 565–574. [Google Scholar] [CrossRef] [PubMed]
- Collins, G.S.; Reitsma, J.B.; Altman, D.G.; Moons, K.G. Transparent Reporting of a Multivariable Prediction Model for Individual Prognosis or Diagnosis (TRIPOD): The TRIPOD Statement. Eur. Urol. 2015, 67, 1142–1151. [Google Scholar] [CrossRef] [PubMed]
- Wong, M. The Window of Epileptogenesis: Looking beyond the Latent Period. Epilepsy Curr. 2009, 9, 144–145. [Google Scholar] [CrossRef] [PubMed]
- Gorter, J.A.; van Vliet, E.A.; Aronica, E. Status epilepticus, blood-brain barrier disruption, inflammation, and epileptogenesis. Epilepsy Behav. 2015, 49, 13–16. [Google Scholar] [CrossRef] [PubMed]
- Li, Z.; Cao, W.; Sun, H.; Wang, X.; Li, S.; Ran, X.; Zhang, H. Potential clinical and biochemical markers for the prediction of drug-resistant epilepsy: A literature review. Neurobiol. Dis. 2022, 174, 105872. [Google Scholar] [CrossRef] [PubMed]
- Tang, F.; Hartz, A.M.S.; Bauer, B. Drug-Resistant Epilepsy: Multiple Hypotheses, Few Answers. Front. Neurol. 2017, 8, 301. [Google Scholar] [CrossRef] [PubMed]
- Klein, P.; Dingledine, R.; Aronica, E.; Bernard, C.; Blümcke, I.; Boison, D.; Brodie, M.J.; Brooks-Kayal, A.R.; Engel, J., Jr.; Forcelli, P.A.; et al. Commonalities in epileptogenic processes from different acute brain insults: Do they translate? Epilepsia 2018, 59, 37–66. [Google Scholar] [CrossRef] [PubMed]
- England, M.J.; Liverman, C.T.; Schultz, A.M.; Strawbridge, L.M. Epilepsy across the spectrum: Promoting health and understanding. A summary of the Institute of Medicine report. Epilepsy Behav. 2012, 25, 266–276. [Google Scholar] [CrossRef] [PubMed]
- An, S.; Malhotra, K.; Dilley, C.; Han-Burgess, E.; Valdez, J.N.; Robertson, J.; Clark, C.; Westover, M.B.; Sun, J. Predicting drug-resistant epilepsy—A machine learning approach based on administrative claims data. Epilepsy Behav. 2018, 89, 118–125. [Google Scholar] [CrossRef] [PubMed]


| Participants (n = 164) | |
|---|---|
| Male sex | 107 (65.2) |
| Age at stroke onset | 56.9 (14.9) |
| Familiar history of seizures | 6 (3.7) |
| Hypertension | 112 (68.3) |
| Diabetes mellitus | 31 (18.9) |
| Dyslipidemia | 63 (38.4) |
| Atrial fibrillation | 23 (14.0) |
| Coronary heart disease | 30 (18.3) |
| Stroke type | |
| Cerebral infarct | 105 (64.0) |
| Intra-cerebral hemorrhage | 59 (36.0) |
| a Stroke severity | |
| Mild to moderate | 84 (51.2) |
| Severe | 80 (48.8) |
| b Acute symptomatic post-stroke seizures | 25 (15.2) |
| Status epilepticus at epilepsy onset | 12 (7.3) |
| Seizure type | |
| Focal onset | 83 (50.6) |
| Focal-to-bilateral tonic clonic | 58 (35.4) |
| Generalized or unknown onset | 23 (14.0) |
| c Epilepsy latency, months | 18 (11–38) |
| Drug Responsive (n = 132) | Drug-Resistant (n = 32) | Unadjusted OR (95% CI) | p Value | |
|---|---|---|---|---|
| Male, n (%) | 87 (65.9) | 20 (62.5) | 0.86 (0.39–1.92) | 0.717 |
| Age at stroke onset, y, mean (SD) | 58.1 (14.8) | 52.0 (14.5) | 0.97 (0.95–0.99) | 0.041 |
| Intracerebral hemorrhage, n (%) | 41 (31.1) | 18 (56.3) | 2.85 (1.30–6.29) | 0.009 |
| Severe stroke, n (%) | 55 (41.7) | 25 (78.1) | 5.00 (2.02–12.38) | 0.001 |
| Acute symptomatic post-stroke seizures, n (%) | 18 (13.6) | 7 (21.9) | 1.77 (0.67–4.70) | 0.249 |
| Latency of post-stroke epilepsy | ||||
| 0–6 months, n (%) | 3 (2.3) | 7 (21.9) | 16.02 (3.73–68.78) | <0.001 |
| 7–12 months, n (%) | 26 (19.7) | 10 (31.2) | 2.64 (1.06–6.55) | 0.036 |
| >12 months, n (%) | 103 (78.0) | 15 (46.9) | 1.00 (reference) | - |
| Status epilepticus at epilepsy onset, n (%) | 5 (3.8) | 7 (21.9) | 7.11 (2.09–24.21) | 0.002 |
| Seizure type | ||||
| Focal onset only | 69 (52.3) | 14 (43.8) | 1.00 (reference) | - |
| Focal-to-bilateral tonic-clonic | 41 (31.1) | 17 (53.1) | 2.04 (0.91–4.58) | 0.082 |
| Generalized or unknown onset | 22 (16.7) | 1 (3.1) | 0.22 (0.03–1.80) | 0.160 |
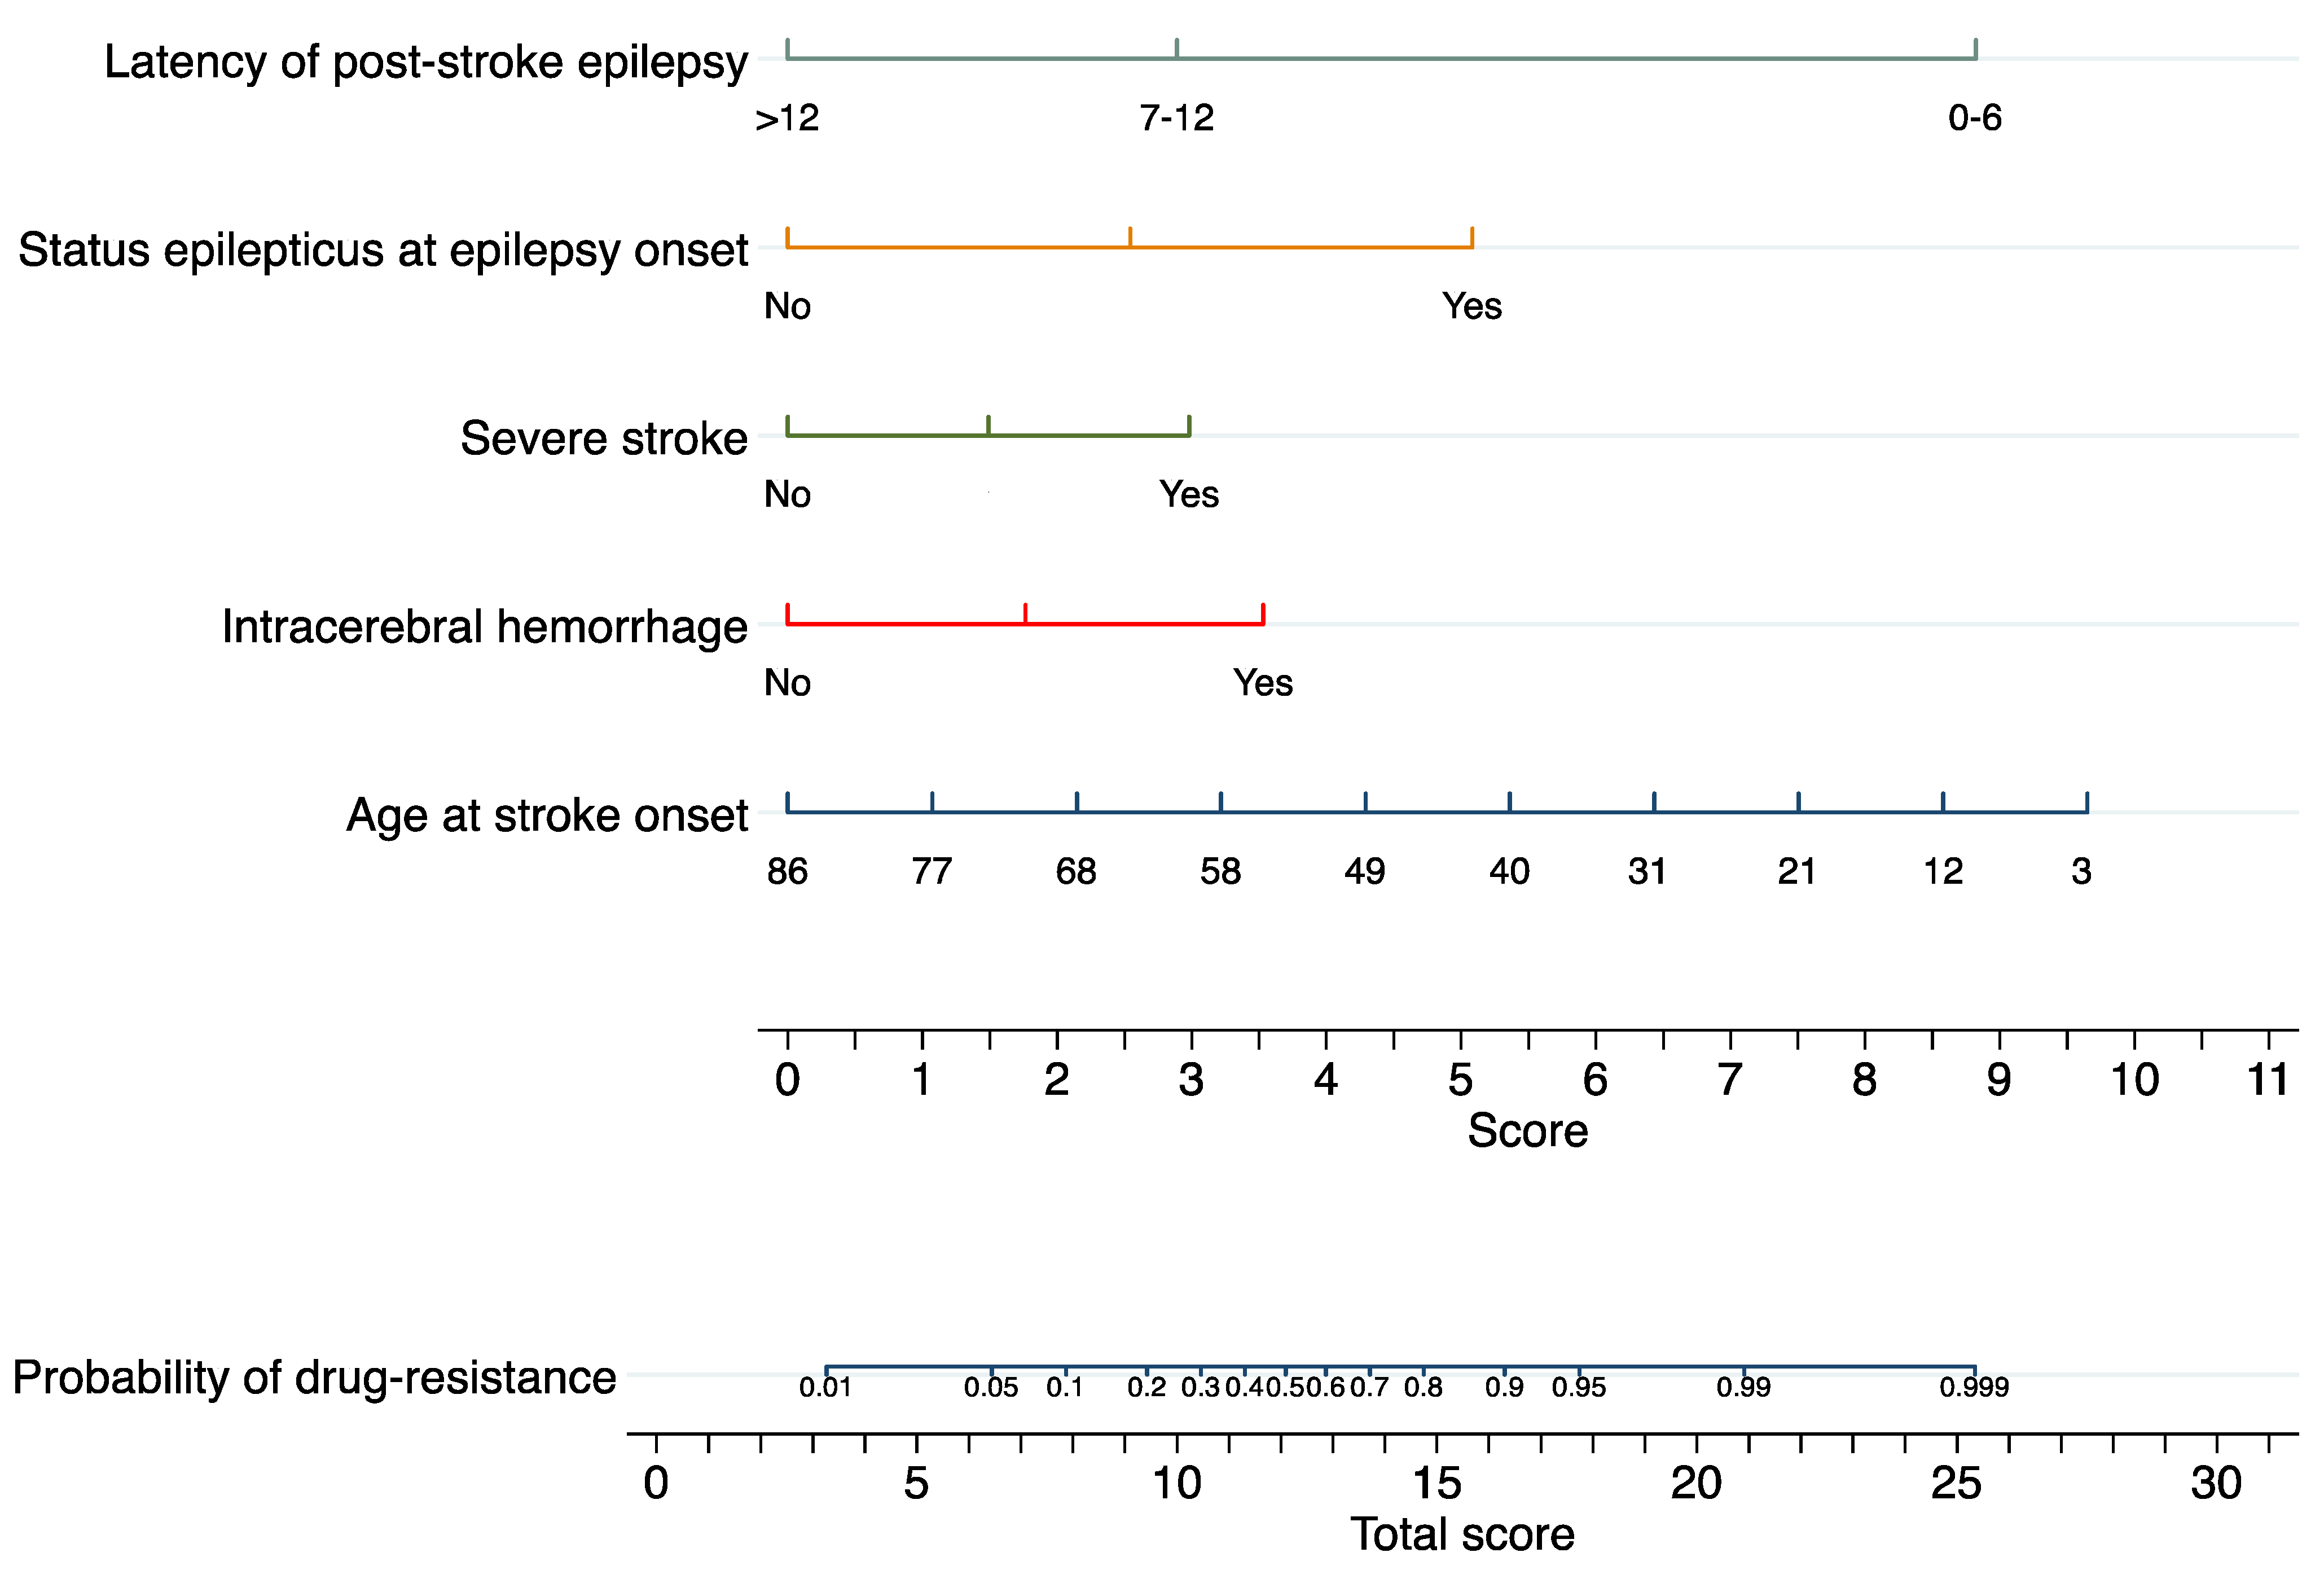
| Regression Coefficient (Standard Error) | Adjusted OR (95% CI) | p Value | |
|---|---|---|---|
| Age at stroke onset | −0.061 (0.019) | 0.941 (0.907–0.977) | 0.001 |
| Intracerebral hemorrhage | 1.839 (0.596) | 6.292 (1.957–20.233) | 0.002 |
| Severe stroke | 1.553 (0.561) | 4.727 (1.573–14.203) | 0.006 |
| Latency of post-stroke epilepsy | |||
| 0–6 months | 4.596 (0.968) | 99.099 (14.873–660.272) | <0.001 |
| 7–12 months | 1.506 (0.621) | 4.509 (1.335–15.228) | 0.015 |
| >12 months | 0 (reference) | 1.000 (reference) | - |
| Status epilepticus at epilepsy onset | 2.648 (0.875) | 14.127 (2.540–78.564) | 0.002 |
Disclaimer/Publisher’s Note: The statements, opinions and data contained in all publications are solely those of the individual author(s) and contributor(s) and not of MDPI and/or the editor(s). MDPI and/or the editor(s) disclaim responsibility for any injury to people or property resulting from any ideas, methods, instructions or products referred to in the content. |
© 2023 by the authors. Licensee MDPI, Basel, Switzerland. This article is an open access article distributed under the terms and conditions of the Creative Commons Attribution (CC BY) license (https://creativecommons.org/licenses/by/4.0/).
Share and Cite
Lattanzi, S.; Meletti, S.; Trinka, E.; Brigo, F.; Turcato, G.; Rinaldi, C.; Cagnetti, C.; Foschi, N.; Broggi, S.; Norata, D.; et al. Individualized Prediction of Drug Resistance in People with Post-Stroke Epilepsy: A Retrospective Study. J. Clin. Med. 2023, 12, 3610. https://doi.org/10.3390/jcm12113610
Lattanzi S, Meletti S, Trinka E, Brigo F, Turcato G, Rinaldi C, Cagnetti C, Foschi N, Broggi S, Norata D, et al. Individualized Prediction of Drug Resistance in People with Post-Stroke Epilepsy: A Retrospective Study. Journal of Clinical Medicine. 2023; 12(11):3610. https://doi.org/10.3390/jcm12113610
Chicago/Turabian StyleLattanzi, Simona, Stefano Meletti, Eugen Trinka, Francesco Brigo, Gianni Turcato, Claudia Rinaldi, Claudia Cagnetti, Nicoletta Foschi, Serena Broggi, Davide Norata, and et al. 2023. "Individualized Prediction of Drug Resistance in People with Post-Stroke Epilepsy: A Retrospective Study" Journal of Clinical Medicine 12, no. 11: 3610. https://doi.org/10.3390/jcm12113610