
Atypical Response to Affective Touch in Children with Autism: Multi-Parametric Exploration of the Autonomic System
 , , , and
Abstract
:1. Introduction
1.1. Human Processing of Affective and Pleasant Touch
1.2. Affective Touch Processing in ASD
1.3. Autonomic Reactivity to Affective Touch
1.4. Autonomic Activity in TD and ASD Populations
1.5. Objectives and Hypotheses
2. Materials and Methods
2.1. Participants
2.2. Material
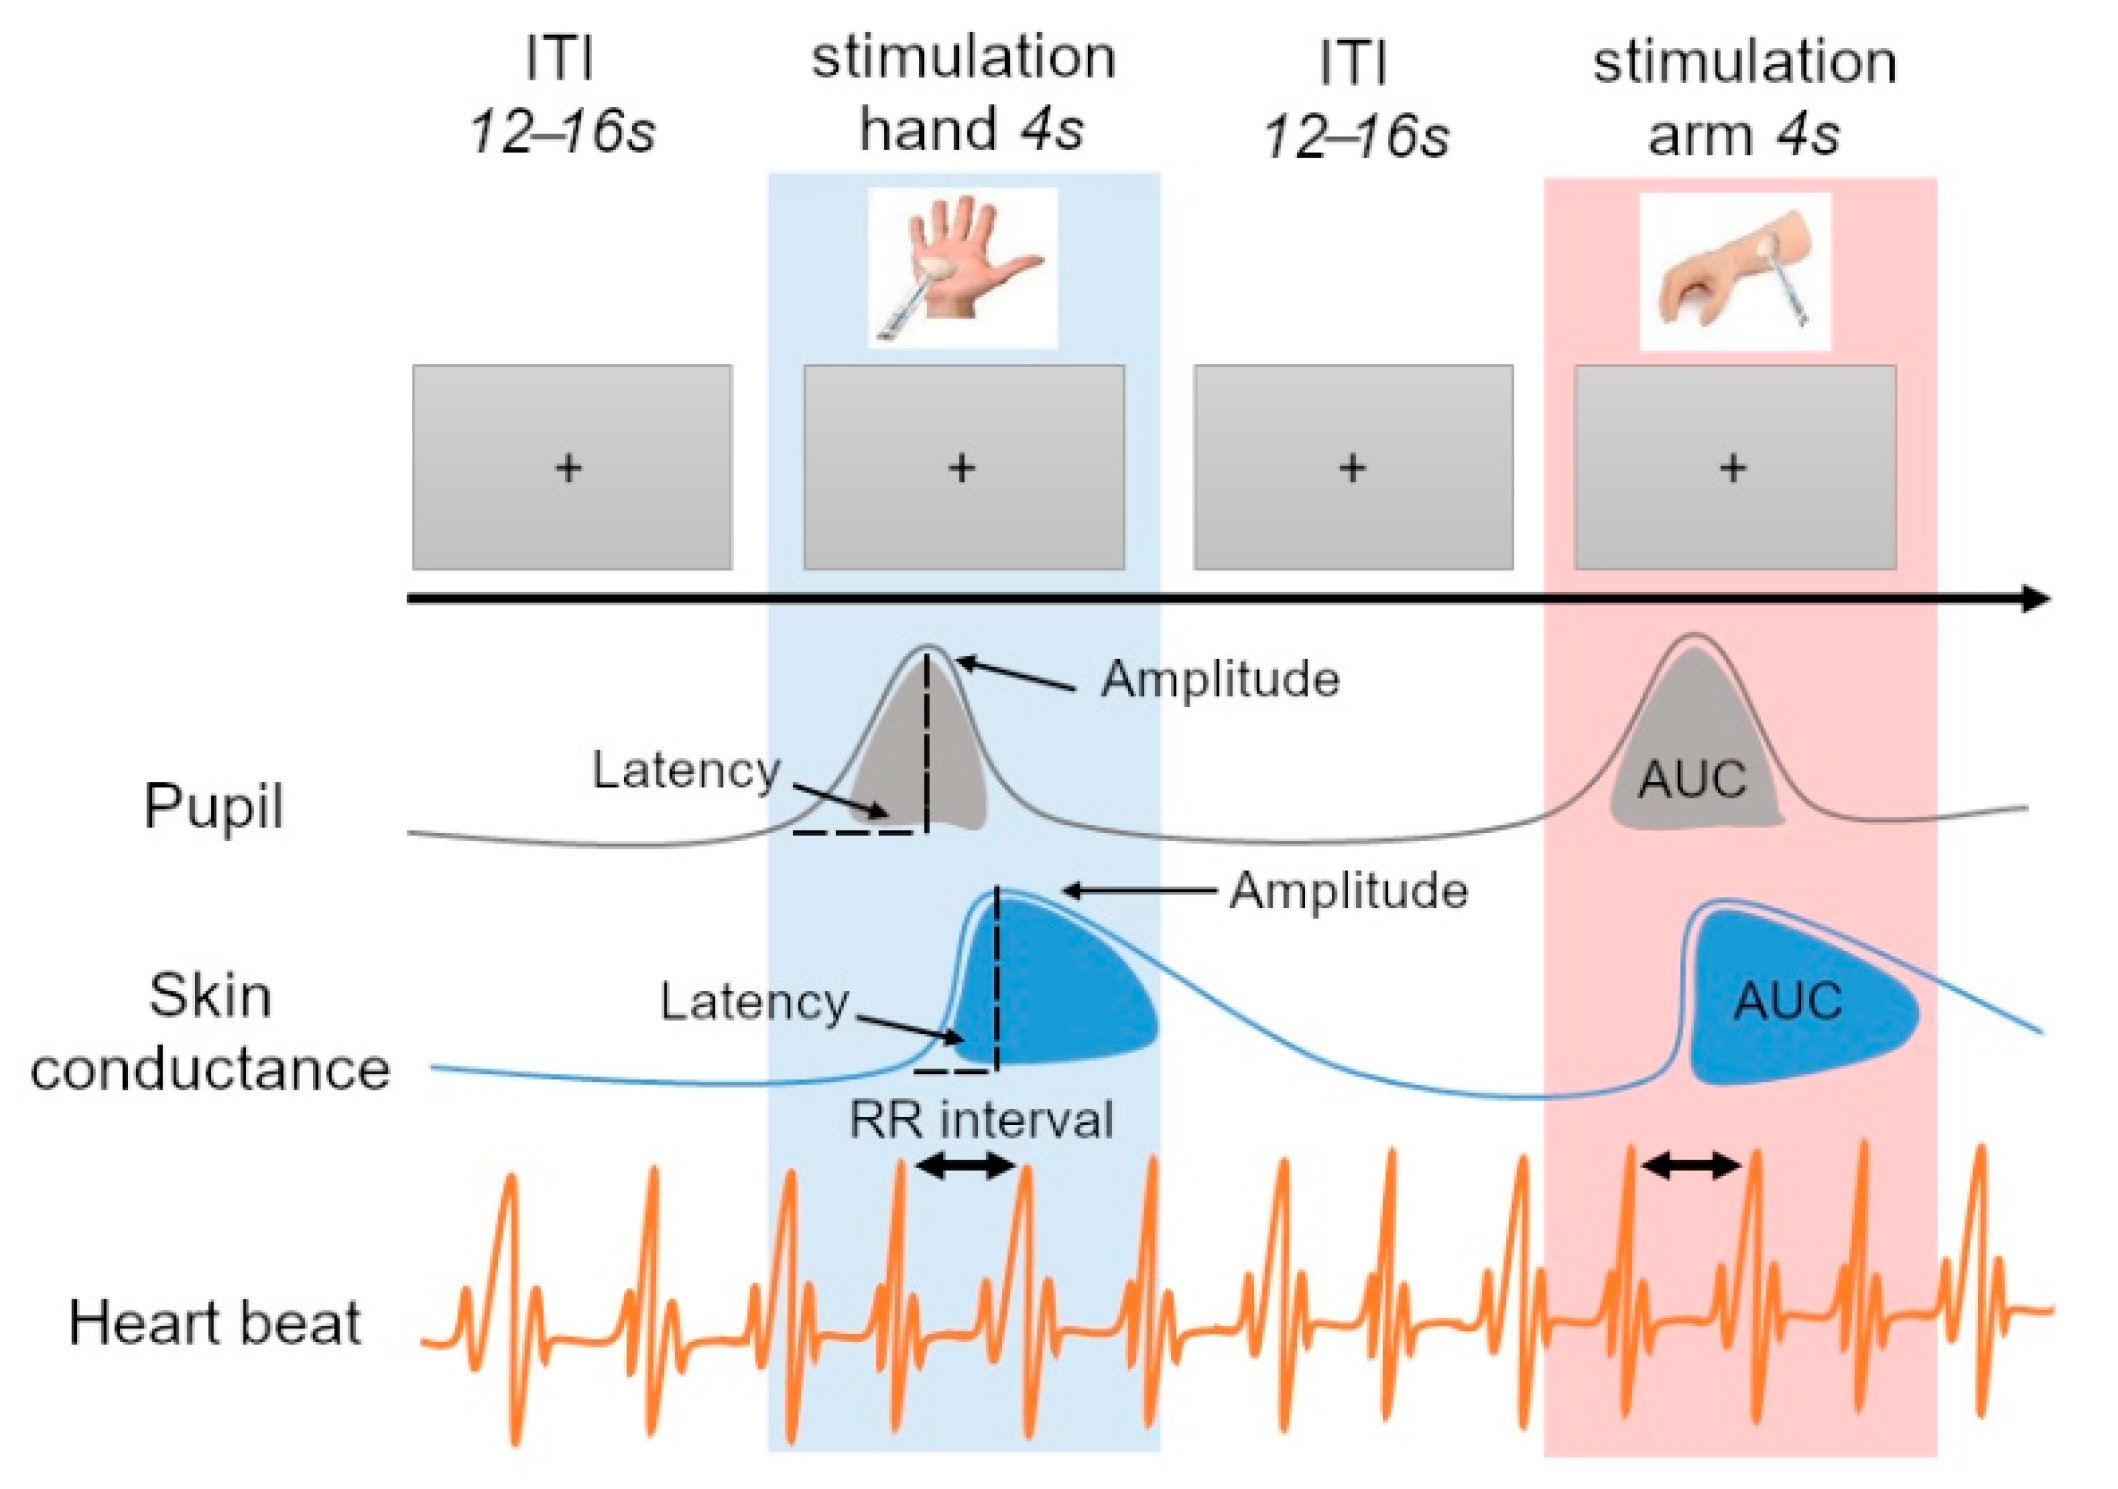
2.3. Procedure
2.4. Preprocessing of the Signals
2.4.1. Tactile Stimulation
2.4.2. Pupil Diameter
2.4.3. Skin Conductance
2.4.4. Heart Rate
2.5. Statistical Analyses
3. Results
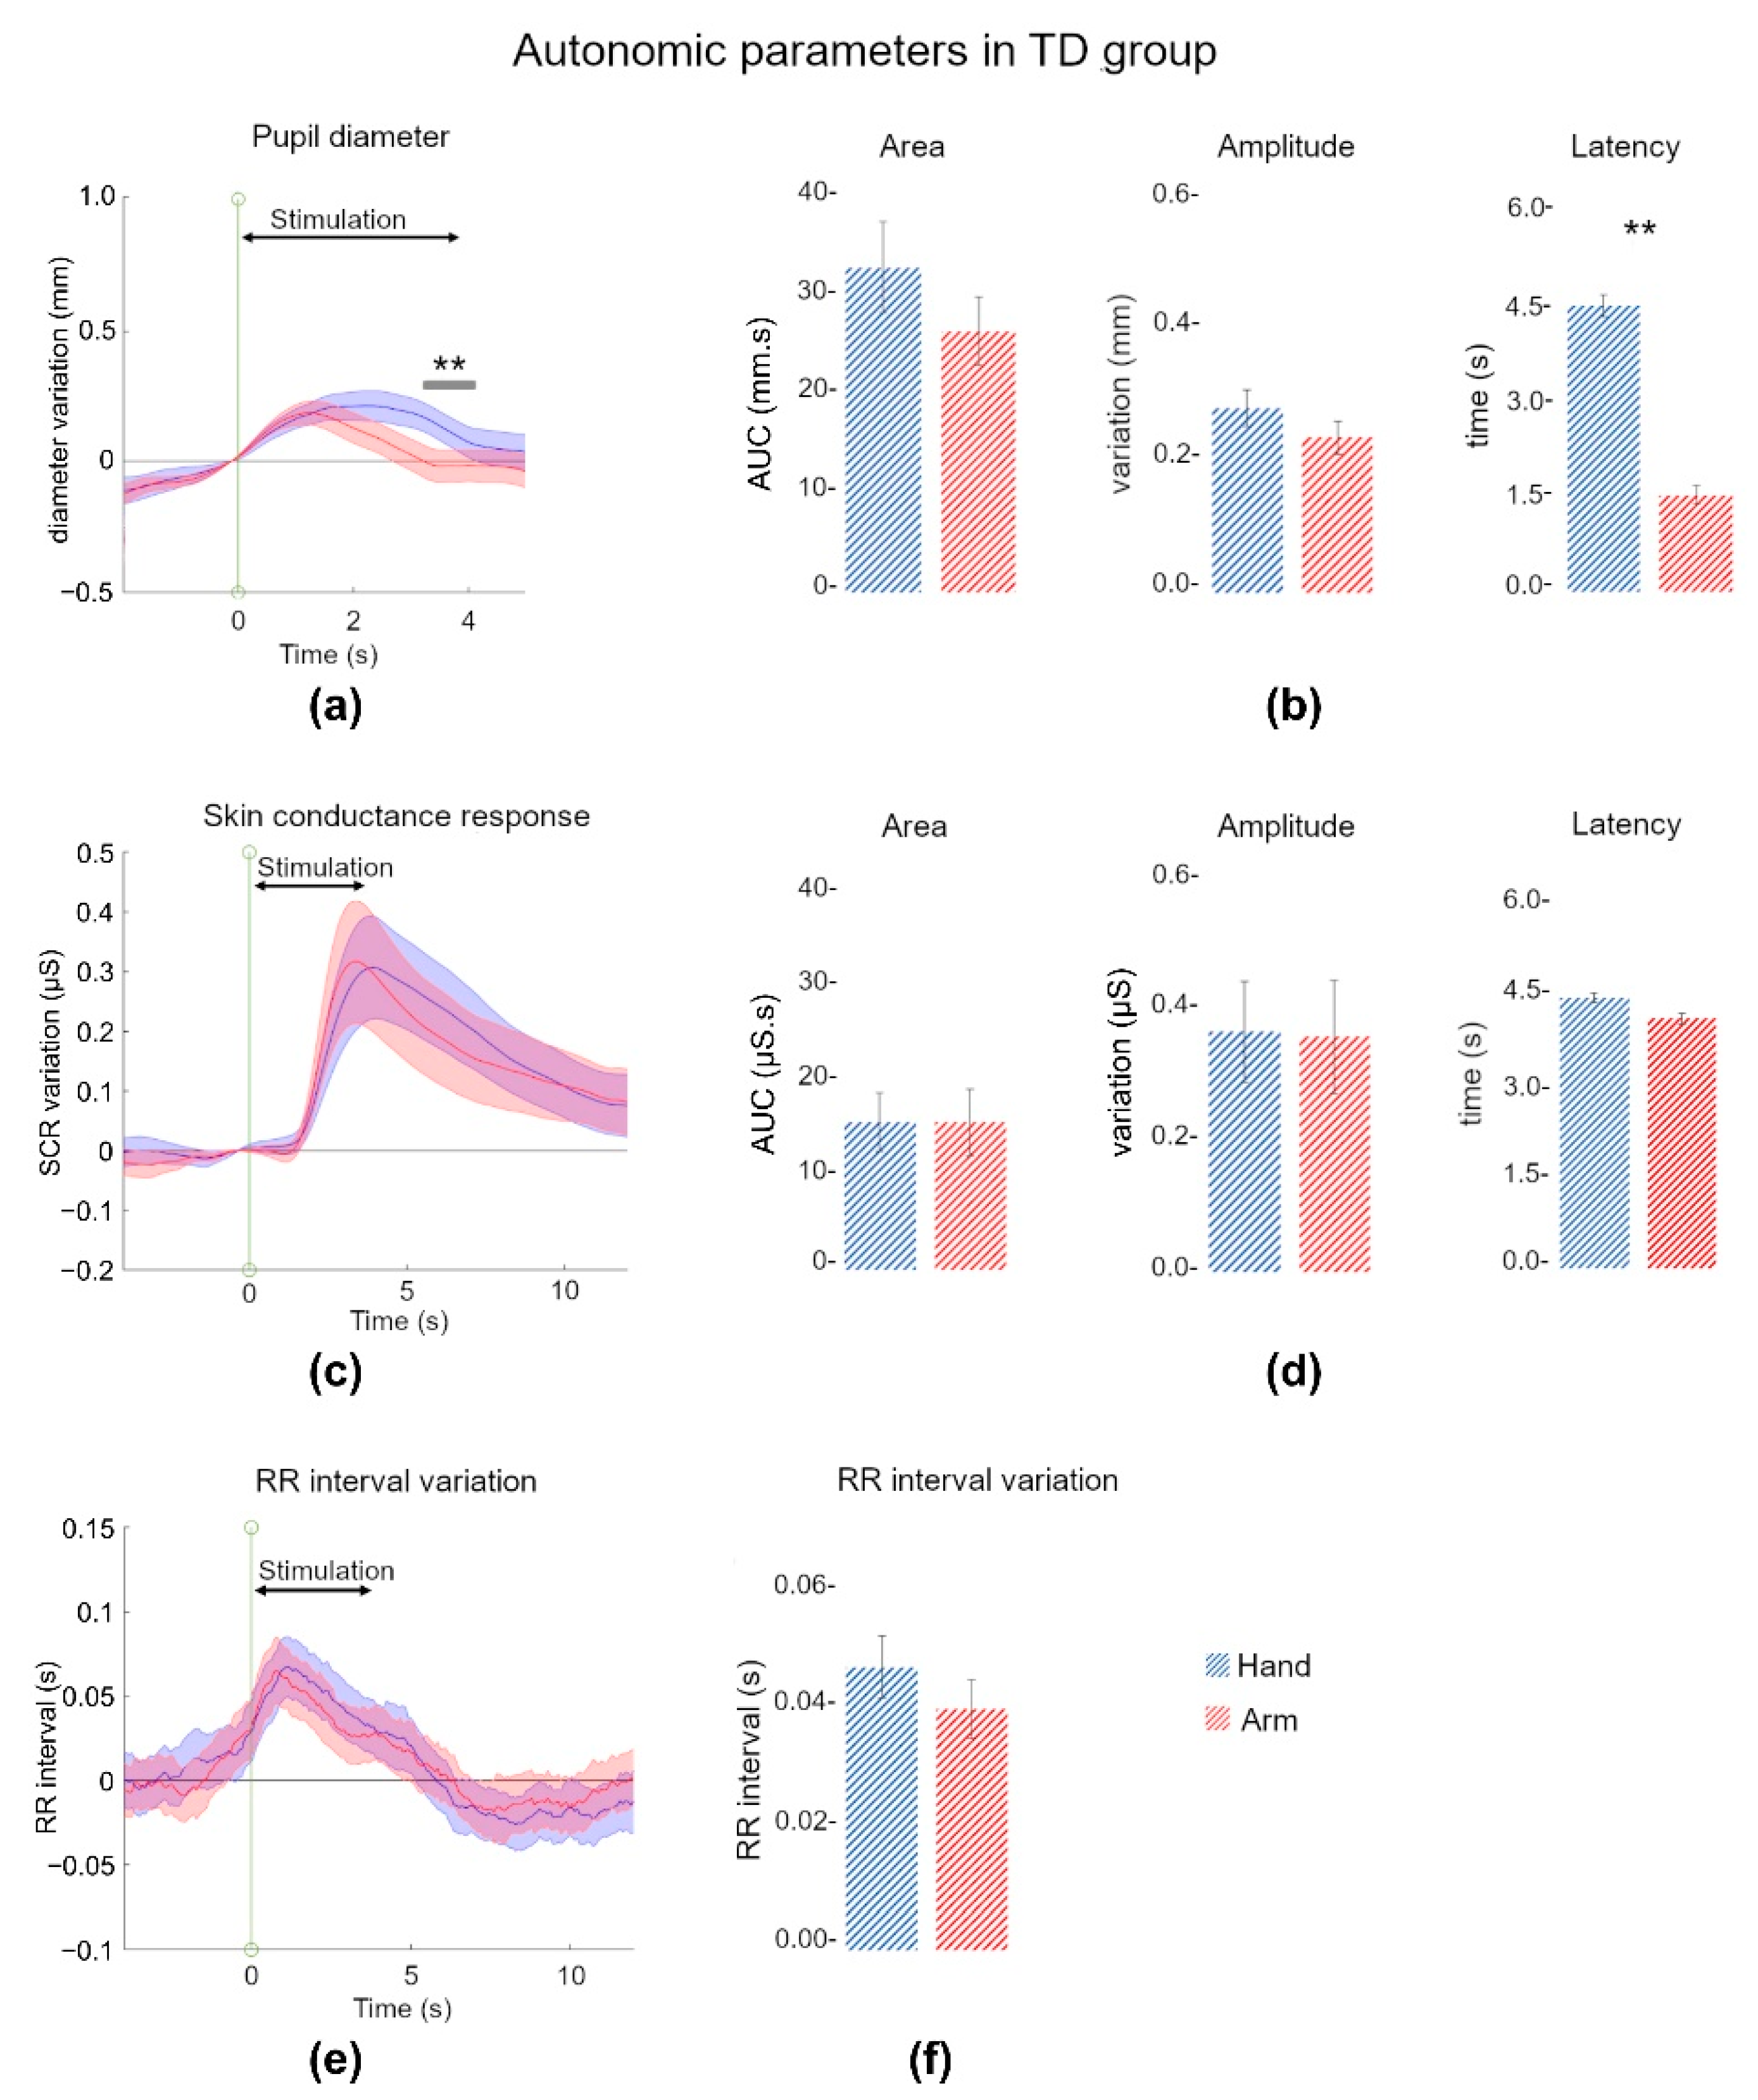
3.1. Affective Touch Evoked an Autonomic Response in TD Children
3.1.1. Pupil Discriminated Touch Locations
3.1.2. Skin Conductance Reacted to Pleasant and Affective Touch
3.1.3. Heart Rate Decelerated during Affective Touch
3.1.4. Some Correlations within and between Autonomic Indices Parameters
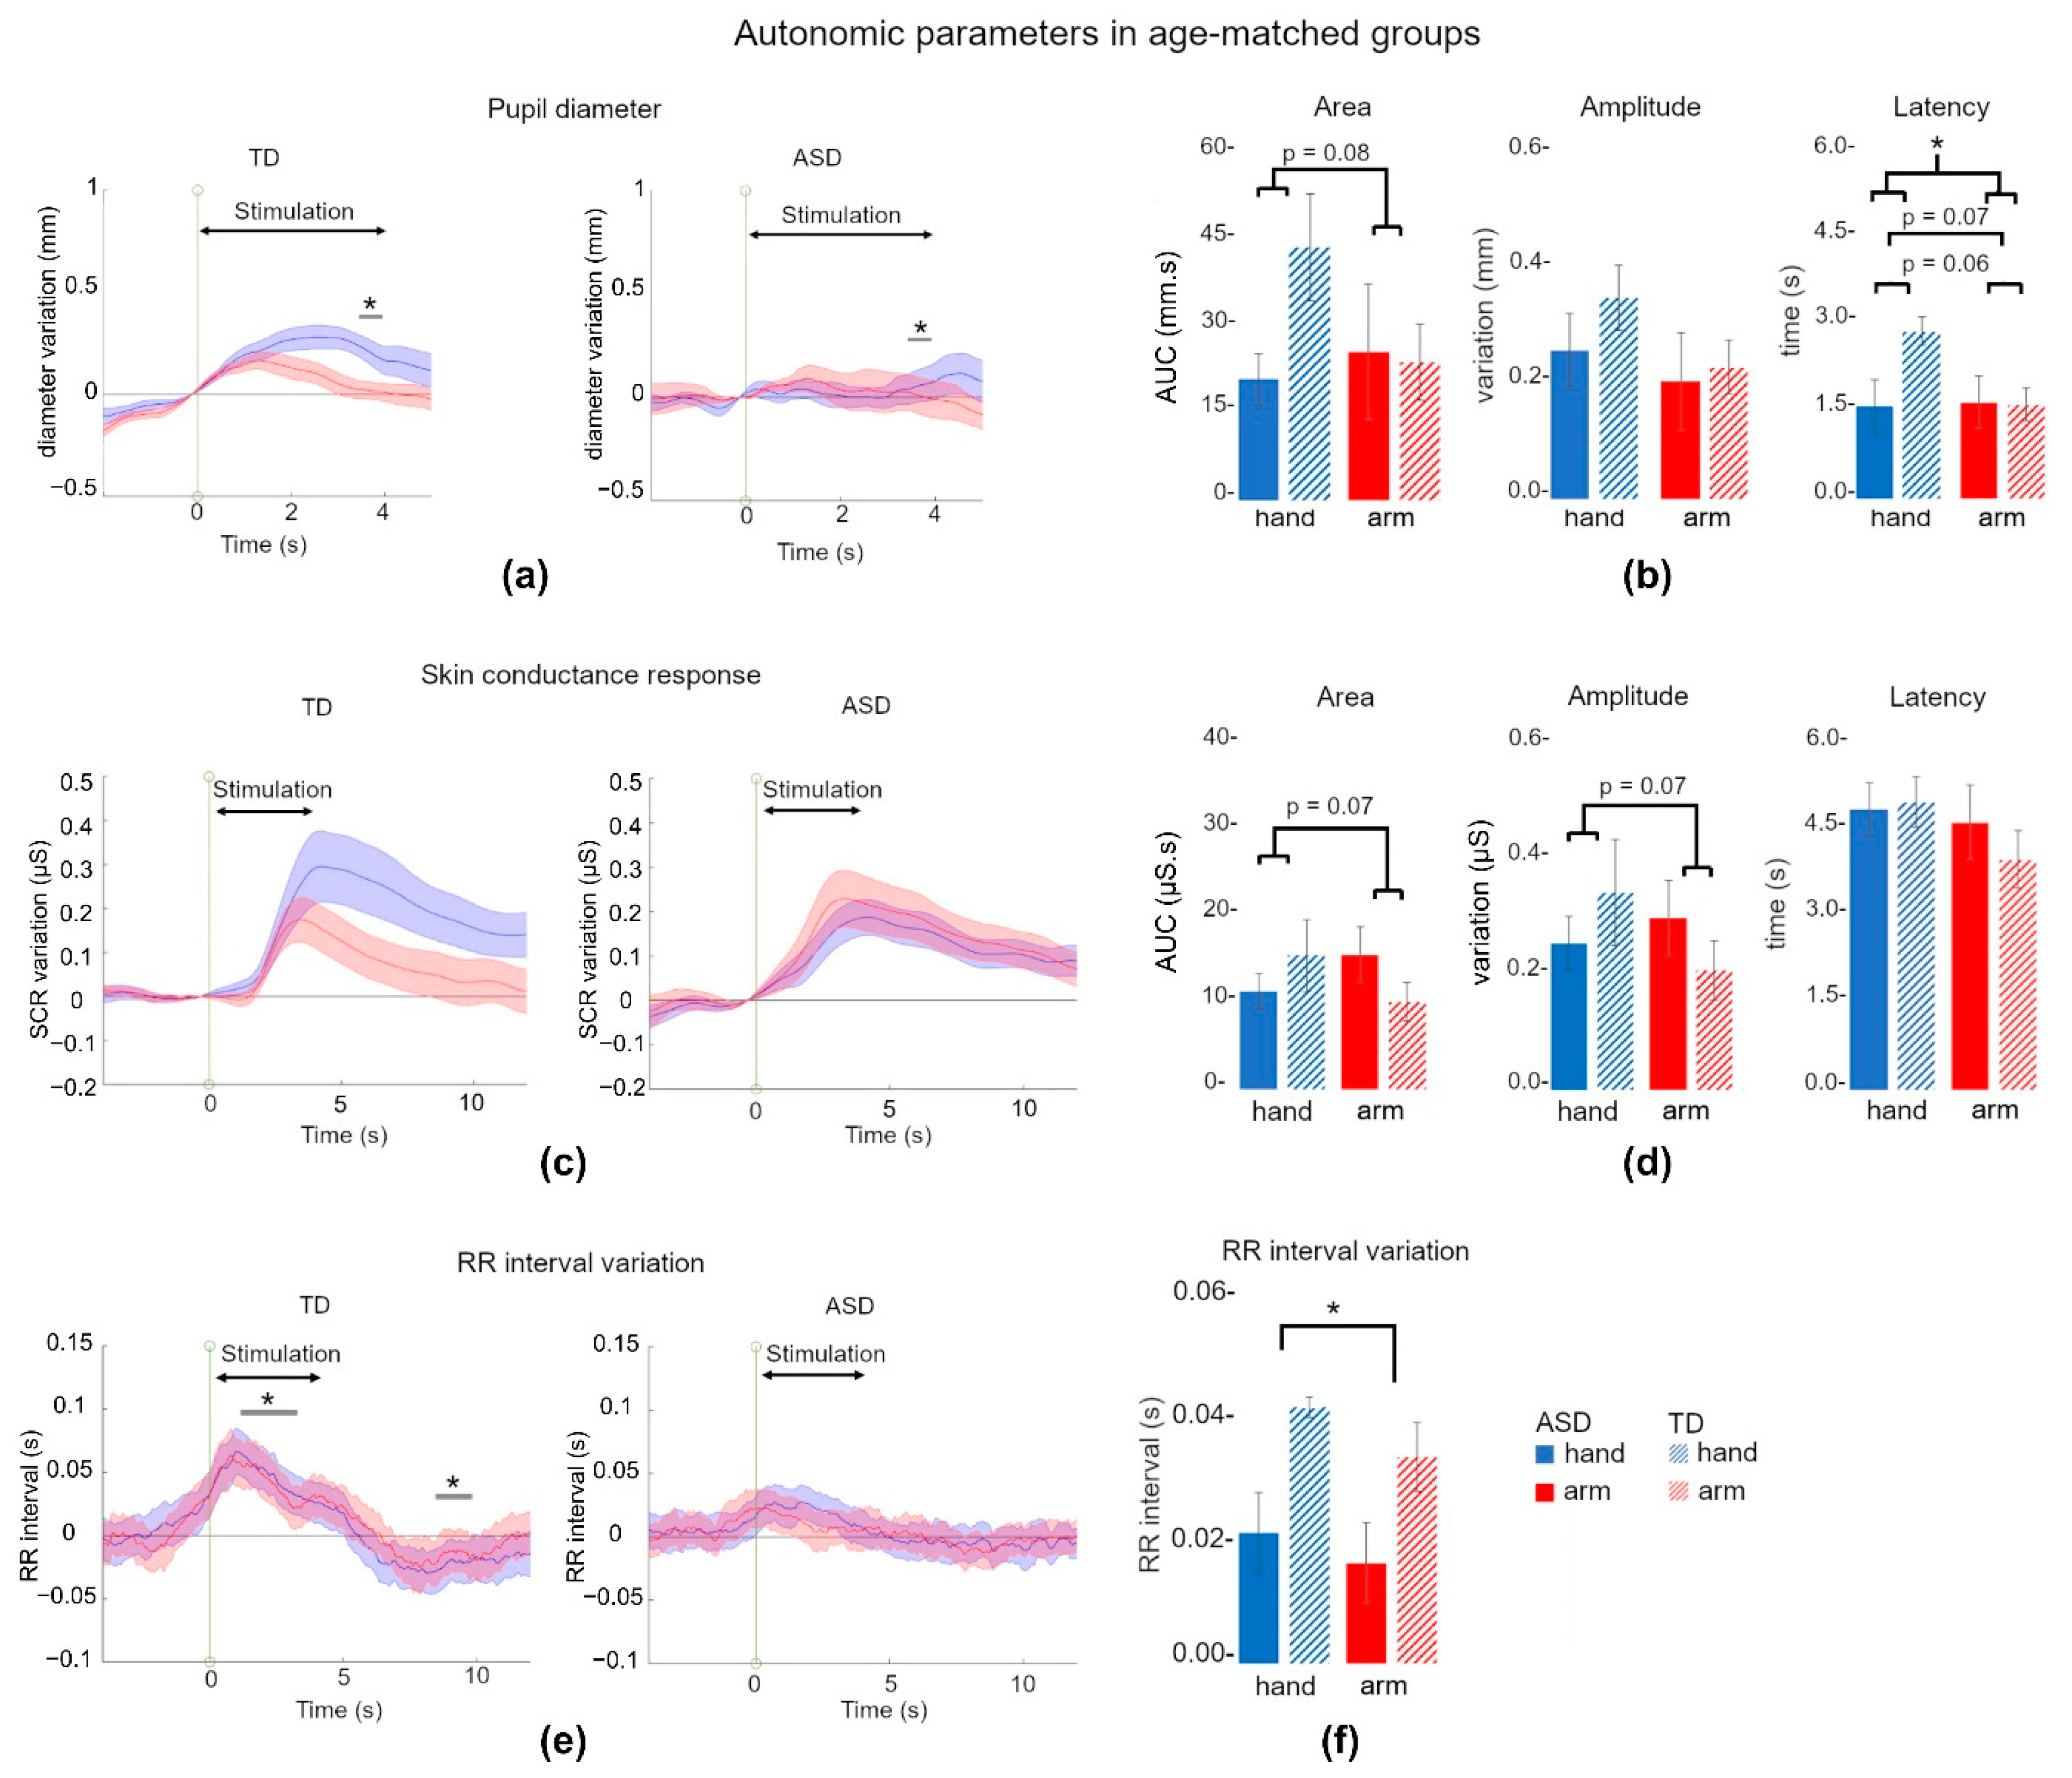
3.2. Affective Touch Evoked Smaller Autonomic Responses in ASD
3.2.1. Pupil Dilation Tended to Discriminate TD and ASD Children
3.2.2. Skin Conductance Response Was Not Different between ASD and TD Children
3.2.3. RR Interval Did Not Increase following Pleasant Stimulation in ASD Children
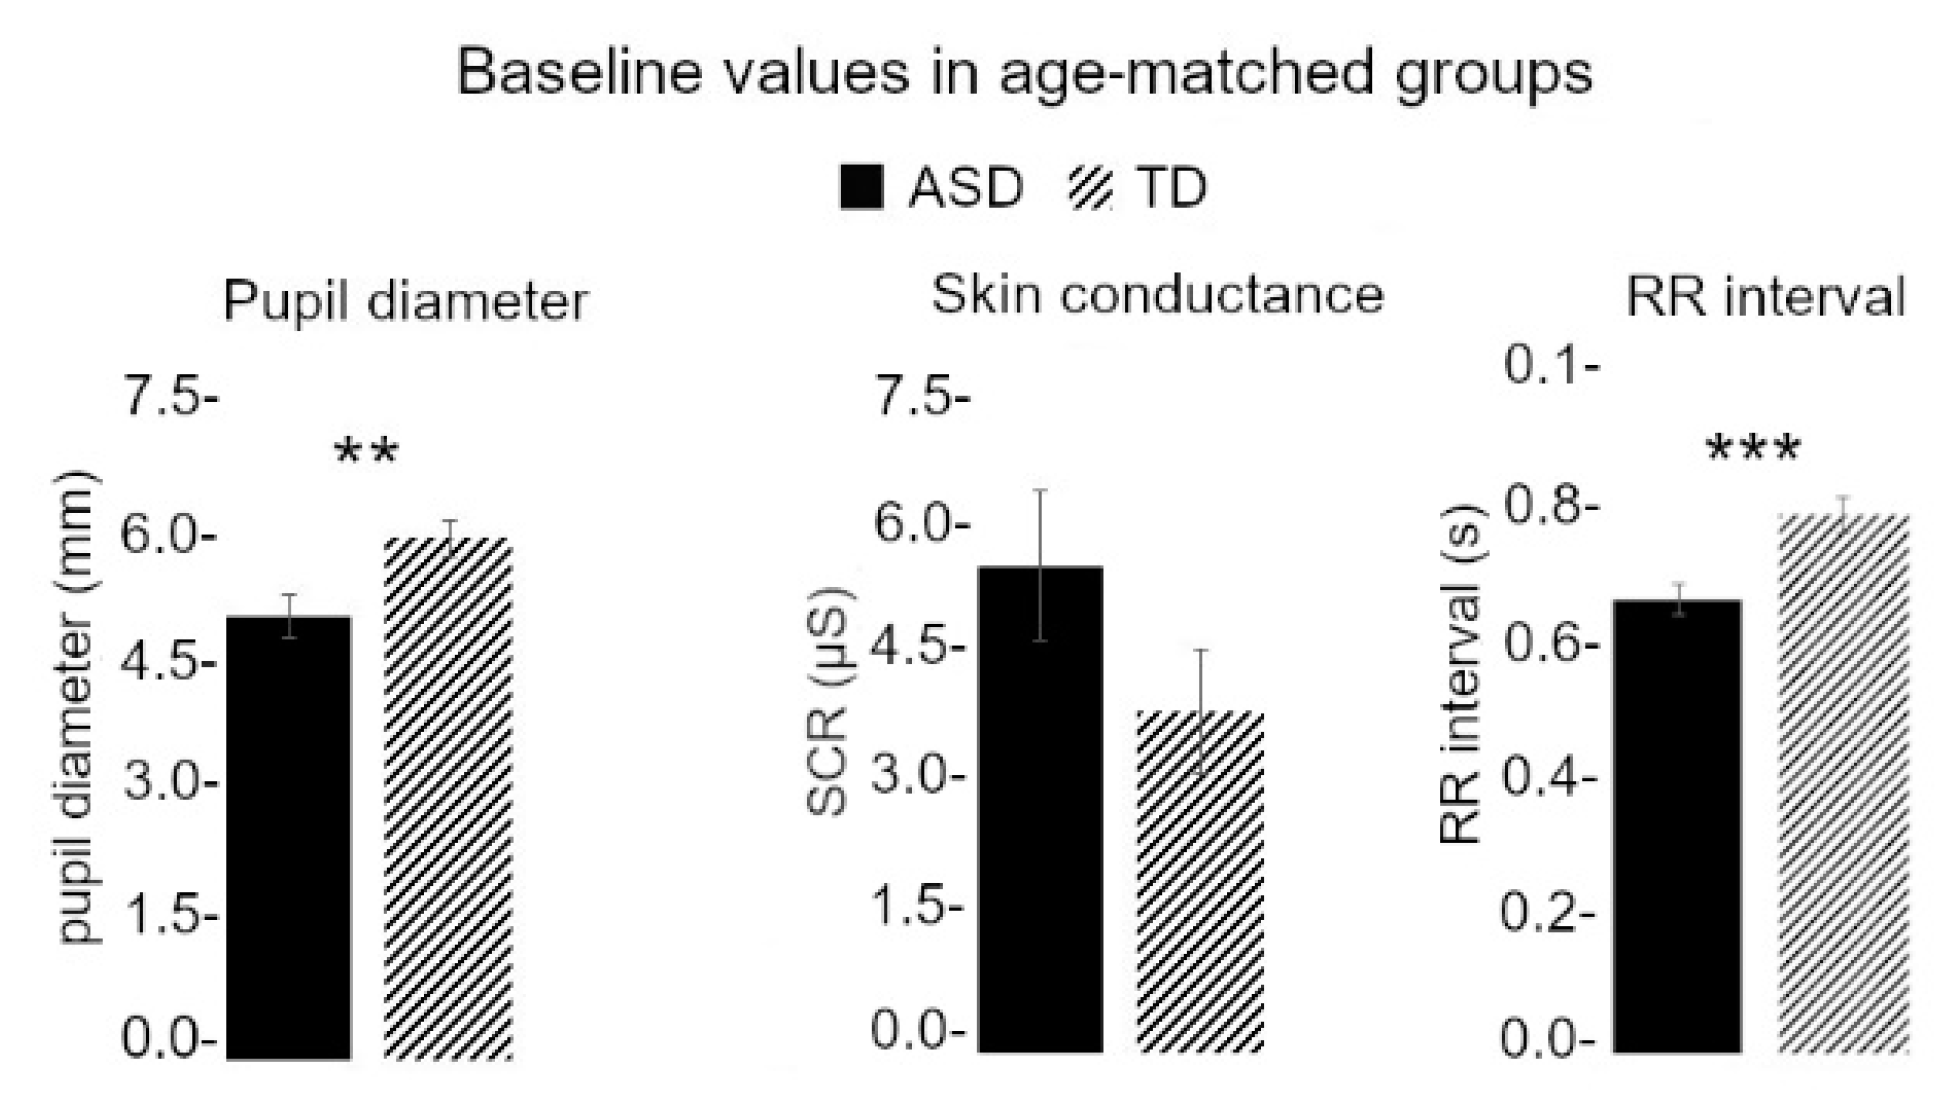
3.3. Baseline Values Were Different between TD and ASD Children
3.4. Baseline Differences Did Not Explain Affective Touch Reactivity Differences between TD and ASD Children
3.5. Few Correlations between Autonomic and Clinical or Sensory Parameters
4. Discussion
4.1. Autonomic Responses in TD Children
4.2. Differences between TD and ASD Children
4.3. Limits of the Study
5. Conclusions and Perspectives
Supplementary Materials
Author Contributions
Funding
Institutional Review Board Statement
Informed Consent Statement
Data Availability Statement
Acknowledgments
Conflicts of Interest
Abbreviations
| ANS | autonomic nervous system |
| ASD | autism spectrum disorder |
| AUC | area under the curve |
| CDA | continuous decomposition analysis |
| CNS | central nervous system |
| CT fibers | C-tactile fibers |
| IENF | intraepidermal nerve fibers |
| IBI | inter-beat interval |
| LTMR | low threshold mechano-receptor |
| PNS | parasympathetic nervous system |
| SCR | skin conductance response |
| SNS | sympathetic nervous system |
References
- Montagu, A. Touching: The Human Significance of the Skin; Perennial Library: New York, NY, USA, 1986; ISBN 978-0-06-015535-3. [Google Scholar]
- Cascio, C.J.; Moore, D.; McGlone, F. Social Touch and Human Development. Dev. Cogn. Neurosci. 2019, 35, 5–11. [Google Scholar] [CrossRef] [PubMed]
- Ellingsen, D.-M.; Wessberg, J.; Chelnokova, O.; Olausson, H.; Laeng, B.; Leknes, S. In Touch with Your Emotions: Oxytocin and Touch Change Social Impressions While Others’ Facial Expressions Can Alter Touch. Psychoneuroendocrinology 2014, 39, 11–20. [Google Scholar] [CrossRef]
- Krahé, C.; von Mohr, M.; Gentsch, A.; Guy, L.; Vari, C.; Nolte, T.; Fotopoulou, A. Sensitivity to CT-Optimal, Affective Touch Depends on Adult Attachment Style. Sci. Rep. 2018, 8, 14544. [Google Scholar] [CrossRef] [PubMed] [Green Version]
- McGlone, F.; Wessberg, J.; Olausson, H. Discriminative and Affective Touch: Sensing and Feeling. Neuron 2014, 82, 737–755. [Google Scholar] [CrossRef] [PubMed] [Green Version]
- Bohic, M.; Abraira, V.E. Wired for Social Touch: The Sense That Binds Us to Others. Curr. Opin. Behav. Sci. 2022, 43, 207–215. [Google Scholar] [CrossRef]
- Löken, L.S.; Wessberg, J.; Morrison, I.; McGlone, F.; Olausson, H. Coding of Pleasant Touch by Unmyelinated Afferents in Humans. Nat. Neurosci. 2009, 12, 547–548. [Google Scholar] [CrossRef]
- Ackerley, R. C-Tactile (CT) Afferents: Evidence of Their Function from Microneurography Studies in Humans. Curr. Opin. Behav. Sci. 2022, 43, 95–100. [Google Scholar] [CrossRef]
- Ackerley, R.; Backlund Wasling, H.; Liljencrantz, J.; Olausson, H.; Johnson, R.D.; Wessberg, J. Human C-Tactile Afferents Are Tuned to the Temperature of a Skin-Stroking Caress. J. Neurosci. 2014, 34, 2879–2883. [Google Scholar] [CrossRef] [Green Version]
- Olausson, H.; Lamarre, Y.; Backlund, H.; Morin, C.; Wallin, B.G.; Starck, G.; Ekholm, S.; Strigo, I.; Worsley, K.; Vallbo, Å.B.; et al. Unmyelinated Tactile Afferents Signal Touch and Project to Insular Cortex. Nat. Neurosci. 2002, 5, 900–904. [Google Scholar] [CrossRef]
- Watkins, R.H.; Dione, M.; Ackerley, R.; Backlund Wasling, H.; Wessberg, J.; Löken, L.S. Evidence for Sparse C-Tactile Afferent Innervation of Glabrous Human Hand Skin. J. Neurophysiol. 2021, 125, 232–237. [Google Scholar] [CrossRef]
- Morrison, I.; Löken, L.S.; Olausson, H. The Skin as a Social Organ. Exp. Brain Res. 2010, 204, 305–314. [Google Scholar] [CrossRef] [PubMed]
- Gentsch, A.; Panagiotopoulou, E.; Fotopoulou, A. Active Interpersonal Touch Gives Rise to the Social Softness Illusion. Curr. Biol. 2015, 25, 2392–2397. [Google Scholar] [CrossRef] [PubMed] [Green Version]
- Cruciani, G.; Zanini, L.; Russo, V.; Boccardi, E.; Spitoni, G.F. Pleasantness Ratings in Response to Affective Touch across Hairy and Glabrous Skin: A Meta-Analysis. Neurosci. Biobehav. Rev. 2021, 131, 88–95. [Google Scholar] [CrossRef] [PubMed]
- Marshall, A.G.; Sharma, M.L.; Marley, K.; Olausson, H.; McGlone, F.P. Spinal Signalling of C-Fiber Mediated Pleasant Touch in Humans. elife 2019, 8, e51642. [Google Scholar] [CrossRef] [PubMed]
- Eriksson Hagberg, E.; Ackerley, R.; Lundqvist, D.; Schneiderman, J.; Jousmäki, V.; Wessberg, J. Spatio-Temporal Profile of Brain Activity during Gentle Touch Investigated with Magnetoencephalography. NeuroImage 2019, 201, 116024. [Google Scholar] [CrossRef]
- Gothard, K.M.; Fuglevand, A.J. The Role of the Amygdala in Processing Social and Affective Touch. Curr. Opin. Behav. Sci. 2022, 43, 46–53. [Google Scholar] [CrossRef]
- Klöcker, A.; Oddo, C.M.; Camboni, D.; Penta, M.; Thonnard, J.-L. Physical Factors Influencing Pleasant Touch during Passive Fingertip Stimulation. PLoS ONE 2014, 9, e101361. [Google Scholar] [CrossRef]
- Marshall, A. Processing and Transmission of Affective Touch in the Spinal Cord. Curr. Opin. Behav. Sci. 2022, 43, 34–39. [Google Scholar] [CrossRef]
- Walker, S.C.; Marshall, A.; Pawling, R. Psychophysiology and Motivated Emotion: Testing the Affective Touch Hypothesis of C-Tactile Afferent Function. Curr. Opin. Behav. Sci. 2022, 43, 131–137. [Google Scholar] [CrossRef]
- Foss-Feig, J.H.; Heacock, J.L.; Cascio, C.J. Tactile Responsiveness Patterns and Their Association with Core Features in Autism Spectrum Disorders. Res. Autism Spectr. Disord. 2012, 6, 337–344. [Google Scholar] [CrossRef]
- American Psychiatric Association. Diagnostic and Statistical Manual of Mental Disorders, 5th ed.; American Psychiatric Association: Washington, DC, USA, 2013; ISBN 978-0-89042-555-8. [Google Scholar]
- Baranek, G.T.; David, F.J.; Poe, M.D.; Stone, W.L.; Watson, L.R. Sensory Experiences Questionnaire: Discriminating Sensory Features in Young Children with Autism, Developmental Delays, and Typical Development: SEQ. J. Child Psychol. Psychiatry 2006, 47, 591–601. [Google Scholar] [CrossRef] [PubMed]
- Tomchek, S.D.; Little, L.M.; Myers, J.; Dunn, W. Sensory Subtypes in Preschool Aged Children with Autism Spectrum Disorder. J. Autism Dev. Disord. 2018, 48, 2139–2147. [Google Scholar] [CrossRef] [PubMed]
- Reynolds, S.; Bendixen, R.M.; Lawrence, T.; Lane, S.J. A Pilot Study Examining Activity Participation, Sensory Responsiveness, and Competence in Children with High Functioning Autism Spectrum Disorder. J. Autism Dev. Disord. 2011, 41, 1496–1506. [Google Scholar] [CrossRef] [PubMed] [Green Version]
- Grandin, T. An Inside View of Autism. In High-Functioning Individuals with Autism; Schopler, E., Mesibov, G.B., Eds.; Springer: Boston, MA, USA, 1992; pp. 105–126. ISBN 978-1-4899-2458-2. [Google Scholar]
- Tomchek, S.D.; Dunn, W. Sensory Processing in Children With and Without Autism: A Comparative Study Using the Short Sensory Profile. Am. J. Occup. Ther. 2007, 61, 190–200. [Google Scholar] [CrossRef] [Green Version]
- Fernández-Andrés, M.I.; Pastor-Cerezuela, G.; Sanz-Cervera, P.; Tárraga-Mínguez, R. A Comparative Study of Sensory Processing in Children with and without Autism Spectrum Disorder in the Home and Classroom Environments. Res. Dev. Disabil. 2015, 38, 202–212. [Google Scholar] [CrossRef]
- Kern, J.K.; Trivedi, M.H.; Garver, C.R.; Grannemann, B.D.; Andrews, A.A.; Savla, J.S.; Johnson, D.G.; Mehta, J.A.; Schroeder, J.L. The Pattern of Sensory Processing Abnormalities in Autism. Autism 2006, 10, 480–494. [Google Scholar] [CrossRef]
- Wiggins, L.D.; Robins, D.L.; Bakeman, R.; Adamson, L.B. Breif Report: Sensory Abnormalities as Distinguishing Symptoms of Autism Spectrum Disorders in Young Children. J. Autism Dev. Disord. 2009, 39, 1087–1091. [Google Scholar] [CrossRef]
- Güçlü, B.; Tanidir, C.; Mukaddes, N.M.; Ünal, F. Tactile Sensitivity of Normal and Autistic Children. Somatosens. Mot. Res. 2007, 24, 21–33. [Google Scholar] [CrossRef]
- Blakemore, S.-J.; Tavassoli, T.; Calò, S.; Thomas, R.M.; Catmur, C.; Frith, U.; Haggard, P. Tactile Sensitivity in Asperger Syndrome. Brain Cogn. 2006, 61, 5–13. [Google Scholar] [CrossRef]
- Cascio, C.; McGlone, F.; Folger, S.; Tannan, V.; Baranek, G.; Pelphrey, K.A.; Essick, G. Tactile Perception in Adults with Autism: A Multidimensional Psychophysical Study. J. Autism Dev. Disord. 2008, 38, 127–137. [Google Scholar] [CrossRef]
- Puts, N.A.J.; Wodka, E.L.; Tommerdahl, M.; Mostofsky, S.H.; Edden, R.A.E. Impaired Tactile Processing in Children with Autism Spectrum Disorder. J. Neurophysiol. 2014, 111, 1803–1811. [Google Scholar] [CrossRef] [PubMed]
- He, J.L.; Wodka, E.; Tommerdahl, M.; Edden, R.A.E.; Mikkelsen, M.; Mostofsky, S.H.; Puts, N.A.J. Disorder-Specific Alterations of Tactile Sensitivity in Neurodevelopmental Disorders. Commun. Biol. 2021, 4, 97. [Google Scholar] [CrossRef]
- O’Riordan, M.; Passetti, F. Discrimination in Autism within Different Sensory Modalities. J. Autism Dev. Disord. 2006, 36, 665–675. [Google Scholar] [CrossRef] [PubMed]
- Tavassoli, T.; Bellesheim, K.; Tommerdahl, M.; Holden, J.M.; Kolevzon, A.; Buxbaum, J.D. Altered Tactile Processing in Children with Autism Spectrum Disorder: Tactile Processing, Inhibition, ASD. Autism Res. 2016, 9, 616–620. [Google Scholar] [CrossRef]
- Hilton, C.L.; Harper, J.D.; Kueker, R.H.; Lang, A.R.; Abbacchi, A.M.; Todorov, A.; LaVesser, P.D. Sensory Responsiveness as a Predictor of Social Severity in Children with High Functioning Autism Spectrum Disorders. J. Autism Dev. Disord. 2010, 40, 937–945. [Google Scholar] [CrossRef] [PubMed]
- Cascio, C.J.; Moana-Filho, E.J.; Guest, S.; Nebel, M.B.; Weisner, J.; Baranek, G.T.; Essick, G.K. Perceptual and Neural Response to Affective Tactile Texture Stimulation in Adults with Autism Spectrum Disorders. Autism Res. 2012, 5, 231–244. [Google Scholar] [CrossRef] [Green Version]
- Cascio, C.J.; Lorenzi, J.; Baranek, G.T. Self-Reported Pleasantness Ratings and Examiner-Coded Defensiveness in Response to Touch in Children with ASD: Effects of Stimulus Material and Bodily Location. J. Autism Dev. Disord. 2016, 46, 1528–1537. [Google Scholar] [CrossRef] [Green Version]
- Kaiser, M.D.; Yang, D.Y.-J.; Voos, A.C.; Bennett, R.H.; Gordon, I.; Pretzsch, C.; Beam, D.; Keifer, C.; Eilbott, J.; McGlone, F.; et al. Brain Mechanisms for Processing Affective (and Nonaffective) Touch Are Atypical in Autism. Cereb. Cortex 2016, 26, 2705–2714. [Google Scholar] [CrossRef] [Green Version]
- Jackson, E.E.; McGlone, F.P.; Haggarty, C.J. The Social Brain Has a Nerve: Insights from Attachment and Autistic Phenotypes. Curr. Opin. Behav. Sci. 2022, 45, 101114. [Google Scholar] [CrossRef]
- Orefice, L.L.; Zimmerman, A.L.; Chirila, A.M.; Sleboda, S.J.; Head, J.P.; Ginty, D.D. Peripheral Mechanosensory Neuron Dysfunction Underlies Tactile and Behavioral Deficits in Mouse Models of ASDs. Cell 2016, 166, 299–313. [Google Scholar] [CrossRef]
- Baranek, G.T. Autism during Infancy: A Retrospective Video Analysis of Sensory-Motor and Social Behaviors at 9–12 Months of Age. J. Autism Dev. Disord. 1999, 29, 213–224. [Google Scholar] [CrossRef]
- Voos, A.C.; Pelphrey, K.A.; Kaiser, M.D. Autistic Traits Are Associated with Diminished Neural Response to Affective Touch. Soc. Cogn. Affect. Neurosci. 2013, 8, 378–386. [Google Scholar] [CrossRef] [PubMed] [Green Version]
- Perini, I.; Gustafsson, P.A.; Igelström, K.; Jasiunaite-Jokubaviciene, B.; Kämpe, R.; Mayo, L.M.; Molander, J.; Olausson, H.; Zetterqvist, M.; Heilig, M. Altered Relationship between Subjective Perception and Central Representation of Touch Hedonics in Adolescents with Autism-Spectrum Disorder. Transl. Psychiatry 2021, 11, 224. [Google Scholar] [CrossRef] [PubMed]
- Haggarty, C.J.; Malinowski, P.; McGlone, F.P.; Walker, S.C. Autistic Traits Modulate Cortical Responses to Affective but Not Discriminative Touch. Eur. J. Neurosci. 2020, 51, 1844–1855. [Google Scholar] [CrossRef] [PubMed]
- Jung, J.; Zbozinek, T.D.; Cummings, K.K.; Wilhelm, F.H.; Dapretto, M.; Craske, M.G.; Bookheimer, S.Y.; Green, S.A. Associations between Physiological and Neural Measures of Sensory Reactivity in Youth with Autism. J. Child Psychol Psychiatr. 2021, 62, 1183–1194. [Google Scholar] [CrossRef] [PubMed]
- McGlone, F.; Olausson, H.; Boyle, J.A.; Jones-Gotman, M.; Dancer, C.; Guest, S.; Essick, G. Touching and Feeling: Differences in Pleasant Touch Processing between Glabrous and Hairy Skin in Humans: Pleasant Touch on Glabrous and Hairy Skin. Eur. J. Neurosci. 2012, 35, 1782–1788. [Google Scholar] [CrossRef]
- Mayo, L.M.; Lindé, J.; Olausson, H.; Heilig, M.; Morrison, I. Putting a Good Face on Touch: Facial Expression Reflects the Affective Valence of Caress-like Touch across Modalities. Biol. Psychol. 2018, 137, 83–90. [Google Scholar] [CrossRef]
- Boehme, R.; Hauser, S.; Gerling, G.J.; Heilig, M.; Olausson, H. Distinction of Self-Produced Touch and Social Touch at Cortical and Spinal Cord Levels. Proc. Natl. Acad. Sci. USA 2019, 116, 2290–2299. [Google Scholar] [CrossRef] [Green Version]
- Dimberg, U. For Distinguished Early Career Contribution to Psychophysiology: Award Address, 1988.: Facial Electromyography and Emotional Reactions. Psychophysiology 1990, 27, 481–494. [Google Scholar] [CrossRef]
- Bradley, M.M.; Lang, P.J. Affective Reactions to Acoustic Stimuli. Psychophysiology 2000, 37, 204–215. [Google Scholar] [CrossRef]
- Bradley, M.M.; Codispoti, M.; Cuthbert, B.N.; Lang, P.J. Emotion and Motivation I: Defensive and Appetitive Reactions in Picture Processing. Emotion 2001, 1, 276–298. [Google Scholar] [CrossRef] [PubMed]
- Bradley, M.M.; Miccoli, L.; Escrig, M.A.; Lang, P.J. The Pupil as a Measure of Emotional Arousal and Autonomic Activation. Psychophysiology 2008, 45, 602–607. [Google Scholar] [CrossRef] [PubMed] [Green Version]
- Bertheaux, C.; Toscano, R.; Fortunier, R.; Roux, J.-C.; Charier, D.; Borg, C. Emotion Measurements Through the Touch of Materials Surfaces. Front. Hum. Neurosci. 2020, 13, 455. [Google Scholar] [CrossRef] [PubMed] [Green Version]
- van Hooijdonk, R.; Mathot, S.; Schat, E.; Spencer, H.; van der Stigchel, S.; Dijkerman, H.C. Touch-Induced Pupil Size Reflects Stimulus Intensity, Not Subjective Pleasantness. Exp. Brain Res. 2019, 237, 201–210. [Google Scholar] [CrossRef] [PubMed] [Green Version]
- Gusso, M.D.M.; Serur, G.; Nohama, P. Pupil Reactions to Tactile Stimulation: A Systematic Review. Front. Neurosci. 2021, 15, 610841. [Google Scholar] [CrossRef]
- Etzi, R.; Carta, C.; Gallace, A. Stroking and Tapping the Skin: Behavioral and Electrodermal Effects. Exp. Brain Res. 2018, 236, 453–461. [Google Scholar] [CrossRef]
- Fairhurst, M.T.; Löken, L.; Grossmann, T. Physiological and Behavioral Responses Reveal 9-Month-Old Infants’ Sensitivity to Pleasant Touch. Psychol Sci. 2014, 25, 1124–1131. [Google Scholar] [CrossRef] [Green Version]
- Aguirre, M.; Couderc, A.; Epinat-Duclos, J.; Mascaro, O. Infants Discriminate the Source of Social Touch at Stroking Speeds Eliciting Maximal Firing Rates in CT-Fibers. Dev. Cogn. Neurosci. 2019, 36, 100639. [Google Scholar] [CrossRef]
- Croy, I.; Fairhurst, M.T.; McGlone, F. The Role of C-Tactile Nerve Fibers in Human Social Development. Curr. Opin. Behav. Sci. 2022, 43, 20–26. [Google Scholar] [CrossRef]
- Linnér, A.; Lode Kolz, K.; Klemming, S.; Bergman, N.; Lilliesköld, S.; Markhus Pike, H.; Westrup, B.; Rettedal, S.; Jonas, W. Immediate Skin-to-skin Contact May Have Beneficial Effects on the Cardiorespiratory Stabilisation in Very Preterm Infants. Acta Paediatr. 2022, 111, 1507–1514. [Google Scholar] [CrossRef]
- Pawling, R.; Trotter, P.D.; McGlone, F.P.; Walker, S.C. A Positive Touch: C-Tactile Afferent Targeted Skin Stimulation Carries an Appetitive Motivational Value. Biol. Psychol. 2017, 129, 186–194. [Google Scholar] [CrossRef] [PubMed]
- Pawling, R.; Cannon, P.R.; McGlone, F.P.; Walker, S.C. C-Tactile Afferent Stimulating Touch Carries a Positive Affective Value. PLoS ONE 2017, 12, e0173457. [Google Scholar] [CrossRef] [Green Version]
- Cannon, W.B. Organization for Physiological Homeostasis. Physiol. Rev. 1929, 9, 399–431. [Google Scholar] [CrossRef]
- McCorry, L.K. Physiology of the Autonomic Nervous System. Am. J. Pharm. Educ. 2007, 71, 78. [Google Scholar] [CrossRef] [Green Version]
- Berntson, G.G.; Cacioppo, J.T.; Quigley, K.S. Autonomic Determinism: The Modes of Autonomic Control, the Doctrine of Autonomic Space, and the Laws of Autonomic Constraint. Psychol. Rev. 1991, 98, 459–487. [Google Scholar] [CrossRef]
- Berntson, G.G.; Cacioppo, J.T. Integrative Physiology: Homeostasis, Allostasis, and the Orchestration of Systemic Physiology. In Handbook of Psychophysiology; Cacioppo, J.T., Tassinary, L.G., Berntson, G., Eds.; Cambridge University Press: Cambridge, UK, 2007; pp. 433–452. ISBN 978-0-511-54639-6. [Google Scholar]
- Porges, S.W. Cardiac Vagal Tone: A Physiological Index of Stress. Neurosci. Biobehav. Rev. 1995, 19, 225–233. [Google Scholar] [CrossRef]
- Porges, S.W. The Polyvagal Theory: New Insights into Adaptive Reactions of the Autonomic Nervous System. Clevel. Clin. J. Med. 2009, 76, S86–S90. [Google Scholar] [CrossRef] [PubMed]
- Friedman, B.H.; Thayer, J.F.; Borkovec, T.D.; Tyrell, R.A.; Johnson, B.-H.; Columbo, R. Autonomic Characteristics of Nonclinical Panic and Blood Phobia. Biol. Psychiatry 1993, 34, 298–310. [Google Scholar] [CrossRef] [PubMed]
- Fabes, R.A.; Eisenberg, N.; Karbon, M.; Troyer, D.; Switzer, G. The Relations of Children’s Emotion Regulation to Their Vicarious Emotional Responses and Comforting Behaviors. Child Dev. 1994, 65, 1678. [Google Scholar] [CrossRef]
- Hastings, M.E.; Tangney, J.P.; Stuewig, J. Psychopathy and Identification of Facial Expressions of Emotion. Personal. Individ. Differ. 2008, 44, 1474–1483. [Google Scholar] [CrossRef]
- Suess, P.E.; Porges, S.W.; Plude, D.J. Cardiac Vagal Tone and Sustained Attention in School-Age Children. Psychophysiology 1994, 31, 17–22. [Google Scholar] [CrossRef]
- Beauchaine, T. Vagal Tone, Development, and Gray’s Motivational Theory: Toward an Integratedmodel of Autonomic Nervous System Functioning in Psychopathology. Dev. Psychopathol. 2001, 13, 183–214. [Google Scholar] [CrossRef] [Green Version]
- Joshi, S.; Gold, J.I. Pupil Size as a Window on Neural Substrates of Cognition. Trends Cogn. Sci. 2020, 24, 466–480. [Google Scholar] [CrossRef]
- Dawson, M.E.; Schell, A.M.; Filion, D.L. The Electrodermal System. In Handbook of Psychophysiology; Cambridge University Press: Cambridge, UK, 2017. [Google Scholar]
- Wang, C.-A.; Baird, T.; Huang, J.; Coutinho, J.D.; Brien, D.C.; Munoz, D.P. Arousal Effects on Pupil Size, Heart Rate, and Skin Conductance in an Emotional Face Task. Front. Neurol. 2018, 9, 1029. [Google Scholar] [CrossRef]
- Wilhelm, F.H.; Kochar, A.S.; Roth, W.T.; Gross, J.J. Social Anxiety and Response to Touch: Incongruence between Self-Evaluative and Physiological Reactions. Biol. Psychol. 2001, 58, 181–202. [Google Scholar] [CrossRef]
- Sgoifo, A.; Braglia, F.; Costoli, T.; Musso, E.; Meerlo, P.; Ceresini, G.; Troisi, A. Cardiac Autonomic Reactivity and Salivary Cortisol in Men and Women Exposed to Social Stressors: Relationship with Individual Ethological Profile. Neurosci. Biobehav. Rev. 2003, 27, 179–188. [Google Scholar] [CrossRef]
- Sánchez-Conde, P.; Beltrán-Velasco, A.I.; Clemente-Suárez, V.J. Influence of Psychological Profile in Autonomic Response of Nursing Students in Their First Hospital Clinical Stays. Physiol. Behav. 2019, 207, 99–103. [Google Scholar] [CrossRef]
- Raine, A. Autonomic Nervous System Factors Underlying Disinhibited, Antisocial, and Violent Behavior Biosocial Perspectives and Treatment Implications. Ann. N. Y. Acad. Sci. 1996, 794, 46–59. [Google Scholar] [CrossRef]
- Del Giudice, M.; Ellis, B.J.; Shirtcliff, E.A. The Adaptive Calibration Model of Stress Responsivity. Neurosci. Biobehav. Rev. 2011, 35, 1562–1592. [Google Scholar] [CrossRef] [Green Version]
- Kushki, A.; Drumm, E.; Pla Mobarak, M.; Tanel, N.; Dupuis, A.; Chau, T.; Anagnostou, E. Investigating the Autonomic Nervous System Response to Anxiety in Children with Autism Spectrum Disorders. PLoS ONE 2013, 8, e59730. [Google Scholar] [CrossRef]
- Patriquin, M.A.; Hartwig, E.M.; Friedman, B.H.; Porges, S.W.; Scarpa, A. Autonomic Response in Autism Spectrum Disorder: Relationship to Social and Cognitive Functioning. Biol. Psychol. 2019, 145, 185–197. [Google Scholar] [CrossRef] [PubMed]
- Arora, I.; Bellato, A.; Ropar, D.; Hollis, C.; Groom, M.J. Is Autonomic Function during Resting-State Atypical in Autism: A Systematic Review of Evidence. Neurosci. Biobehav. Rev. 2021, 125, 417–441. [Google Scholar] [CrossRef] [PubMed]
- Schoen, S.A. Physiological and Behavioral Differences in Sensory Processing: A Comparison of Children with Autism Spectrum Disorder and Sensory Processing Disorder. Front. Integr. Neurosci. 2009, 3, 29. [Google Scholar] [CrossRef] [PubMed] [Green Version]
- Van Hecke, A.V.; Lebow, J.; Bal, E.; Lamb, D.; Harden, E.; Kramer, A.; Denver, J.; Bazhenova, O.; Porges, S.W. Electroencephalogram and Heart Rate Regulation to Familiar and Unfamiliar People in Children With Autism Spectrum Disorders. Child Dev. 2009, 80, 1118–1133. [Google Scholar] [CrossRef]
- Bal, E.; Harden, E.; Lamb, D.; Van Hecke, A.V.; Denver, J.W.; Porges, S.W. Emotion Recognition in Children with Autism Spectrum Disorders: Relations to Eye Gaze and Autonomic State. J. Autism Dev. Disord. 2010, 40, 358–370. [Google Scholar] [CrossRef] [PubMed]
- Joseph, R.M.; Ehrman, K.; Mcnally, R.; Keehn, B. Affective Response to Eye Contact and Face Recognition Ability in Children with ASD. J. Int. Neuropsychol. Soc. 2008, 14, 947–955. [Google Scholar] [CrossRef] [Green Version]
- Martineau, J.; Hernandez, N.; Hiebel, L.; Roché, L.; Metzger, A.; Bonnet-Brilhault, F. Can Pupil Size and Pupil Responses during Visual Scanning Contribute to the Diagnosis of Autism Spectrum Disorder in Children? J. Psychiatr. Res. 2011, 45, 1077–1082. [Google Scholar] [CrossRef]
- Aguillon-Hernandez, N.; Mofid, Y.; Latinus, M.; Roché, L.; Bufo, M.R.; Lemaire, M.; Malvy, J.; Martineau, J.; Wardak, C.; Bonnet-Brilhault, F. The Pupil: A Window on Social Automatic Processing in Autism Spectrum Disorder Children. J. Child Psychol. Psychiatry 2020, 61, 768–778. [Google Scholar] [CrossRef]
- Fukuyama, H.; Kumagaya, S.; Asada, K.; Ayaya, S.; Kato, M. Autonomic versus Perceptual Accounts for Tactile Hypersensitivity in Autism Spectrum Disorder. Sci. Rep. 2017, 7, 8259. [Google Scholar] [CrossRef] [Green Version]
- McIntosh, D.N.; Miller, L.J.; Shyu, V.; Hagerman, R.J. Sensory-Modulation Disruption, Electrodermal Responses, and Functional Behaviors. Dev. Med. Child Neurol. 1999, 41, 608–615. [Google Scholar] [CrossRef]
- Tordjman, S.; Anderson, G.M.; Botbol, M.; Brailly-Tabard, S.; Perez-Diaz, F.; Graignic, R.; Carlier, M.; Schmit, G.; Rolland, A.-C.; Bonnot, O.; et al. Pain Reactivity and Plasma Beta-Endorphin in Children and Adolescents with Autistic Disorder. PLoS ONE 2009, 4, e5289. [Google Scholar] [CrossRef] [PubMed]
- Porges, S. Polyvagal Theory and the Social Engagement System. In Complementary and Integrative Treatments in Psychiatric Practice; American Psychiatric Association Publishing: Washington, DC, USA, 2017. [Google Scholar]
- Porges, S.W. The Polyvagal Perspective. Biol. Psychol. 2007, 74, 116–143. [Google Scholar] [CrossRef] [PubMed]
- Porges, S.W.; Macellaio, M.; Stanfill, S.D.; McCue, K.; Lewis, G.F.; Harden, E.R.; Handelman, M.; Denver, J.; Bazhenova, O.V.; Heilman, K.J. Respiratory Sinus Arrhythmia and Auditory Processing in Autism: Modifiable Deficits of an Integrated Social Engagement System? Int. J. Psychophysiol. 2013, 88, 261–270. [Google Scholar] [CrossRef] [PubMed] [Green Version]
- Lord, C.; Rutter, M.; Le Couteur, A. Autism Diagnostic Interview-Revised: A Revised Version of a Diagnostic Interview for Caregivers of Individuals with Possible Pervasive Developmental Disorders. J. Autism Dev. Disord. 1994, 24, 659–685. [Google Scholar] [CrossRef]
- Lord, C.; Rutter, M.; DiLavore, P.C.; Risi, S. Autism Diagnostic Observation Schedule—Generic; APA PsycTests: Washington, DC, USA, 1999. [Google Scholar] [CrossRef]
- Croy, I.; Sehlstedt, I.; Wasling, H.B.; Ackerley, R.; Olausson, H. Gentle Touch Perception: From Early Childhood to Adolescence. Dev. Cogn. Neurosci. 2019, 35, 81–86. [Google Scholar] [CrossRef]
- World Medical Association. World Medical Association Declaration of Helsinki: Ethical Principles for Medical Research Involving Human Subjects. JAMA 2013, 310, 2191–2194. [Google Scholar] [CrossRef] [PubMed] [Green Version]
- Dunn, W.; Westman, K. The Sensory Profile: The Performance of a National Sample of Children Without Disabilities. Am. J. Occup. Ther. 1997, 51, 25–34. [Google Scholar] [CrossRef] [Green Version]
- Wechsler, D. Wechsler Abbreviated Scale of Intelligence, 2nd ed.; APA PsycTests: Washington, DC, USA, 2018. [Google Scholar]
- Schopler, E.; Reichler, R.J.; DeVellis, R.F.; Daly, K. Toward Objective Classification of Childhood Autism: Childhood Autism Rating Scale (CARS). J. Autism Dev. Disord. 1980, 10, 91–103. [Google Scholar] [CrossRef]
- Löken, L.S.; Evert, M.; Wessberg, J. Pleasantness of Touch in Human Glabrous and Hairy Skin: Order Effects on Affective Ratings. Brain Res. 2011, 1417, 9–15. [Google Scholar] [CrossRef]
- Nyström, M.; Holmqvist, K. An Adaptive Algorithm for Fixation, Saccade, and Glissade Detection in Eyetracking Data. Behav. Res. Methods 2010, 42, 188–204. [Google Scholar] [CrossRef] [Green Version]
- Kret, M.E.; Sjak-Shie, E.E. Preprocessing Pupil Size Data: Guidelines and Code. Behav. Res. 2019, 51, 1336–1342. [Google Scholar] [CrossRef] [PubMed] [Green Version]
- Jackson, I.; Sirois, S. Infant Cognition: Going Full Factorial with Pupil Dilation. Dev. Sci. 2009, 12, 670–679. [Google Scholar] [CrossRef] [PubMed]
- Benedek, M.; Kaernbach, C. A Continuous Measure of Phasic Electrodermal Activity. J. Neurosci. Methods 2010, 190, 80–91. [Google Scholar] [CrossRef] [Green Version]
- Bach, D.R.; Flandin, G.; Friston, K.J.; Dolan, R.J. Time-Series Analysis for Rapid Event-Related Skin Conductance Responses. J. Neurosci. Methods 2009, 184, 224–234. [Google Scholar] [CrossRef] [Green Version]
- Staib, M.; Castegnetti, G.; Bach, D.R. Optimising a Model-Based Approach to Inferring Fear Learning from Skin Conductance Responses. J. Neurosci. Methods 2015, 255, 131–138. [Google Scholar] [CrossRef] [PubMed] [Green Version]
- Boucsein, W. Electrodermal Activity; Springer: Berlin/Heidelberg, Germany, 2012. [Google Scholar]
- Battaglia, S.; Orsolini, S.; Borgomaneri, S.; Barbieri, R.; Diciotti, S.; di Pellegrino, G. Characterizing Cardiac Autonomic Dynamics of Fear Learning in Humans. Psychophysiology 2022, 59, e14122. [Google Scholar] [CrossRef]
- Nabil, D.; Bereksi Reguig, F. Ectopic Beats Detection and Correction Methods: A Review. Biomed. Signal Process. Control 2015, 18, 228–244. [Google Scholar] [CrossRef]
- Singh, D.; Vinod, K.; Saxena, S. Sampling Frequency of the RR Interval Time Series for Spectral Analysis of Heart Rate Variability. J. Med. Eng. Technol. 2004, 28, 263–272. [Google Scholar] [CrossRef]
- Castegnetti, G.; Tzovara, A.; Staib, M.; Paulus, P.C.; Hofer, N.; Bach, D.R. Modeling Fear-Conditioned Bradycardia in Humans. Psychophysiology 2016, 53, 930–939. [Google Scholar] [CrossRef]
- Olausson, H.; Cole, J.; Rylander, K.; McGlone, F.; Lamarre, Y.; Wallin, B.G.; Krämer, H.; Wessberg, J.; Elam, M.; Bushnell, M.C.; et al. Functional Role of Unmyelinated Tactile Afferents in Human Hairy Skin: Sympathetic Response and Perceptual Localization. Exp. Brain Res. 2008, 184, 135–140. [Google Scholar] [CrossRef]
- Johansson, R.S.; Vallbo, A.B. Tactile Sensibility in the Human Hand: Relative and Absolute Densities of Four Types of Mechanoreceptive Units in Glabrous Skin. J. Physiol. 1979, 286, 283–300. [Google Scholar] [CrossRef] [PubMed]
- Vallbo, A.B.; Olausson, H.; Wessberg, J.; Kakuda, N. Receptive Field Characteristics of Tactile Units with Myelinated Afferents in Hairy Skin of Human Subjects. J. Physiol. 1995, 483, 783–795. [Google Scholar] [CrossRef] [PubMed]
- Vallbo, Å.B.; Olausson, H.; Wessberg, J. Unmyelinated Afferents Constitute a Second System Coding Tactile Stimuli of the Human Hairy Skin. J. Neurophysiol. 1999, 81, 2753–2763. [Google Scholar] [CrossRef] [PubMed] [Green Version]
- Castiello, U. The Neuroscience of Grasping. Nat. Rev. Neurosci. 2005, 6, 726–736. [Google Scholar] [CrossRef] [PubMed]
- Valenza, G.; Greco, A.; Gentili, C.; Lanata, A.; Sebastiani, L.; Menicucci, D.; Gemignani, A.; Scilingo, E.P. Combining Electroencephalographic Activity and Instantaneous Heart Rate for Assessing Brain–Heart Dynamics during Visual Emotional Elicitation in Healthy Subjects. Phil. Trans. R. Soc. A 2016, 374, 20150176. [Google Scholar] [CrossRef] [Green Version]
- Bufo, M.R.; Guidotti, M.; De Faria, C.; Mofid, Y.; Bonnet-Brilhault, F.; Wardak, C.; Aguillon-Hernandez, N. Autonomic Tone in Children and Adults: Pupillary, Electrodermal and Cardiac Activity at Rest. Int. J. Psychophysiol. 2022, 180, 68–78. [Google Scholar] [CrossRef]
- Chevallier, C.; Kohls, G.; Troiani, V.; Brodkin, E.S.; Schultz, R.T. The Social Motivation Theory of Autism. Trends Cogn. Sci. 2012, 16, 231–239. [Google Scholar] [CrossRef] [Green Version]
- Gordon, I.; Jack, A.; Pretzsch, C.M.; Vander Wyk, B.; Leckman, J.F.; Feldman, R.; Pelphrey, K.A. Intranasal Oxytocin Enhances Connectivity in the Neural Circuitry Supporting Social Motivation and Social Perception in Children with Autism. Sci. Rep. 2016, 6, 35054. [Google Scholar] [CrossRef] [Green Version]
- Silva, L.; Schalock, M. First Skin Biopsy Reports in Children with Autism Show Loss of C-Tactile Fibers. J. Neurol. Disord 2016, 4, 2. [Google Scholar] [CrossRef]
- Anderson, C.J.; Colombo, J. Larger Tonic Pupil Size in Young Children with Autism Spectrum Disorder. Dev. Psychobiol. 2009, 51, 207–211. [Google Scholar] [CrossRef]
- de Vries, L.; Fouquaet, I.; Boets, B.; Naulaers, G.; Steyaert, J. Autism Spectrum Disorder and Pupillometry: A Systematic Review and Meta-Analysis. Neurosci. Biobehav. Rev. 2021, 120, 479–508. [Google Scholar] [CrossRef] [PubMed]
- Joshi, S.; Li, Y.; Kalwani, R.M.; Gold, J.I. Relationships between Pupil Diameter and Neuronal Activity in the Locus Coeruleus, Colliculi, and Cingulate Cortex. Neuron 2016, 89, 221–234. [Google Scholar] [CrossRef] [PubMed] [Green Version]
- Ming, X.; Patel, R.; Kang, V.; Chokroverty, S.; Julu, P.O. Respiratory and Autonomic Dysfunction in Children with Autism Spectrum Disorders. Brain Dev. 2016, 38, 225–232. [Google Scholar] [CrossRef] [PubMed]
- Shaffer, F.; Meehan, Z.M. A Practical Guide to Resonance Frequency Assessment for Heart Rate Variability Biofeedback. Front. Neurosci. 2020, 14, 570400. [Google Scholar] [CrossRef]
- Steffen, P.R.; Austin, T.; DeBarros, A.; Brown, T. The Impact of Resonance Frequency Breathing on Measures of Heart Rate Variability, Blood Pressure, and Mood. Front. Public Health 2017, 5, 222. [Google Scholar] [CrossRef] [Green Version]
- Keith, J.M.; Jamieson, J.P.; Bennetto, L. The Importance of Adolescent Self-Report in Autism Spectrum Disorder: Integration of Questionnaire and Autonomic Measures. J. Abnorm. Child Psychol. 2019, 47, 741–754. [Google Scholar] [CrossRef]
- Schaaf, R.C.; Benevides, T.W.; Leiby, B.E.; Sendecki, J.A. Autonomic Dysregulation During Sensory Stimulation in Children with Autism Spectrum Disorder. J. Autism Dev. Disord. 2015, 45, 461–472. [Google Scholar] [CrossRef]
- Neuhaus, E.; Bernier, R.A.; Beauchaine, T.P. Children with Autism Show Altered Autonomic Adaptation to Novel and Familiar Social Partners: Autonomic Adaptation to Social Partners in Autism. Autism Res. 2016, 9, 579–591. [Google Scholar] [CrossRef]
- Latinus, M.; Mofid, Y.; Kovarski, K.; Charpentier, J.; Batty, M.; Bonnet-Brilhault, F. Atypical Sound Perception in ASD Explained by Inter-Trial (In)Consistency in EEG. Front. Psychol. 2019, 10, 1177. [Google Scholar] [CrossRef]
- Iriki, A.; Tanaka, M.; Iwamura, Y. Attention-Induced Neuronal Activity in the Monkey Somatosensory Cortex Revealed by Pupillometrics. Neurosci. Res. 1996, 25, 173–181. [Google Scholar] [CrossRef]
- Schirmer, A.; Lai, O.; McGlone, F.; Cham, C.; Lau, D. Gentle Stroking Elicits Somatosensory ERP That Differentiates between Hairy and Glabrous Skin. Soc. Cogn. Affect. Neurosci. 2022, 17, 864–875. [Google Scholar] [CrossRef] [PubMed]
- Field, T. Touch for Socioemotional and Physical Well-Being: A Review. Dev. Rev. 2010, 30, 367–383. [Google Scholar] [CrossRef]
- Triscoli, C.; Croy, I.; Olausson, H.; Sailer, U. Touch between Romantic Partners: Being Stroked Is More Pleasant than Stroking and Decelerates Heart Rate. Physiol. Behav. 2017, 177, 169–175. [Google Scholar] [CrossRef] [PubMed]


| TD Group | ASD Group | ASD Non-Tested Group | |
|---|---|---|---|
| n | 30 | 20 | 17 |
| sex M:F | 14:16 | 19:1 | 13:4 |
| age in years (±SD) | 9.20 ± 0.20 | 9.13 ± 1.69 | 9.80 ± 1.01 |
| verbal IQ [range] | 124 [88–155] | 73 [25–95] n = 13 | 44 [20–74] ** n = 12 |
| non verbal IQ [range] | 116 [88–146] | 71 [66–129] n = 4 | 67 [22–121] n = 7 |
| IQ total < 70 | 0 | 2 | 9 * |
| CARS [range] | 30 [24–40] n = 17 | 34 [30–40] ** n = 15 | |
| ADI-R: | |||
| - Social interaction [range] | 17 [5–29] n = 17 | 19 [10–28] n = 13 | |
| - Verbal communication [range] | 15 [6–22] n = 9 | 17 [10–21] n = 5 | |
| - Non verbal communication [range] | 9.5 [6–14] n = 13 | 10.5 [7–17] n = 8 | |
| - Repetitive and restricted behaviours [range] | 4.5 [1–9] n = 17 | 5.5 [0–12] n = 13 | |
| ADOS-2: | |||
| - Severity score [range] | 6.5 [1–10] n = 15 | 8 [3–10] n = 12 | |
| SSP2: | |||
| - Avoiding [range] | 29 [18–49] | 53 [33–68] n = 14 | 55 [36–65] n = 6 |
| - Registration [range] | 26 [21–41] | 40 [12–80] n = 14 | 42 [17–55] n = 6 |
| - Sensibility [range] | 23 [18–35] | 40 [26–54] n = 14 | 55 [30–65] * n = 6 |
| - Research [range] | 20 [13–33] | 40 [28–58] n = 14 | 55 [35–72] * n = 6 |
Publisher’s Note: MDPI stays neutral with regard to jurisdictional claims in published maps and institutional affiliations. |
© 2022 by the authors. Licensee MDPI, Basel, Switzerland. This article is an open access article distributed under the terms and conditions of the Creative Commons Attribution (CC BY) license (https://creativecommons.org/licenses/by/4.0/).
Share and Cite
Bufo, M.R.; Guidotti, M.; Mofid, Y.; Malvy, J.; Bonnet-Brilhault, F.; Aguillon-Hernandez, N.; Wardak, C. Atypical Response to Affective Touch in Children with Autism: Multi-Parametric Exploration of the Autonomic System. J. Clin. Med. 2022, 11, 7146. https://doi.org/10.3390/jcm11237146
Bufo MR, Guidotti M, Mofid Y, Malvy J, Bonnet-Brilhault F, Aguillon-Hernandez N, Wardak C. Atypical Response to Affective Touch in Children with Autism: Multi-Parametric Exploration of the Autonomic System. Journal of Clinical Medicine. 2022; 11(23):7146. https://doi.org/10.3390/jcm11237146
Chicago/Turabian StyleBufo, Maria Rosa, Marco Guidotti, Yassine Mofid, Joëlle Malvy, Frédérique Bonnet-Brilhault, Nadia Aguillon-Hernandez, and Claire Wardak. 2022. "Atypical Response to Affective Touch in Children with Autism: Multi-Parametric Exploration of the Autonomic System" Journal of Clinical Medicine 11, no. 23: 7146. https://doi.org/10.3390/jcm11237146