
Knee Cartilage Change within 5 Years after Aclr Using Hamstring Tendons with Preserved Tibial-Insertion: A Prospective Randomized Controlled Study Based on Magnetic Resonance Imaging

Abstract
:1. Introduction
2. Methods
2.1. Participants
2.2. Surgical Technique and Postoperative Rehabilitation
2.3. Clinical Evaluation
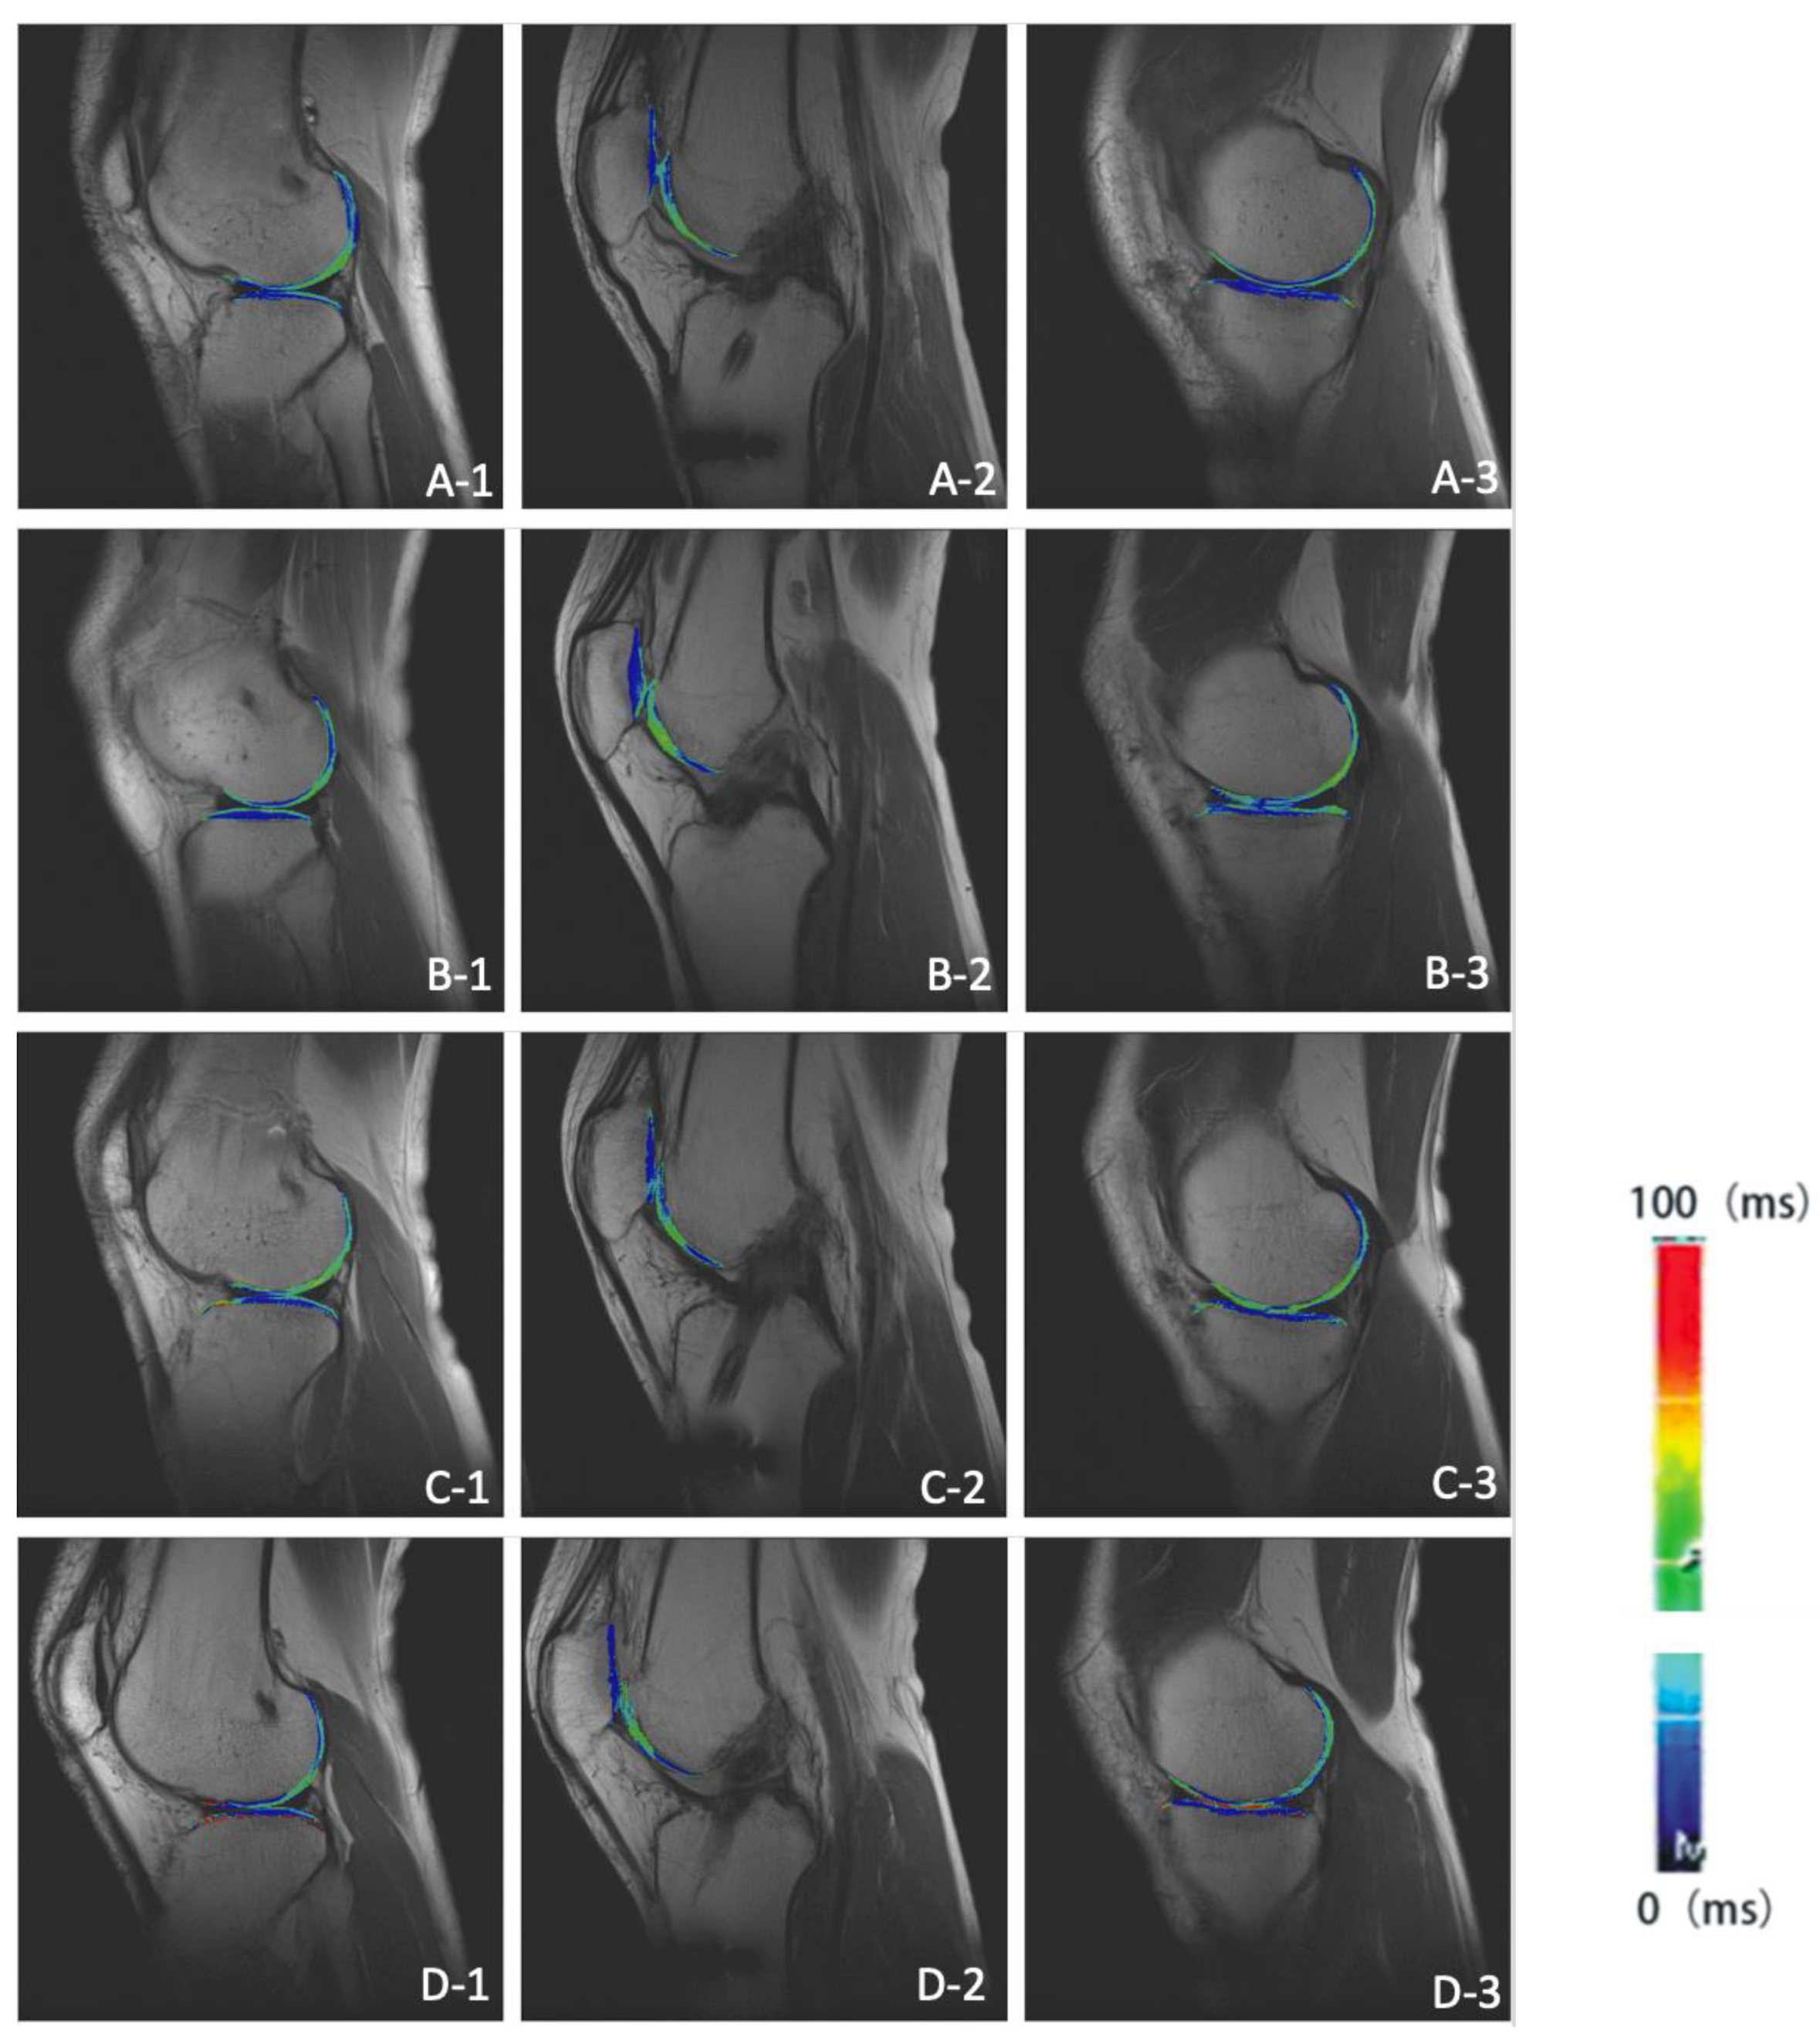
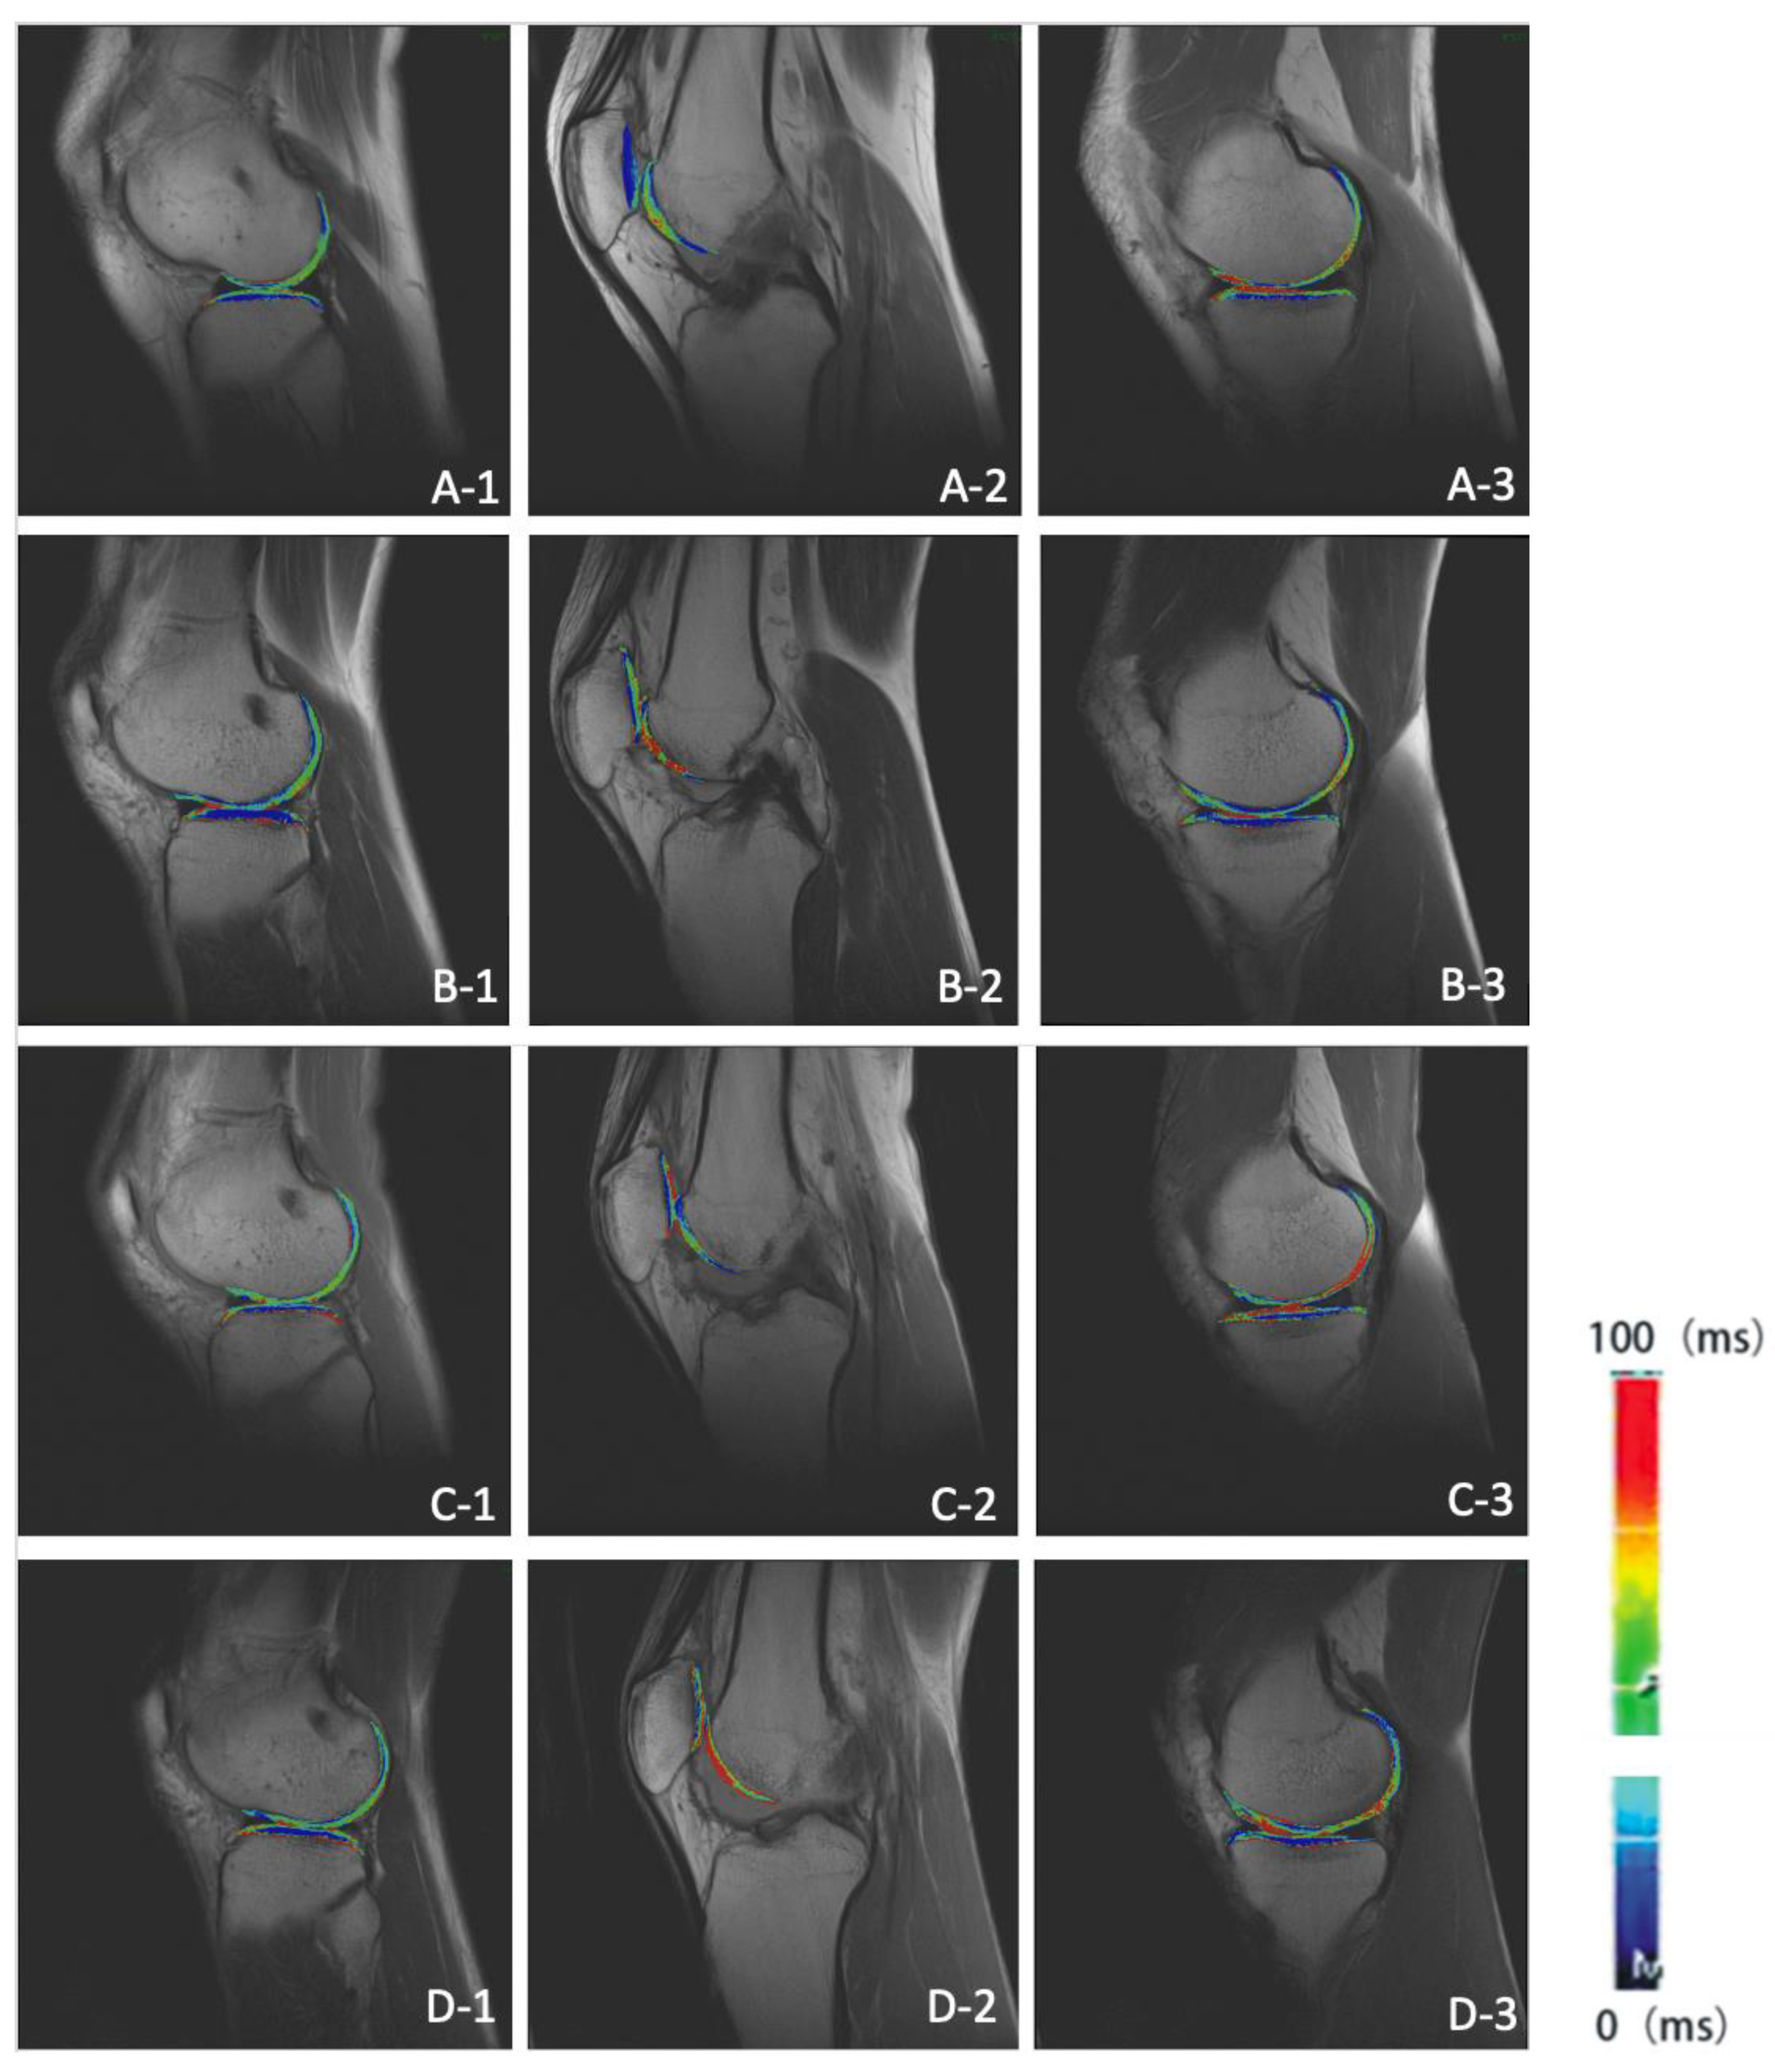
2.4. MRI Scan and Image Analysis
2.5. Statistical Analysis
3. Results
3.1. Clinical Outcomes
3.2. MRI Findings
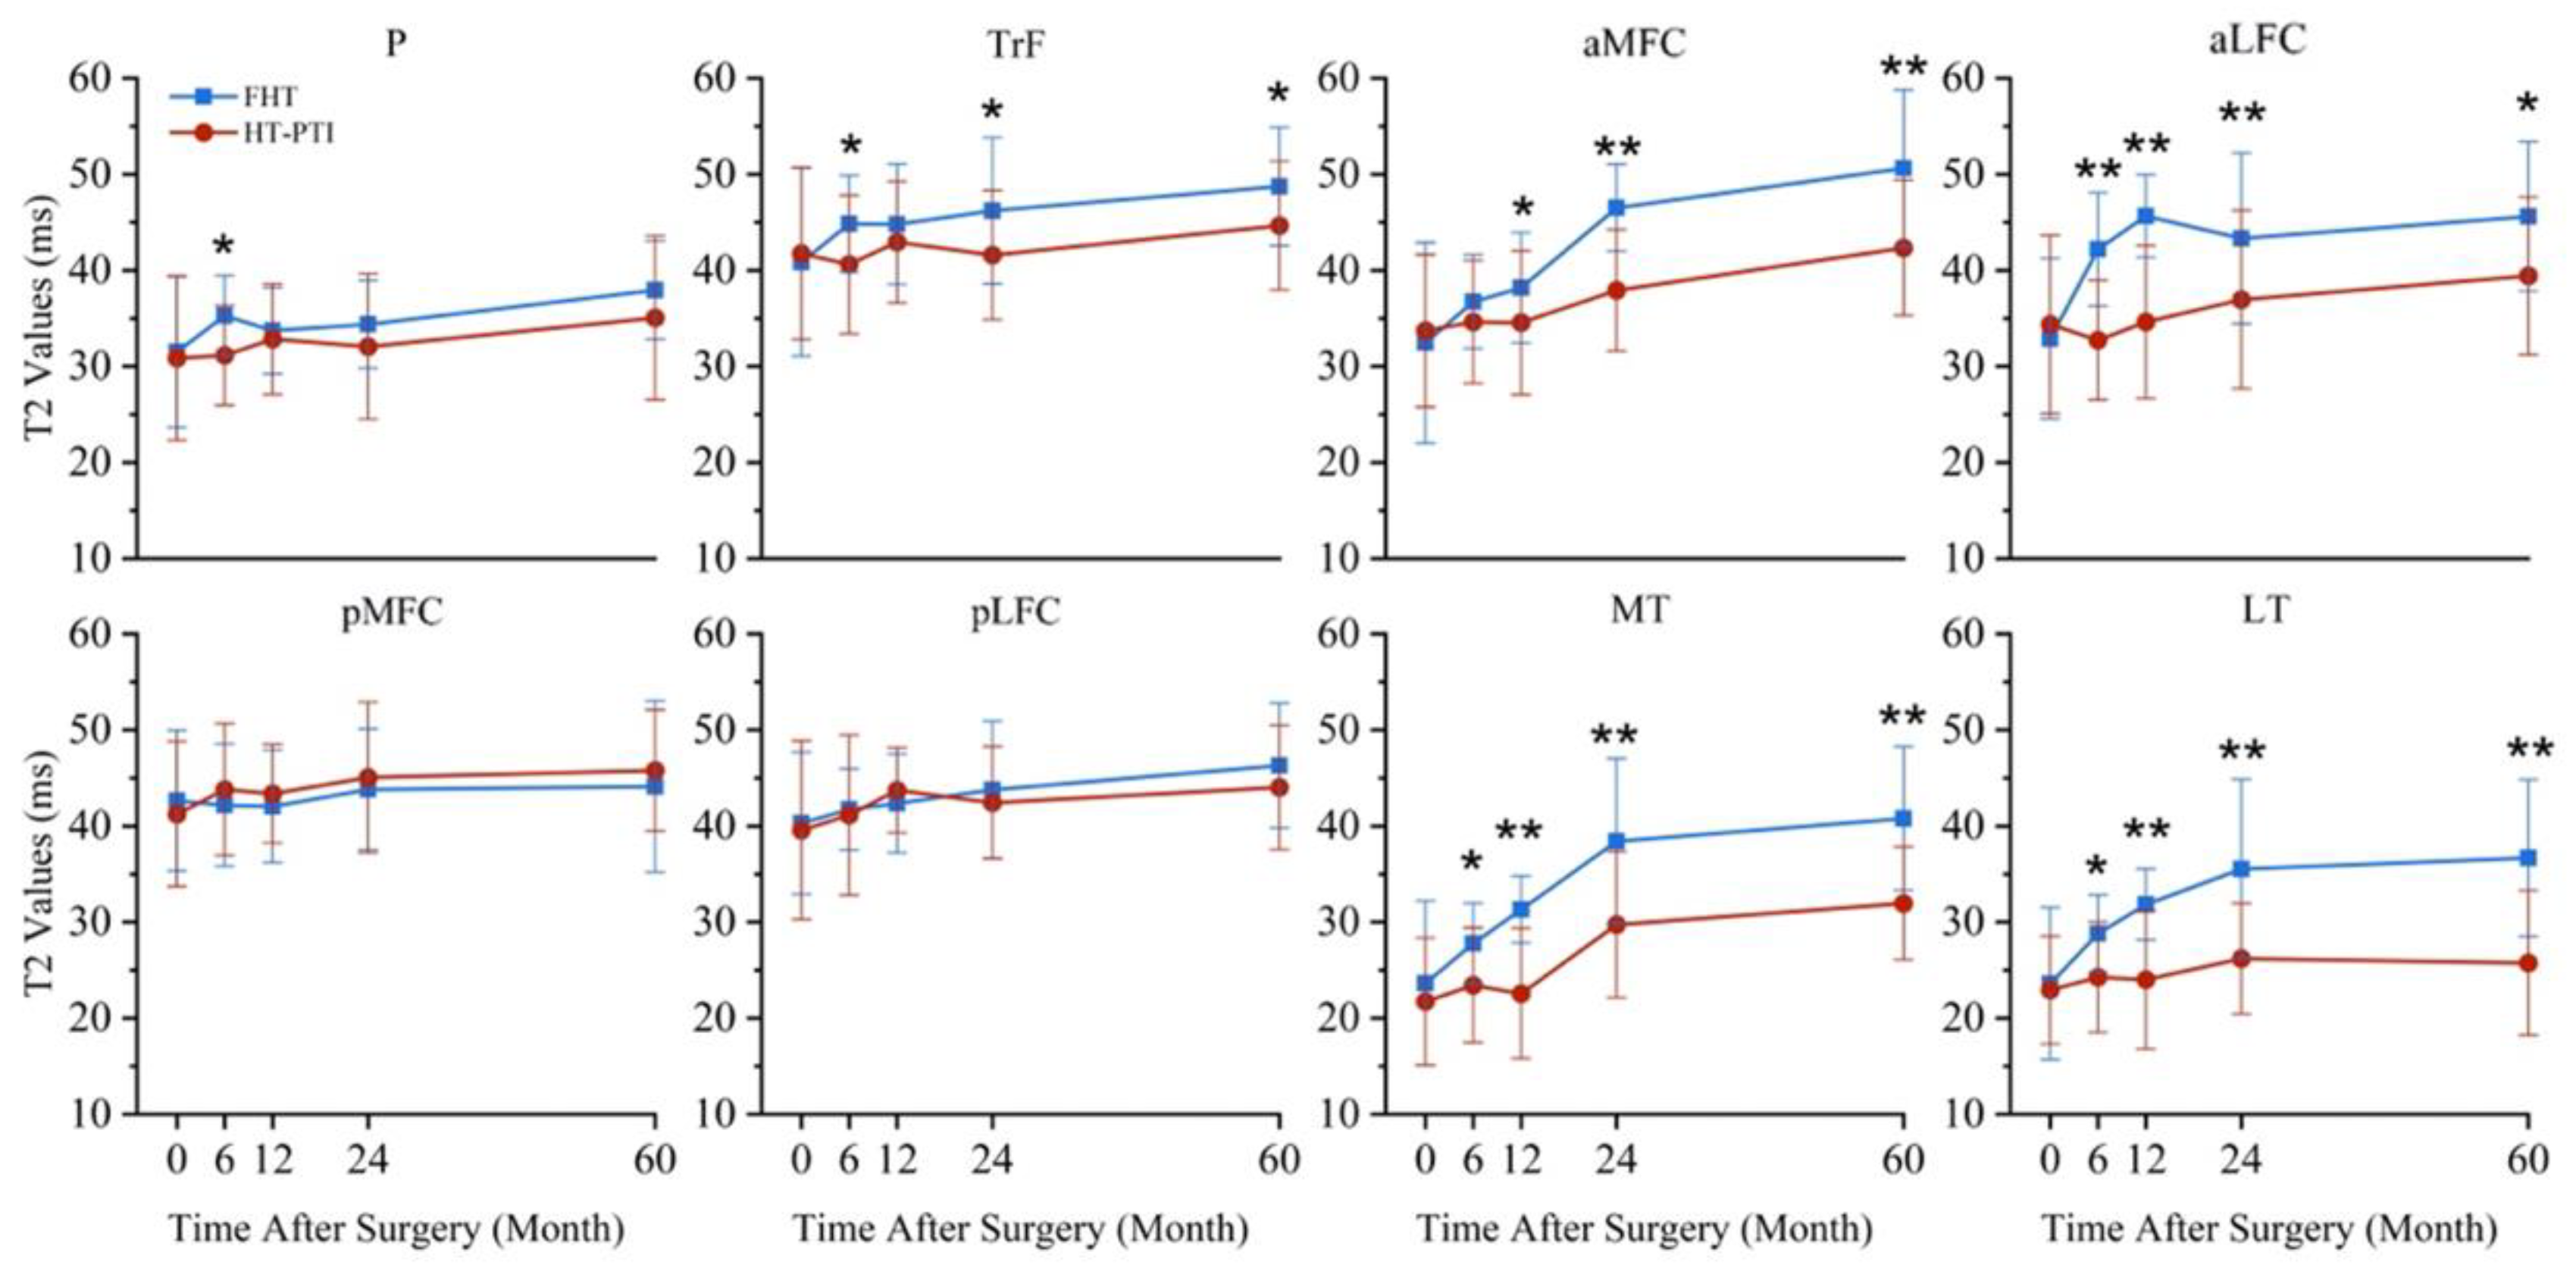
3.3. T2 Value
3.4. Cartilage Volume Change
3.5. Correlation Analysis
4. Discussion
5. Limitation
6. Conclusions
Author Contributions
Funding
Institutional Review Board Statement
Informed Consent Statement
Conflicts of Interest
Appendix A

| KOOS-Symptoms | KOOS-Pain | KOOS-ADL | KOOS-Sports/Rec | KOOS-QoL | |||||||||||
|---|---|---|---|---|---|---|---|---|---|---|---|---|---|---|---|
| Total (n = 37) | FHT (n = 19) | HT-PTI (n = 18) | Total (n = 37) | FHT (n = 19) | HT-PTI (n = 18) | Total (n = 37) | FHT (n = 19) | HT-PTI (n = 18) | Total (n = 37) | FHT (n = 19) | HT-PTI (n = 18) | Total (n = 37) | FHT (n = 19) | HT-PTI (n = 18) | |
| Pre-operation | |||||||||||||||
| P | −0.034 | −0.170 | −0.054 | −0.062 | −0.077 | −0.153 | −0.046 | −0.043 | −0.072 | −0.062 | −0.033 | −0.183 | −0.254 | −0.057 | −0.032 |
| TrF | −0.072 | −0.031 | −0.284 | −0.029 | −0.072 | −0.085 | −0.027 | −0.017 | −0.026 | −0.036 | −0.173 | −0.047 | −0.039 | −0.063 | −0.028 |
| aMFC | −0.063 | −0.163 | −0.294 | −0.035 | −0.026 | −0.082 | −0.053 | −0.063 | −0.084 | −0.168 | −0.229 | −0.062 | −0.052 | −0.149 | −0.062 |
| aLFC | −0.140 | −0.062 | −0.072 | −0.048 | −0.082 | −0.027 | −0.081 | −0.229 | −0.118 | −0.053 | −0.085 | −0.072 | −0.044 | −0.084 | −0.084 |
| pMFC | −0.194 | −0.285 | −0.063 | −0.027 | −0.019 | −0.007 | −0.083 | −0.044 | −0.247 | −0.002 | −0.062 | −0.068 | −0.082 | −0.183 | −0.225 |
| pLFC | −0.009 | −0.072 | −0.074 | −0.007 | −0.173 | −0.294 | −0.273 | −0.057 | −0.074 | −0.042 | −0.063 | −0.027 | −0.018 | −0.092 | −0.005 |
| MT | −0.057 | −0.073 | −0.173 | −0.239 | −0.052 | −0.074 | −0.052 | −0.226 | −0.062 | −0.095 | −0.167 | −0.073 | −0.075 | −0.086 | −0.003 |
| LT | −0.007 | −0.036 | −0.073 | −0.086 | −0.081 | −0.172 | −0.297 | −0.016 | −0.091 | −0.007 | −0.032 | −0.082 | −0.109 | −0.101 | −0.098 |
| 6-month | |||||||||||||||
| P | −0.263 | −0.285 | −0.274 | −0.073 | −0.052 | −0.071 | −0.011 | −0.078 | −0.035 | −0.273 | −0.227 | −0.074 | −0.045 | −0.025 | −0.193 |
| TrF | −0.082 | −0.073 | −0.133 | −0.047 | −0.082 | −0.175 | −0.227 | −0.246 | −0.062 | −0.084 | −0.082 | −0.036 | −0.075 | −0.052 | −0.074 |
| aMFC | −0.077 | −0.094 | −0.019 | −0.005 | −0.291 | −0.063 | −0.259 | −0.081 | −0.071 | −0.082 | −0.219 | −0.006 | −0.078 | −0.062 | −0.198 |
| aLFC | −0.033 | −0.199 | −0.242 | −0.026 | −0.089 | −0.037 | −0.073 | −0.005 | −0.018 | −0.266 | −0.061 | −0.088 | −0.206 | −0.019 | −0.054 |
| pMFC | −0.041 | −0.207 | −0.019 | −0.268 | −0.211 | −0.106 | −0.142 | −0.215 | −0.042 | −0.121 | −0.271 | −0.104 | −0.218 | −0.204 | −0.133 |
| pLFC | −0.150 | −0.240 | −0.130 | −0.073 | −0.191 | −0.126 | −0.130 | −0.273 | −0.062 | −0.299 | −0.051 | −0.272 | −0.236 | −0.114 | −0.293 |
| MT | −0.058 | −0.176 | −0.265 | −0.084 | −0.282 | −0.062 | −0.110 | −0.109 | −0.253 | −0.082 | −0.042 | −0.072 | −0.005 | −0.271 | −0.054 |
| LT | −0.091 | −0.230 | −0.279 | −0.148 | −0.201 | −0.238 | −0.059 | −0.022 | −0.174 | −0.174 | −0.190 | −0.191 | −0.012 | −0.284 | −0.003 |
| 12-month | |||||||||||||||
| P | −0.185 | −0.042 | −0.287 | −0.266 | −0.152 | −0.040 | −0.020 | −0.129 | −0.102 | −0.197 | −0.258 | −0.138 | −0.169 | −0.081 | −0.008 |
| TrF | −0.113 | −0.275 | −0.270 | −0.029 | −0.154 | −0.222 | −0.183 | −0.159 | −0.158 | −0.044 | −0.146 | −0.222 | −0.013 | −0.175 | −0.120 |
| aMFC | −0.067 | −0.274 | −0.230 | −0.214 | −0.120 | −0.155 | −0.158 | −0.143 | −0.238 | −0.211 | −0.034 | −0.075 | −0.182 | −0.095 | −0.184 |
| aLFC | −0.080 | −0.126 | −0.052 | −0.167 | −0.299 | −0.068 | −0.275 | −0.169 | −0.092 | −0.268 | −0.136 | −0.009 | −0.004 | −0.230 | −0.059 |
| pMFC | −0.227 | −0.036 | −0.044 | −0.187 | −0.285 | −0.130 | −0.012 | −0.178 | −0.255 | −0.121 | −0.049 | −0.172 | −0.116 | −0.051 | −0.184 |
| pLFC | −0.189 | −0.224 | −0.237 | −0.007 | −0.209 | −0.154 | −0.128 | −0.235 | −0.297 | −0.223 | −0.174 | −0.127 | −0.142 | −0.085 | −0.145 |
| MT | −0.074 | −0.171 | −0.158 | −0.084 | −0.181 | −0.279 | −0.094 | −0.045 | −0.043 | −0.167 | −0.122 | −0.146 | −0.151 | −0.187 | −0.091 |
| LT | −0.214 | −0.098 | −0.092 | −0.282 | −0.166 | −0.113 | −0.219 | −0.156 | −0.171 | −0.206 | −0.299 | −0.019 | −0.266 | −0.171 | −0.129 |
| 24-month | |||||||||||||||
| P | −0.241 | −0.039 | −0.058 | −0.184 | −0.204 | −0.004 | −0.135 | −0.169 | −0.259 | −0.047 | −0.198 | −0.226 | −0.211 | −0.226 | −0.284 |
| TrF | −0.202 | −0.094 | −0.020 | −0.033 | −0.117 | −0.175 | −0.163 | −0.128 | −0.235 | −0.124 | −0.075 | −0.138 | −0.145 | −0.129 | −0.015 |
| aMFC | −0.125 | −0.190 | −0.102 | −0.030 | −0.172 | −0.181 | −0.078 | −0.112 | −0.127 | −0.052 | −0.029 | −0.089 | −0.041 | −0.158 | −0.257 |
| aLFC | −0.072 | −0.088 | −0.070 | −0.185 | −0.217 | −0.102 | −0.065 | −0.015 | −0.232 | −0.014 | −0.104 | −0.054 | −0.256 | −0.099 | −0.054 |
| pMFC | −0.045 | −0.295 | −0.130 | −0.170 | −0.190 | −0.176 | −0.083 | −0.291 | −0.250 | −0.280 | −0.093 | −0.073 | −0.085 | −0.179 | −0.064 |
| pLFC | −0.132 | −0.216 | −0.274 | −0.021 | −0.191 | −0.203 | −0.218 | −0.170 | −0.163 | −0.087 | −0.296 | −0.255 | −0.177 | −0.007 | −0.012 |
| MT | −0.096 | −0.132 | −0.144 | −0.287 | −0.185 | −0.062 | −0.258 | −0.199 | −0.287 | −0.180 | −0.009 | −0.262 | −0.116 | −0.172 | −0.233 |
| LT | −0.254 | −0.064 | −0.280 | −0.157 | −0.023 | −0.091 | −0.004 | −0.232 | −0.182 | −0.218 | −0.007 | −0.173 | −0.133 | −0.277 | −0.135 |
| 60-month | |||||||||||||||
| P | −0.175 | −0.018 | −0.102 | −0.240 | −0.169 | −0.089 | −0.172 | −0.020 | −0.256 | −0.196 | −0.264 | −0.248 | −0.017 | −0.098 | −0.012 |
| TrF | −0.043 | −0.149 | −0.202 | −0.246 | −0.125 | −0.147 | −0.069 | −0.142 | −0.240 | −0.272 | −0.101 | −0.175 | −0.294 | −0.240 | −0.174 |
| aMFC | −0.027 | −0.185 | −0.130 | −0.118 | −0.187 | −0.261 | −0.240 | −0.034 | −0.218 | −0.222 | −0.015 | −0.015 | −0.246 | −0.117 | −0.166 |
| aLFC | −0.295 | −0.043 | −0.135 | −0.271 | −0.115 | −0.206 | −0.240 | −0.152 | −0.180 | −0.078 | −0.162 | −0.061 | −0.155 | −0.136 | −0.036 |
| pMFC | −0.015 | −0.197 | −0.213 | −0.260 | −0.224 | −0.055 | −0.083 | −0.291 | −0.126 | −0.185 | −0.216 | −0.039 | −0.264 | −0.038 | −0.293 |
| pLFC | −0.065 | −0.123 | −0.284 | −0.263 | −0.109 | −0.093 | −0.084 | −0.115 | −0.112 | −0.016 | −0.237 | −0.247 | −0.106 | −0.063 | −0.220 |
| MT | −0.175 | −0.172 | −0.081 | −0.234 | −0.062 | −0.087 | −0.053 | −0.019 | −0.244 | −0.176 | −0.054 | −0.294 | −0.238 | −0.001 | −0.272 |
| LT | −0.139 | −0.156 | −0.123 | −0.022 | −0.135 | −0.218 | −0.086 | −0.058 | −0.254 | −0.150 | −0.238 | −0.240 | −0.059 | −0.123 | −0.093 |
| KOOS-Symptoms | KOOS-Pain | KOOS-ADL | KOOS-Sports/Rec | KOOS-QoL | |||||||||||
|---|---|---|---|---|---|---|---|---|---|---|---|---|---|---|---|
| Total (n = 37) | FHT (n = 19) | HT-PTI (n = 18) | Total (n = 37) | FHT (n = 19) | HT-PTI (n = 18) | Total (n = 37) | FHT (n = 19) | HT-PTI (n = 18) | Total (n = 37) | FHT (n = 19) | HT-PTI (n = 18) | Total (n = 37) | FHT (n = 19) | HT-PTI (n = 18) | |
| 6-month | |||||||||||||||
| P | 0.288 | 0.001 | 0.128 | 0.020 | 0.212 | 0.012 | 0.101 | 0.267 | 0.069 | 0.169 | 0.269 | 0.275 | 0.213 | 0.207 | 0.185 |
| TrF | 0.178 | 0.073 | 0.135 | 0.269 | 0.187 | 0.191 | 0.262 | 0.300 | 0.181 | 0.057 | 0.176 | 0.189 | 0.022 | 0.113 | 0.167 |
| aMFC | 0.258 | 0.245 | 0.052 | 0.087 | 0.082 | 0.146 | 0.035 | 0.153 | 0.028 | 0.018 | 0.137 | 0.173 | 0.247 | 0.257 | 0.249 |
| aLFC | 0.183 | 0.238 | 0.273 | 0.222 | 0.190 | 0.239 | 0.183 | 0.225 | 0.074 | 0.067 | 0.052 | 0.275 | 0.210 | 0.076 | 0.071 |
| pMFC | 0.181 | 0.092 | 0.265 | 0.226 | 0.011 | 0.021 | 0.076 | 0.152 | 0.044 | 0.164 | 0.051 | 0.010 | 0.241 | 0.290 | 0.156 |
| pLFC | 0.139 | 0.085 | 0.227 | 0.122 | 0.010 | 0.052 | 0.296 | 0.279 | 0.160 | 0.273 | 0.251 | 0.033 | 0.148 | 0.221 | 0.043 |
| MT | 0.190 | 0.177 | 0.121 | 0.004 | 0.144 | 0.273 | 0.119 | 0.102 | 0.068 | 0.037 | 0.108 | 0.069 | 0.261 | 0.270 | 0.079 |
| LT | 0.101 | 0.169 | 0.171 | 0.083 | 0.033 | 0.200 | 0.099 | 0.119 | 0.178 | 0.120 | 0.144 | 0.259 | 0.087 | 0.128 | 0.295 |
| 12-month | |||||||||||||||
| P | 0.018 | 0.298 | 0.051 | 0.061 | 0.239 | 0.275 | 0.100 | 0.138 | 0.029 | 0.093 | 0.294 | 0.172 | 0.106 | 0.248 | 0.118 |
| TrF | 0.027 | 0.061 | 0.242 | 0.122 | 0.183 | 0.135 | 0.283 | 0.171 | 0.064 | 0.142 | 0.113 | 0.085 | 0.152 | 0.123 | 0.062 |
| aMFC | 0.230 | 0.104 | 0.189 | 0.295 | 0.116 | 0.217 | 0.173 | 0.155 | 0.149 | 0.021 | 0.016 | 0.210 | 0.228 | 0.224 | 0.133 |
| aLFC | 0.087 | 0.179 | 0.091 | 0.232 | 0.265 | 0.254 | 0.138 | 0.064 | 0.105 | 0.231 | 0.170 | 0.161 | 0.199 | 0.053 | 0.064 |
| pMFC | 0.079 | 0.169 | 0.297 | 0.153 | 0.239 | 0.114 | 0.086 | 0.143 | 0.119 | 0.061 | 0.289 | 0.059 | 0.166 | 0.264 | 0.262 |
| pLFC | 0.111 | 0.107 | 0.235 | 0.293 | 0.247 | 0.114 | 0.053 | 0.003 | 0.154 | 0.058 | 0.068 | 0.191 | 0.288 | 0.097 | 0.099 |
| MT | 0.052 | 0.057 | 0.253 | 0.226 | 0.249 | 0.294 | 0.251 | 0.269 | 0.245 | 0.120 | 0.049 | 0.050 | 0.209 | 0.081 | 0.291 |
| LT | 0.289 | 0.067 | 0.020 | 0.184 | 0.285 | 0.032 | 0.117 | 0.092 | 0.037 | 0.178 | 0.093 | 0.131 | 0.278 | 0.110 | 0.005 |
| 24-month | |||||||||||||||
| P | 0.045 | 0.233 | 0.208 | 0.095 | 0.002 | 0.091 | 0.145 | 0.070 | 0.150 | 0.279 | 0.025 | 0.233 | 0.032 | 0.130 | 0.100 |
| TrF | 0.025 | 0.208 | 0.089 | 0.083 | 0.289 | 0.188 | 0.178 | 0.258 | 0.012 | 0.289 | 0.249 | 0.093 | 0.102 | 0.295 | 0.033 |
| aMFC | 0.074 | 0.221 | 0.010 | 0.036 | 0.246 | 0.115 | 0.118 | 0.097 | 0.089 | 0.291 | 0.194 | 0.258 | 0.045 | 0.114 | 0.024 |
| aLFC | 0.038 | 0.107 | 0.107 | 0.239 | 0.184 | 0.155 | 0.227 | 0.275 | 0.118 | 0.162 | 0.253 | 0.239 | 0.252 | 0.021 | 0.204 |
| pMFC | 0.062 | 0.015 | 0.009 | 0.151 | 0.122 | 0.295 | 0.210 | 0.275 | 0.213 | 0.044 | 0.094 | 0.100 | 0.058 | 0.018 | 0.032 |
| pLFC | 0.199 | 0.253 | 0.159 | 0.048 | 0.148 | 0.190 | 0.254 | 0.012 | 0.164 | 0.050 | 0.292 | 0.276 | 0.162 | 0.030 | 0.021 |
| MT | 0.087 | 0.165 | 0.072 | 0.117 | 0.242 | 0.129 | 0.049 | 0.067 | 0.125 | 0.062 | 0.140 | 0.003 | 0.167 | 0.239 | 0.269 |
| LT | 0.224 | 0.187 | 0.240 | 0.171 | 0.088 | 0.014 | 0.138 | 0.146 | 0.017 | 0.281 | 0.212 | 0.287 | 0.224 | 0.109 | 0.257 |
| 60-month | |||||||||||||||
| P | 0.076 | 0.182 | 0.044 | 0.269 | 0.203 | 0.116 | 0.225 | 0.221 | 0.094 | 0.291 | 0.239 | 0.102 | 0.030 | 0.095 | 0.059 |
| TrF | 0.057 | 0.181 | 0.056 | 0.269 | 0.160 | 0.145 | 0.067 | 0.031 | 0.077 | 0.185 | 0.261 | 0.280 | 0.172 | 0.255 | 0.269 |
| aMFC | 0.028 | 0.176 | 0.042 | 0.051 | 0.162 | 0.209 | 0.100 | 0.130 | 0.051 | 0.187 | 0.259 | 0.005 | 0.210 | 0.095 | 0.107 |
| aLFC | 0.024 | 0.210 | 0.239 | 0.107 | 0.130 | 0.097 | 0.101 | 0.264 | 0.245 | 0.243 | 0.143 | 0.199 | 0.074 | 0.277 | 0.037 |
| pMFC | 0.102 | 0.272 | 0.123 | 0.165 | 0.092 | 0.093 | 0.083 | 0.177 | 0.084 | 0.188 | 0.281 | 0.015 | 0.275 | 0.098 | 0.182 |
| pLFC | 0.014 | 0.234 | 0.274 | 0.253 | 0.294 | 0.247 | 0.113 | 0.068 | 0.212 | 0.220 | 0.096 | 0.261 | 0.171 | 0.099 | 0.296 |
| MT | 0.282 | 0.107 | 0.089 | 0.163 | 0.054 | 0.204 | 0.239 | 0.215 | 0.123 | 0.110 | 0.070 | 0.057 | 0.174 | 0.258 | 0.091 |
| LT | 0.000 | 0.115 | 0.257 | 0.049 | 0.091 | 0.024 | 0.258 | 0.170 | 0.239 | 0.084 | 0.096 | 0.016 | 0.208 | 0.046 | 0.266 |
| 6-Month | 12-Month | 24-Month | 60-Month | |||||||||
|---|---|---|---|---|---|---|---|---|---|---|---|---|
| Total (n = 37) | FHT (n = 19) | HT-PTI (n = 18) | Total (n = 37) | FHT (n = 19) | HT-PTI (n = 18) | Total (n = 37) | FHT (n = 19) | HT-PTI (n = 18) | Total (n = 37) | FHT (n = 19) | HT-PTI (n = 18) | |
| P | −0.048 | −0.371 | −0.223 | −0.106 | −0.140 | −0.159 | −0.266 | −0.362 | −0.143 | −0.421 | −0.392 | −0.012 |
| TrF | −0.458 | −0.267 | −0.305 | −0.501 | −0.420 | −0.048 | −0.142 | −0.332 | −0.325 | −0.179 | −0.366 | −0.561 |
| aMFC | −0.230 | −0.207 | −0.240 | −0.541 | −0.099 | −0.207 | −0.190 | −0.436 | −0.560 | −0.569 | −0.532 | −0.523 |
| aLFC | −0.545 | −0.111 | −0.496 | −0.288 | −0.024 | −0.063 | −0.075 | −0.141 | −0.322 | −0.578 | −0.102 | −0.339 |
| pMFC | −0.304 | −0.151 | −0.046 | −0.156 | −0.555 | −0.586 | −0.319 | −0.049 | −0.453 | −0.029 | −0.355 | −0.169 |
| pLFC | −0.495 | −0.590 | −0.177 | −0.105 | −0.352 | −0.085 | −0.564 | −0.380 | −0.043 | −0.227 | −0.588 | −0.448 |
| MT | −0.489 | −0.357 | −0.302 | −0.366 | −0.544 | −0.364 | −0.287 | −0.497 | −0.065 | −0.094 | −0.544 | −0.334 |
| LT | −0.281 | −0.358 | −0.429 | −0.493 | −0.493 | −0.331 | −0.532 | −0.456 | −0.431 | −0.277 | −0.537 | −0.567 |
References
- Ajuied, A.; Wong, F.; Smith, C.; Norris, M.; Earnshaw, P.; Back, D.; Davies, A. Anterior cruciate ligament injury and radiologic progression of knee osteoarthritis: A systematic review and meta-analysis. Am. J. Sports Med. 2014, 42, 2242–2252. [Google Scholar] [CrossRef] [PubMed]
- Belk, J.W.; Kraeutler, M.J.; Carver, T.J.; McCarty, E.C. Knee Osteoarthritis After Anterior Cruciate Ligament Reconstruction With Bone–Patellar Tendon–Bone Versus Hamstring Tendon Autograft: A Systematic Review of Randomized Controlled Trials. Arthrosc. J. Arthrosc. Relat. Surg. 2018, 34, 1358–1365. [Google Scholar] [CrossRef] [PubMed]
- Belk, J.W.; Kraeutler, M.J.; Houck, D.A.; McCarty, E.C. Knee Osteoarthritis After Single–Bundle Versus Double–Bundle Anterior Cruciate Ligament Reconstruction: A Systematic Review of Randomized Controlled Trials. Arthroscopy 2019, 35, 996–1003. [Google Scholar] [CrossRef]
- Bellamy, N.; Buchanan, W.W.; Goldsmith, C.H.; Campbell, J.; Stitt, L.W. Validation study of WOMAC: A health status instrument for measuring clinically important patient relevant outcomes to antirheumatic drug therapy in patients with osteoarthritis of the hip or knee. J. Rheumatol. 1988, 15, 1833–1840. [Google Scholar] [PubMed]
- Collins, N.J.; Prinsen, C.A.; Christensen, R.; Bartels, E.M.; Terwee, C.B.; Roos, E.M. Knee Injury and Osteoarthritis Outcome Score (KOOS): Systematic review and meta-analysis of measurement properties. Osteoarthr. Cartil. 2016, 24, 1317–1329. [Google Scholar] [CrossRef] [PubMed] [Green Version]
- Corona, K.; Cerciello, S.; Vasso, M.; Toro, G.; D'Ambrosi, R.; Pola, E.; Ciolli, G.; Mercurio, M.; Panni, A.S. Age over 50 does not predict results in anterior cruciate ligament reconstruction. Orthop. Rev. 2022, 14, 37310. [Google Scholar] [CrossRef]
- Cristiani, R.; Viheriävaara, S.; Janarv, P.-M.; Edman, G.; Janarv, P.-M.; Forssblad, M.; Stålman, A. Knee laxity and functional knee outcome after contralateral ACLR are comparable to those after primary ACLR. Knee Surg. Sports Traumatol. Arthrosc. 2021, 29, 3864–3870. [Google Scholar] [CrossRef]
- Del Torto, M.; Enea, D.; Panfoli, N.; Filardo, G.; Pace, N.; Chiusaroli, M. Hamstrings anterior cruciate ligament reconstruction with and without platelet rich fibrin matrix. Knee Surg. Sports Traumatol. Arthrosc. 2015, 23, 3614–3622. [Google Scholar] [CrossRef]
- Eckstein, F.; Wirth, W.; Lohmander, L.S.; Hudelmaier, M.I.; Frobell, R.B. Five-Year Followup of Knee Joint Cartilage Thickness Changes After Acute Rupture of the Anterior Cruciate Ligament. Arthritis Rheumatol. 2015, 67, 152–161. [Google Scholar] [CrossRef]
- Figueroa, D.; Figueroa, F.; Calvo, R.; Vaisman, A.; Ahumada, X.; Arellano, S. Platelet-rich plasma use in anterior cruciate ligament surgery: Systematic review of the literature. Arthroscopy 2015, 31, 981–988. [Google Scholar] [CrossRef]
- Frobell, R.B. Change in cartilage thickness, posttraumatic bone marrow lesions, and joint fluid volumes after acute ACL disruption: A two-year prospective MRI study of sixty-one subjects. J. Bone Joint Surg. Am. 2011, 93, 1096–1103. [Google Scholar] [CrossRef] [PubMed]
- Frobell, R.; Le Graverand, M.-P.; Buck, R.; Roos, E.; Roos, H.; Tamez-Pena, J.; Totterman, S.; Lohmander, L. The acutely ACL injured knee assessed by MRI: Changes in joint fluid, bone marrow lesions, and cartilage during the first year. Osteoarthr. Cartil. 2009, 17, 161–167. [Google Scholar] [CrossRef] [PubMed] [Green Version]
- Gong, X.; Jiang, D.; Wang, Y.-J.; Wang, J.; Ao, Y.-F.; Yu, J.-K. Second-Look Arthroscopic Evaluation of Chondral Lesions After Isolated Anterior Cruciate Ligament Reconstruction: Single-Versus Double-Bundle Reconstruction. Am. J. Sports Med. 2013, 41, 2362–2367. [Google Scholar] [CrossRef]
- Kumar, D.; Su, F.; Wu, D.; Pedoia, V.; Heitkamp, L.; Ma, C.B.; Souza, R.B.; Li, X. Frontal Plane Knee Mechanics and Early Cartilage Degeneration in People With Anterior Cruciate Ligament Reconstruction: A Longitudinal Study. Am. J. Sports Med. 2018, 46, 378–387. [Google Scholar] [CrossRef] [PubMed]
- Li, X.; Kuo, D.; Theologis, A.; Carballido-Gamio, J.; Stehling, C.; Link, T.M.; Ma, C.B.; Majumdar, S. Cartilage in Anterior Cruciate Ligament–Reconstructed Knees: MR imaging T1{rho} and T2—Initial Experience with 1-year Follow-up. Radiology 2011, 258, 505–514. [Google Scholar] [CrossRef] [PubMed] [Green Version]
- Liu, S.; Li, H.; Tao, H.; Sun, Y.; Chen, S.; Chen, J. A Randomized Clinical Trial to Evaluate Attached Hamstring Anterior Cruciate Ligament Graft Maturity With Magnetic Resonance Imaging. Am. J. Sports Med. 2018, 46, 1143–1149. [Google Scholar] [CrossRef]
- Liu, S.; Sun, Y.; Wan, F.; Ding, Z.; Chen, S.; Chen, J. Advantages of an Attached Semitendinosus Tendon Graft in Anterior Cruciate Ligament Reconstruction in a Rabbit Model. Am. J. Sports Med. 2018, 46, 3227–3236. [Google Scholar] [CrossRef] [PubMed]
- Maerz, T.; Sherman, E.; Newton, M.; Yilmaz, A.; Kumar, P.; Graham, S.F.; Baker, K.C. Metabolomic serum profiling after ACL injury in rats: A pilot study implicating inflammation and immune dysregulation in post-traumatic osteoarthritis. J. Orthop. Res. 2018, 36, 1969–1979. [Google Scholar] [CrossRef] [PubMed] [Green Version]
- McAlindon, T.E.; LaValley, M.P.; Harvey, W.F.; Price, L.L.; Driban, J.; Zhang, M.; Ward, R.J. Effect of Intra-articular Triamcinolone vs Saline on Knee Cartilage Volume and Pain in Patients With Knee Osteoarthritis: A Randomized Clinical Trial. JAMA 2017, 317, 1967–1975. [Google Scholar] [CrossRef]
- McAlindon, T.E.; Nuite, M.; Krishnan, N.; Ruthazer, R.; Price, L.; Burstein, D.; Griffith, J.; Flechsenhar, K. Change in knee osteoarthritis cartilage detected by delayed gadolinium enhanced magnetic resonance imaging following treatment with collagen hydrolysate: A pilot randomized controlled trial. Osteoarthr. Cartil. 2011, 19, 399–405. [Google Scholar] [CrossRef]
- Mendias, C.L.; Enselman, E.R.S.; Olszewski, A.M.; Gumucio, J.P.; Edon, D.L.; Konnaris, M.A.; Carpenter, J.E.; Awan, T.M.; Jacobson, J.A.; Gagnier, J.J.; et al. The Use of Recombinant Human Growth Hormone to Protect Against Muscle Weakness in Patients Undergoing Anterior Cruciate Ligament Reconstruction: A Pilot, Randomized Placebo—Controlled Trial. Am. J. Sports Med. 2020, 48, 1916–1928. [Google Scholar] [CrossRef] [PubMed]
- Nishioka, H.; Hirose, J.; Nakamura, E.; Okamoto, N.; Karasugi, T.; Taniwaki, T.; Okada, T.; Yamashita, Y.; Mizuta, H. Detecting ICRS grade 1 cartilage lesions in anterior cruciate ligament injury using T1ρ and T2 mapping. Eur. J. Radiol. 2013, 82, 1499–1505. [Google Scholar] [CrossRef]
- Nugzar, O.; Zandman-Goddard, G.; Oz, H.; Lakstein, D.; Feldbrin, Z.; Shargorodsky, M. The role of ferritin and adiponectin as predictors of cartilage damage assessed by arthroscopy in patients with symptomatic knee osteoarthritis. Best Pract. Res. Clin. Rheumatol. 2018, 32, 662–668. [Google Scholar] [CrossRef] [PubMed]
- Papalia, R.; Franceschi, F.; Vasta, S.; Di Martino, A.; Maffulli, N.; Denaro, V. Sparing the anterior cruciate ligament remnant: Is it worth the hassle? Br. Med. Bull. 2012, 104, 91–111. [Google Scholar] [CrossRef]
- Potter, H.G.; Jain, S.K.; Ma, Y.; Black, B.R.; Fung, S.; Lyman, S. Cartilage Injury After Acute, Isolated Anterior Cruciate Ligament Tear: Immediate and Longitudinal Effect with Clinical/MRI Follow-up. Am. J. Sports Med. 2012, 40, 276–285. [Google Scholar] [CrossRef]
- Roos, E.M.; Roos, H.P.; Lohmander, L.S.; Ekdahl, C.; Beynnon, B.D. Knee Injury and Osteoarthritis Outcome Score (KOOS)—Development of a self-administered outcome measure. J. Orthop. Sports Phys. Ther. 1998, 28, 88–96. [Google Scholar] [CrossRef]
- Song, E.-K.; Seon, J.-K.; Yim, J.-H.; Woo, S.-H.; Seo, H.-Y.; Lee, K.-B. Progression of Osteoarthritis After Double- and Single-Bundle Anterior Cruciate Ligament Reconstruction. Am. J. Sports Med. 2013, 41, 2340–2346. [Google Scholar] [CrossRef]
- Song, G.-Y.; Zhang, H.; Zhang, J.; Li, X.; Chen, X.-Z.; Li, Y.; Feng, H. The Anterior Cruciate Ligament Remnant: To Leave It or Not? Arthrosc. J. Arthrosc. Relat. Surg. 2013, 29, 1253–1262. [Google Scholar] [CrossRef] [PubMed]
- Su, F.; Hilton, J.F.; Nardo, L.; Wu, S.; Liang, F.; Link, T.; Ma, C.; Li, X. Cartilage morphology and T1ρ and T2 quantification in ACL-reconstructed knees: A 2-year follow-up. Osteoarthr. Cartil. 2013, 21, 1058–1067. [Google Scholar] [CrossRef] [Green Version]
- Subburaj, K.; Kumar, D.; Souza, R.B.; Alizai, H.; Li, X.; Link, T.M.; Majumdar, S. The Acute Effect of Running on Knee Articular Cartilage and Meniscus Magnetic Resonance Relaxation Times in Young Healthy Adults. Am. J. Sports Med. 2012, 40, 2134–2141. [Google Scholar] [CrossRef]
- Theologis, A.A.; Haughom, B.; Liang, F.; Zhang, Y.; Majumdar, S.; Link, T.M.; Ma, C.B.; Li, X. Comparison of T1rho relaxation times between ACL-reconstructed knees and contralateral uninjured knees. Knee Surg. Sports Traumatol. Arthrosc. 2014, 22, 298–307. [Google Scholar] [CrossRef] [Green Version]
- Van Ginckel, A.; Verdonk, P.; Victor, J.; Witvrouw, E. Cartilage Status in Relation to Return to Sports After Anterior Cruciate Ligament Reconstruction. Am. J. Sports Med. 2013, 41, 550–559. [Google Scholar] [CrossRef] [PubMed]
- Wang, H.-J.; Ao, Y.-F.; Jiang, D.; Gong, X.; Wang, Y.-J.; Wang, J.; Yu, J.-K. Relationship Between Quadriceps Strength and Patellofemoral Joint Chondral Lesions After Anterior Cruciate Ligament Reconstruction. Am. J. Sports Med. 2015, 43, 2286–2292. [Google Scholar] [CrossRef]
- Wang, X.; Bennell, K.L.; Wang, Y.; Wrigley, T.V.; Van Ginckel, A.; Fortin, K.; Saxby, D.J.; Cicuttini, F.; Lloyd, D.; Vertullo, C.J.; et al. Tibiofemoral joint structural change from 2.5 to 4.5 years following ACL reconstruction with and without combined meniscal pathology. BMC Musculoskelet. Disord. 2019, 20, 312. [Google Scholar] [CrossRef] [PubMed]
- Wang, X.; Wrigley, T.V.; Bennell, K.L.; Wang, Y.; Fortin, K.; Cicuttini, F.M.; Lloyd, D.G.; Bryant, A.L. Cartilage quantitative T2 relaxation time 2–4 years following isolated anterior cruciate ligament reconstruction. J. Orthop. Res. 2018, 36, 2022–2029. [Google Scholar] [CrossRef] [PubMed] [Green Version]
- Woollard, J.D.; Gil, A.B.; Sparto, P.; Kwoh, C.K.; Piva, S.R.; Farrokhi, S.; Powers, C.M.; Fitzgerald, G.K. Change in Knee Cartilage Volume in Individuals Completing a Therapeutic Exercise Program for Knee Osteoarthritis. J. Orthop. Sports Phys. Ther. 2011, 41, 708–722. [Google Scholar] [CrossRef] [Green Version]
- Zhang, Y.; Liu, S.; Chen, Q.; Hu, Y.; Sun, Y.; Chen, J. Maturity Progression of the Entire Anterior Cruciate Ligament Graft of Insertion—Preserved Hamstring Tendons by 5 Years: A Prospective Randomized Controlled Study Based on Magnetic Resonance Imaging Evaluation. Am. J. Sports Med. 2020, 48, 2970–2977. [Google Scholar] [CrossRef]


| Symptoms | Pain | ADL | Sports/Rec | QoL | |
|---|---|---|---|---|---|
| Control Group | |||||
| Pre-operative | 67.1 ± 22.3 | 75.2 ± 23.8 | 80.8 ± 21.7 | 51.3 ± 18.9 | 47.3 ± 24.9 |
| 6-month | 82.5 ± 15.3 * | 84.9 ± 13.8 * | 89.9 ± 11.3 * | 63.3 ± 21.2 * | 81.6 ± 17.3 * |
| 12-month | 90.2 ± 11.7 *# | 91.0 ± 9.9 *# | 95.6 ± 5.5 *# | 80.4 ± 8.7 *# | 92.4 ± 7.2 *# |
| 24-month | 92.1 ± 13.9 *# | 93.7 ± 7.4 *# | 97.1 ± 4.2 *# | 86.9 ± 10.6 *# | 93.8 ± 6.1 *# |
| 60-month | 92.3 ± 10.6 *# | 93.3 ± 6.3 *# | 96.7 ± 4.4 *# | 86.3 ± 11.1 *# | 92.1 ± 5.8 *# |
| Study group | |||||
| Pre-operative | 68.9 ± 23.7 | 73.7 ± 21.1 | 79.8 ± 22.5 | 53.7 ± 19.6 | 50.1 ± 22.8 |
| 6-month | 83.1 ± 15.9 * | 86.3 ± 12.6 * | 88.5 ± 10.9 * | 65.1 ± 19.7 * | 80.8 ± 15.9 * |
| 12-month | 89.9 ± 10.8 *# | 92.2 ± 13.3 *# | 96.8 ± 5.3 *# | 81.2 ± 10.4 *# | 91.7 ± 9.9 *# |
| 24-month | 91.9 ± 12.5 *# | 94.5 ± 7.1 *# | 98.1 ± 4.7 *# | 87.5 ± 12.0 *# | 93.2 ± 7.7 *# |
| 60-month | 92.7 ± 11.2 *# | 93.6 ± 7.7 *# | 97.3 ± 4.5 *# | 85.6 ± 11.5 *# | 92.5 ± 6.2 *# |
| P | TrF | aMFC | aLFC | pMFC | pLFC | MT | LT | |
|---|---|---|---|---|---|---|---|---|
| FHT group | ||||||||
| Pre-operative | 31.52 ± 7.84 | 40.85 ± 9.77 | 32.46 ± 10.46 | 32.89 ± 8.35 | 42.63 ± 7.32 | 40.28 ± 7.39 | 23.63 ± 8.57 | 23.58 ± 7.92 |
| 6 m | 35.28 ± 4.16 | 44.83 ± 5.04 | 36.73 ± 4.88 | 42.19 ± 5.89 a | 42.18 ± 6.37 | 41.73 ± 4.22 | 27.78 ± 4.20 | 28.82 ± 4.01 a |
| 12 m | 33.72 ± 4.49 | 44.79 ± 6.27 | 38.18 ± 5.75 a | 45.64 ± 4.28 a | 42.04 ± 5.86 | 42.35 ± 5.14 | 31.32 ± 3.48 a | 31.83 ± 3.69 a |
| 24 m | 34.38 ± 4.56 | 46.21 ± 7.61 a | 46.51 ± 4.52 abc | 43.33 ± 8.87 a | 43.81 ± 6.27 | 43.77 ± 7.14 | 38.42 ± 8.59 abc | 35.53 ± 9.31 ab |
| 60 m | 37.93 ± 5.12 a | 48.73 ± 6.16 a | 50.62 ± 8.18 abcd | 45.61 ± 7.79 a | 44.11 ± 8.92 | 46.29 ± 6.51 ab | 40.78 ± 7.47 abc | 36.67 ± 8.15 ab |
| HT-PTI group | ||||||||
| Pre-operative | 30.86 ± 8.56 | 41.75 ± 8.97 | 33.72 ± 7.93 | 34.38 ± 9.28 | 41.24 ± 7.53 | 39.56 ± 9.31 | 21.74 ± 6.62 | 22.94 ± 5.61 |
| 6 m | 31.16 ± 5.18 | 40.63 ± 7.21 | 34.63 ± 6.39 | 32.74 ± 6.23 | 43.81 ± 6.89 | 41.13 ± 8.35 | 23.42 ± 5.96 | 24.27 ± 5.75 |
| 12 m | 32.84 ± 5.73 | 42.94 ± 6.33 | 34.56 ± 7.49 | 34,62 ± 7.97 | 43.38 ± 5.12 | 43.74 ± 4.42 | 22.56 ± 6.77 | 24.01 ± 7.20 |
| 24 m | 32.06 ± 7.58 | 41.60 ± 6.73 | 37.92 ± 6.32 | 36.96 ± 9.27 | 45.06 ± 7.85 | 42.42 ± 5.84 | 29.74 ± 7.62 abc | 26.19 ± 5.75 |
| 60 m | 35.05 ± 8.53 | 44.65 ± 6.69 | 42.34 ± 7.05 abcd | 39.43 ± 8.21 b | 45.79 ± 6.29 | 44.02 ± 6.47 | 31.94 ± 5.87 abc | 27.75 ± 7.53 a |
| P | TrF | aMFC | aLFC | pMFC | pLFC | MT | lt | |
|---|---|---|---|---|---|---|---|---|
| FHT group | ||||||||
| 6 m | 6.1 ± 13.4 | 6.8 ± 12.7 | 4.3 ± 9.2 | 5.4 ± 9.4 | 2.9 ± 8.3 | 2.8 ± 8.1 | 4.5 ± 10.6 | 4.2 ± 11.3 |
| 12 m | −0.9 ± 3.0 * | 0.2 ± 4.8 * | −1.7 ± 5.3 * | −2.1 ± 5.4 * | −0.8 ± 4.9 * | −1.1 ± 5.2 * | −3.8 ± 6.6 * | −4.5 ± 5.9 * |
| 24 m | −3.8 ± 6.3 *# | −2.6 ± 7.2 *# | −4.9 ± 7.1 *# | −5.6 ± 9.3 *# | −3.4 ± 7.1 *# | −4.0 ± 7.3 *# | −6.7 ± 10.5 *# | −6.3 ± 11.2 *# |
| 60 m | −9.8 ± 16.8 *#+ | −9.5 ± 12.6 *#+ | −12.3 ± 16.9 *#+ | −12.8 ± 15.7 *#+ | −7.7 ± 13.2 *#+ | −8.1 ± 13.5 *#+ | −13.3 ± 18.6 *#+ | −14.9 ± 19.3 *#+ |
| HT-PTI group | ||||||||
| 6 m | 0.3 ± 4.8 | 0.7 ± 2.4 | −0.7 ± 3.1 | −0.5 ± 3.8 | −0.3 ± 4.2 | −0.6 ± 3.9 | −0.8 ± 4.9 | −0.9 ± 4.7 |
| 12 m | −0.7 ± 5.9 | −0.3 ± 4.1 | −1.8 ± 6.1 | −1.6 ± 7.8 | −0.9 ± 6.3 | −1.0 ± 6.1 | −3.1 ± 7.4 | −3.3 ± 6.9 |
| 24 m | −2.1 ± 2.5 | −1.9 ± 6.5 | −3.1 ± 7.1 | −3.8 ± 8.2 * | −3.5 ± 8.2 * | −4.4 ± 8.5 * | −5.8 ± 9.9 * | −5.3 ± 12.7 * |
| 60 m | −5.2 ± 13.3 *#+ | −4.1 ± 6.9 *# | −6.8 ± 7.2 *#+ | −7.1 ± 9.3 *#+ | −5.4 ± 12.9 *# | −5.7 ± 13.4 *# | −7.2 ± 10.3 *# | −6.9 ± 9.7 *# |
Publisher’s Note: MDPI stays neutral with regard to jurisdictional claims in published maps and institutional affiliations. |
© 2022 by the authors. Licensee MDPI, Basel, Switzerland. This article is an open access article distributed under the terms and conditions of the Creative Commons Attribution (CC BY) license (https://creativecommons.org/licenses/by/4.0/).
Share and Cite
Zhang, Y.; Liu, S.; Sun, Y.; Xie, Y.; Chen, J. Knee Cartilage Change within 5 Years after Aclr Using Hamstring Tendons with Preserved Tibial-Insertion: A Prospective Randomized Controlled Study Based on Magnetic Resonance Imaging. J. Clin. Med. 2022, 11, 6157. https://doi.org/10.3390/jcm11206157
Zhang Y, Liu S, Sun Y, Xie Y, Chen J. Knee Cartilage Change within 5 Years after Aclr Using Hamstring Tendons with Preserved Tibial-Insertion: A Prospective Randomized Controlled Study Based on Magnetic Resonance Imaging. Journal of Clinical Medicine. 2022; 11(20):6157. https://doi.org/10.3390/jcm11206157
Chicago/Turabian StyleZhang, Yuhan, Shaohua Liu, Yaying Sun, Yuxue Xie, and Jiwu Chen. 2022. "Knee Cartilage Change within 5 Years after Aclr Using Hamstring Tendons with Preserved Tibial-Insertion: A Prospective Randomized Controlled Study Based on Magnetic Resonance Imaging" Journal of Clinical Medicine 11, no. 20: 6157. https://doi.org/10.3390/jcm11206157