
Relationship between Leptin and Insulin Resistance among Community—Dwelling Middle-Aged and Elderly Populations in Taiwan

Abstract
:1. Introduction
2. Materials and Methods
2.1. Study Population
2.2. Data Collection and Measurements
2.3. Assessment of Insulin Resistance
2.4. Definition of HTN, DM, and Dyslipidemia
2.5. Statistical Analysis
3. Results
4. Discussion
5. Conclusions
Author Contributions
Funding
Institutional Review Board Statement
Informed Consent Statement
Data Availability Statement
Conflicts of Interest
References
- Blüher, M. Adipose tissue inflammation: A cause or consequence of obesity-related insulin resistance? Clin. Sci. 2016, 130, 1603–1614. [Google Scholar] [CrossRef] [PubMed]
- Freeman, A.M.; Pennings, N. Insulin Resistance. In StatPearls [Internet]; StatPearls Publishing: Treasure Island, FL, USA, 2021. [Google Scholar]
- Ferrannini, E.; Natali, A.; Capaldo, B.; Lehtovirta, M.; Jacob, S.; Yki-Järvinen, H. Insulin resistance, hyperinsulinemia, and blood pressure: Role of age and obesity. European Group for the Study of Insulin Resistance (EGIR). Hypertension 1997, 30, 1144–1149. [Google Scholar] [CrossRef]
- Tseng, L.N.; Tseng, Y.H.; Jiang, Y.D.; Chang, C.H.; Chung, C.H.; Lin, B.J.; Chuang, L.M.; Tai, T.Y.; Sheu, W.H. Prevalence of hypertension and dyslipidemia and their associations with micro- and macrovascular diseases in patients with diabetes in Taiwan: An analysis of nationwide data for 2000–2009. J. Med. Assoc. 2012, 111, 625–636. [Google Scholar] [CrossRef] [PubMed]
- Li, H.Y.; Jiang, Y.D.; Chang, C.H.; Chung, C.H.; Lin, B.J.; Chuang, L.M. Mortality trends in patients with diabetes in Taiwan: A nationwide survey in 2000–2009. J. Med. Assoc. 2012, 111, 645–650. [Google Scholar] [CrossRef] [PubMed]
- Sheen, Y.J.; Li, T.C.; Lin, J.L.; Tsai, W.C.; Kao, C.D.; Bau, C.T.; Sheu, W.H. Association between thermal threshold abnormalities and peripheral artery disease in patients with type 2 diabetes. Medicine 2018, 97, e13803. [Google Scholar] [CrossRef] [PubMed]
- Sheen, Y.J.; Sheu, W.H. Association between hypoglycemia and dementia in patients with type 2 diabetes. Diabetes Res. Clin. Pract. 2016, 116, 279–287. [Google Scholar] [CrossRef] [PubMed]
- Hsu, C.L.; Sheu, W.H. Diabetes and shoulder disorders. J. Diabetes Investig. 2016, 7, 649–651. [Google Scholar] [CrossRef] [PubMed]
- Orgel, E.; Mittelman, S.D. The links between insulin resistance, diabetes, and cancer. Curr. Diabetes Rep. 2013, 13, 213–222. [Google Scholar] [CrossRef] [PubMed]
- Chung, C.P.; Oeser, A.; Solus, J.F.; Gebretsadik, T.; Shintani, A.; Avalos, I.; Sokka, T.; Raggi, P.; Pincus, T.; Stein, C.M. Inflammation-associated insulin resistance: Differential effects in rheumatoid arthritis and systemic lupus erythematosus define potential mechanisms. Arthritis Rheum. 2008, 58, 2105–2112. [Google Scholar] [CrossRef]
- Kelesidis, T.; Kelesidis, I.; Chou, S.; Mantzoros, C.S. Narrative review: The role of leptin in human physiology: Emerging clinical applications. Ann. Intern. Med. 2010, 152, 93–100. [Google Scholar] [CrossRef]
- Schwartz, M.W. Central nervous system regulation of food intake. Obesity 2006, 14, 1S. [Google Scholar] [CrossRef]
- Osegbe, I.; Okpara, H.; Azinge, E. Relationship between serum leptin and insulin resistance among obese Nigerian women. Ann. Afr. Med. 2016, 15, 14–19. [Google Scholar] [CrossRef]
- Smith, U.; Kahn, B.B. Adipose tissue regulates insulin sensitivity: Role of adipogenesis, de novo lipogenesis and novel lipids. J. Intern. Med. 2016, 280, 465–475. [Google Scholar] [CrossRef]
- Enriori, P.J.; Evans, A.E.; Sinnayah, P.; Cowley, M.A. Leptin resistance and obesity. Obesity 2006, 14, 254S–258S. [Google Scholar] [CrossRef]
- Elliott, W.J. Systemic hypertension. Curr. Probl. Cardiol. 2007, 32, 201–259. [Google Scholar] [CrossRef]
- American Diabetes Association. Diagnosis and classification of diabetes mellitus. Diabetes Care 2011, 34 (Suppl. 1), S62–S69. [Google Scholar] [CrossRef]
- Grundy, S.M.; Stone, N.J.; Bailey, A.L.; Beam, C.; Birtcher, K.K.; Blumenthal, R.S.; Braun, L.T.; de Ferranti, S.; Faiella-Tommasino, J.; Forman, D.E.; et al. 2018 AHA/ACC/AACVPR/AAPA/ABC/ACPM/ADA/AGS/APhA/ASPC/NLA/PCNA Guideline on the Management of Blood Cholesterol: A Report of the American College of Cardiology/American Heart Association Task Force on Clinical Practice Guidelines. Circulation 2019, 139, e1082–e1143, Erratum in Circulation 2019, 139, e1182–e1186. [Google Scholar] [CrossRef]
- de Abreu, V.G.; Martins, C.J.M.; de Oliveira, P.A.C.; Francischetti, E.A. High-molecular weight adiponectin/HOMA-IR ratio as a biomarker of metabolic syndrome in urban multiethnic Brazilian subjects. PLoS ONE 2017, 12, e0180947. [Google Scholar] [CrossRef]
- Keska, A.; Lutoslawska, G.; Czajkowska, A.; Tkaczyk, J.; Mazurek, K. Variability in HOMA-IR, lipoprotein profile and selected hormones in young active men. Sci. World J. 2013, 2013, 412764. [Google Scholar] [CrossRef]
- Agarwal, T.; Lyngdoh, T.; Dudbridge, F.; Chandak, G.R.; Kinra, S.; Prabhakaran, D.; Reddy, K.S.; Relton, C.L.; Davey Smith, G.; Ebrahim, S.; et al. Causal relationships between lipid and glycemic levels in an Indian population: A bidirectional Mendelian randomization approach. PLoS ONE 2020, 15, e0228269. [Google Scholar] [CrossRef] [Green Version]
- Oliveira, E.P.; Lima Md Souza, M.L. Síndrome metabólica, seus fenótipos e resistência à insulina pelo HOMA-RI [Metabolic syndrome, its phenotypes, and insulin resistance by HOMA-IR]. Arq. Bras. Endocrinol. Metabol. 2007, 51, 1506–1515. [Google Scholar] [CrossRef] [PubMed]
- Gu, S.; Wang, A.; Ning, G.; Zhang, L.; Mu, Y. Insulin resistance is associated with urinary albumin-creatinine ratio in normal weight individuals with hypertension and diabetes: The REACTION study. J. Diabetes 2020, 12, 406–416. [Google Scholar] [CrossRef] [PubMed]
- Chatterjee, A.; Basu, A.; Das, K.; Singh, P.; Mondal, D.; Bhattacharya, B.; Roychoudhury, S.; Majumder, P.P.; Chowdhury, A.; Basu, P. Hepatic transcriptome signature correlated with HOMA-IR explains early nonalcoholic fatty liver disease pathogenesis. Ann. Hepatol. 2020, 19, 472–481. [Google Scholar] [CrossRef] [PubMed]
- Isokuortti, E.; Zhou, Y.; Peltonen, M.; Bugianesi, E.; Clement, K.; Bonnefont-Rousselot, D.; Lacorte, J.M.; Gastaldelli, A.; Schuppan, D.; Schattenberg, J.M.; et al. Use of HOMA-IR to diagnose non-alcoholic fatty liver disease: A population-based and inter-laboratory study. Diabetologia 2017, 60, 1873–1882. [Google Scholar] [CrossRef]
- Farris, W.; Mansourian, S.; Chang, Y.; Lindsley, L.; Eckman, E.A.; Frosch, M.P.; Eckman, C.B.; Tanzi, R.E.; Selkoe, D.J.; Guénette, S. Insulin-degrading enzyme regulates the levels of insulin, amyloid β-protein, and the β-amyloid precursor protein intracellular domain in vivo. Proc. Natl. Acad. Sci. USA 2003, 100, 4162–4167. [Google Scholar] [CrossRef]
- Borges, D.O.; Patarrão, R.S.; Ribeiro, R.T.; de Oliveira, R.M.; Duarte, N.; Belew, G.D.; Martins, M.; Andrade, R.; Costa, J.; Correia, I.; et al. Loss of postprandial insulin clearance control by Insulin-degrading enzyme drives dysmetabolism traits. Metabolism 2021, 118, 154735. [Google Scholar] [CrossRef]
- Hooper, L.; Bunn, D.; Jimoh, F.O.; Fairweather-Tait, S.J. Water-loss dehydration and aging. Mech. Ageing Dev. 2014, 136, 50–58. [Google Scholar] [CrossRef]
- Reuben, D.B.; Moore, A.A.; Damesyn, M.; Keeler, E.; Harrison, G.G.; Greendale, G.A. Correlates of hypoalbuminemia in community-dwelling older persons. Am. J. Clin. Nutr. 1997, 66, 38–45. [Google Scholar] [CrossRef]
- Moman, R.N.; Gupta, N.; Varacallo, M. Physiology, Albumin; StatPearls Publishing: Treasure Island, FL, USA, 2017. [Google Scholar]
- Gayoso-Diz, P.; Otero-Gonzalez, A.; Rodriguez-Alvarez, M.X.; Gude, F.; Cadarso-Suarez, C.; García, F.; De Francisco, A. Insulin resistance index (HOMA-IR) levels in a general adult population: Curves percentile by gender and age. The EPIRCE study. Diabetes Res. Clin. Pract. 2011, 94, 146–155. [Google Scholar] [CrossRef]
- Eliasson, B.; Attvall, S.; Taskinen, M.R.; Smith, U. The insulin resistance syndrome in smokers is related to smoking habits. Arter. Thromb. 1994, 14, 1946–1950. [Google Scholar] [CrossRef] [Green Version]
- Yadav, A.; Kataria, M.A.; Saini, V.; Yadav, A. Role of leptin and adiponectin in insulin resistance. Clin. Chim. Acta 2013, 417, 80–84. [Google Scholar] [CrossRef]
- Alwahsh, S.M.; Xu, M.; Seyhan, H.A.; Ahmad, S.; Mihm, S.; Ramadori, G.; Schultze, F.C. Diet high in fructose leads to an overexpression of lipocalin-2 in rat fatty liver. World J. Gastroenterol. 2014, 20, 1807. [Google Scholar] [CrossRef]
- Ghadge, A.A.; Khaire, A.A. Leptin as a predictive marker for metabolic syndrome. Cytokine 2019, 121, 154735. [Google Scholar] [CrossRef]
- Gruzdeva, O.; Borodkina, D.; Uchasova, E.; Dyleva, Y.; Barbarash, O. Leptin resistance: Underlying mechanisms and diagnosis. Diabetes Metab. Syndr. Obes. Targets Ther. 2019, 12, 191–198. [Google Scholar] [CrossRef]
- Harlan, S.M.; Rahmouni, K. PI3K signaling: A key pathway in the control of sympathetic traffic and arterial pressure by leptin. Mol. Metab. 2013, 2, 69–73. [Google Scholar] [CrossRef]
- Münzberg, H.; Morrison, C.D. Structure, production and signaling of leptin. Metabolism 2015, 64, 13–23. [Google Scholar] [CrossRef]
- Yang, R.; Barouch, L.A. Leptin Signaling and Obesity. Circ. Res. 2007, 101, 545–559. [Google Scholar] [CrossRef]
- Liu, J.; Yang, X.; Yu, S.; Zheng, R. The Leptin Resistance. Adv. Exp. Med. Biol. 2018, 1090, 145–163. [Google Scholar] [CrossRef]
- Kleinert, M.; Kotzbeck, P.; Altendorfer-Kroath, T.; Birngruber, T.; Tschöp, M.H.; Clemmensen, C. Time-resolved hypothalamic open flow micro-perfusion reveals normal leptin transport across the blood-brain barrier in leptin resistant mice. Mol. Metab. 2018, 13, 77–82, Erratum in Mol. Metab. 2019, 30, 265. [Google Scholar] [CrossRef]
- Wang, L.; Li, Y.; Li, H.; Holdaway, J.; Hao, Z.; Wang, W.; Krafft, T. Regional aging and longevity characteristics in China. Arch. Gerontol. Geriatr. 2016, 67, 153–159. [Google Scholar] [CrossRef]
- Salihu, H.M.; Bonnema, S.M.; Alio, A.P. Obesity: What is an elderly population growing into? Maturitas 2009, 63, 7–12. [Google Scholar] [CrossRef]


| HOMA-IR | |||||
|---|---|---|---|---|---|
| Total | Low (<1.8) | Middle (1.8~3.5) | High (>3.5) | ||
| Variable | N = 396 | n = 129 | n = 136 | n = 131 | p Value |
| Leptin (ng/mL) | 14.89 (8.48, 28.36) | 9.96 (5.72, 16.15) | 14.30 (7.81, 26.55) | 23.30 (13.24, 41.21) | <0.001 |
| HOMA-IR index | 2.50 (1.50, 4.10) | 1.20 (0.90, 1.50) | 2.50 (2.10, 3.08) | 5.10 (4.10, 7.70) | <0.001 |
| Age (years) | 63.72 ± 8.76 | 63.90 ± 9.71 | 63.89 ± 8.13 | 63.36 ± 8.45 | 0.620 |
| FPG (mg/dL) | 99.00 (89, 118.75) | 91.00 (84.00, 97.00) | 98.50 (90.25, 111.00) | 118.00 (105.00, 145.00) | <0.001 |
| Insulin (uU/mL) | 9.89 (6.17, 14.93) | 5.16 (3.96, 6.44) | 9.99 (8.49, 11.89) | 18.22 (13.91, 24.86) | <0.001 |
| Uric Acid (mg/dL) | 5.63 ± 1.52 | 5.25 ± 1.30 | 5.48 ± 1.39 | 6.18 ± 1.70 | <0.001 |
| ALT (U/L) | 21.00 (16.00, 30.00) | 18.00 (15.00, 26.50) | 20.00 (15.00, 25.00) | 26.00 (19.00, 38.00) | <0.001 |
| Triglyceride (mg/dL) | 118.00 (86.00, 165.00) | 92.00 (73.00, 120.50) | 125.50 (88.25, 167.75) | 141.00 (106.00, 205.00) | <0.001 |
| HDL-C (mg/dL) | 52.00 (43.00, 61.00) | 58.00 (50.00, 68.50) | 51.00 (43.00, 59.75) | 47.00 (40.00, 56.00) | <0.001 |
| LDL-C (mg/dL) | 109.69 ± 33.99 | 111.97 ± 32.56 | 113.38 ± 37.06 | 103.62 ± 31.38 | 0.047 |
| Creatinin (mg/dL) | 0.80 (0.68, 0.97) | 0.77 (0.66, 0.94) | 0.82 (0.68, 1.00) | 0.84 (0.73, 0.98) | 0.027 |
| Albumin (g/dL) | 4.43 ± 0.25 | 4.43 ± 0.28 | 4.44 ± 0.26 | 4.42 ± 0.22 | 0.731 |
| SBP (mmHg) | 137.30 ± 17.49 | 134.58 ± 18.28 | 136.68 ± 15.96 | 140.63 ± 17.81 | 0.005 |
| DBP (mmHg) | 85.19 ± 10.98 | 82.38 ± 10.52 | 86.09 ± 11.06 | 87.02 ± 10.87 | <0.001 |
| BMI (kg/m2) | 25.59 ± 3.84 | 23.46 ± 2.88 | 25.37 ± 3.05 | 27.92 ± 4.11 | <0.001 |
| WC (cm) | 85.36 ± 10.83 | 82.81 ± 9.85 | 84.08 ± 10.00 | 89.17 ± 11.58 | <0.001 |
| Gender (male) | 164 (41.4%) | 42 (32.6%) | 59 (43.4%) | 63 (48.1%) | 0.011 |
| Smoking | 50 (12.6%) | 10 (7.8%) | 17 (12.5%) | 23 (17.6%) | 0.017 |
| Drinking | 28 (7.1%) | 8 (6.2%) | 10 (7.4%) | 10 (7.6%) | 0.653 |
| HTN | 201 (50.8%) | 43 (33.3%) | 74 (54.4%) | 84 (64.1%) | <0.001 |
| DM | 133 (33.6%) | 25 (19.4%) | 41 (30.1%) | 67 (51.1%) | <0.001 |
| Dyslipidemia | 153 (38.6%) | 36 (27.9%) | 53 (39.0%) | 64 (48.9%) | 0.001 |
| HOMA-IR Index | ||||
|---|---|---|---|---|
| Unadjusted | Adjusted for Age | |||
| Variables | Correlation | p Value | Correlation | p Value |
| Age (year) | −0.053 | 0.295 | NA | NA |
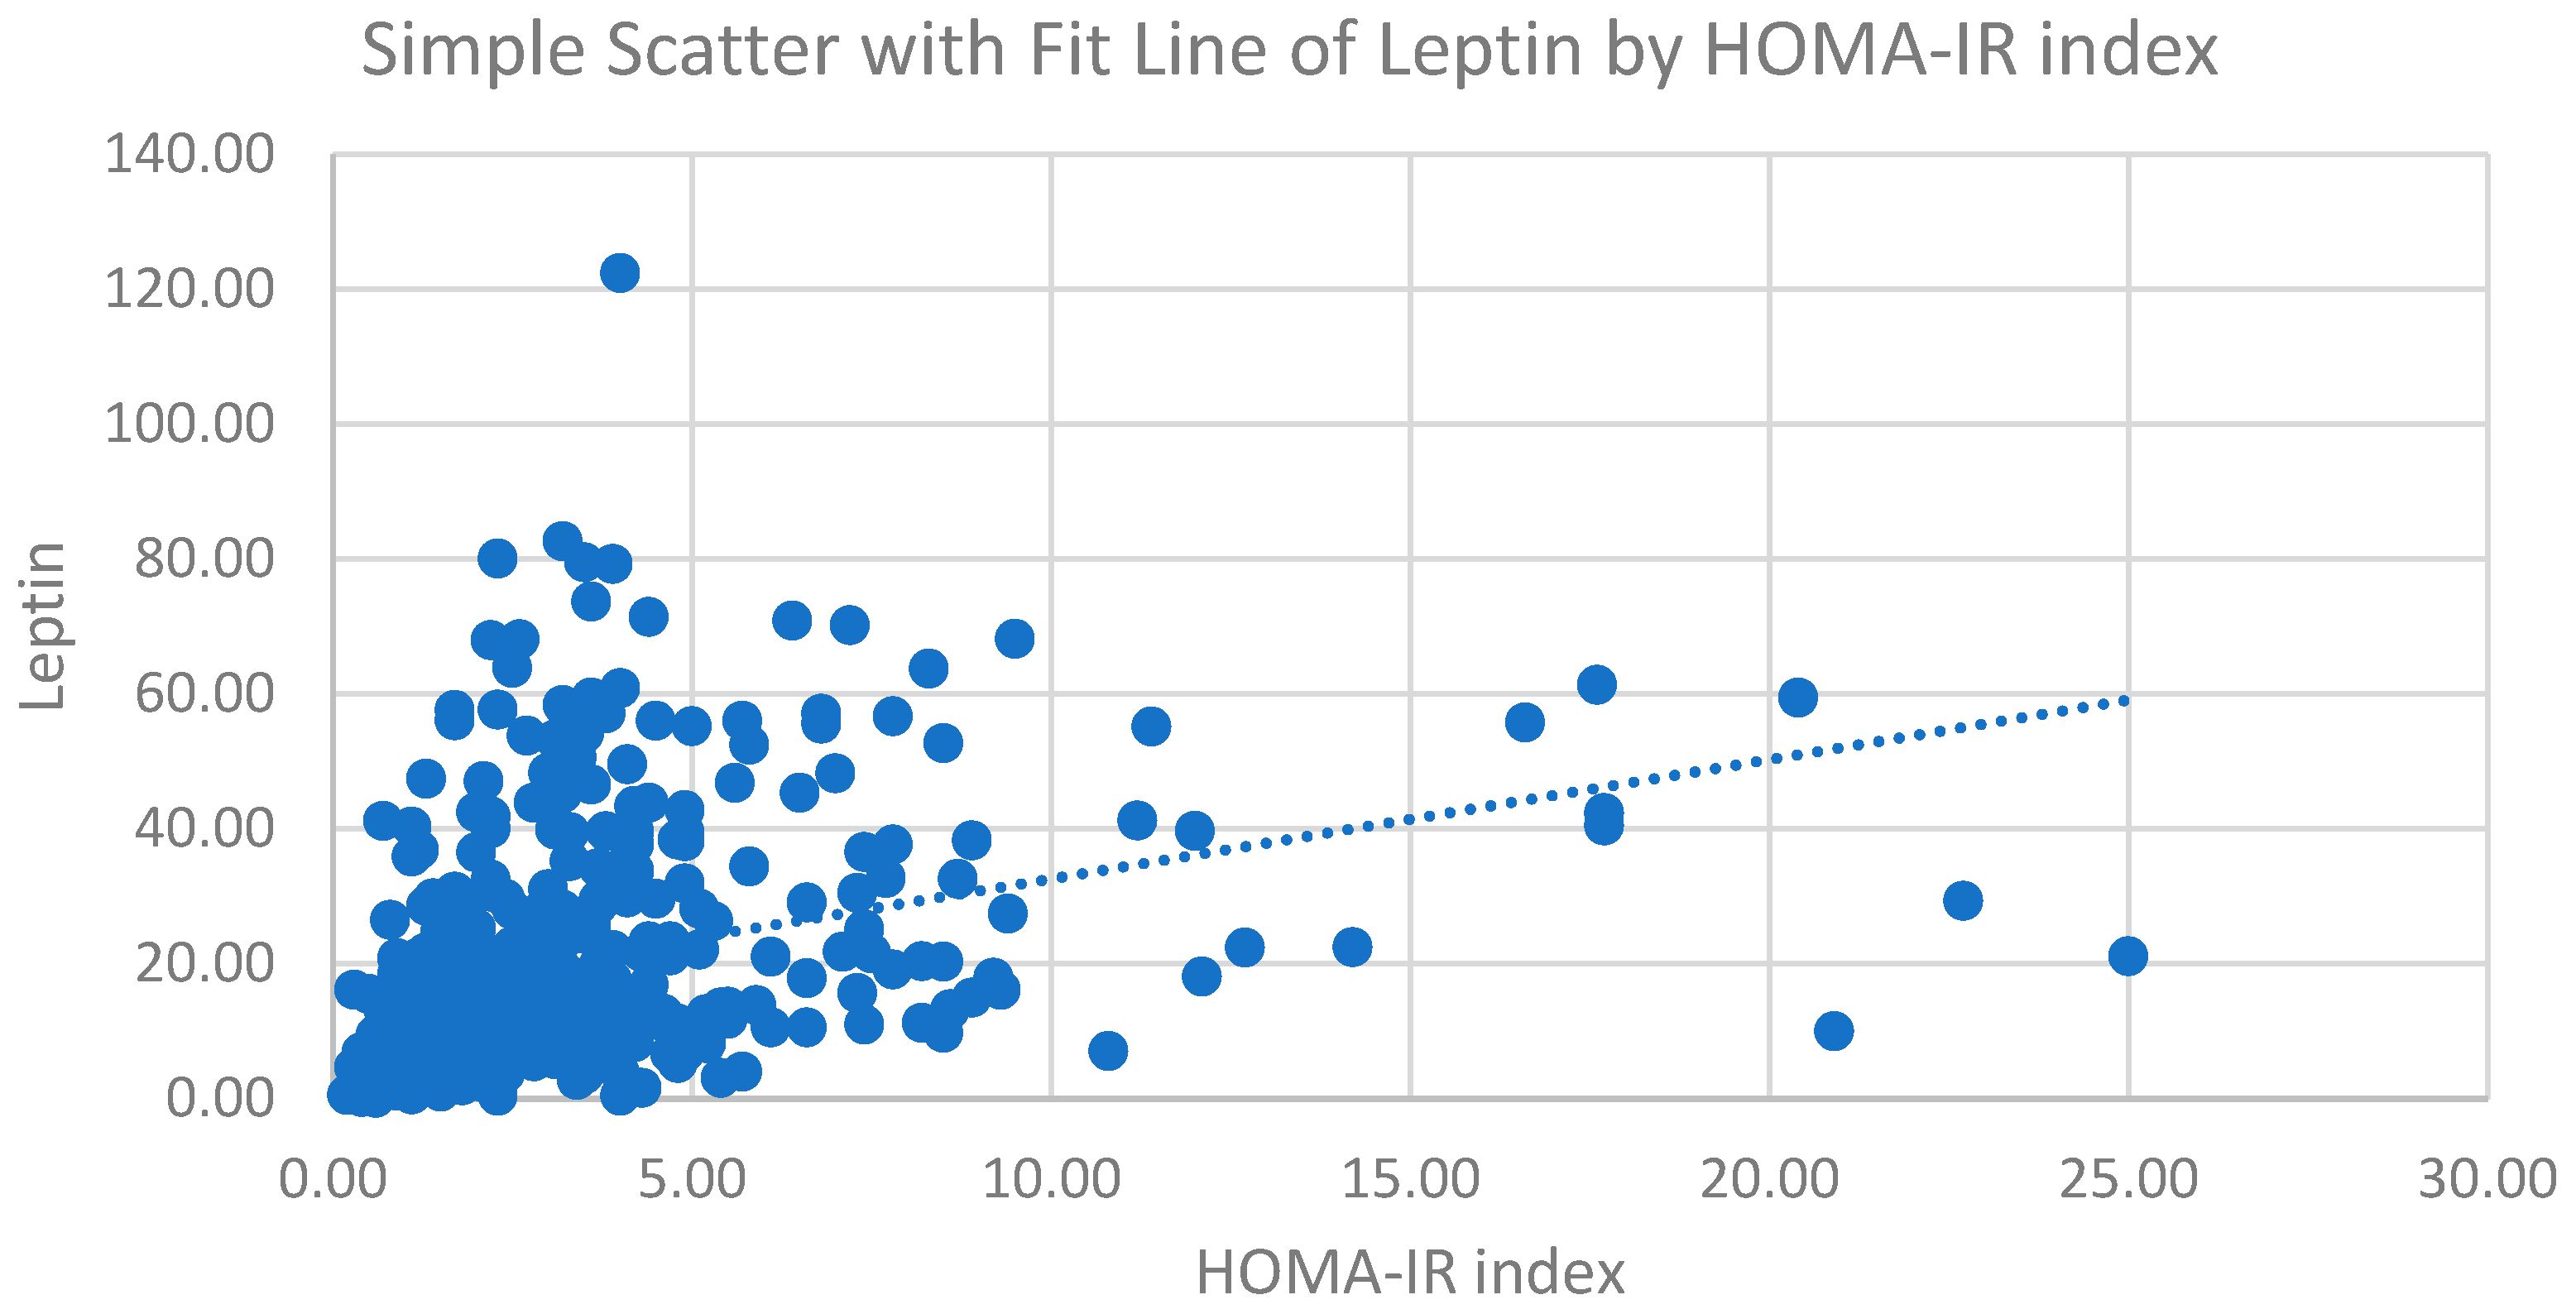
| Leptin (ng/mL) | 0.233 | <0.001 | 0.241 | <0.001 |
| FPG (mg/dL) | 0.436 | <0.001 | 0.436 | <0.001 |
| Insulin (uU/mL) | 0.935 | <0.001 | 0.935 | <0.001 |
| ALT (U/L) | 0.330 | <0.001 | 0.329 | <0.001 |
| HDL-C (mg/dL) | −0.207 | <0.001 | −0.205 | <0.001 |
| LDL-C (mg/dL) | −0.075 | 0.136 | −0.088 | 0.080 |
| Triglyceride (mg/dL) | 0.125 | 0.013 | 0.121 | 0.017 |
| Uric Acid (mg/dL) | 0.143 | 0.004 | 0.144 | 0.004 |
| Creatinine (mg/dL) | 0.072 | 0.154 | 0.084 | 0.097 |
| SBP (mmHg) | 0.109 | 0.030 | 0.124 | 0.014 |
| WC (cm) | 0.319 | <0.001 | 0.323 | <0.001 |
| BMI (kg/m2) | 0.322 | <0.001 | 0.320 | <0.001 |
| Model 1 | Model 2 | Model 3 | |||||||
|---|---|---|---|---|---|---|---|---|---|
| β | S.E. | p Value | β | S.E. | p Value | β | S.E. | p Value | |
| Leptin | 0.233 | 0.012 | <0.001 | 0.208 | 0.017 | 0.002 | 0.226 | 0.015 | <0.001 |
| Model 1 | Model 2 | Model 3 | |||||||
|---|---|---|---|---|---|---|---|---|---|
| β | S.E. | p Value | β | S.E. | p Value | β | S.E. | p Value | |
| Leptin | 0.037 | 0.010 | <0.001 | 0.031 | 0.014 | 0.028 | 0.041 | 0.013 | 0.001 |
Publisher’s Note: MDPI stays neutral with regard to jurisdictional claims in published maps and institutional affiliations. |
© 2022 by the authors. Licensee MDPI, Basel, Switzerland. This article is an open access article distributed under the terms and conditions of the Creative Commons Attribution (CC BY) license (https://creativecommons.org/licenses/by/4.0/).
Share and Cite
Shih, Y.-L.; Huang, T.-C.; Shih, C.-C.; Chen, J.-Y. Relationship between Leptin and Insulin Resistance among Community—Dwelling Middle-Aged and Elderly Populations in Taiwan. J. Clin. Med. 2022, 11, 5357. https://doi.org/10.3390/jcm11185357
Shih Y-L, Huang T-C, Shih C-C, Chen J-Y. Relationship between Leptin and Insulin Resistance among Community—Dwelling Middle-Aged and Elderly Populations in Taiwan. Journal of Clinical Medicine. 2022; 11(18):5357. https://doi.org/10.3390/jcm11185357
Chicago/Turabian StyleShih, Yu-Lin, Tzu-Cheng Huang, Chin-Chuan Shih, and Jau-Yuan Chen. 2022. "Relationship between Leptin and Insulin Resistance among Community—Dwelling Middle-Aged and Elderly Populations in Taiwan" Journal of Clinical Medicine 11, no. 18: 5357. https://doi.org/10.3390/jcm11185357