
Obesity and Risk of Diabetes Mellitus by Menopausal Status: A Nationwide Cohort Study

 ,
,
Abstract
:1. Introduction
2. Materials and Methods
2.1. Data Source and Study Setting
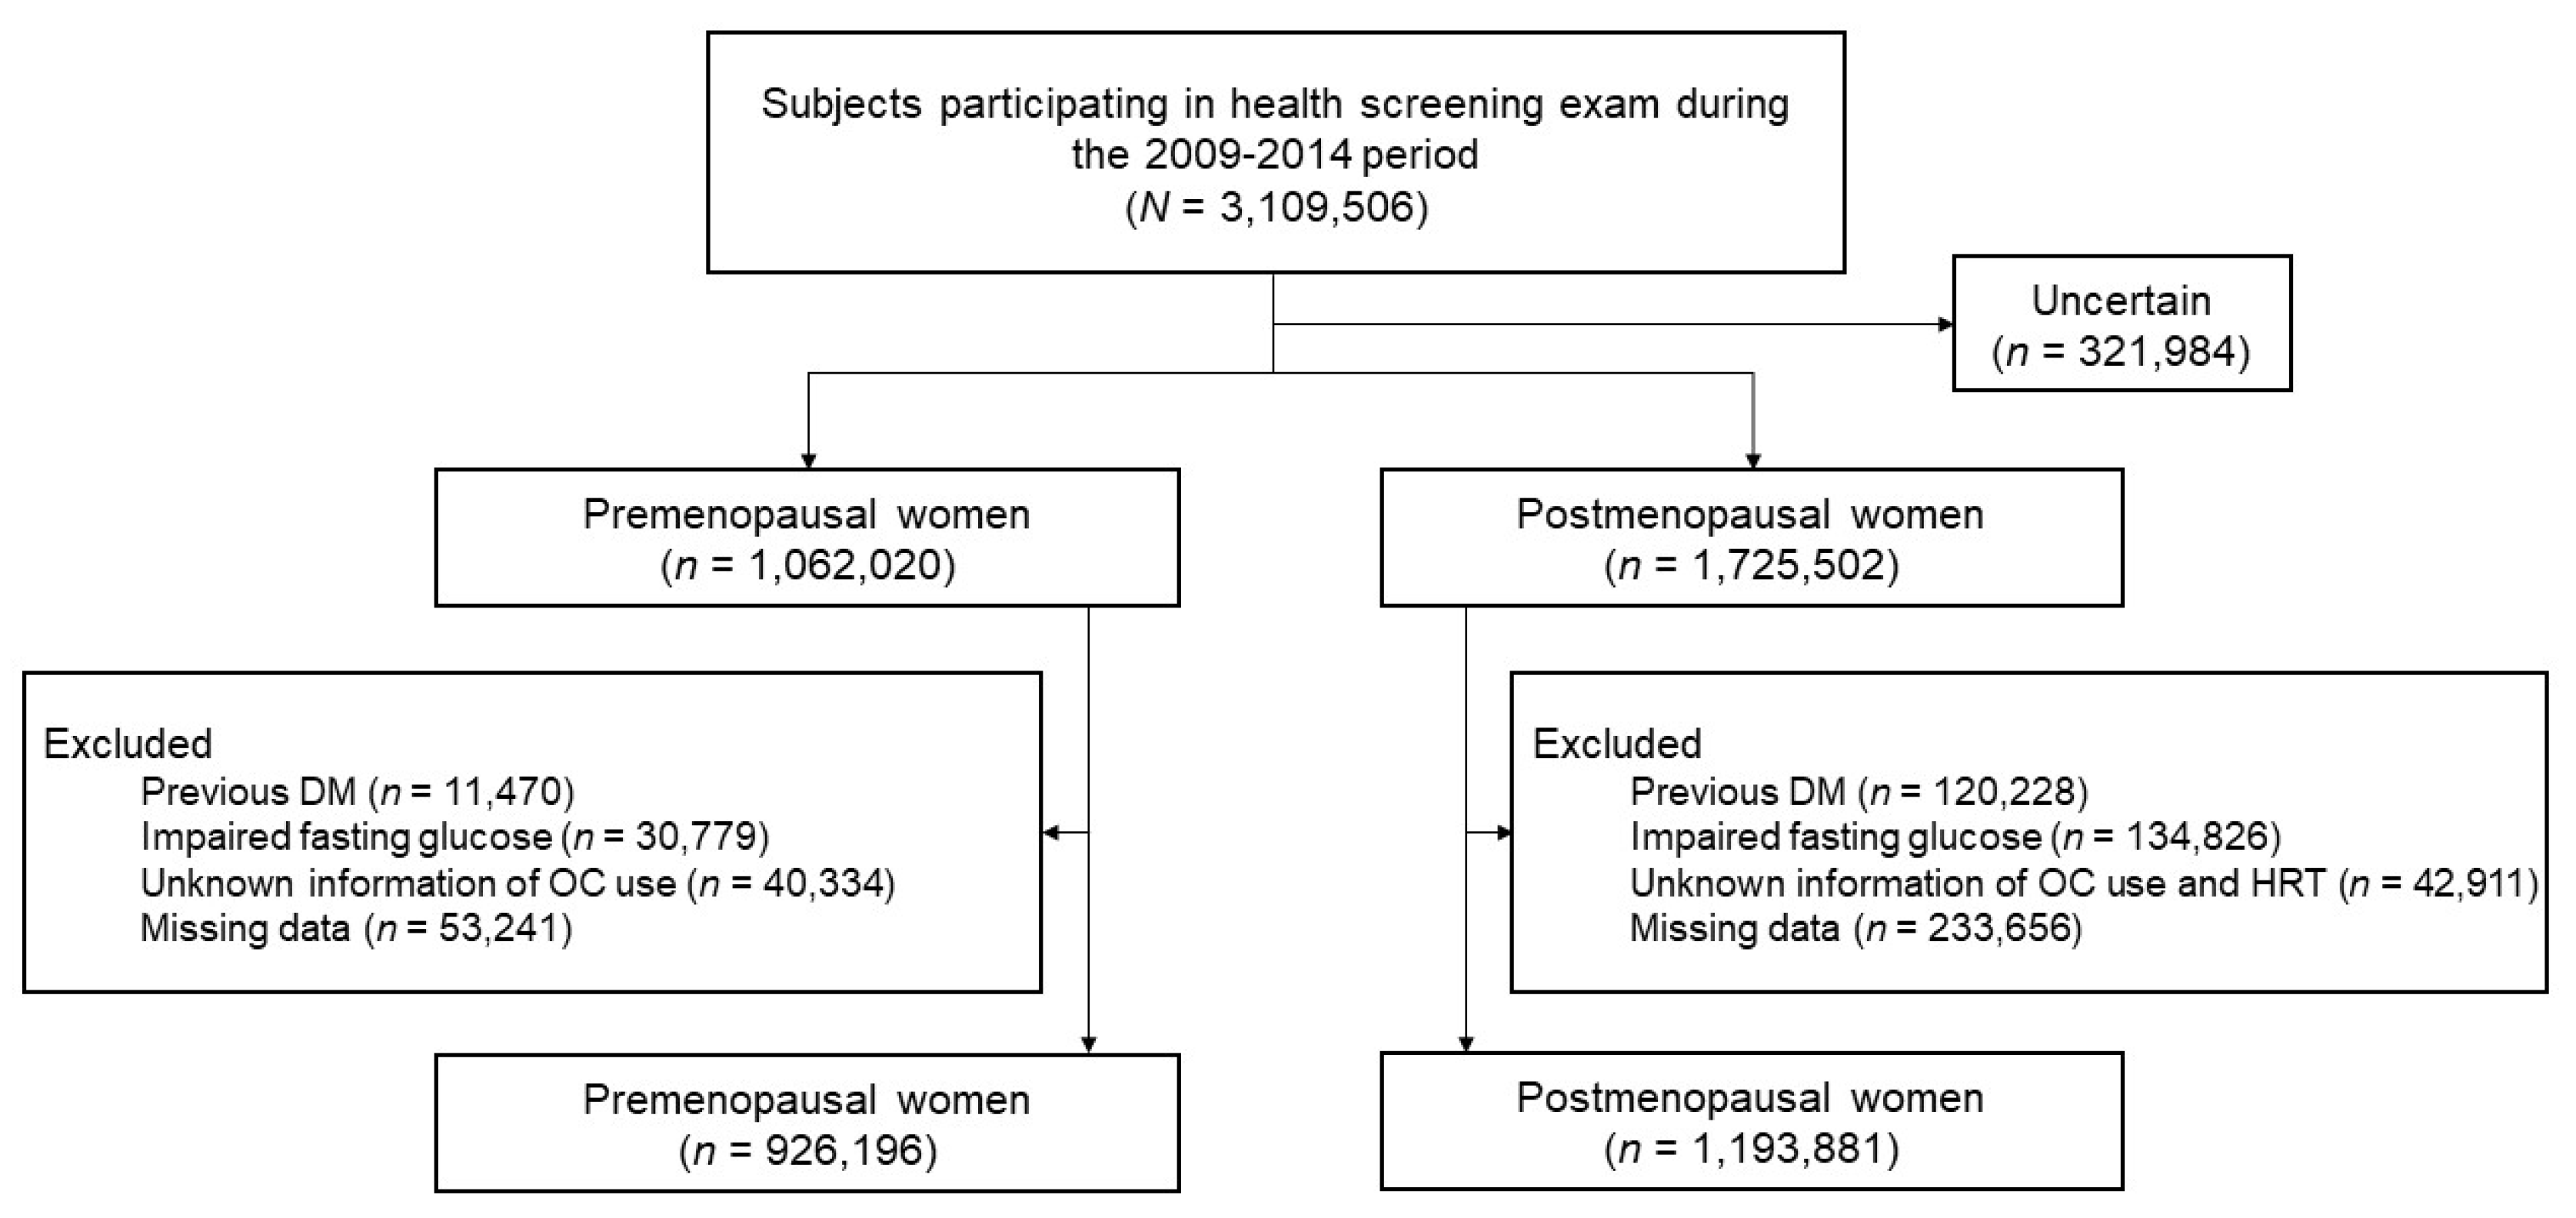
2.2. Study Population
2.3. BMI and WC
2.4. Study Outcomes and Follow-Up
2.5. Covariates
2.6. Statistical Analysis
3. Results
3.1. Baseline Characteristics of Study Subjects
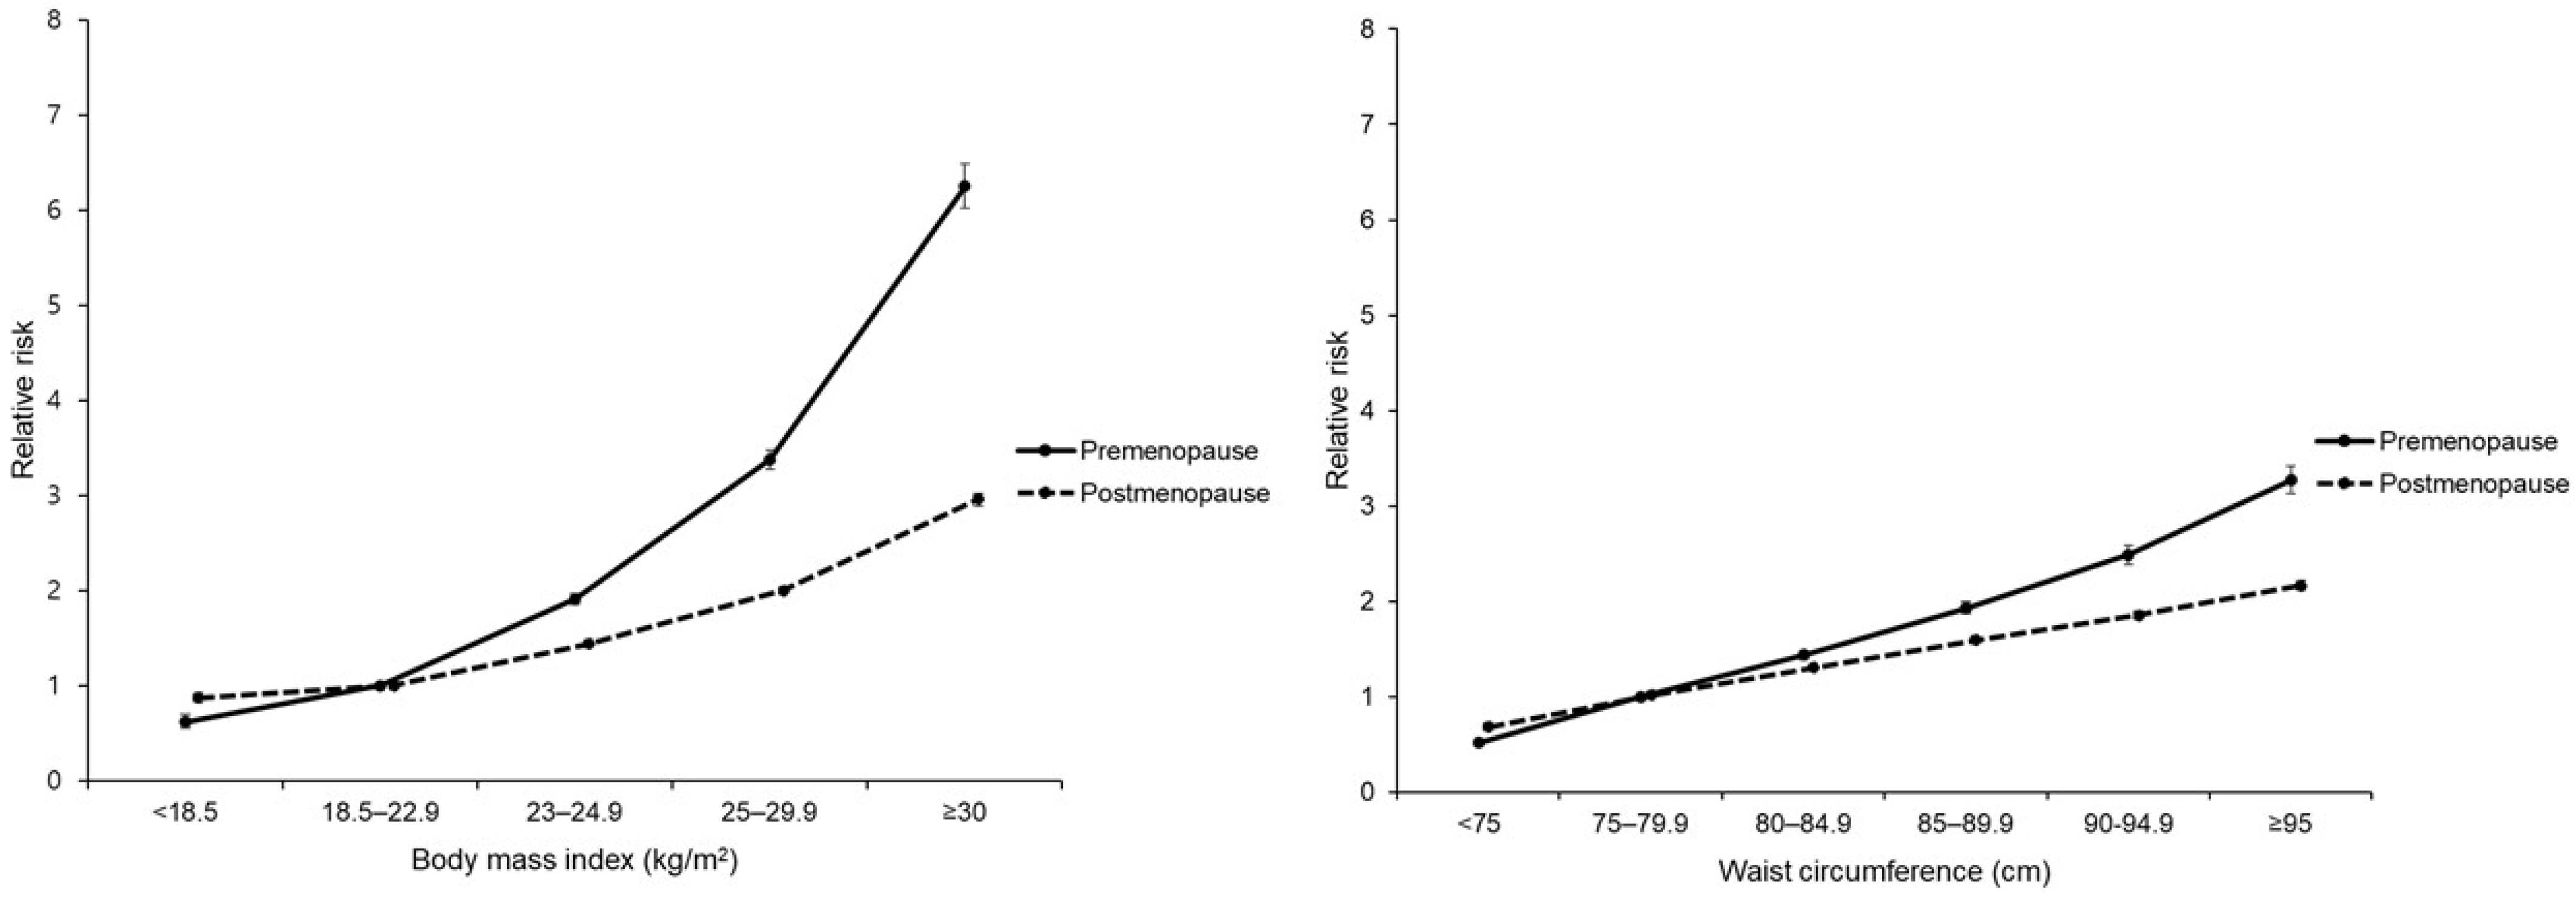
3.2. Associations of BMI and WC with Risk of DM
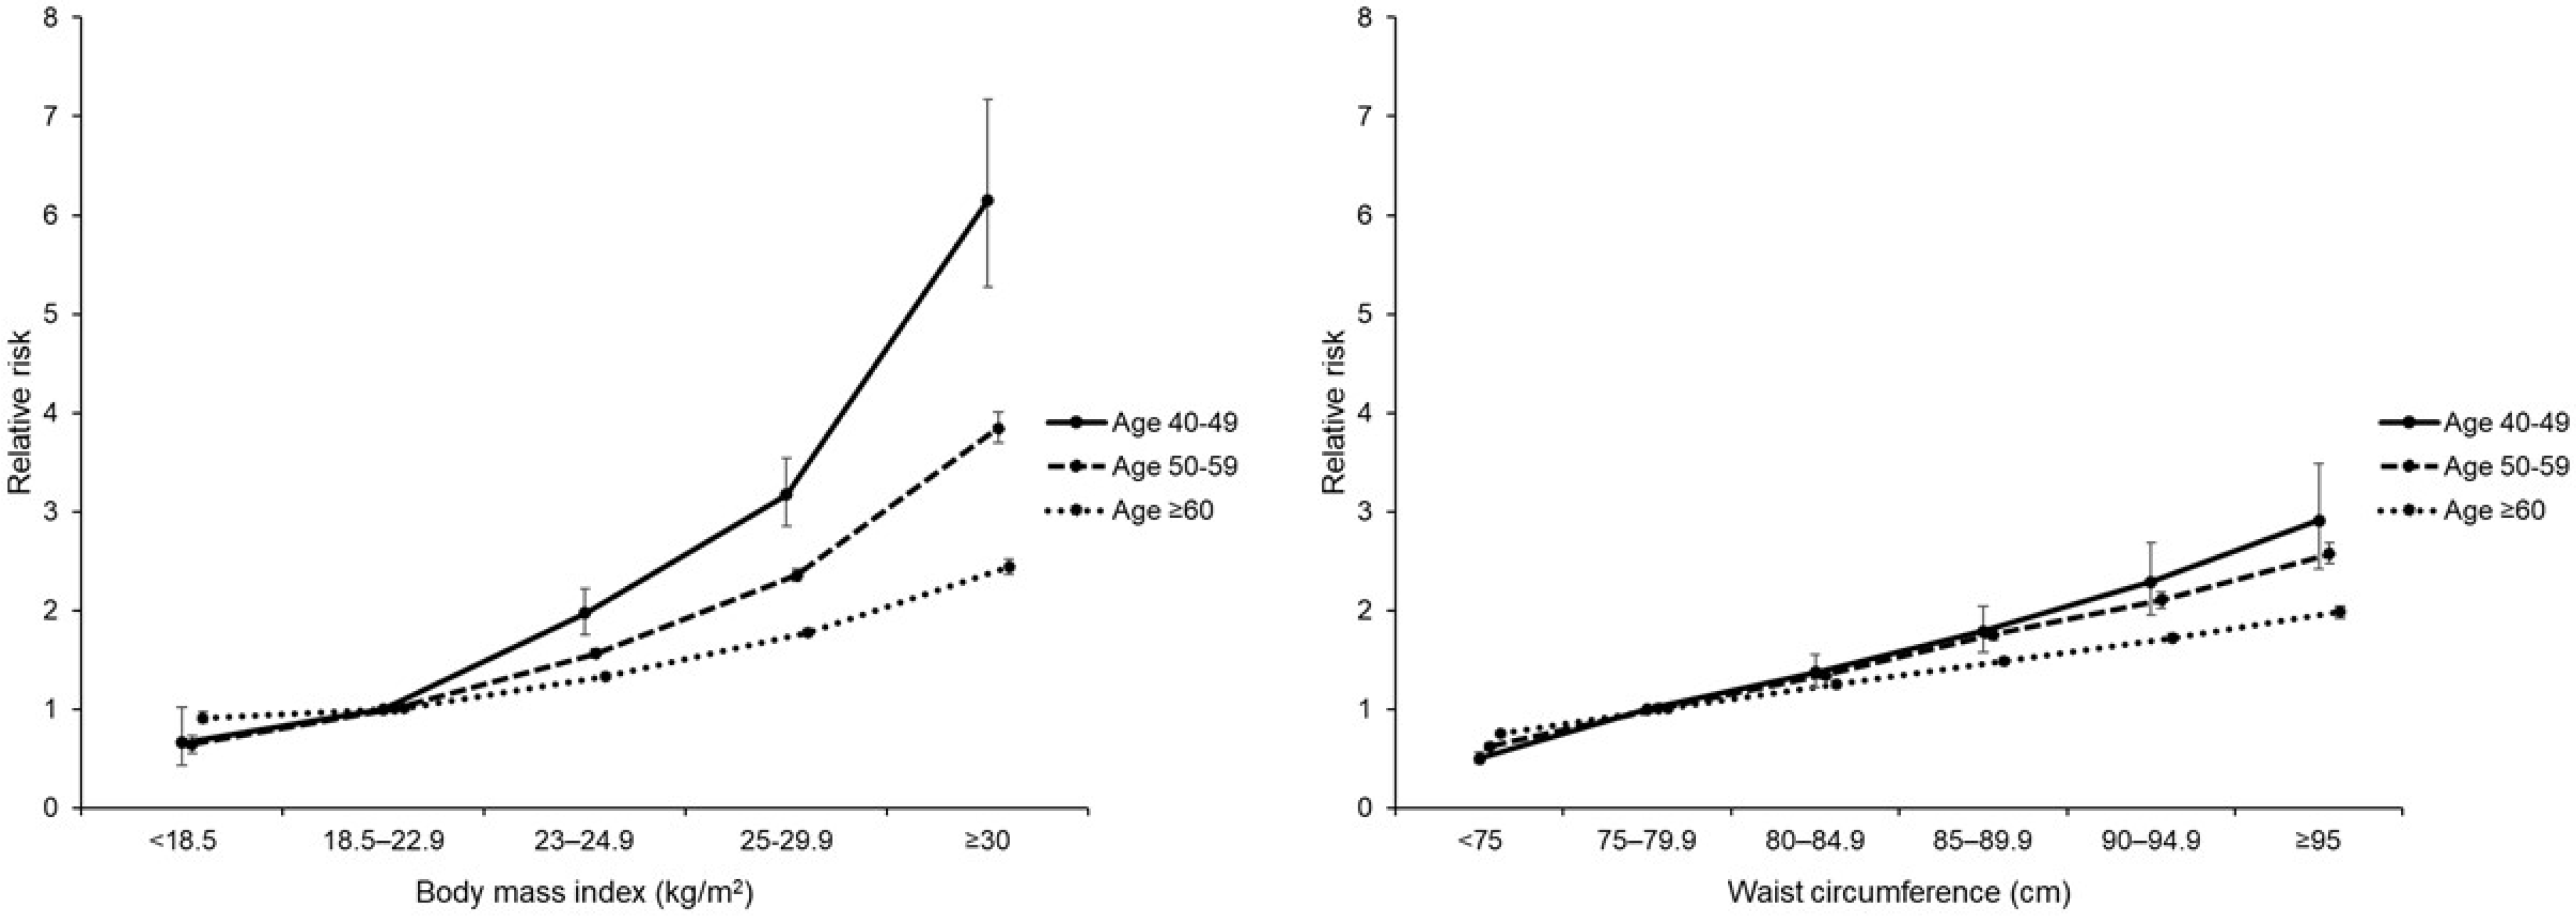
3.3. Analyses Stratified by Age Group
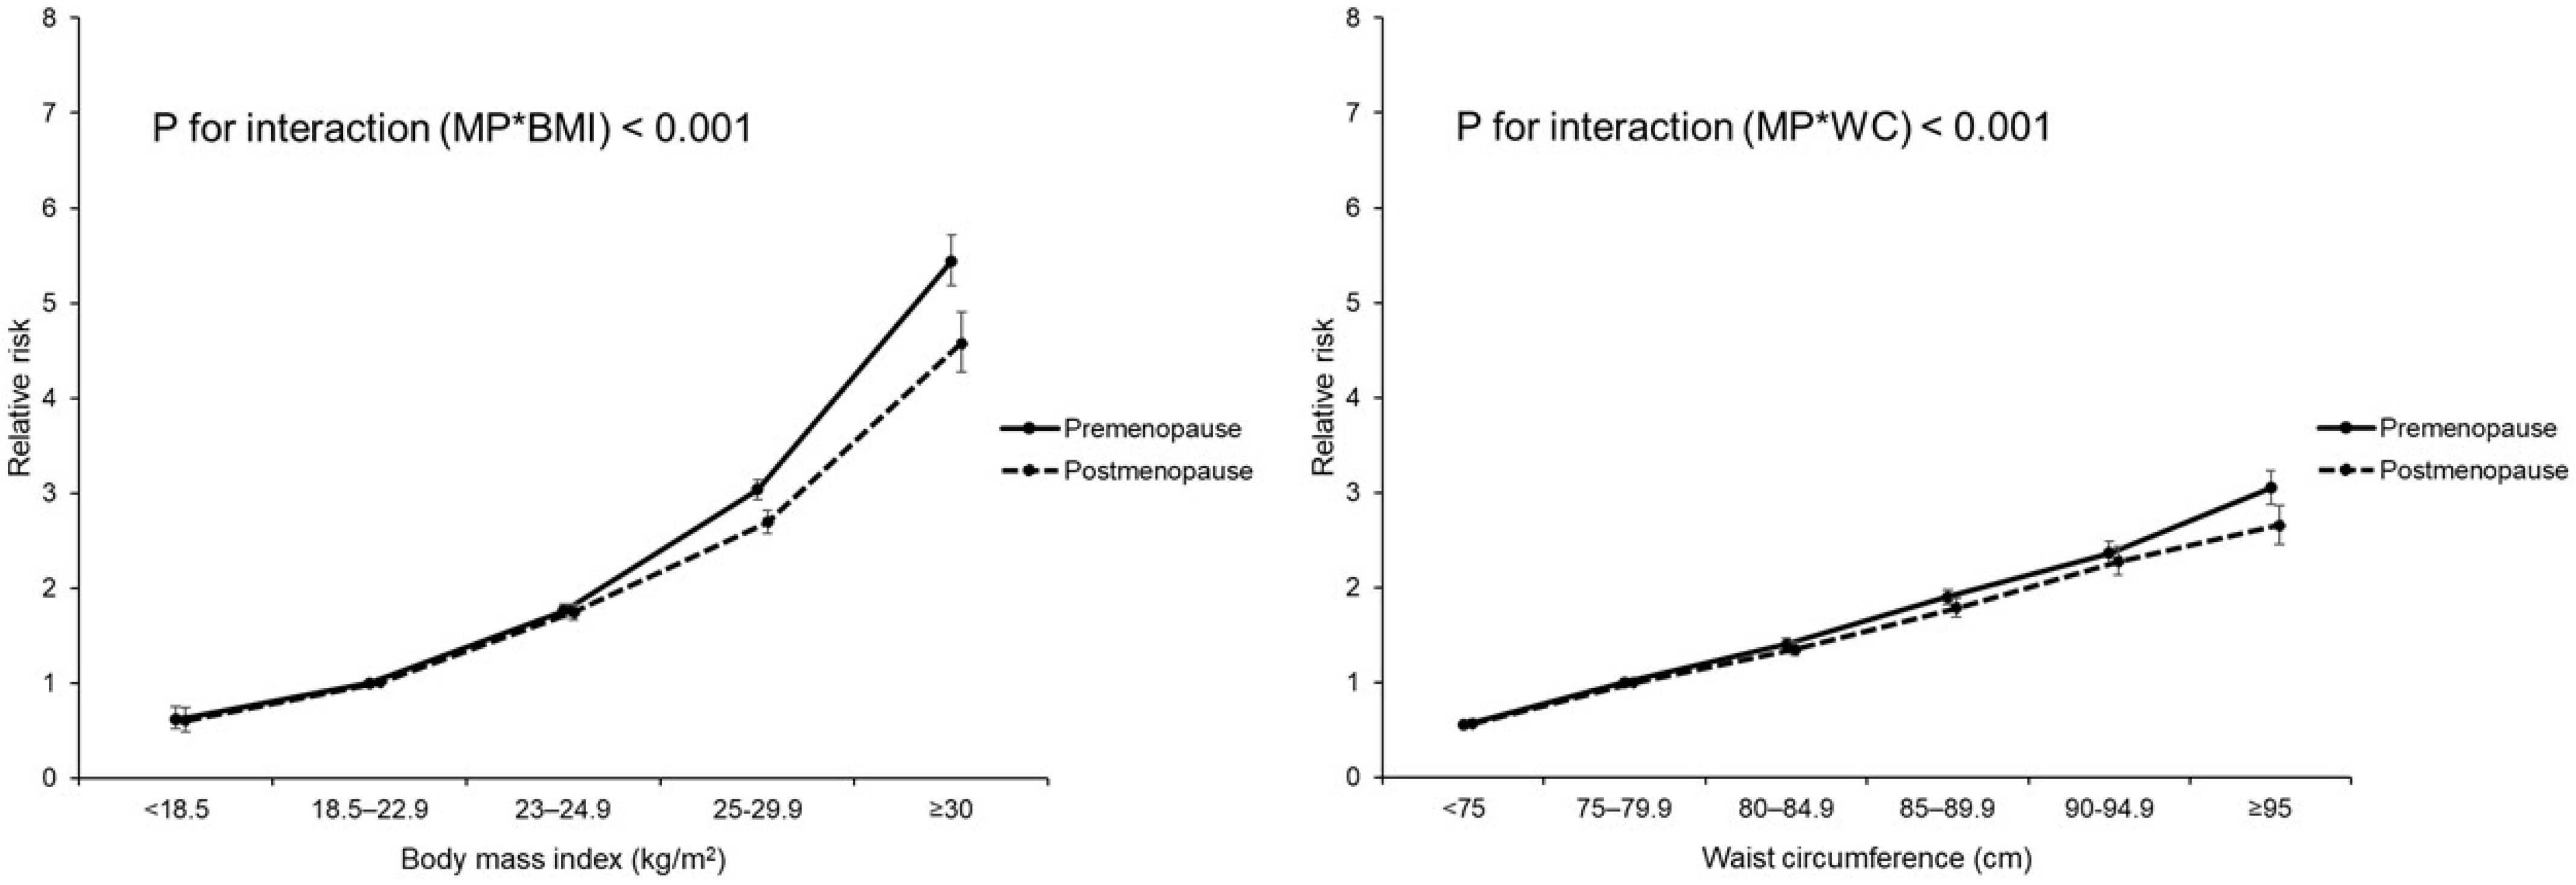
3.4. Analyses with Transitional Age
4. Discussion
Author Contributions
Funding
Institutional Review Board Statement
Informed Consent Statement
Data Availability Statement
Acknowledgments
Conflicts of Interest
References
- Saeedi, P.; Petersohn, I.; Salpea, P.; Malanda, B.; Karuranga, S.; Unwin, N.; Colagiuri, S.; Guariguata, L.; Motala, A.A.; Ogurtsova, K.; et al. Global and regional diabetes prevalence estimates for 2019 and projections for 2030 and 2045: Results from the International Diabetes Federation Diabetes Atlas, 9(th) edition. Diabetes Res. Clin. Pr. 2019, 157, 107843. [Google Scholar] [CrossRef] [PubMed] [Green Version]
- Maggio, C.A.; Pi-Sunyer, F.X. Obesity and type 2 diabetes. Endocrinol. Metab. Clin. North Am. 2003, 32, 805–822. [Google Scholar] [CrossRef]
- Kahn, S.E.; Hull, R.L.; Utzschneider, K.M. Mechanisms linking obesity to insulin resistance and type 2 diabetes. Nature 2006, 444, 840–846. [Google Scholar] [CrossRef]
- Haslam, D.W.; James, W.P. Obesity. Lancet 2005, 366, 1197–1209. [Google Scholar] [CrossRef]
- Jensen, M.D.; Ryan, D.H.; Apovian, C.M.; Ard, J.D.; Comuzzie, A.G.; Donato, K.A.; Hu, F.B.; Hubbard, V.S.; Jakicic, J.M.; Kushner, R.F.; et al. 2013 AHA/ACC/TOS guideline for the management of overweight and obesity in adults: A report of the American College of Cardiology/American Heart Association Task Force on Practice Guidelines and The Obesity Society. Circulation 2014, 129, S102–S138. [Google Scholar] [CrossRef] [PubMed] [Green Version]
- American Diabetes Association. Standards of Medical Care in Diabetes-2016 Abridged for Primary Care Providers. Clin. Diabetes 2016, 34, 3–21. [Google Scholar] [CrossRef] [PubMed] [Green Version]
- Sternfeld, B.; Wang, H.; Quesenberry, C.P., Jr.; Abrams, B.; Everson-Rose, S.A.; Greendale, G.A.; Matthews, K.A.; Torrens, J.I.; Sowers, M. Physical activity and changes in weight and waist circumference in midlife women: Findings from the Study of Women’s Health Across the Nation. Am. J. Epidemiol. 2004, 160, 912–922. [Google Scholar] [CrossRef] [PubMed]
- Karvonen-Gutierrez, C.; Kim, C. Association of Mid-Life Changes in Body Size, Body Composition and Obesity Status with the Menopausal Transition. Healthcare 2016, 4, 42. [Google Scholar] [CrossRef] [Green Version]
- Kautzky-Willer, A.; Harreiter, J.; Pacini, G. Sex and Gender Differences in Risk, Pathophysiology and Complications of Type 2 Diabetes Mellitus. Endocr. Rev. 2016, 37, 278–316. [Google Scholar] [CrossRef] [Green Version]
- Slopien, R.; Wender-Ozegowska, E.; Rogowicz-Frontczak, A.; Meczekalski, B.; Zozulinska-Ziolkiewicz, D.; Jaremek, J.D.; Cano, A.; Chedraui, P.; Goulis, D.G.; Lopes, P.; et al. Menopause and diabetes: EMAS clinical guide. Maturitas 2018, 117, 6–10. [Google Scholar] [CrossRef] [Green Version]
- Park, S.K.; Harlow, S.D.; Zheng, H.; Karvonen-Gutierrez, C.; Thurston, R.C.; Ruppert, K.; Janssen, I.; Randolph, J.F., Jr. Association between changes in oestradiol and follicle-stimulating hormone levels during the menopausal transition and risk of diabetes. Diabet. Med. 2017, 34, 531–538. [Google Scholar] [CrossRef] [PubMed]
- Brand, J.S.; van der Schouw, Y.T.; Onland-Moret, N.C.; Sharp, S.J.; Ong, K.K.; Khaw, K.T.; Ardanaz, E.; Amiano, P.; Boeing, H.; Chirlaque, M.D.; et al. Age at menopause, reproductive life span, and type 2 diabetes risk: Results from the EPIC-InterAct study. Diabetes Care 2013, 36, 1012–1019. [Google Scholar] [CrossRef] [PubMed] [Green Version]
- Pu, D.; Tan, R.; Yu, Q.; Wu, J. Metabolic syndrome in menopause and associated factors: A meta-analysis. Climacteric 2017, 20, 583–591. [Google Scholar] [CrossRef] [PubMed]
- Randolph, J.F., Jr.; Zheng, H.; Sowers, M.R.; Crandall, C.; Crawford, S.; Gold, E.B.; Vuga, M. Change in follicle-stimulating hormone and estradiol across the menopausal transition: Effect of age at the final menstrual period. J. Clin. Endocrinol. Metab. 2011, 96, 746–754. [Google Scholar] [CrossRef] [PubMed]
- Lee, D.H.; Keum, N.; Hu, F.B.; Orav, E.J.; Rimm, E.B.; Willett, W.C.; Giovannucci, E.L. Comparison of the association of predicted fat mass, body mass index, and other obesity indicators with type 2 diabetes risk: Two large prospective studies in US men and women. Eur. J. Epidemiol. 2018, 33, 1113–1123. [Google Scholar] [CrossRef] [PubMed]
- Cheol Seong, S.; Kim, Y.Y.; Khang, Y.H.; Heon Park, J.; Kang, H.J.; Lee, H.; Do, C.H.; Song, J.S.; Hyon Bang, J.; Ha, S.; et al. Data Resource Profile: The National Health Information Database of the National Health Insurance Service in South Korea. Int. J. Epidemiol. 2017, 46, 799–800. [Google Scholar] [CrossRef] [Green Version]
- Pan, W.H.; Yeh, W.T. How to define obesity? Evidence-based multiple action points for public awareness, screening, and treatment: An extension of Asian-Pacific recommendations. Asia Pac. J. Clin. Nutr. 2008, 17, 370–374. [Google Scholar] [PubMed]
- WHO. Obesity: Preventing and managing the global epidemic. Report of a WHO consultation. World Health Organ. Tech. Rep. Ser. 2000, 894, 1–253. [Google Scholar]
- Kapoor, E.; Collazo-Clavell, M.L.; Faubion, S.S. Weight Gain in Women at Midlife: A Concise Review of the Pathophysiology and Strategies for Management. Mayo Clin. Proc. 2017, 92, 1552–1558. [Google Scholar] [CrossRef] [PubMed]
- Cifkova, R.; Pitha, J.; Krajcoviechova, A.; Kralikova, E. Is the impact of conventional risk factors the same in men and women? Plea for a more gender-specific approach. Int. J. Cardiol. 2019, 286, 214–219. [Google Scholar] [CrossRef]
- De Pergola, G.; Maldera, S.; Tartagni, M.; Pannacciulli, N.; Loverro, G.; Giorgino, R. Inhibitory effect of obesity on gonadotropin, estradiol, and inhibin B levels in fertile women. Obes. Silver Spring 2006, 14, 1954–1960. [Google Scholar] [CrossRef] [PubMed] [Green Version]
- Freeman, E.W.; Sammel, M.D.; Lin, H.; Gracia, C.R. Obesity and reproductive hormone levels in the transition to menopause. Menopause 2010, 17, 718–726. [Google Scholar] [CrossRef] [Green Version]
- Nelson, L.R.; Bulun, S.E. Estrogen production and action. J. Am. Acad. Derm. 2001, 45, S116–S124. [Google Scholar] [CrossRef] [PubMed]
- Greendale, G.A.; Sternfeld, B.; Huang, M.; Han, W.; Karvonen-Gutierrez, C.; Ruppert, K.; Cauley, J.A.; Finkelstein, J.S.; Jiang, S.F.; Karlamangla, A.S. Changes in body composition and weight during the menopause transition. JCI Insight 2019, 4(5), e124865. [Google Scholar] [CrossRef]
- Tatsumi, Y.; Ohno, Y.; Morimoto, A.; Nishigaki, Y.; Mizuno, S.; Watanabe, S. Age differences in the risk of diabetes incidence according to body mass index level in Japanese women. Obes. Res. Clin. Pr. 2013, 7, e455–e463. [Google Scholar] [CrossRef] [PubMed]
- Asia Pacific Cohort Studies Collaboration; Ni Mhurchu, C.; Parag, V.; Nakamura, M.; Patel, A.; Rodgers, A.; Lam, T.H. Body mass index and risk of diabetes mellitus in the Asia-Pacific region. Asia Pac. J. Clin. Nutr. 2006, 15, 127–133. [Google Scholar] [PubMed]
- Manrique-Acevedo, C.; Chinnakotla, B.; Padilla, J.; Martinez-Lemus, L.A.; Gozal, D. Obesity and cardiovascular disease in women. Int. J. Obes. Lond. 2020, 44, 1210–1226. [Google Scholar] [CrossRef] [PubMed]
- Manson, J.E.; Rimm, E.B.; Colditz, G.A.; Willett, W.C.; Nathan, D.M.; Arky, R.A.; Rosner, B.; Hennekens, C.H.; Speizer, F.E.; Stampfer, M.J. A prospective study of postmenopausal estrogen therapy and subsequent incidence of non-insulin-dependent diabetes mellitus. Ann. Epidemiol. 1992, 2, 665–673. [Google Scholar] [CrossRef]
- Margolis, K.L.; Bonds, D.E.; Rodabough, R.J.; Tinker, L.; Phillips, L.S.; Allen, C.; Bassford, T.; Burke, G.; Torrens, J.; Howard, B.V.; et al. Effect of oestrogen plus progestin on the incidence of diabetes in postmenopausal women: Results from the Women’s Health Initiative Hormone Trial. Diabetologia 2004, 47, 1175–1187. [Google Scholar] [CrossRef] [PubMed]
- Kanaya, A.M.; Herrington, D.; Vittinghoff, E.; Lin, F.; Grady, D.; Bittner, V.; Cauley, J.A.; Barrett-Connor, E. Glycemic effects of postmenopausal hormone therapy: The Heart and Estrogen/progestin Replacement Study. A randomized, double-blind, placebo-controlled trial. Ann. Intern. Med. 2003, 138, 1–9. [Google Scholar] [CrossRef] [PubMed]
- Flegal, K.M.; Shepherd, J.A.; Looker, A.C.; Graubard, B.I.; Borrud, L.G.; Ogden, C.L.; Harris, T.B.; Everhart, J.E.; Schenker, N. Comparisons of percentage body fat, body mass index, waist circumference, and waist-stature ratio in adults. Am. J. Clin. Nutr. 2009, 89, 500–508. [Google Scholar] [CrossRef] [PubMed]


| Premenopausal | Postmenopausal | |||||
|---|---|---|---|---|---|---|
| DM | DM | |||||
| No | Yes | p-Value | No | Yes | p-Value | |
| n = 888,460 | n = 37,736 | n = 1,072,779 | n = 121,102 | |||
| N (%) | N (%) | N (%) | N (%) | |||
| Age, mean (SD) | 44.91 (±3.9) | 46.47 (±4.1) | <0.001 | 61 (±8.3) | 63.06 (±7.9) | <0.001 |
| Body mass index, kg/m2, mean (SD) | 23.03 (±2.9) | 25.81 (±3.6) | <0.001 | 23.88 (±3.0) | 25.44 (±3.3) | <0.001 |
| <18.5 | 26,271 (3.0) | 237 (0.6) | <0.001 | 25,901 (2.4) | 1346 (1.1) | <0.001 |
| 18.5–22.9 | 455,929 (51.3) | 7929 (21.01) | 400,471 (37.3) | 24,883 (20.6) | ||
| 23–24.9 | 207,975 (23.4) | 8598 (22.8) | 288,280 (26.9) | 29,625 (24.5) | ||
| 25–29.9 | 177,510 (20.0) | 16,195 (42.9) | 324,374 (30.2) | 54,754 (45.2) | ||
| ≥30 | 20,775 (2.3) | 4777 (12.7) | 33,753 (3.2) | 10,494 (8.7) | ||
| Waist circumference, cm | <0.001 | <0.001 | ||||
| <75 | 470,509 (53.0) | 8121 (21.5) | 314,484 (29.3) | 15,666 (12.9) | ||
| 75–79.9 | 203,157 (22.9) | 8472 (22.5) | 256,275 (23.9) | 22,281 (18.4) | ||
| 80–84.9 | 126,288 (14.2) | 8838 (23.42) | 247,831 (23.1) | 31,458 (26.0) | ||
| 85–89.9 | 56,024 (6.3) | 6116 (16.21) | 146,726 (13.7) | 25,296 (20.9) | ||
| 90–94.9 | 21,496 (2.4) | 3445 (9.13) | 71,134 (6.6) | 15,821 (13.1) | ||
| ≥95 | 10,986 (1.2) | 2744 (7.27) | 36,329 (3.4) | 10,580 (8.7) | ||
| Smoking status | <0.001 | <0.001 | ||||
| Never | 844,864 (95.1) | 35,395 (93.8) | 1,034,949 (96.5) | 115,434 (95.3) | ||
| Ex-smoker | 14,279 (1.6) | 570 (1.5) | 10,902 (1.0) | 1428 (1.2) | ||
| Current | 29,317 (3.3) | 1771 (4.7) | 26,928 (2.5) | 4240 (3.5) | ||
| Alcohol drinking | <0.001 | <0.001 | ||||
| Non | 635,208 (71.5) | 28,005 (74.2) | 933,632 (87.0) | 107,606 (88.9) | ||
| Mild | 243,387 (27.4) | 9125 (24.2) | 133,670 (12.5) | 12,840 (10.6) | ||
| Heavy | 9865 (1.1) | 606 (1.6) | 5477 (0.5) | 656 (0.5) | ||
| Regular physical activity | 153,878 (17.3) | 6424 (17.0) | 0.137 | 197,854 (18.4) | 21,252 (17.6) | <0.001 |
| Income | <0.001 | 0.135 | ||||
| 1st quartile (lowest) | 227,896 (25.7) | 10,182 (27.0) | 244,674 (22.8) | 27,725 (22.9) | ||
| 2nd quartile | 179,239 (20.2) | 8385 (22.2) | 199,691 (18.6) | 22,568 (18.6) | ||
| 3rd quartile | 195,797 (22.0) | 8556 (22.7) | 264,510 (24.7) | 30,114 (24.9) | ||
| 4th quartile (highest) | 285,528 (32.1) | 10,613 (28.1) | 363,904 (33.9) | 40,695 (33.6) | ||
| Comorbid condition | ||||||
| Hypertension | 111,075 (12.5) | 12,204 (32.3) | <0.001 | 438,377 (40.9) | 72,790 (60.1) | <0.001 |
| Hyperlipidemia | 86,935 (9.8) | 8950 (23.7) | <0.001 | 322,240 (30.0) | 52,569 (43.4) | <0.001 |
| Chronic kidney disease | 36,644 (4.1) | 1706 (4.5) | 0.002 | 113,384 (10.6) | 16,155 (13.3) | <0.001 |
| History of stroke | 2037 (0.5) | 122 (0.6) | 0.03 | 12,511 (1.8) | 2098 (2.4) | <0.001 |
| History of heart disease | 3903 (0.9) | 348 (1.6) | <0.001 | 34,181 (4.9) | 6793 (7.6) | <0.001 |
| SBP, mmHg | 116.7 (±14.1) | 123.89 (±15.6) | <0.001 | 124.65 (±16.0) | 129.01 (±16.1) | <0.001 |
| DBP, mmHg | 72.85 (±9.9) | 77.37 (±10.5) | <0.001 | 76.59 (±10.1) | 78.61 (±10.1) | <0.001 |
| Fasting glucose, mg/dL | 91.02 (±10.1) | 101.4 (±12.5) | <0.001 | 92.94 (±10.6) | 101.35 (±12.4) | <0.001 |
| Total cholesterol, mg/dL | 191.22 (±38.3) | 204.78 (±41.0) | <0.001 | 208.5 (±43.2) | 213.16 (±45.9) | <0.001 |
| HDL, mg/dL | 60.72 (±35.0) | 55.8 (±32.1) | <0.001 | 58.45 (±35.7) | 55.98 (±35.8) | <0.001 |
| LDL, mg/dL | 114.01 (±70.2) | 123.07 (±60.3) | <0.001 | 128.07 (±68.0) | 129.52 (±78.3) | <0.001 |
| AST, mg/dL | 20.33 (20.31–20.34) | 22.81 (22.72–22.9) | <0.001 | 23.71 (23.7–23.72) | 25.19 (25.14–25.24) | <0.001 |
| ALT, mg/dL | 16.35 (16.33–16.36) | 22.08 (21.96–22.21) | <0.001 | 19.44 (19.42–19.46) | 23.06 (22.99–23.12) | <0.001 |
| rGTP, mg/dL | 16.8 (16.78–16.81) | 24.36 (24.21–24.51) | <0.001 | 19.62 (19.6–19.64) | 25.08 (25–25.17) | <0.001 |
| TG, mg/dL | 86.23 (86.15–86.32) | 125.55 (124.87–126.23) | <0.001 | 111.02 (110.91–111.12) | 136.95 (136.55–137.34) | <0.001 |
| Age at menarche, years, mean (SD) | 15.09 (±1.7) | 15.28 (±1.8) | <0.001 | 16.44 (±1.8) | 16.58 (±1.8) | <0.001 |
| Age at menarche, years | <0.001 | <0.001 | ||||
| ≤12 | 38,914 (4.4) | 1678 (4.5) | 10,589 (1.0) | 1087 (0.9) | ||
| 13–14 | 281,849 (31.7) | 10,619 (28.1) | 133,685 (12.5) | 13,014 (10.8) | ||
| 15–16 | 408,323 (46.0) | 16,873 (44.7) | 417,228 (38.9) | 45,148 (37.3) | ||
| >16 | 159,374 (17.9) | 8566 (22.7) | 511,277 (47.7) | 61,853 (51.1) | ||
| Age at menopause, years, mean (SD) | 49.99 (±4.0) | 50.05 (±4.2) | <0.001 | |||
| <40 | 18,050 (1.7) | 2469 (2.0) | <0.001 | |||
| 40–44 | 61,482 (5.7) | 7415 (6.1) | ||||
| 45–49 | 296,664 (27.7) | 31,855 (26.3) | ||||
| 50–54 | 587,412 (54.8) | 64,433 (53.2) | ||||
| ≥55 | 109,171 (10.2) | 14,930 (12.3) | ||||
| Parity | <0.001 | <0.001 | ||||
| 1 | 117,837 (13.3) | 4709 (12.5) | 67,094 (6.3) | 5858 (4.8) | ||
| ≥2 | 734,191 (82.6) | 31,736 (84.1) | 979,503 (91.3) | 112,843 (93.2) | ||
| Nullipara | 36,432 (4.1) | 1291 (3.4) | 26,182 (2.4) | 2401 (2.0) | ||
| Duration of BF, months | <0.001 | <0.001 | ||||
| <6 | 219,610 (24.7) | 7003 (18.6) | 72,661 (6.8) | 5733 (4.7) | ||
| 6–12 | 234,963 (26.5) | 9516 (25.2) | 188,313 (17.6) | 18,008 (14.9) | ||
| ≥12 | 272,801 (30.7) | 14,722 (39.0) | 739,956 (69.0) | 90,729 (74.9) | ||
| Never | 161,086 (18.1) | 6495 (17.2) | 71,849 (6.7) | 6632 (5.5) | ||
| Total reproductive years, mean (SD) | 33.55 (±4.4) | 33.47 (±4.6) | <0.001 | |||
| <30 | 147,895 (13.8) | 18,220 (15.1) | <0.001 | |||
| <35 | 449,813 (41.9) | 49,907 (41.2) | ||||
| <40 | 409,574 (38.2) | 44,264 (36.6) | ||||
| ≥40 | 65,497 (6.1) | 8711 (7.2) | ||||
| Duration of OC use, years | <0.001 | <0.001 | ||||
| Never | 772,147 (86.9) | 32,090 (85.0) | 906,165 (84.5) | 101,236 (83.6) | ||
| <1 | 85,969 (9.7) | 3922 (10.4) | 101,590 (9.5) | 11,447 (9.5) | ||
| ≥1 | 30,344 (3.4) | 1724 (4.6) | 65,024 (6.1) | 8419 (7.0) | ||
| Duration of HRT, years | <0.001 | |||||
| Never | 893,677 (83.3) | 103,099 (85.1) | ||||
| <2 | 104,126 (9.7) | 10,369 (8.6) | ||||
| 2–5 | 43,057 (4.0) | 4058 (3.4) | ||||
| ≥5 | 31,919 (3.0) | 3576 (3.0) | ||||
| Subjects (n) | Events (n) | Duration (Person-Years) | Incidence Rate (per 1000 Person-Years) | HR (95% C.I) | |||||
|---|---|---|---|---|---|---|---|---|---|
| Model 1 | Model 2 | Model 3 | Model 4 | ||||||
| Body Mass Index | |||||||||
| Pre-menopause | <18.5 | 26,508 | 237 | 219,317.7 | 1.08 | 0.52 (0.46, 0.60) | 0.61 (0.53, 0.69) | 0.62 (0.54, 0.70) | 0.62 (0.55, 0.71) |
| <23 | 463,858 | 7929 | 3,834,458.2 | 2.07 | 1 (Ref.) | 1 (Ref.) | 1 (Ref.) | 1 (Ref.) | |
| <25 | 216,573 | 8598 | 1,775,304.8 | 4.84 | 2.35 (2.28, 2.42) | 1.99 (1.93, 2.05) | 1.91 (1.85, 1.97) | 1.90 (1.85, 1.96) | |
| <30 | 193,705 | 16,195 | 1,557,996.3 | 10.40 | 5.07 (4.93, 5.20) | 3.72 (3.62, 3.82) | 3.38 (3.28, 3.47) | 3.35 (3.26, 3.45) | |
| ≥30 | 25,552 | 4777 | 195,232.5 | 24.47 | 12.09 (11.67, 12.53) | 7.65 (7.37, 7.93) | 6.25 (6.02, 6.48) | 6.18 (5.95, 6.41) | |
| p-value | <0.001 | <0.001 | <0.001 | <0.001 | |||||
| p for trend | <0.001 | <0.001 | <0.001 | <0.001 | |||||
| Post-menopause | <18.5 | 27,247 | 1346 | 211,878.1 | 6.35 | 0.88 (0.83, 0.92) | 0.81 (0.77, 0.86) | 0.87 (0.82, 0.92) | 0.87 (0.83, 0.92) |
| <23 | 425,354 | 24,883 | 3,419,151.6 | 7.28 | 1 (Ref.) | 1 (Ref.) | 1 (Ref.) | 1 (Ref.) | |
| <25 | 317,905 | 29,625 | 2,526,788.6 | 11.72 | 1.61 (1.59, 1.64) | 1.50 (1.48, 1.53) | 1.44 (1.41, 1.46) | 1.43 (1.41, 1.45) | |
| <30 | 379,128 | 54,754 | 2,933,978.5 | 18.66 | 2.57 (2.53, 2.61) | 2.19 (2.16, 2.22) | 2.00 (1.97, 2.03) | 1.99 (1.96, 2.02) | |
| ≥30 | 44,247 | 10,494 | 323,460.4 | 32.44 | 4.48 (4.38, 4.59) | 3.41 (3.34, 3.49) | 2.96 (2.89, 3.02) | 2.94 (2.87, 3.01) | |
| p-value | <0.001 | <0.001 | <0.001 | <0.001 | |||||
| p for trend | <0.001 | <0.001 | <0.001 | <0.001 | |||||
| Waist circumference (cm) | |||||||||
| Pre-menopause | <75 | 478,630 | 8121 | 3,955,873.2 | 2.05 | 0.42 (0.41, 0.43) | 0.50 (0.48, 0.51) | 0.52 (0.50, 0.53) | 0.52 (0.51, 0.54) |
| <80 | 211,629 | 8472 | 1,734,159.5 | 4.89 | 1 (Ref.) | 1 (Ref.) | 1 (Ref.) | 1 (Ref.) | |
| <85 | 135,126 | 8838 | 1,095,861.7 | 8.07 | 1.66 (1.61, 1.71) | 1.49 (1.44, 1.53) | 1.44 (1.39, 1.48) | 1.43 (1.39, 1.47) | |
| <90 | 62,140 | 6116 | 496,785.1 | 12.31 | 2.54 (2.45, 2.62) | 2.09 (2.02, 2.16) | 1.93 (1.87, 2.00) | 1.92 (1.86, 1.98) | |
| <95 | 24,941 | 3445 | 195,616.5 | 17.61 | 3.65 (3.50, 3.79) | 2.80 (2.69, 2.92) | 2.49 (2.39, 2.59) | 2.47 (2.37, 2.57) | |
| ≥95 | 13,730 | 2744 | 104,013.5 | 26.38 | 5.51 (5.28, 5.75) | 3.90 (3.73, 4.07) | 3.27 (3.13, 3.42) | 3.24 (3.10, 3.38) | |
| p-value | <0.001 | <0.001 | <0.001 | <0.001 | |||||
| p for trend | <0.001 | <0.001 | <0.001 | <0.001 | |||||
| Post-menopause | <75 | 330,150 | 15,666 | 2,673,318.7 | 5.86 | 0.59 (0.57, 0.60) | 0.64 (0.63, 0.66) | 0.67 (0.66, 0.69) | 0.67 (0.66, 0.69) |
| <80 | 278,556 | 22,281 | 2,226,416.4 | 10.01 | 1 (Ref.) | 1 (Ref.) | 1 (Ref.) | 1 (Ref.) | |
| <85 | 279,289 | 31,458 | 2,195,118.2 | 14.33 | 1.43 (1.41, 1.46) | 1.33 (1.31, 1.36) | 1.29 (1.27, 1.31) | 1.29 (1.27, 1.31) | |
| <90 | 172,022 | 25,296 | 1,323,517.1 | 19.11 | 1.91 (1.88, 1.95) | 1.67 (1.64, 1.70) | 1.58 (1.55, 1.61) | 1.58 (1.55, 1.61) | |
| <95 | 86,955 | 15,821 | 65,4781.3 | 24.16 | 2.42 (2.38, 2.47) | 1.99 (1.94, 2.03) | 1.84 (1.80, 1.88) | 1.84 (1.80, 1.88) | |
| ≥95 | 46,909 | 10,580 | 342,105.5 | 30.93 | 3.11 (3.04, 3.18) | 2.38 (2.32, 2.44) | 2.15 (2.10, 2.20) | 2.15 (2.10, 2.20) | |
| p-value | <0.001 | <0.001 | <0.001 | <0.001 | |||||
| p for trend | <0.001 | <0.001 | <0.001 | <0.001 | |||||
| Subjects (n) | Events (n) | Duration (Person-Years) | Incidence Rate (per 1000 Person-Years) | HR (95% C.I) | ||||
|---|---|---|---|---|---|---|---|---|
| Body Mass Index | Model 1 | Model 2 | Model 3 | |||||
| Age 40–49 | <18.5 | 25,864 | 228 | 213,778.1 | 1.07 | 0.57 (0.50, 0.65) | 0.64 (0.42, 0.98) | 0.66 (0.43, 1.02) |
| <23 | 426,550 | 6640 | 3,526,027.9 | 1.88 | 1 (Ref.) | 1 (Ref.) | 1 (Ref.) | |
| <25 | 188,091 | 6864 | 1,542,779.7 | 4.45 | 2.37 (2.29, 2.45) | 2.09 (1.86, 2.36) | 1.97 (1.75, 2.22) | |
| <30 | 163,509 | 12,653 | 1,317,875.7 | 9.60 | 5.14 (4.99, 5.29) | 3.54 (3.18, 3.94) | 3.17 (2.85, 3.54) | |
| ≥30 | 21,806 | 3899 | 167,153.0 | 23.33 | 12.67 (12.17, 13.18) | 7.61 (6.54, 8.84) | 6.15 (5.27, 7.17) | |
| p-value | <0.001 | <0.001 | <0.001 | |||||
| p for trend | <0.001 | <0.001 | <0.001 | |||||
| Age 50–59 | <18.5 | 10,953 | 233 | 90,262.1 | 2.58 | 0.56 (0.49, 0.63) | 0.60 (0.52, 0.69) | 0.64 (0.55, 0.73) |
| <23 | 254,769 | 9720 | 2,093,159.6 | 4.64 | 1 (Ref.) | 1 (Ref.) | 1 (Ref.) | |
| <25 | 176,462 | 12,209 | 1,431,781.9 | 8.53 | 1.84 (1.79, 1.89) | 1.64 (1.59, 1.69) | 1.56 (1.52, 1.61) | |
| <30 | 184,147 | 22,235 | 1,457,318.4 | 15.26 | 3.30 (3.22, 3.38) | 2.59 (2.52, 2.66) | 2.35 (2.29, 2.42) | |
| ≥30 | 21,554 | 5025 | 160,396.5 | 31.33 | 6.85 (6.61, 7.08) | 4.57 (4.40, 4.75) | 3.84 (3.69, 4.00) | |
| p-value | <0.001 | <0.001 | <0.001 | |||||
| p for trend | <0.001 | <0.001 | <0.001 | |||||
| Age ≥60 | <18.5 | 16,938 | 1122 | 127,155.6 | 8.82 | 0.88 (0.82, 0.93) | 0.86 (0.81, 0.91) | 0.91 (0.86, 0.97) |
| <23 | 207,893 | 16,452 | 1,634,422.3 | 10.07 | 1 (Ref.) | 1 (Ref.) | 1 (Ref.) | |
| <25 | 169,925 | 19,150 | 1,327,531.8 | 14.43 | 1.43 (1.40, 1.46) | 1.39 (1.36, 1.42) | 1.33 (1.30, 1.36) | |
| <30 | 225,177 | 36,061 | 1,716,780.6 | 21.01 | 2.09 (2.05, 2.13) | 1.91 (1.87, 1.94) | 1.77 (1.74, 1.80) | |
| ≥30 | 26,439 | 6347 | 191,143.4 | 33.21 | 3.31 (3.21, 3.40) | 2.75 (2.67, 2.83) | 2.44 (2.36, 2.51) | |
| p-value | <0.001 | <0.001 | <0.001 | |||||
| p for trend | <0.001 | <0.001 | <0.001 | |||||
| Waist circumference (cm) | ||||||||
| Age 40–49 | <75 | 441,948 | 6887 | 3,652,464.9 | 1.89 | 0.42 (0.40, 0.43) | 0.48 (0.42, 0.54) | 0.50 (0.45, 0.57) |
| <80 | 184,815 | 6849 | 1,515,174.3 | 4.52 | 1 (Ref.) | 1 (Ref.) | 1 (Ref.) | |
| <85 | 114,722 | 6878 | 931,954.0 | 7.38 | 1.64 (1.58, 1.69) | 1.42 (1.26, 1.60) | 1.37 (1.22, 1.55) | |
| <90 | 52,003 | 4792 | 416,527.5 | 11.51 | 2.56 (2.47, 2.66) | 1.93 (1.69, 2.20) | 1.79 (1.57, 2.04) | |
| <95 | 20,804 | 2679 | 163,718.1 | 16.36 | 3.66 (3.50, 3.83) | 2.57 (2.20, 3.01) | 2.29 (1.95, 2.68) | |
| ≥95 | 11,528 | 2199 | 87,775.5 | 25.05 | 5.66 (5.39, 5.94) | 3.48 (2.90, 4.17) | 2.91 (2.42, 3.49) | |
| p-value | <0.001 | <0.001 | <0.001 | |||||
| p for trend | <0.001 | <0.001 | <0.001 | |||||
| Age 50–59 | <75 | 230,613 | 7814 | 1,898,605.6 | 4.12 | 0.53 (0.51, 0.54) | 0.59 (0.58, 0.61) | 0.62 (0.60, 0.64) |
| <80 | 164,648 | 10,467 | 1,338,453.7 | 7.82 | 1 (Ref.) | 1 (Ref.) | 1 (Ref.) | |
| <85 | 134,782 | 12,715 | 1,080,880.5 | 11.76 | 1.51 (1.47, 1.55) | 1.38 (1.34, 1.42) | 1.34 (1.30, 1.38) | |
| <90 | 70,762 | 9377 | 556,687.1 | 16.84 | 2.16 (2.10, 2.23) | 1.86 (1.80, 1.92) | 1.75 (1.69, 1.80) | |
| <95 | 31,062 | 5355 | 239,324.6 | 22.38 | 2.88 (2.79, 2.98) | 2.29 (2.21, 2.38) | 2.10 (2.02, 2.18) | |
| ≥95 | 16,018 | 3694 | 118,967.1 | 31.05 | 4.02 (3.87, 4.17) | 2.93 (2.81, 3.05) | 2.57 (2.47, 2.68) | |
| p-value | <0.001 | <0.001 | <0.001 | |||||
| p for trend | <0.001 | <0.001 | <0.001 | |||||
| Age ≥60 | <75 | 136,219 | 9086 | 1,078,121.3 | 8.43 | 0.69 (0.68, 0.71) | 0.72 (0.70, 0.74) | 0.75 (0.73, 0.77) |
| <80 | 140,722 | 13,437 | 1,106,947.8 | 12.14 | 1 (Ref.) | 1 (Ref.) | 1 (Ref.) | |
| <85 | 164,911 | 20,703 | 1,278,145.4 | 16.20 | 1.34 (1.31, 1.36) | 1.28 (1.26, 1.31) | 1.25 (1.22, 1.28) | |
| <90 | 111,397 | 17,243 | 847,087.6 | 20.36 | 1.68 (1.64, 1.72) | 1.55 (1.52, 1.59) | 1.48 (1.45, 1.52) | |
| <95 | 60,030 | 11,232 | 447,355.1 | 25.11 | 2.07 (2.02, 2.12) | 1.83 (1.79, 1.88) | 1.72 (1.68, 1.76) | |
| ≥95 | 33,093 | 7431 | 239,376.5 | 31.04 | 2.56 (2.49, 2.64) | 2.15 (2.09, 2.21) | 1.98 (1.92, 2.04) | |
| p-value | <0.001 | <0.001 | <0.001 | |||||
| p for trend | <0.001 | <0.001 | <0.001 | |||||
| Subjects (n) | Events (n) | Duration (Person-Years) | Incidence Rate (per 1000 Person-Years) | HR (95% C.I) | |||||
|---|---|---|---|---|---|---|---|---|---|
| Model 1 | Model 2 | Model 3 | Model 4 | ||||||
| Body mass index | |||||||||
| Pre Menopause | <18.5 | 8361 | 111 | 69,224.9 | 1.60 | 0.56 (0.46, 0.67) | 0.60 (0.50, 0.73) | 0.62 (0.52, 0.75) | 0.63 (0.52, 0.76) |
| <23 | 200,973 | 4779 | 1,661,144.1 | 2.88 | 1 (Ref.) | 1 (Ref.) | 1 (Ref.) | 1 (Ref.) | |
| <25 | 109,860 | 5289 | 899,213.0 | 5.88 | 2.05 (1.97, 2.13) | 1.84 (1.77, 1.92) | 1.76 (1.69, 1.83) | 1.75 (1.68, 1.82) | |
| <30 | 101,199 | 9821 | 810,970.4 | 12.11 | 4.24 (4.10, 4.39) | 3.37 (3.25, 3.49) | 3.04 (2.93, 3.14) | 3.01 (2.90, 3.12) | |
| ≥30 | 12,212 | 2592 | 92,367.6 | 28.06 | 9.97 (9.50, 10.46) | 6.75 (6.43, 7.08) | 5.44 (5.18, 5.72) | 5.37 (5.11, 5.65) | |
| p for trend | <0.001 | <0.001 | <0.001 | <0.001 | |||||
| Post Menopause | <18.5 | 4931 | 84 | 40,632.6 | 2.07 | 0.55 (0.44, 0.68) | 0.57 (0.46, 0.71) | 0.60 (0.48, 0.74) | 0.60 (0.49, 0.75) |
| <23 | 93,942 | 2906 | 773,287.6 | 3.76 | 1 (Ref.) | 1 (Ref.) | 1 (Ref.) | 1 (Ref.) | |
| <25 | 53,503 | 3302 | 434,935.5 | 7.59 | 2.03 (1.93, 2.13) | 1.83 (1.74, 1.92) | 1.74 (1.66, 1.83) | 1.74 (1.65, 1.83) | |
| <30 | 49,486 | 5362 | 393,467.8 | 13.63 | 3.65 (3.49, 3.82) | 2.98 (2.85, 3.12) | 2.69 (2.57, 2.81) | 2.68 (2.56, 2.81) | |
| ≥30 | 5582 | 1230 | 41,681.2 | 29.51 | 7.98 (7.46, 8.53) | 5.61 (5.24, 6.00) | 4.57 (4.27, 4.90) | 4.57 (4.26, 4.89) | |
| p for trend | <0.001 | <0.001 | <0.001 | <0.001 | |||||
| p for interaction (menopause vs. BMI) | <0.001 | <0.001 | <0.001 | ||||||
| Waist circumference (cm) | |||||||||
| Pre Menopause | <75 | 203,936 | 4728 | 1,685,743.7 | 2.81 | 0.47 (0.45, 0.48) | 0.52 (0.50, 0.54) | 0.55 (0.53, 0.57) | 0.55 (0.53, 0.57) |
| <80 | 106,004 | 5220 | 867,130.1 | 6.02 | 1 (Ref.) | 1 (Ref.) | 1 (Ref.) | 1 (Ref.) | |
| <85 | 70,574 | 5406 | 570,947.6 | 9.47 | 1.58 (1.52, 1.64) | 1.46 (1.40, 1.51) | 1.40 (1.35, 1.46) | 1.40 (1.34, 1.45) | |
| <90 | 32,471 | 3733 | 258,162.9 | 14.46 | 2.42 (2.32, 2.52) | 2.07 (1.98, 2.15) | 1.90 (1.82, 1.98) | 1.89 (1.81, 1.97) | |
| <95 | 13,010 | 2033 | 101,274.9 | 20.07 | 3.37 (3.21, 3.55) | 2.66 (2.53, 2.81) | 2.36 (2.24, 2.49) | 2.34 (2.22, 2.47) | |
| ≥95 | 6610 | 1472 | 49,660.8 | 29.64 | 5.02 (4.74, 5.32) | 3.65 (3.44, 3.87) | 3.05 (2.87, 3.23) | 3.02 (2.85, 3.20) | |
| p for trend | <0.001 | <0.001 | <0.001 | <0.001 | |||||
| Post Menopause | <75 | 88,958 | 2516 | 732,961.0 | 3.43 | 0.49 (0.47, 0.52) | 0.54 (0.52, 0.57) | 0.57 (0.54, 0.60) | 0.57 (0.54, 0.60) |
| <80 | 51,470 | 2917 | 419,250.9 | 6.96 | 1 (Ref.) | 1 (Ref.) | 1 (Ref.) | 1 (Ref.) | |
| <85 | 37,343 | 3128 | 300,501.7 | 10.41 | 1.50 (1.43, 1.58) | 1.40 (1.33, 1.48) | 1.35 (1.29, 1.43) | 1.36 (1.29, 1.43) | |
| <90 | 18,178 | 2226 | 143,549.5 | 15.51 | 2.24 (2.12, 2.37) | 1.92 (1.82, 2.03) | 1.79 (1.69, 1.89) | 1.79 (1.69, 1.89) | |
| <95 | 7610 | 1267 | 58,641.4 | 21.61 | 3.13 (2.93, 3.35) | 2.54 (2.38, 2.71) | 2.28 (2.14, 2.44) | 2.28 (2.13, 2.44) | |
| ≥95 | 3885 | 830 | 29,100.3 | 28.52 | 4.16 (3.85, 4.49) | 3.12 (2.88, 3.37) | 2.66 (2.46, 2.87) | 2.65 (2.45, 2.87) | |
| p for trend | <0.001 | <0.001 | <0.001 | <0.001 | |||||
| p for interaction (menopause vs. WC) | <0.001 | <0.001 | <0.001 | ||||||
Publisher’s Note: MDPI stays neutral with regard to jurisdictional claims in published maps and institutional affiliations. |
© 2021 by the authors. Licensee MDPI, Basel, Switzerland. This article is an open access article distributed under the terms and conditions of the Creative Commons Attribution (CC BY) license (https://creativecommons.org/licenses/by/4.0/).
Share and Cite
Lee, H.R.; Shin, J.; Han, K.; Chang, J.; Jeong, S.-M.; Chon, S.J.; Choi, S.J.; Shin, D.W. Obesity and Risk of Diabetes Mellitus by Menopausal Status: A Nationwide Cohort Study. J. Clin. Med. 2021, 10, 5189. https://doi.org/10.3390/jcm10215189
Lee HR, Shin J, Han K, Chang J, Jeong S-M, Chon SJ, Choi SJ, Shin DW. Obesity and Risk of Diabetes Mellitus by Menopausal Status: A Nationwide Cohort Study. Journal of Clinical Medicine. 2021; 10(21):5189. https://doi.org/10.3390/jcm10215189
Chicago/Turabian StyleLee, Han Rim, Jungeun Shin, Kyungdo Han, Jiwon Chang, Su-Min Jeong, Seung Joo Chon, Soo Jung Choi, and Dong Wook Shin. 2021. "Obesity and Risk of Diabetes Mellitus by Menopausal Status: A Nationwide Cohort Study" Journal of Clinical Medicine 10, no. 21: 5189. https://doi.org/10.3390/jcm10215189