Separation of Carbon Dioxide from Real Power Plant Flue Gases by Gas Permeation Using a Supported Ionic Liquid Membrane: An Investigation of Membrane Stability

 ,
,
Abstract
:1. Introduction
2. Materials and Methods
2.1. Membrane Materials
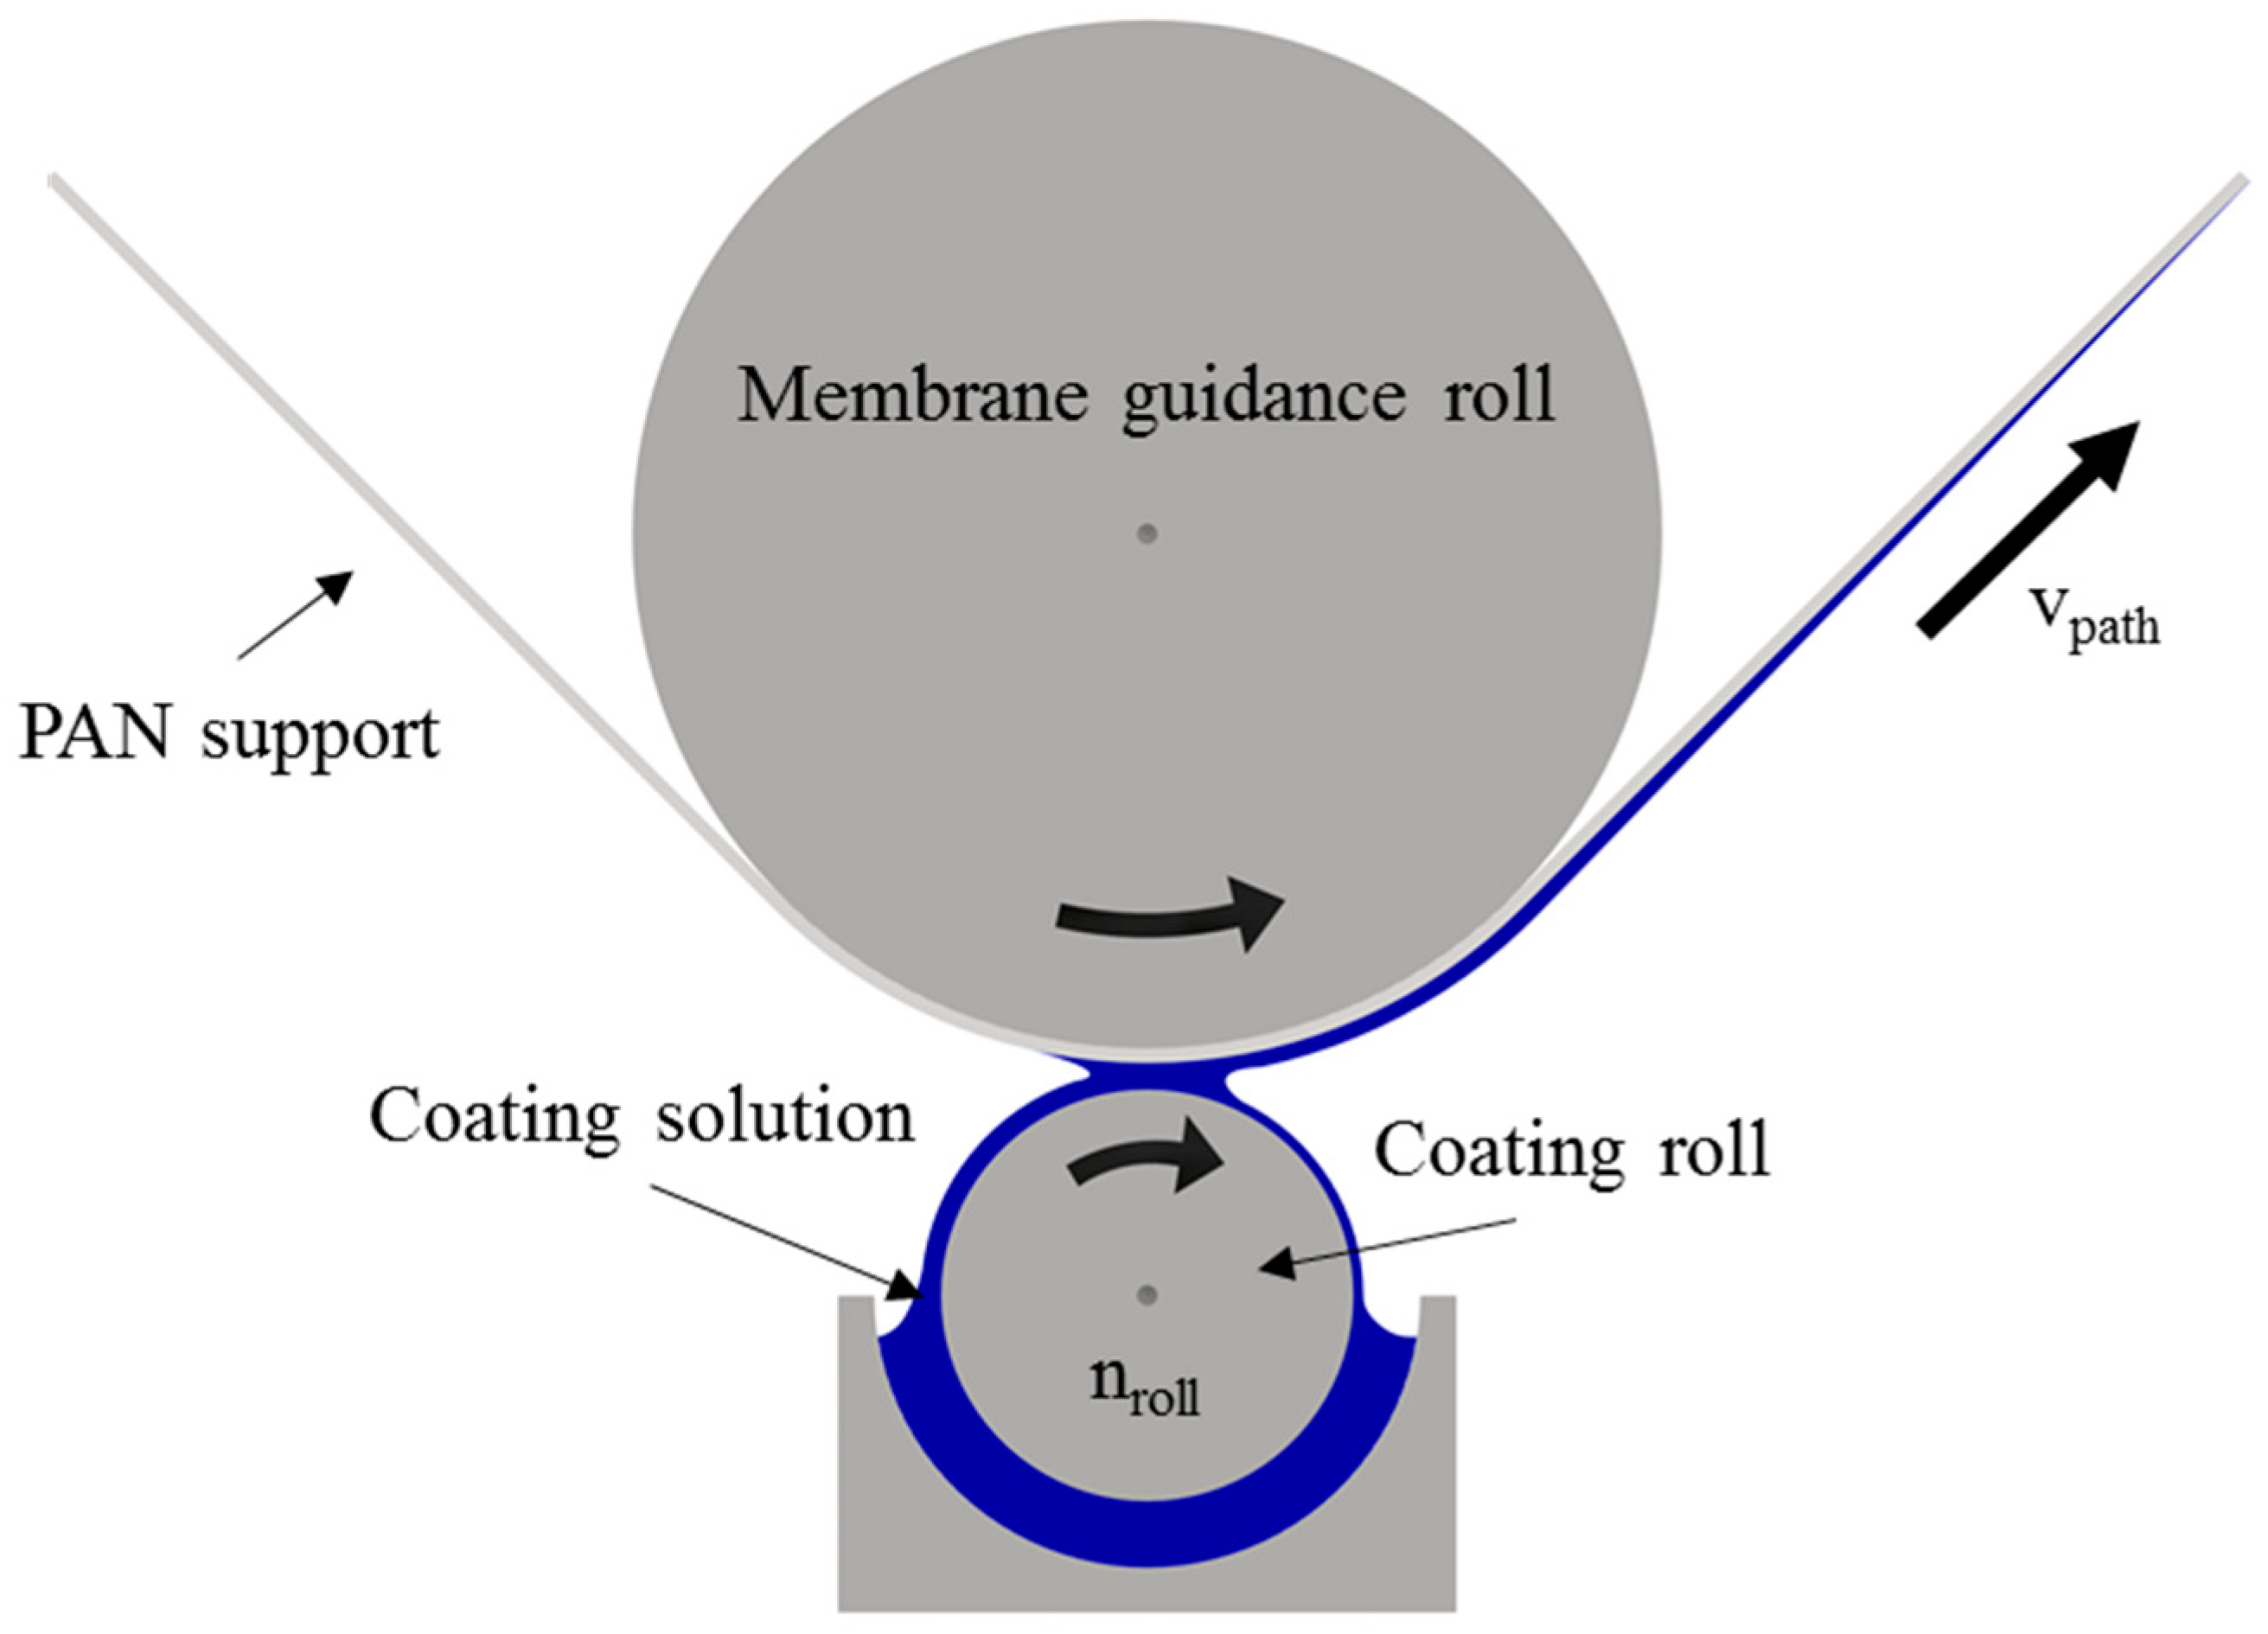
2.2. Supported Ionic Liquid Membrane Preparation
2.3. Water Permeance Measurements
2.4. Determination of Single Gas Permeances and Selectivities
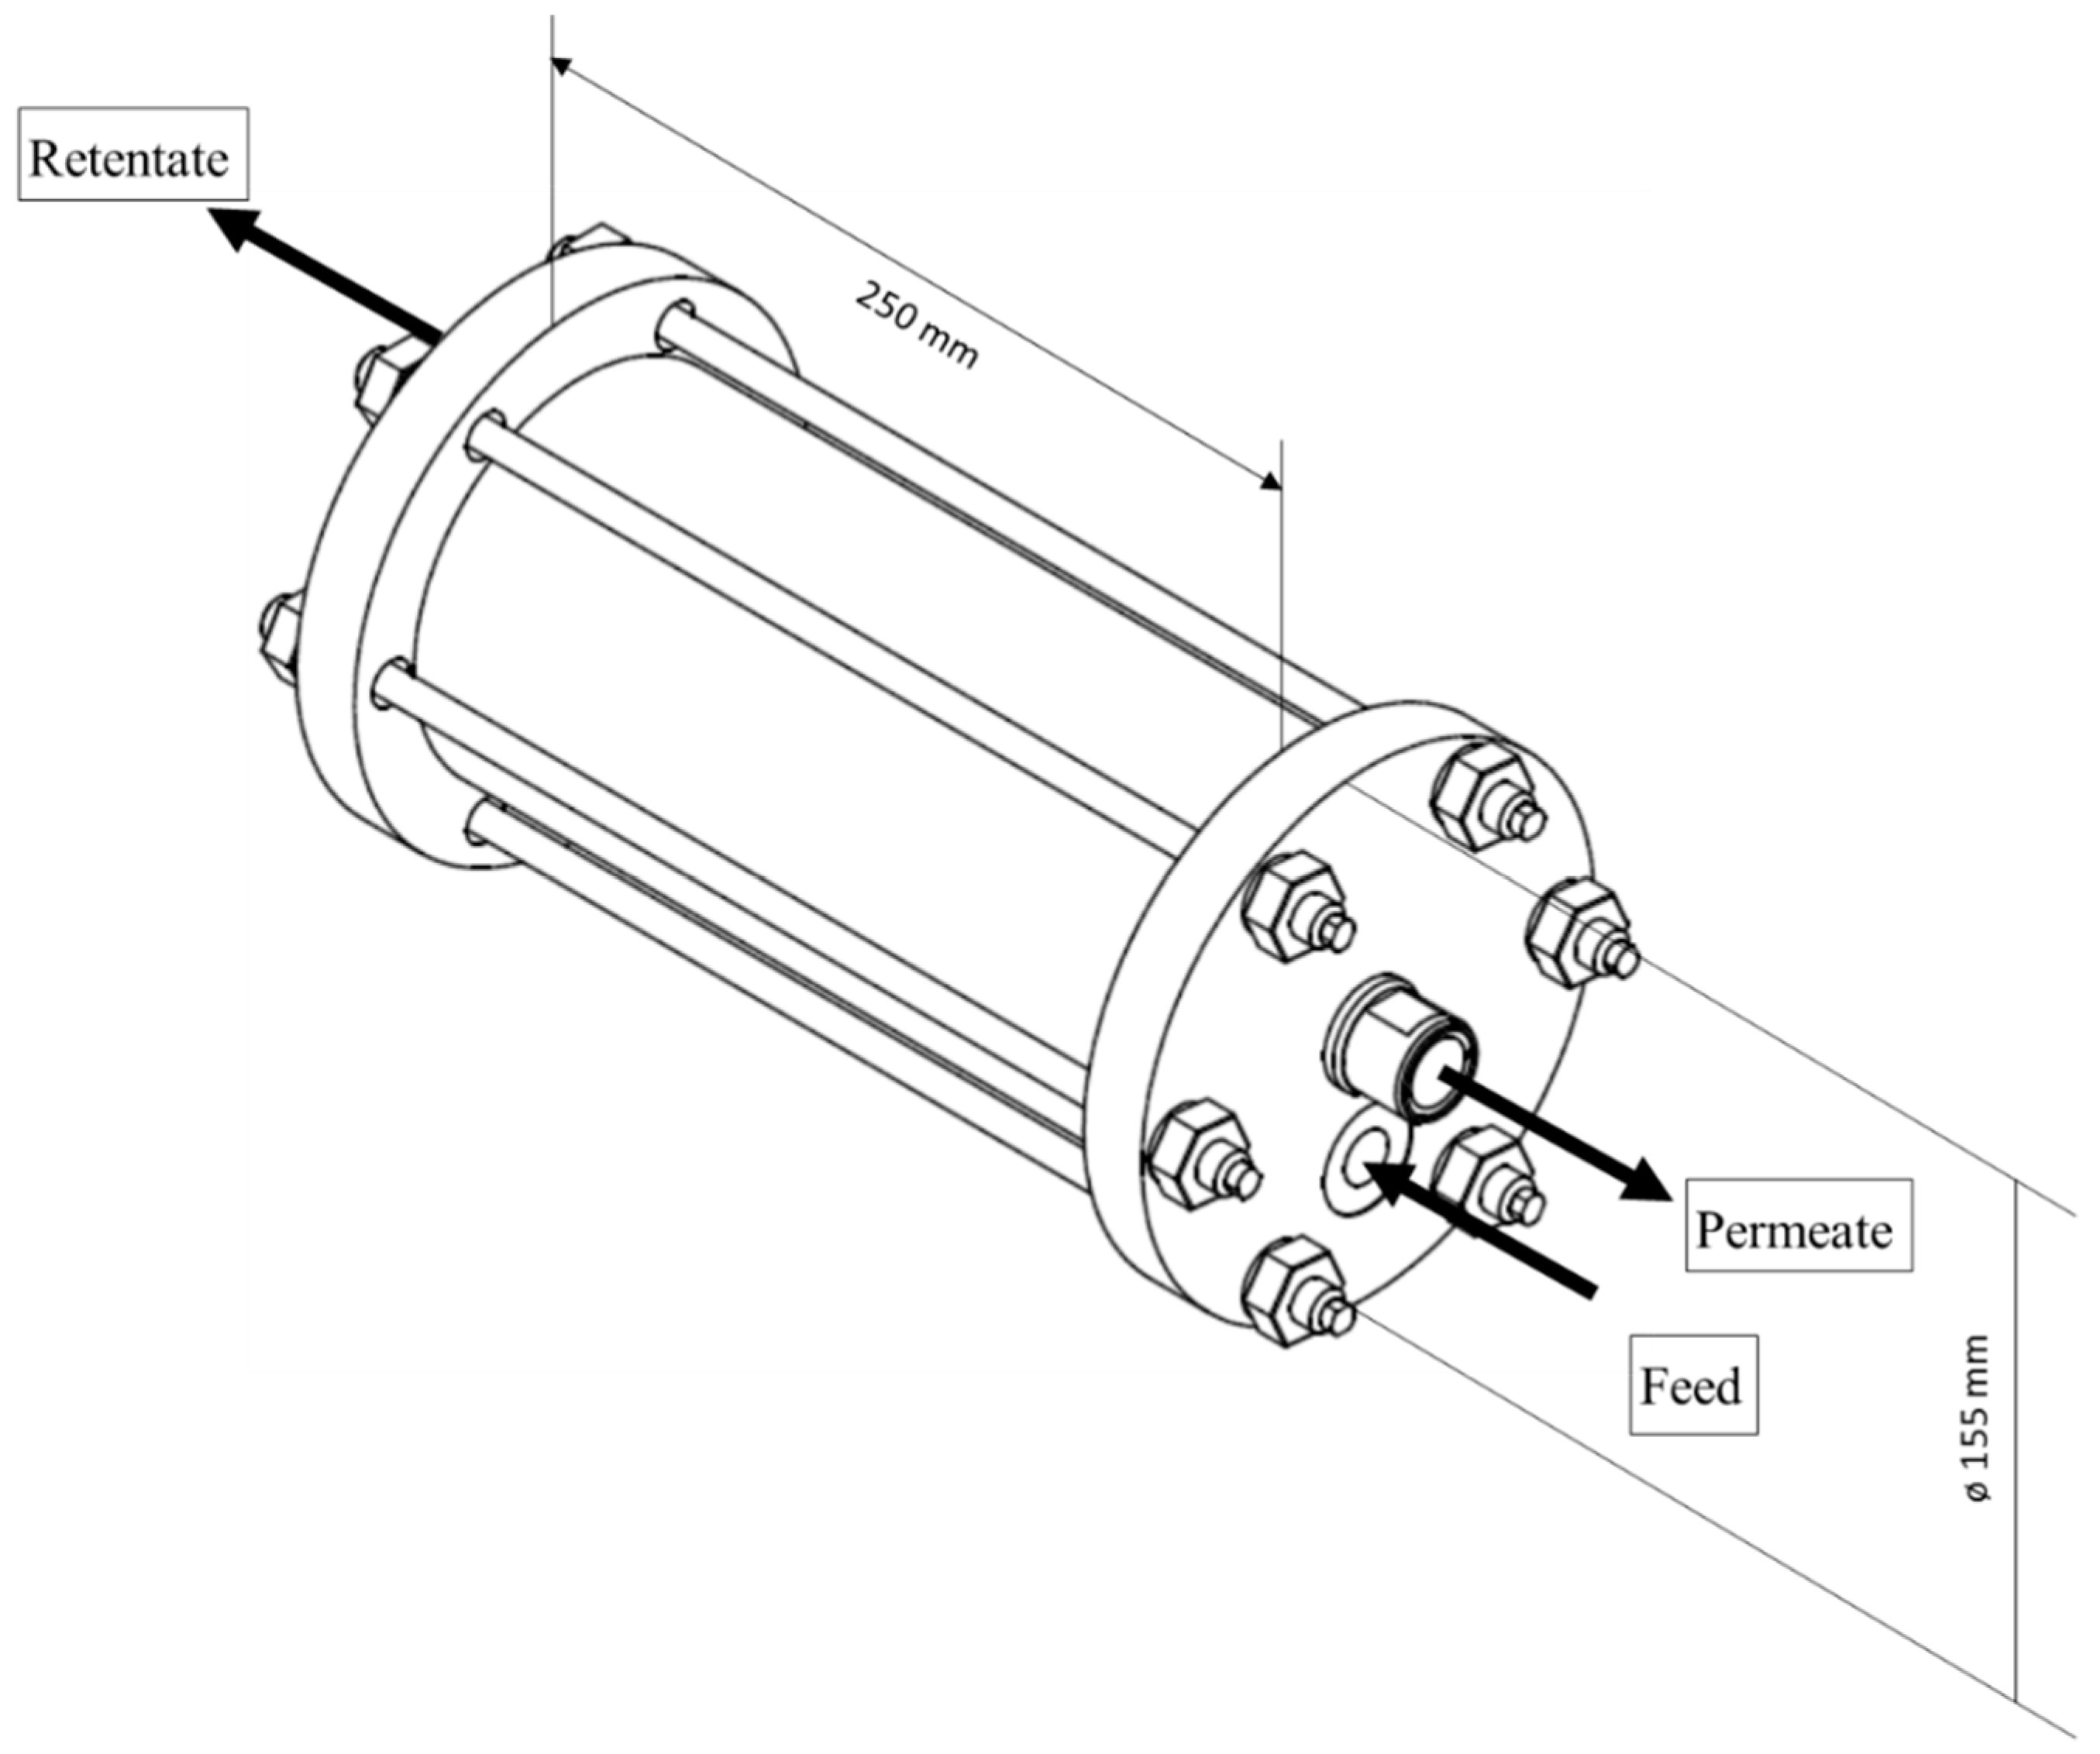
2.5. Membrane Envelope Preparation and Testing
2.6. Module Preparation and Testing
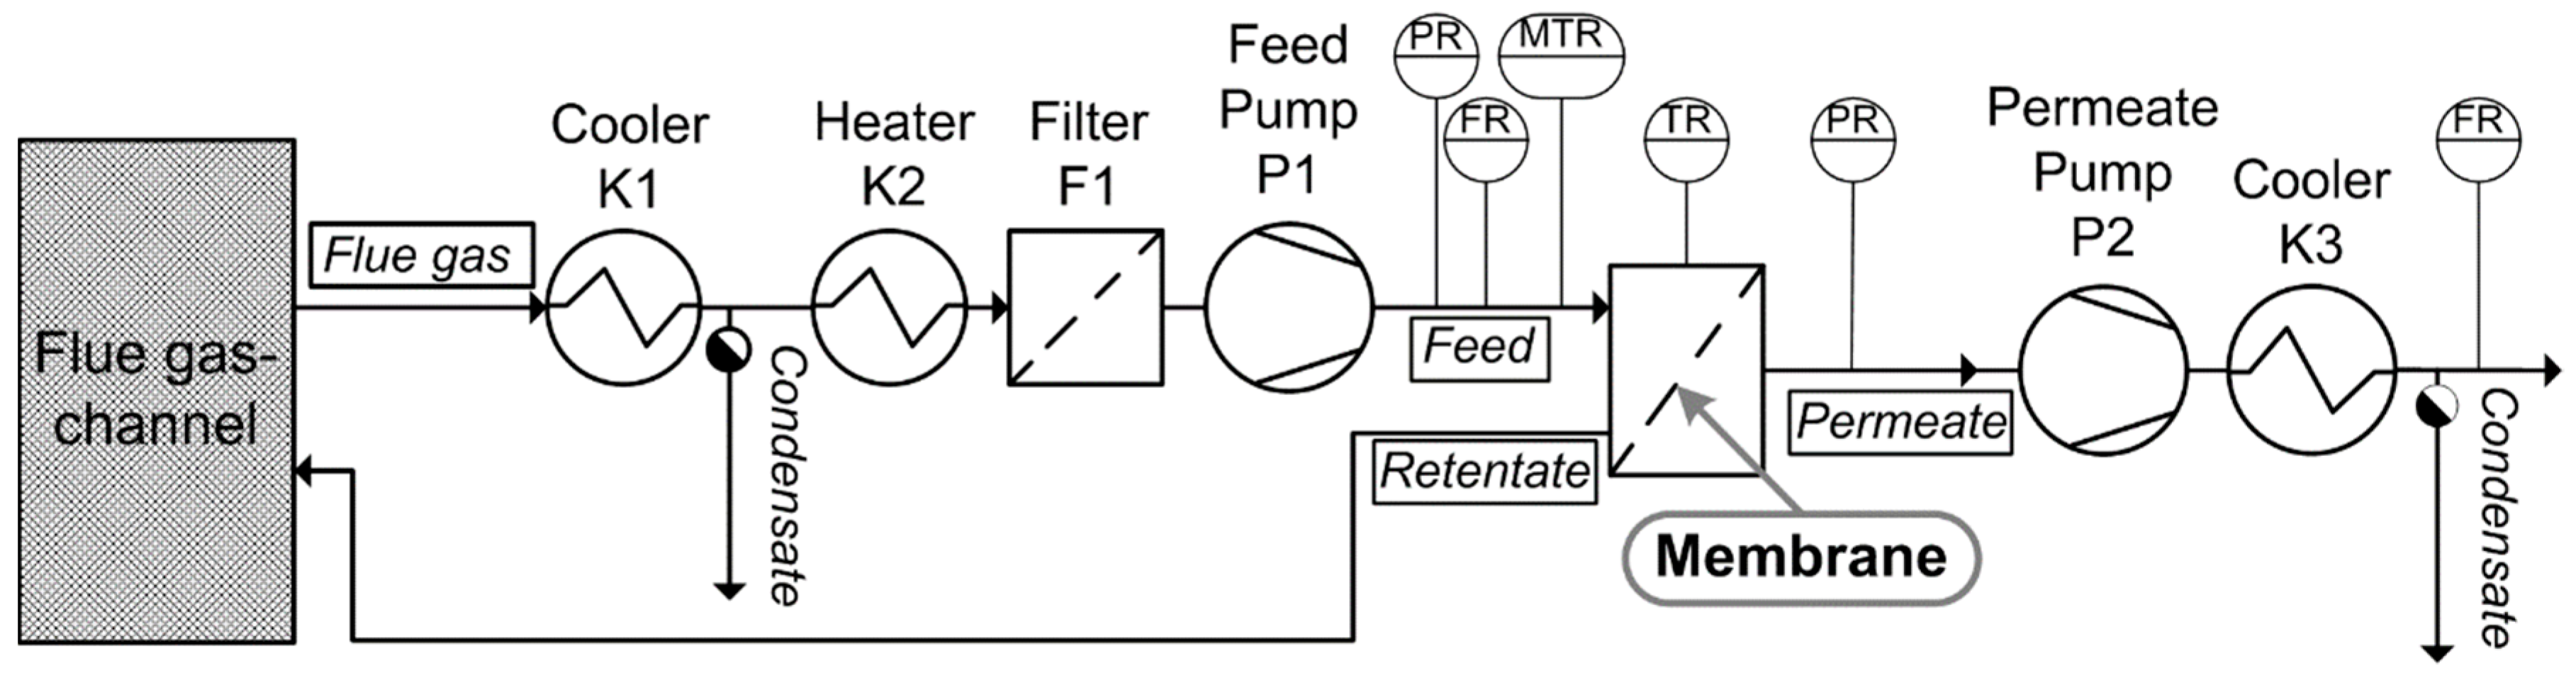
2.7. Investigation of SILM Stability during Real Power Plant Flue Gas Operation
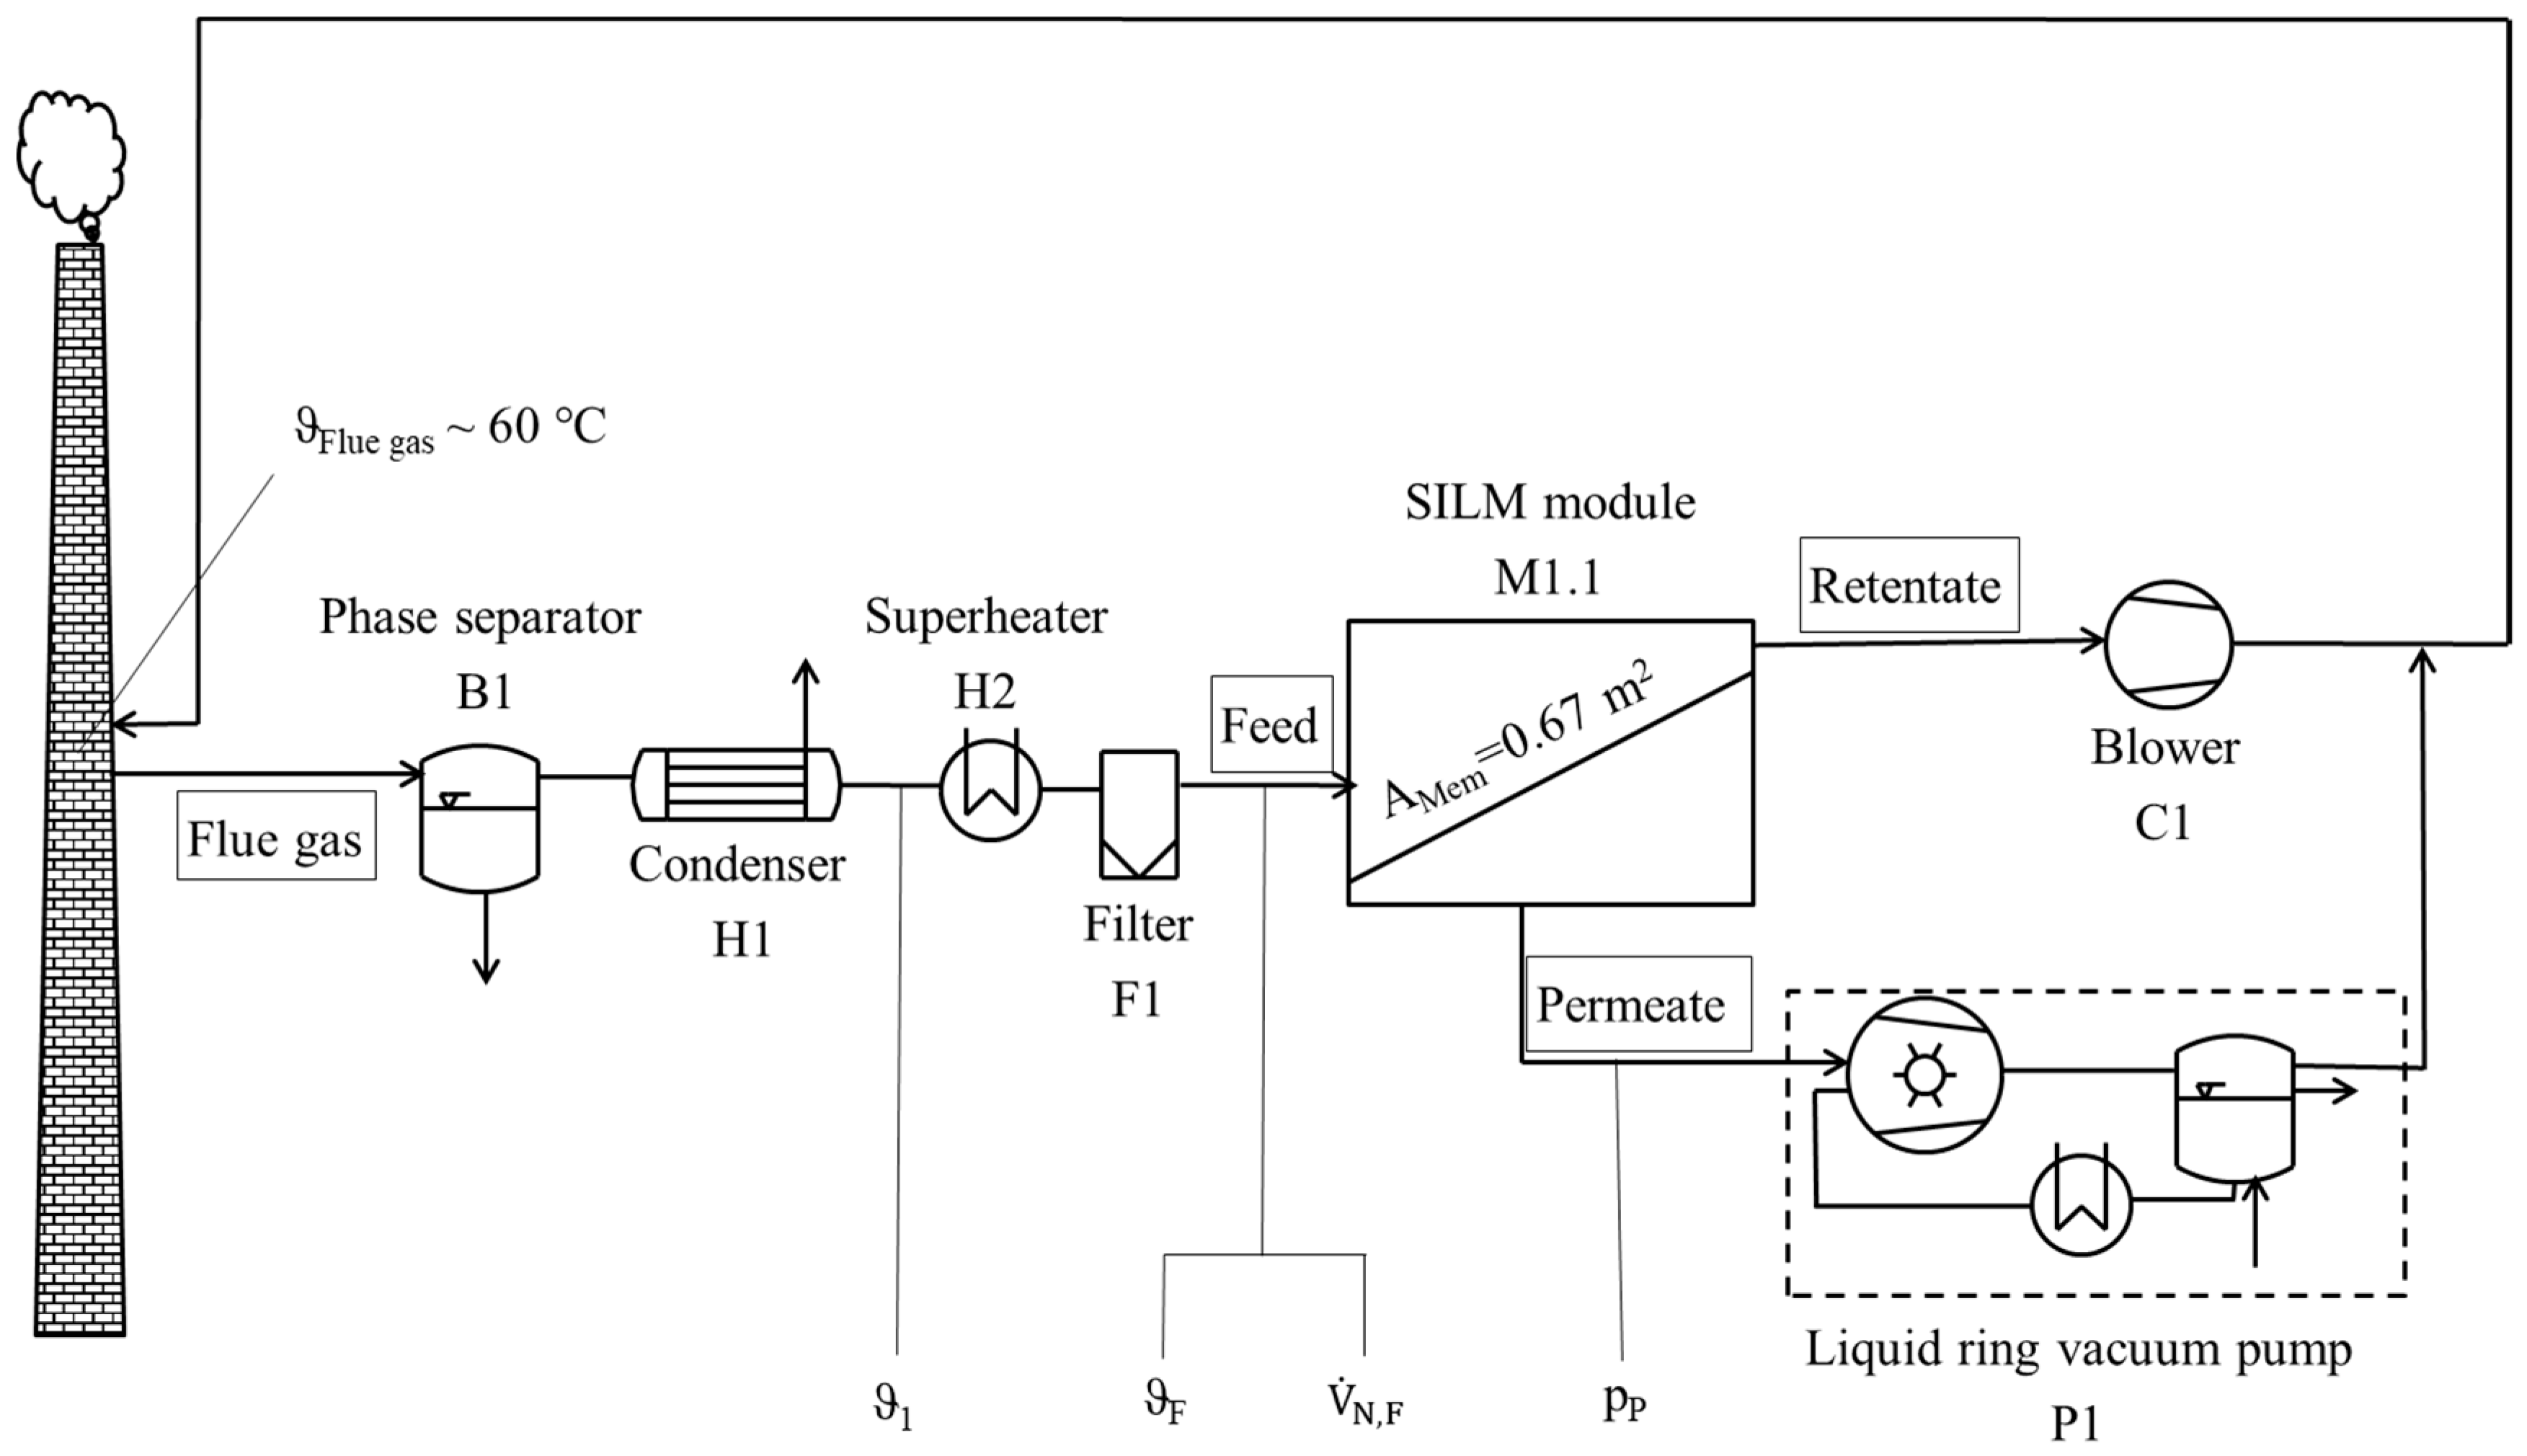
2.7.1. Gas Permeation Test Unit at Lignite-Fired Power Plant
2.7.2. Gas Permeation Pilot Plant at Hard Coal-fired Power Plant
2.8. Process Simulation
3. Results and Discussion
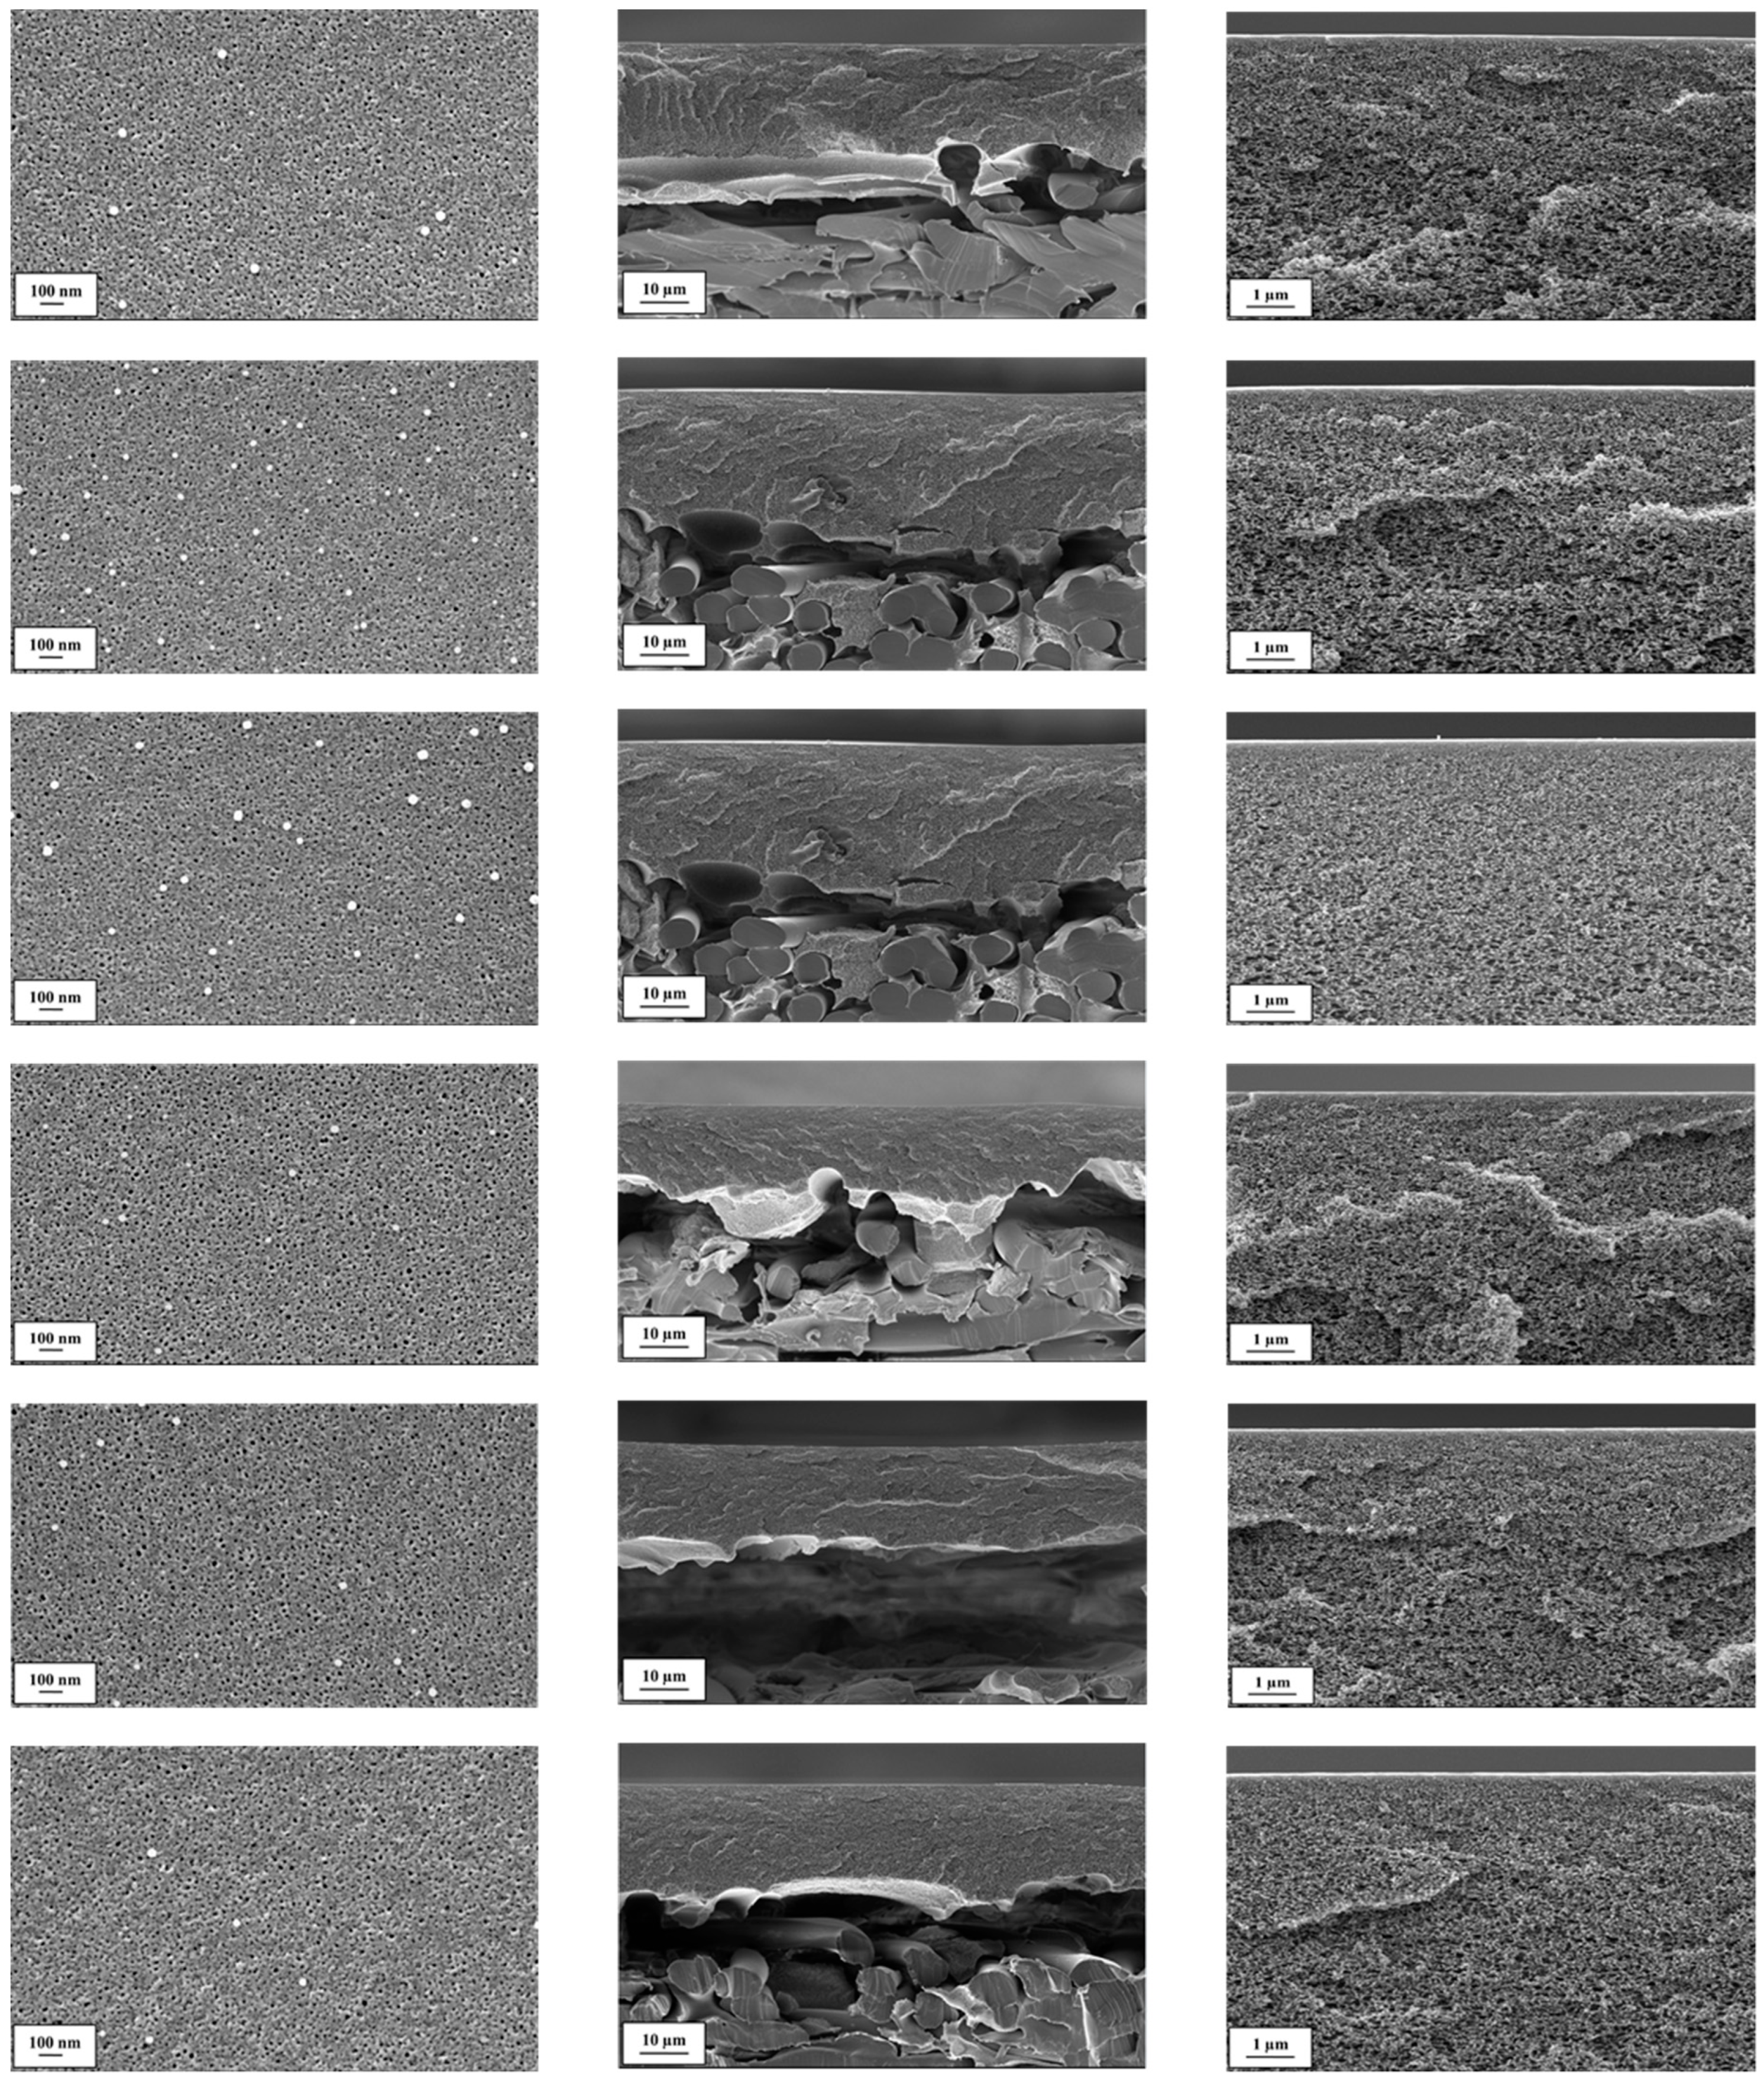
3.1. Investigation of PAN Supports and Coating Solution Influence on SILM Quality
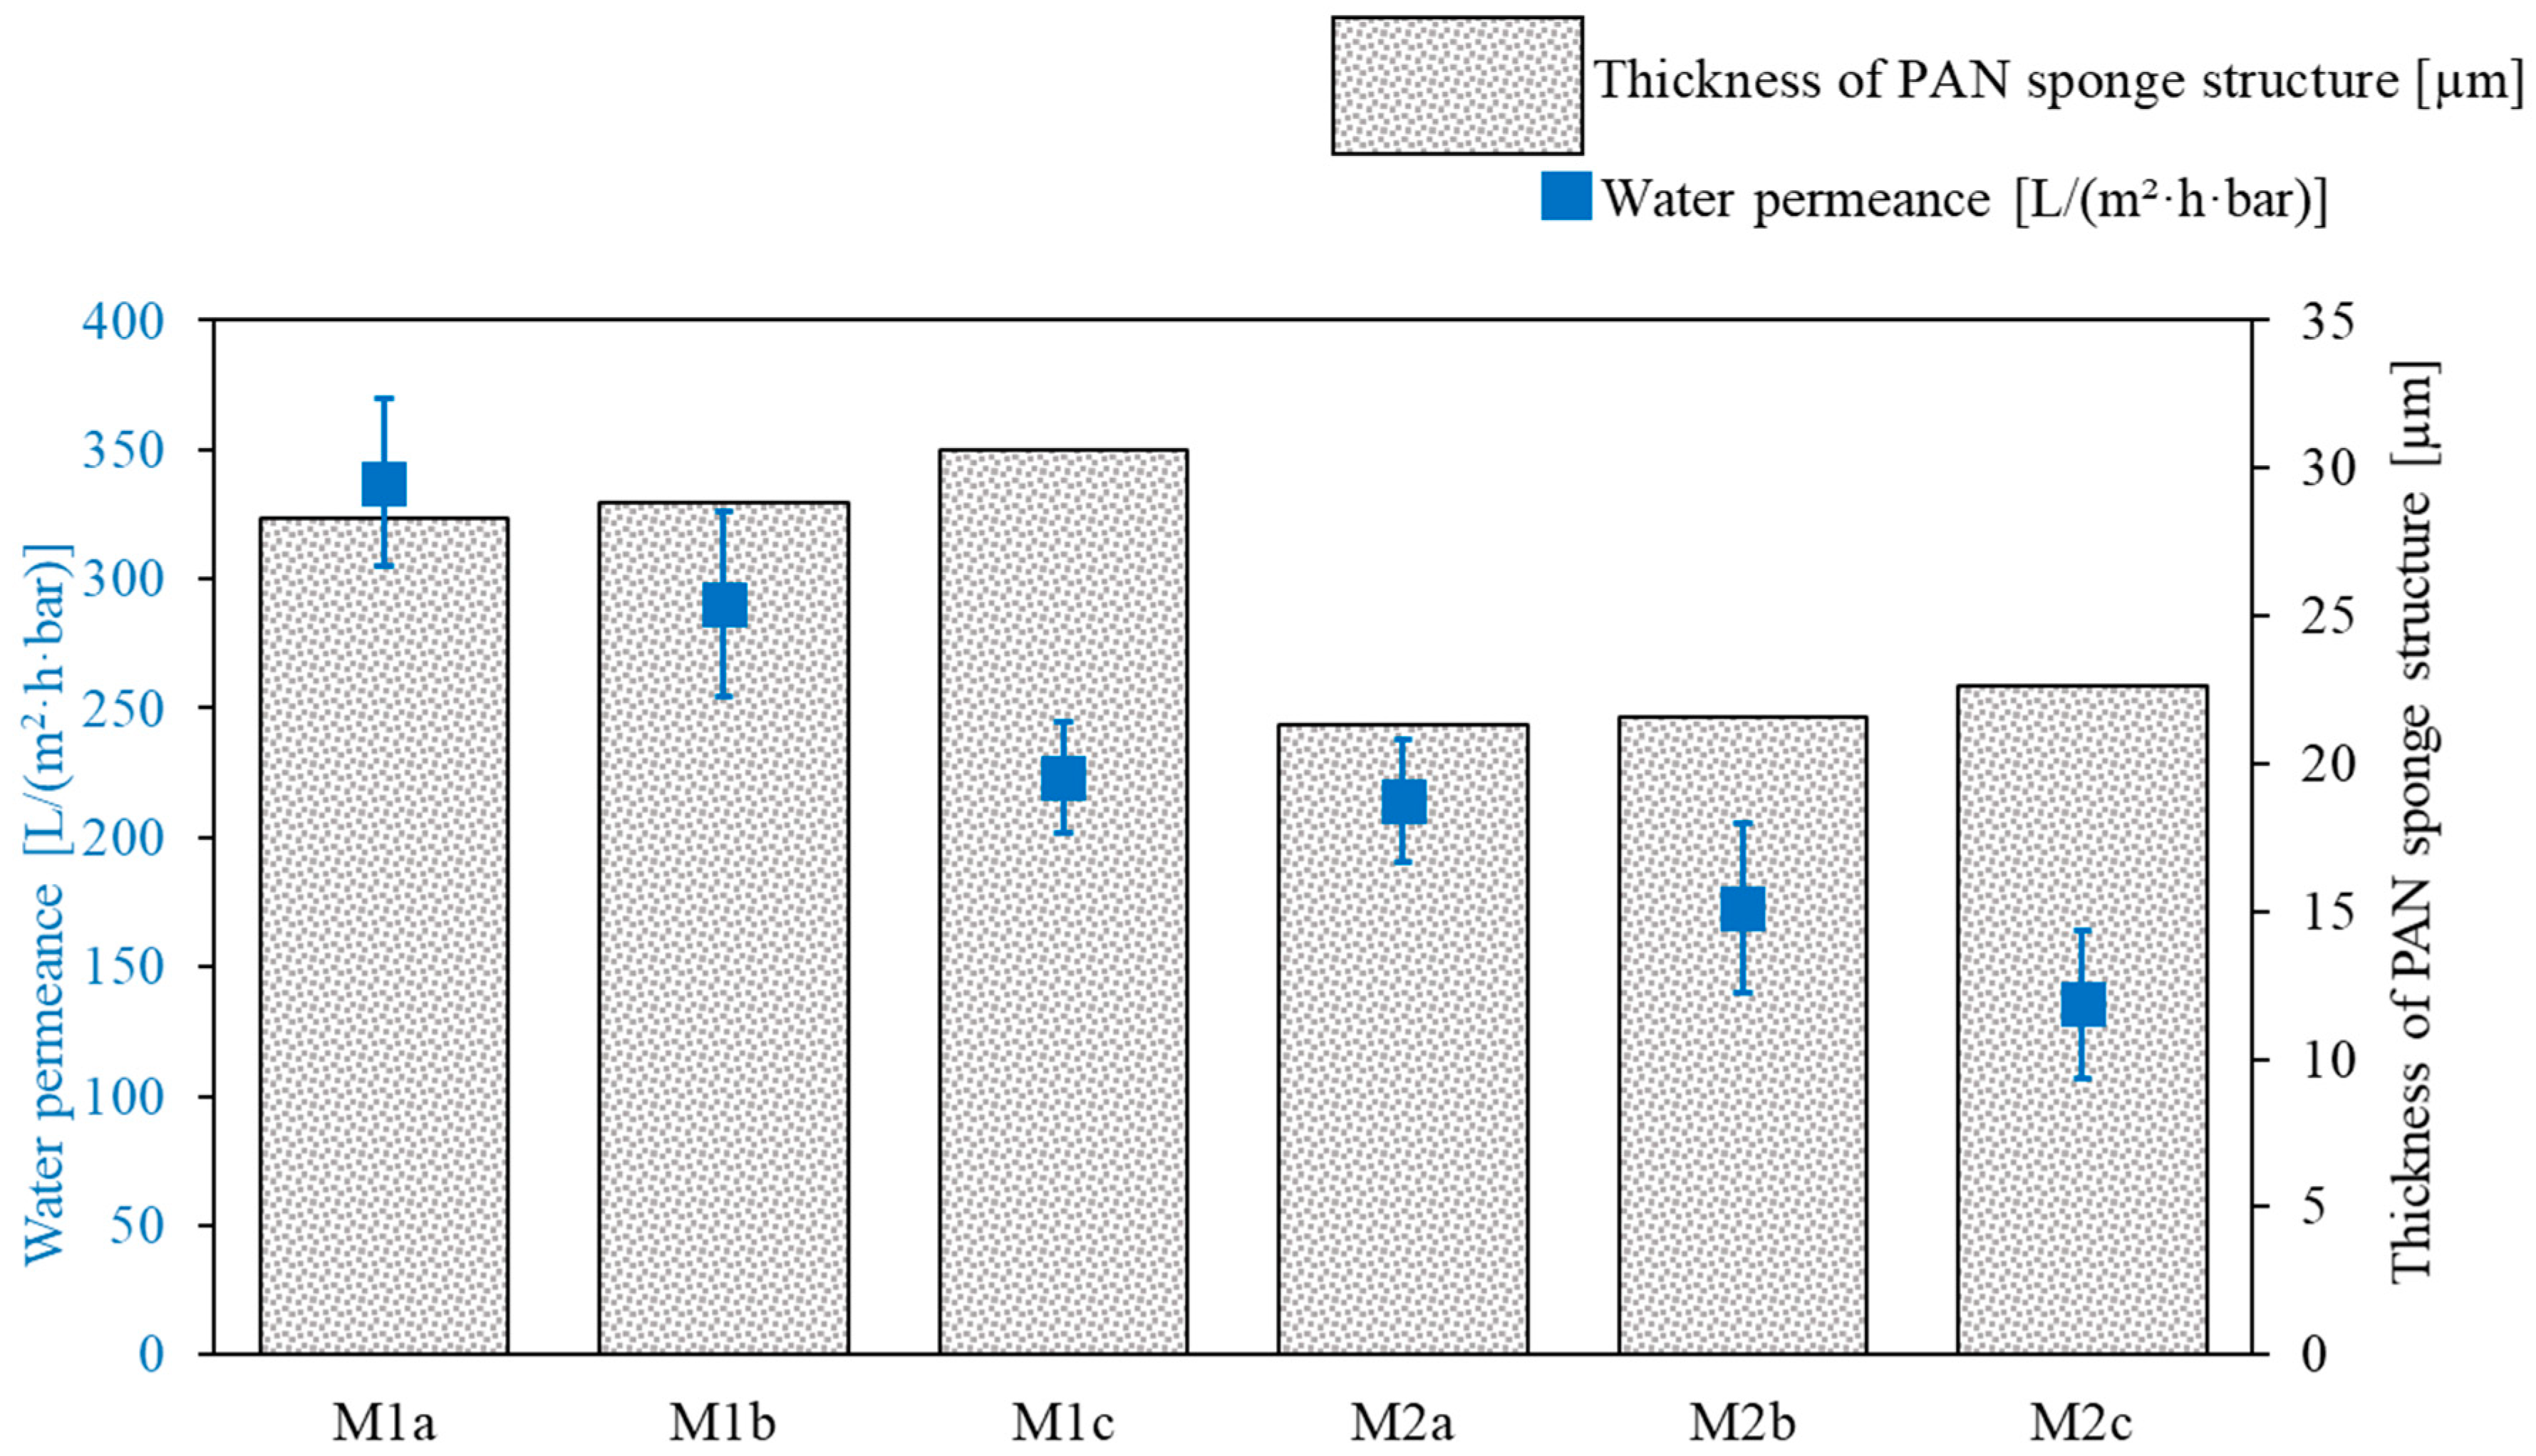
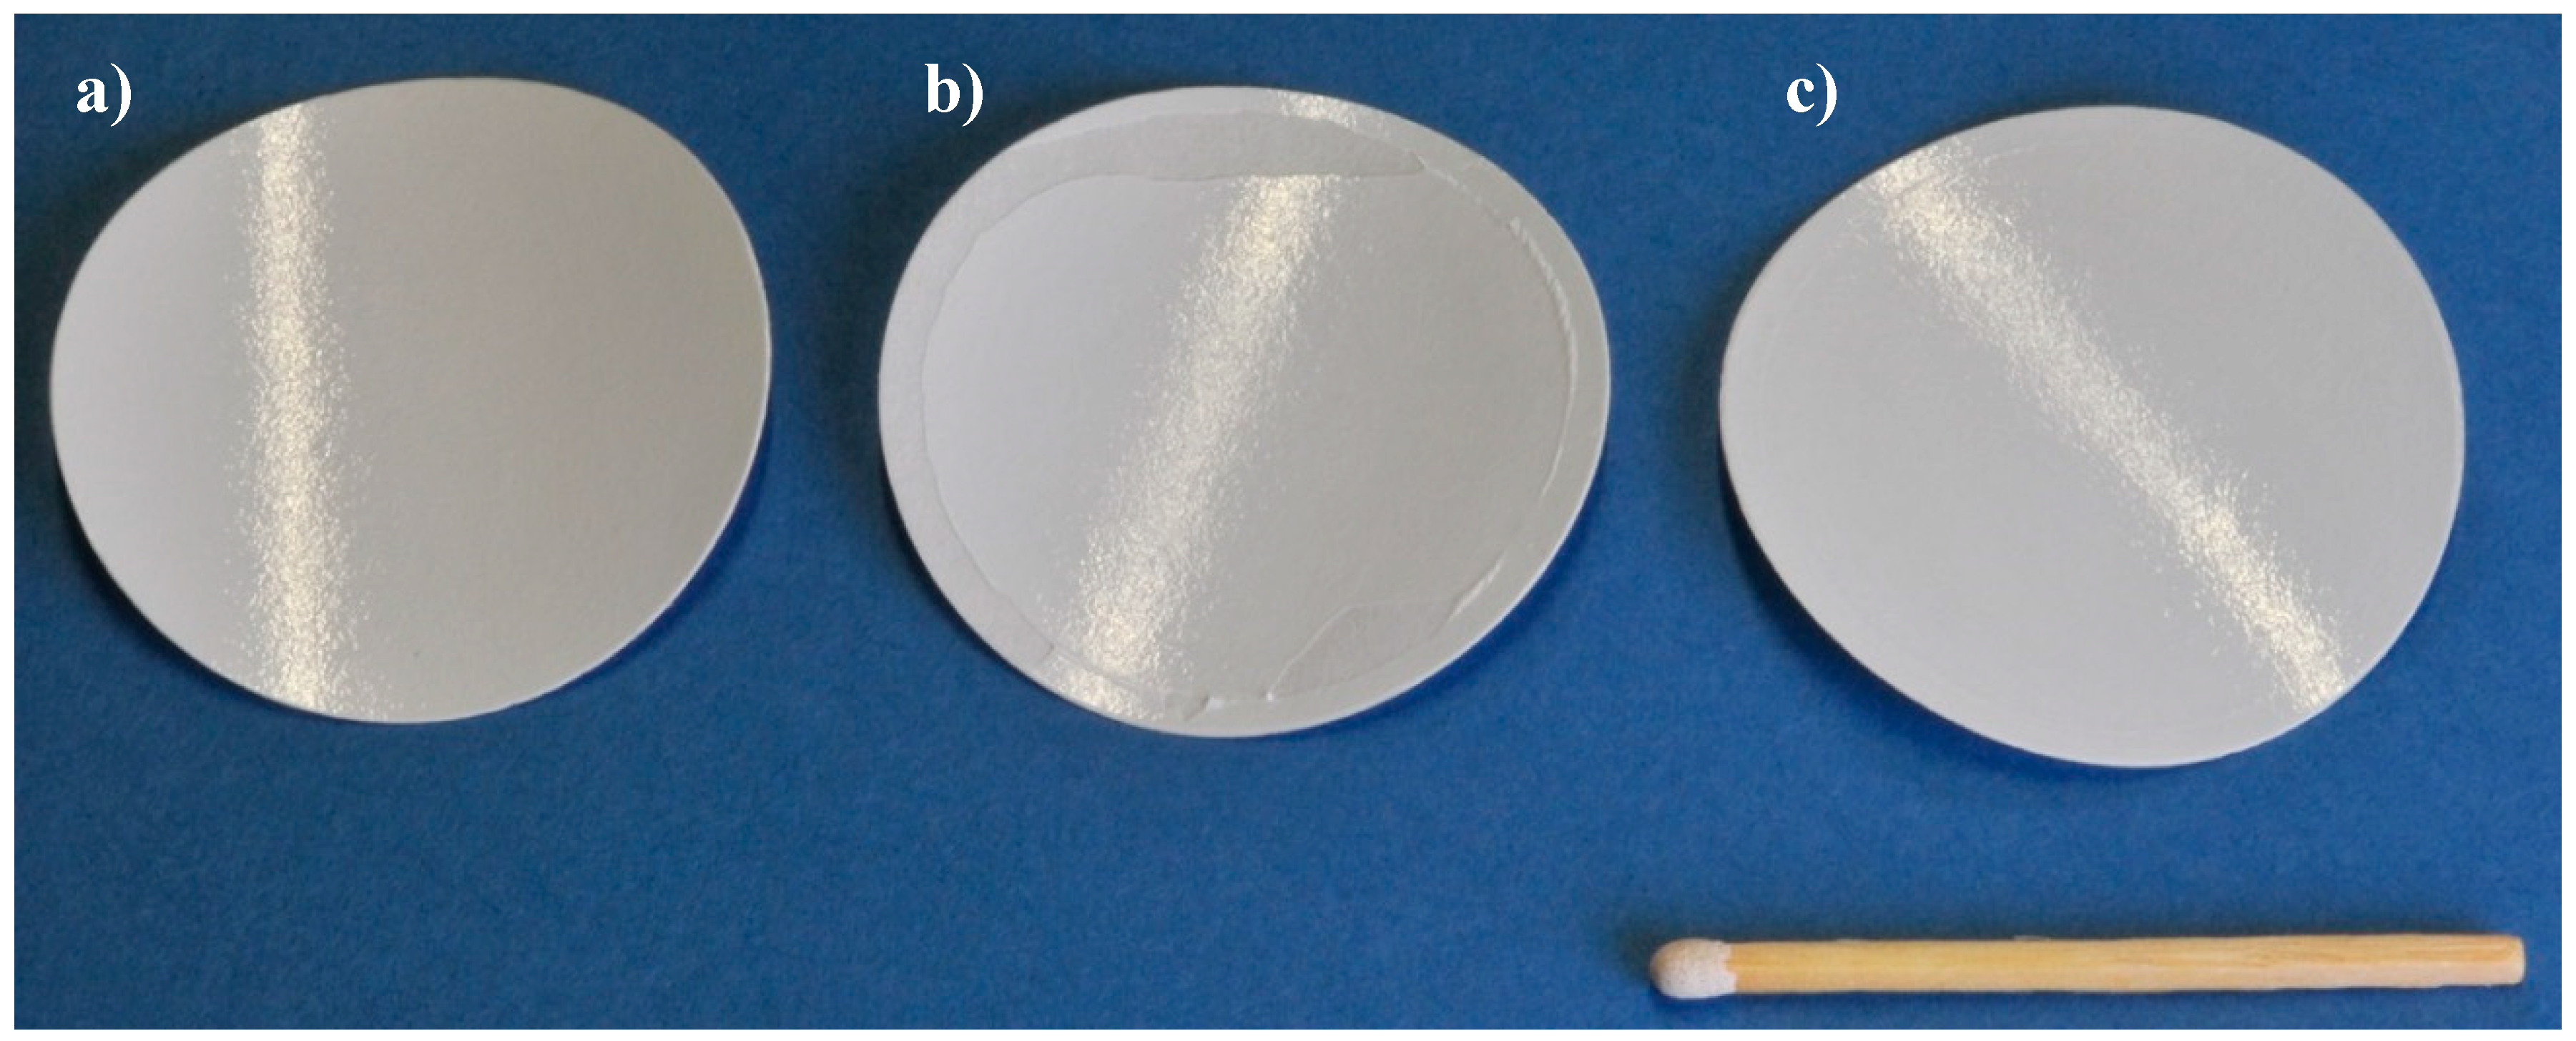
3.1.1. PAN Support Investigation
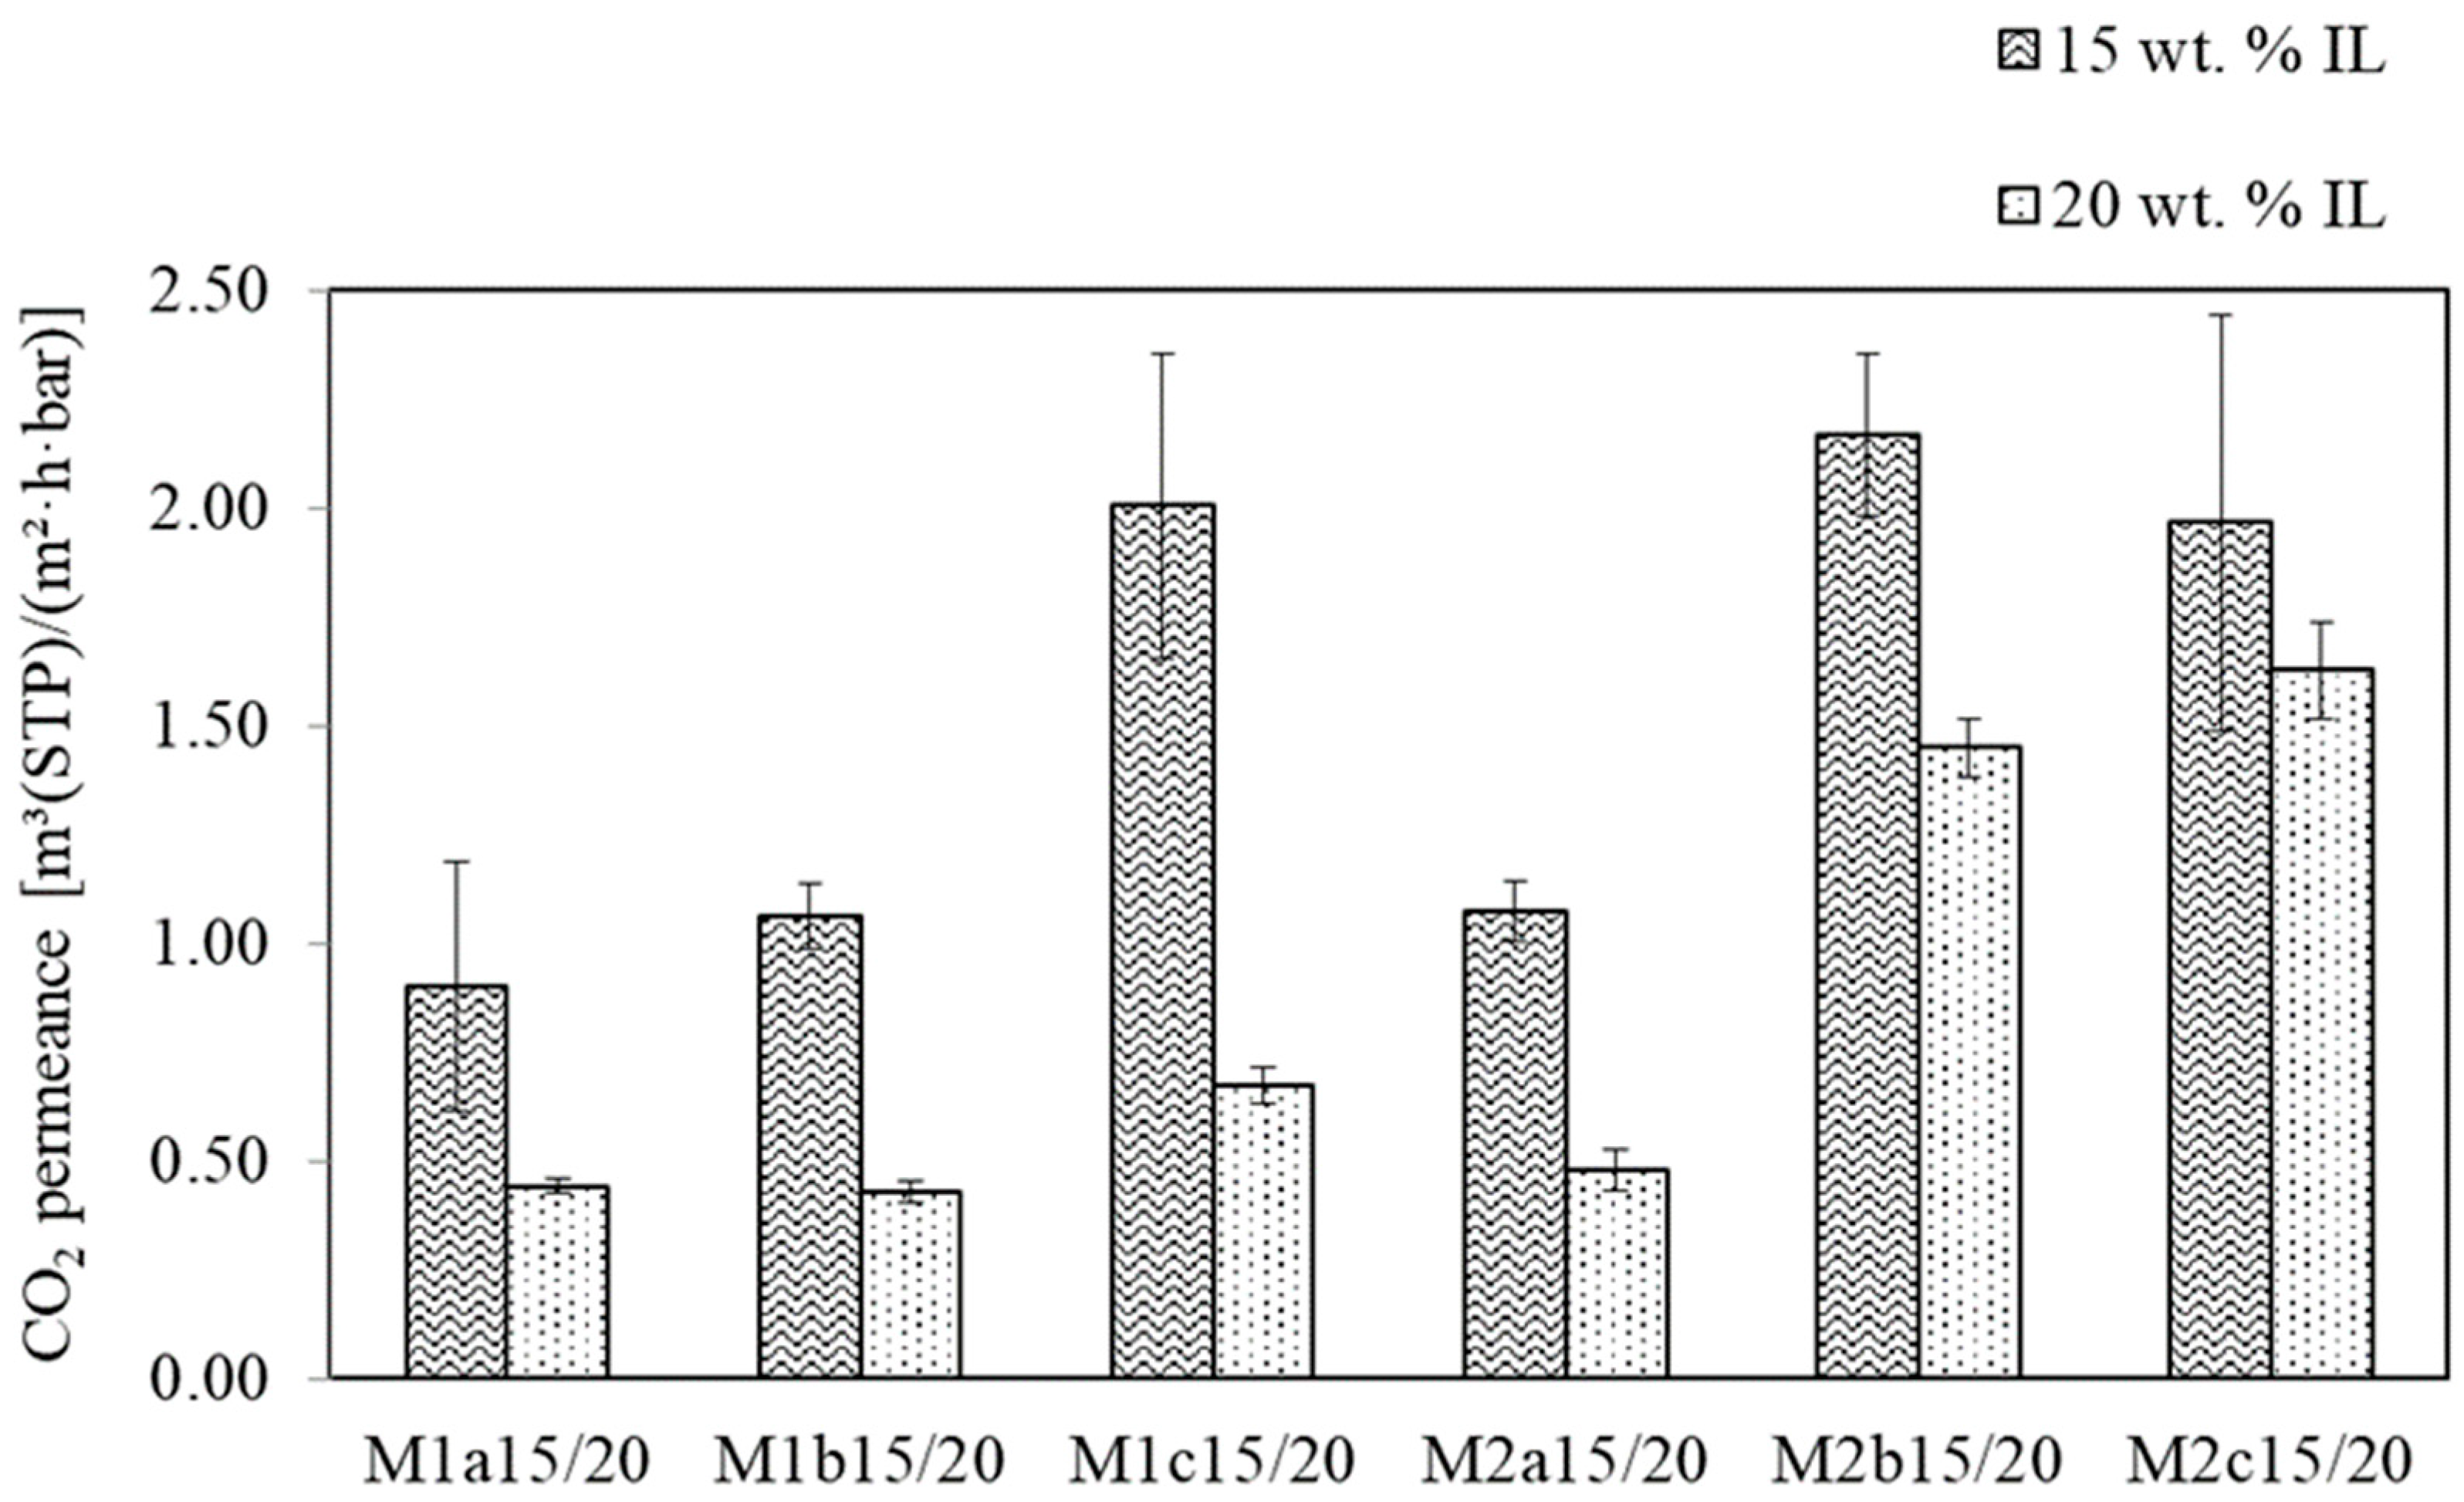
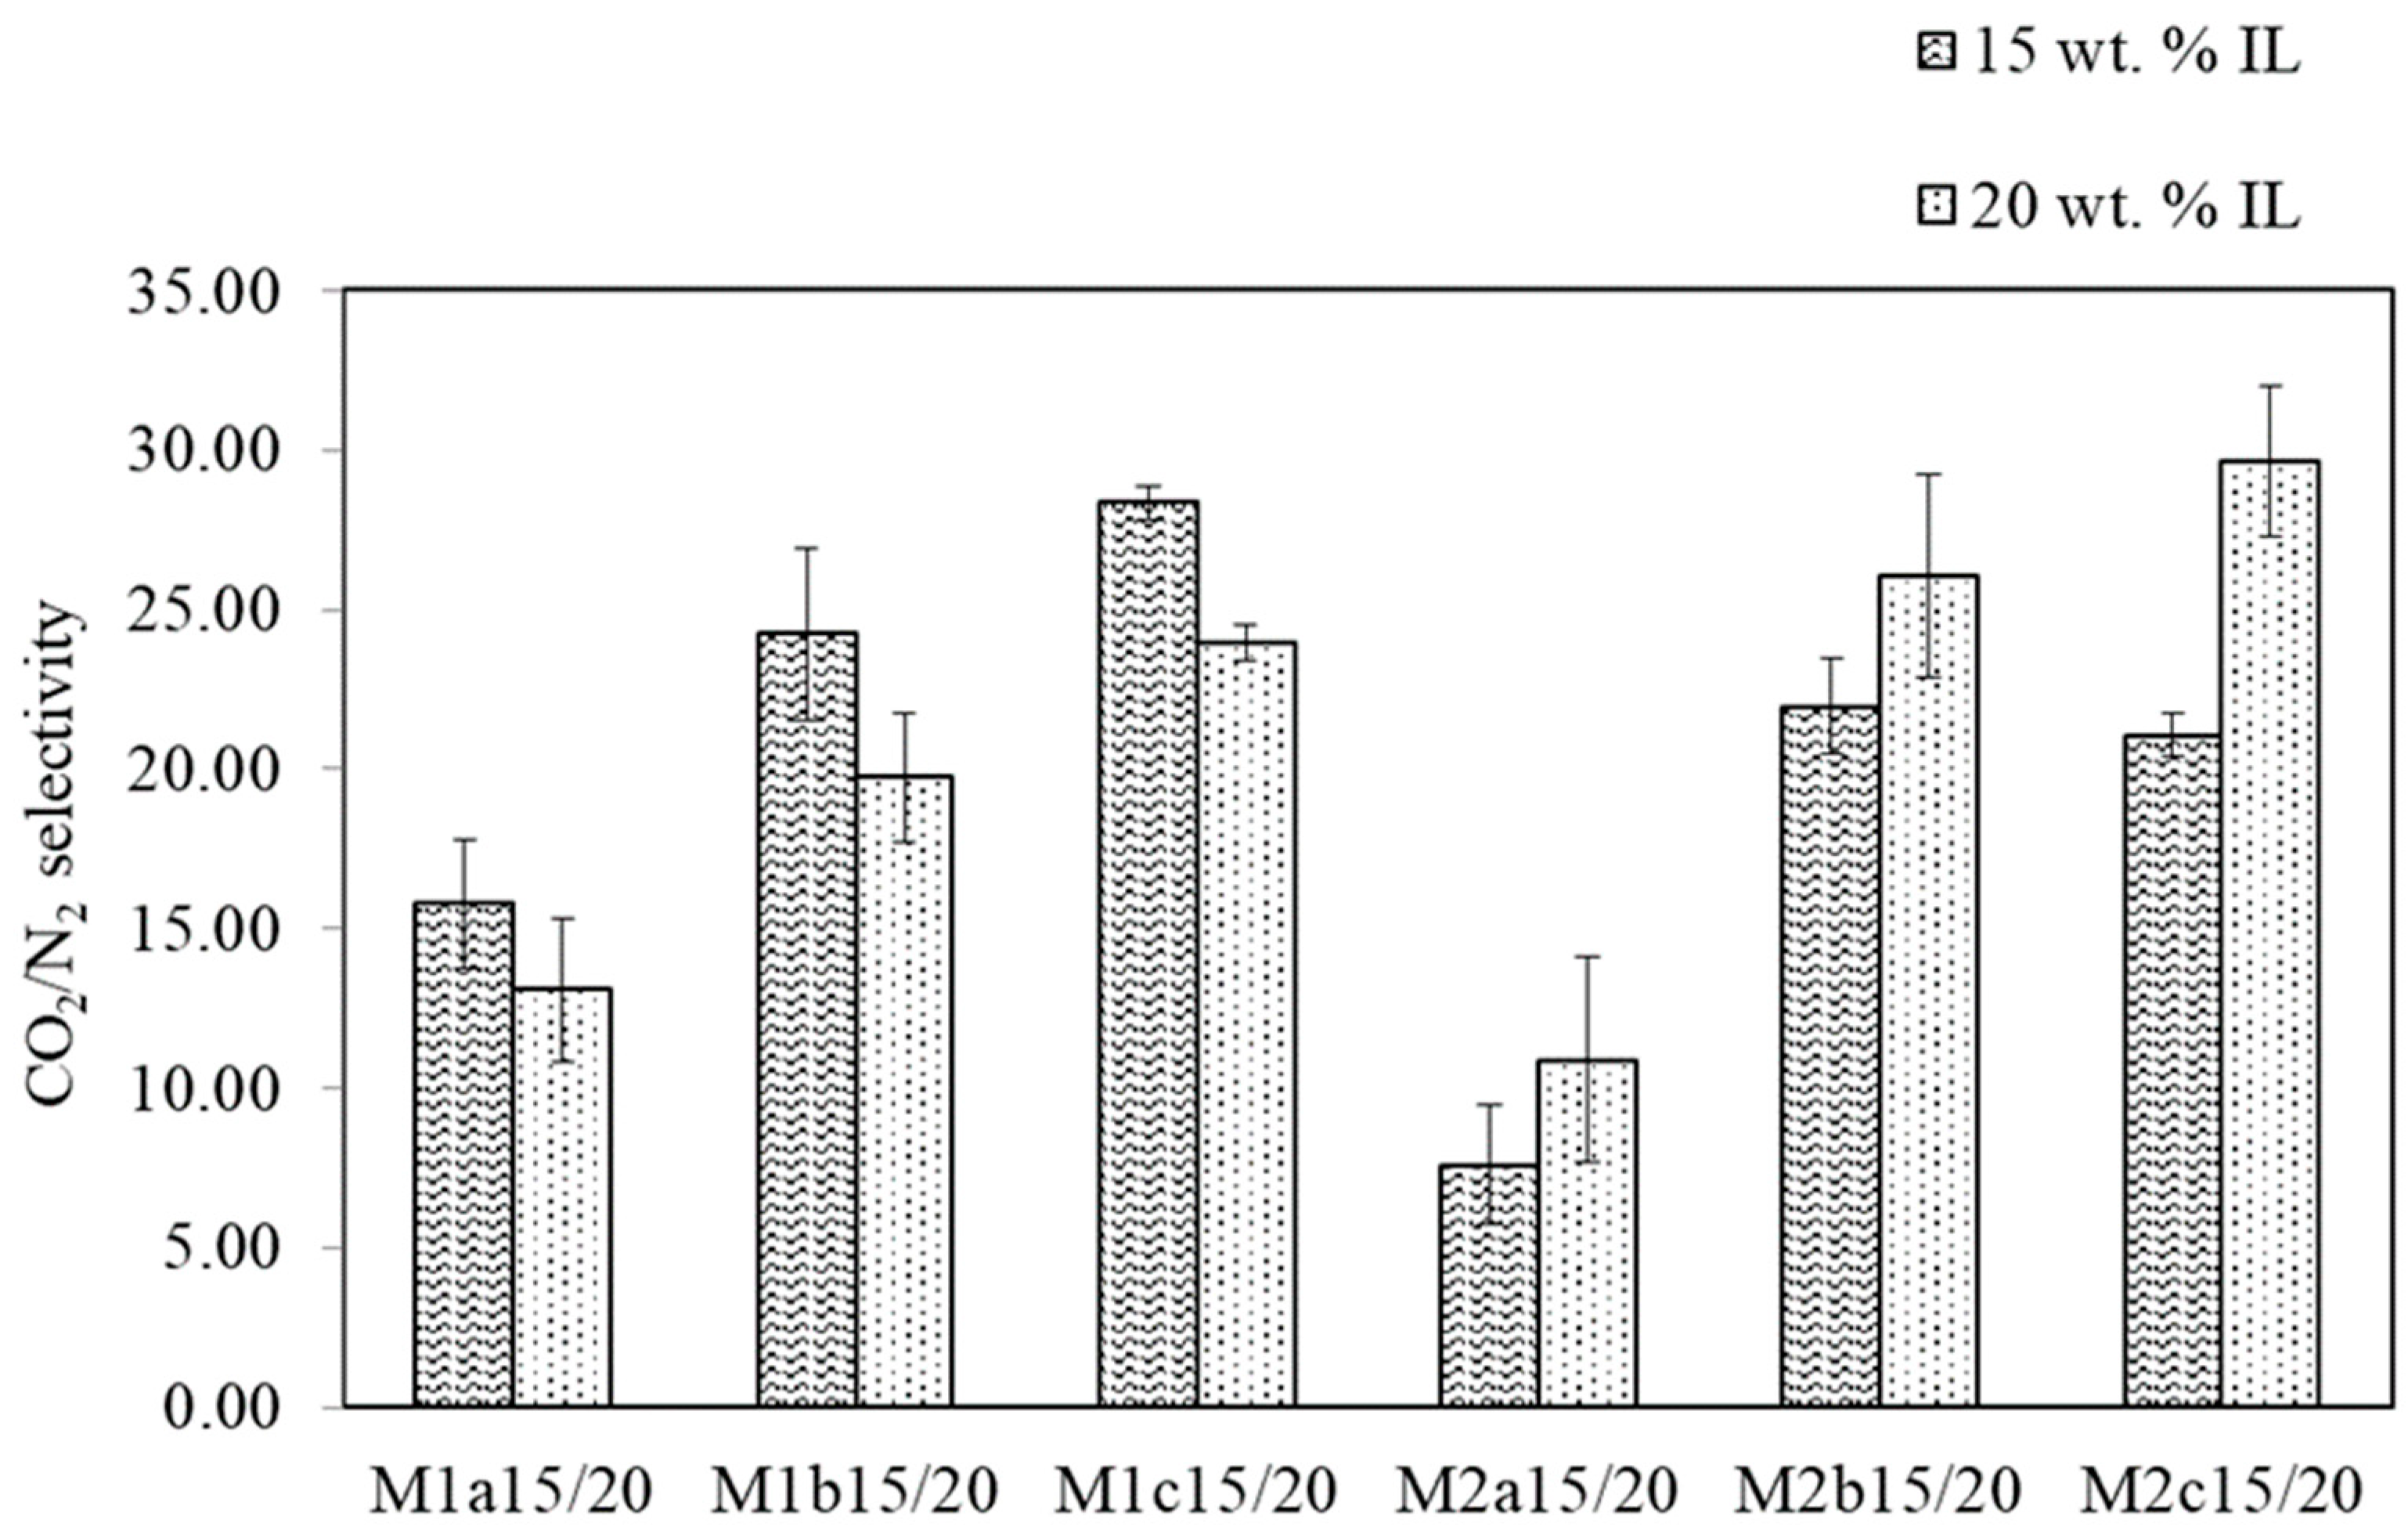
3.1.2. SILM Investigation
3.2. SILM Large-Scale Preparation and Quality Control: From SILM Sheet to SILM Module
3.2.1. “Pressure Increase” Measurements
3.2.2. SILM Envelope and Module Preparation
3.3. SILM Stability Investigation during Flue Gas Operation
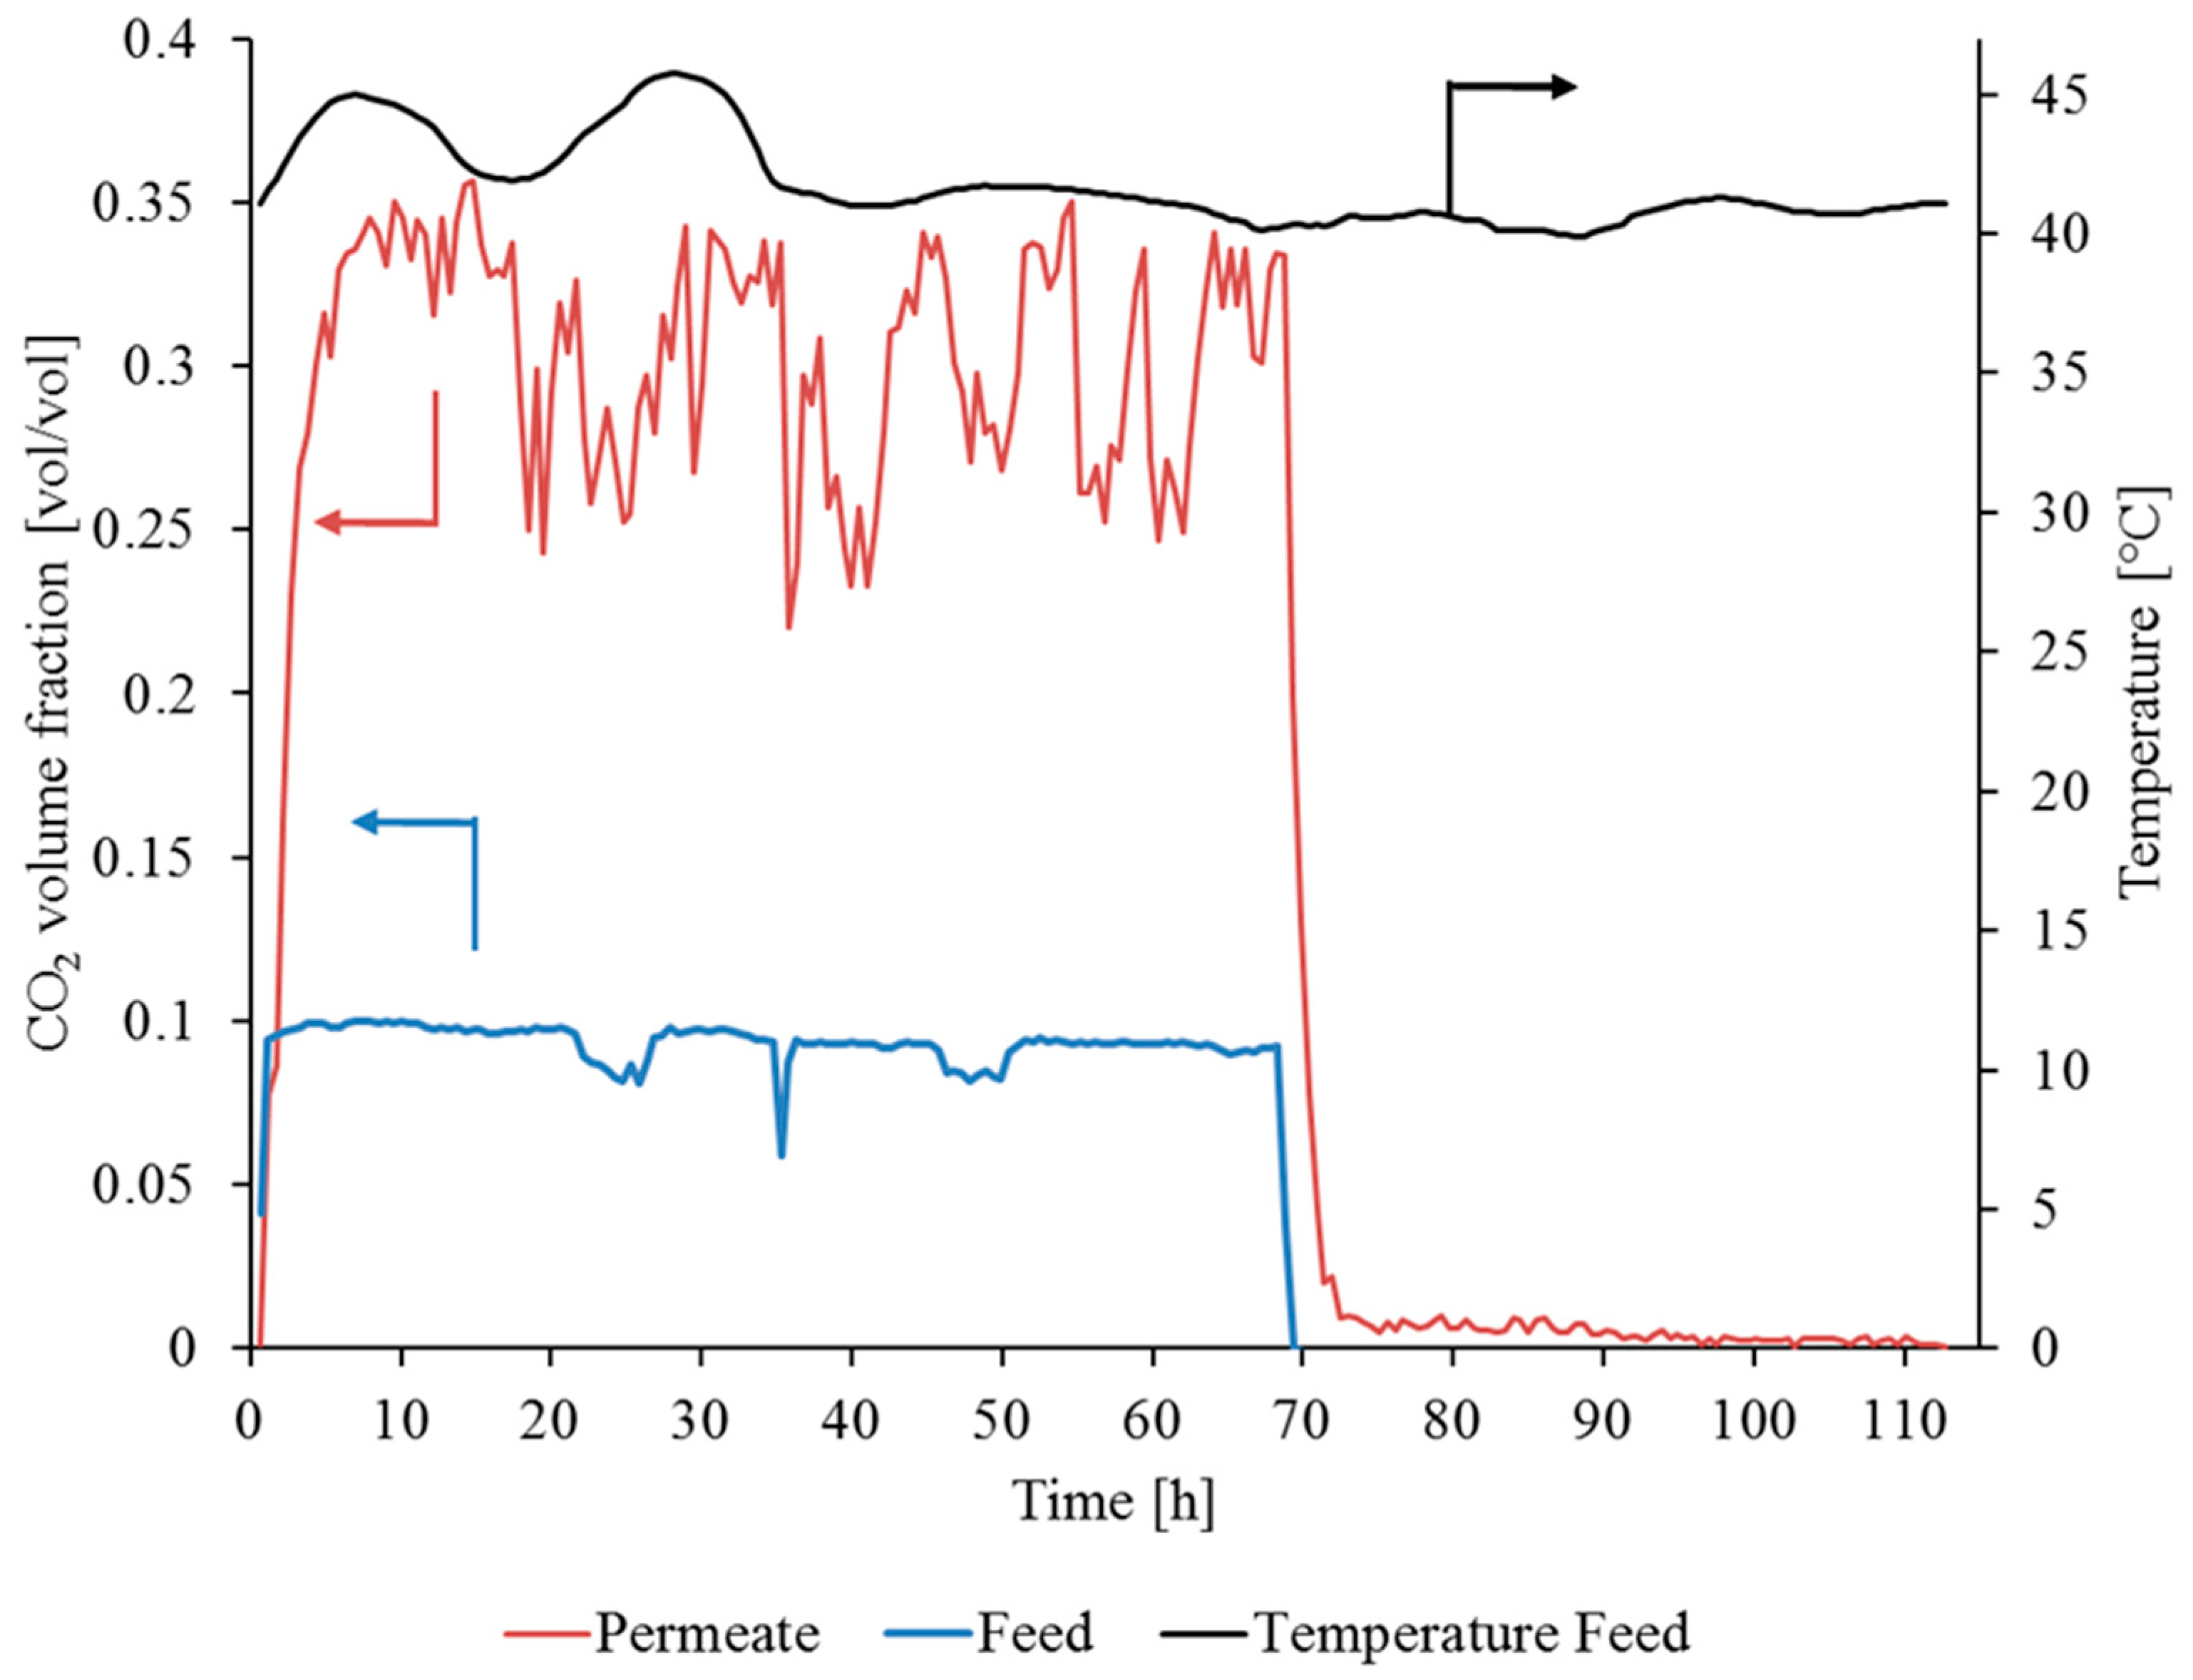
3.3.1. Gas Permeation Test Stand Investigation at Lignite-Fired Power Plant
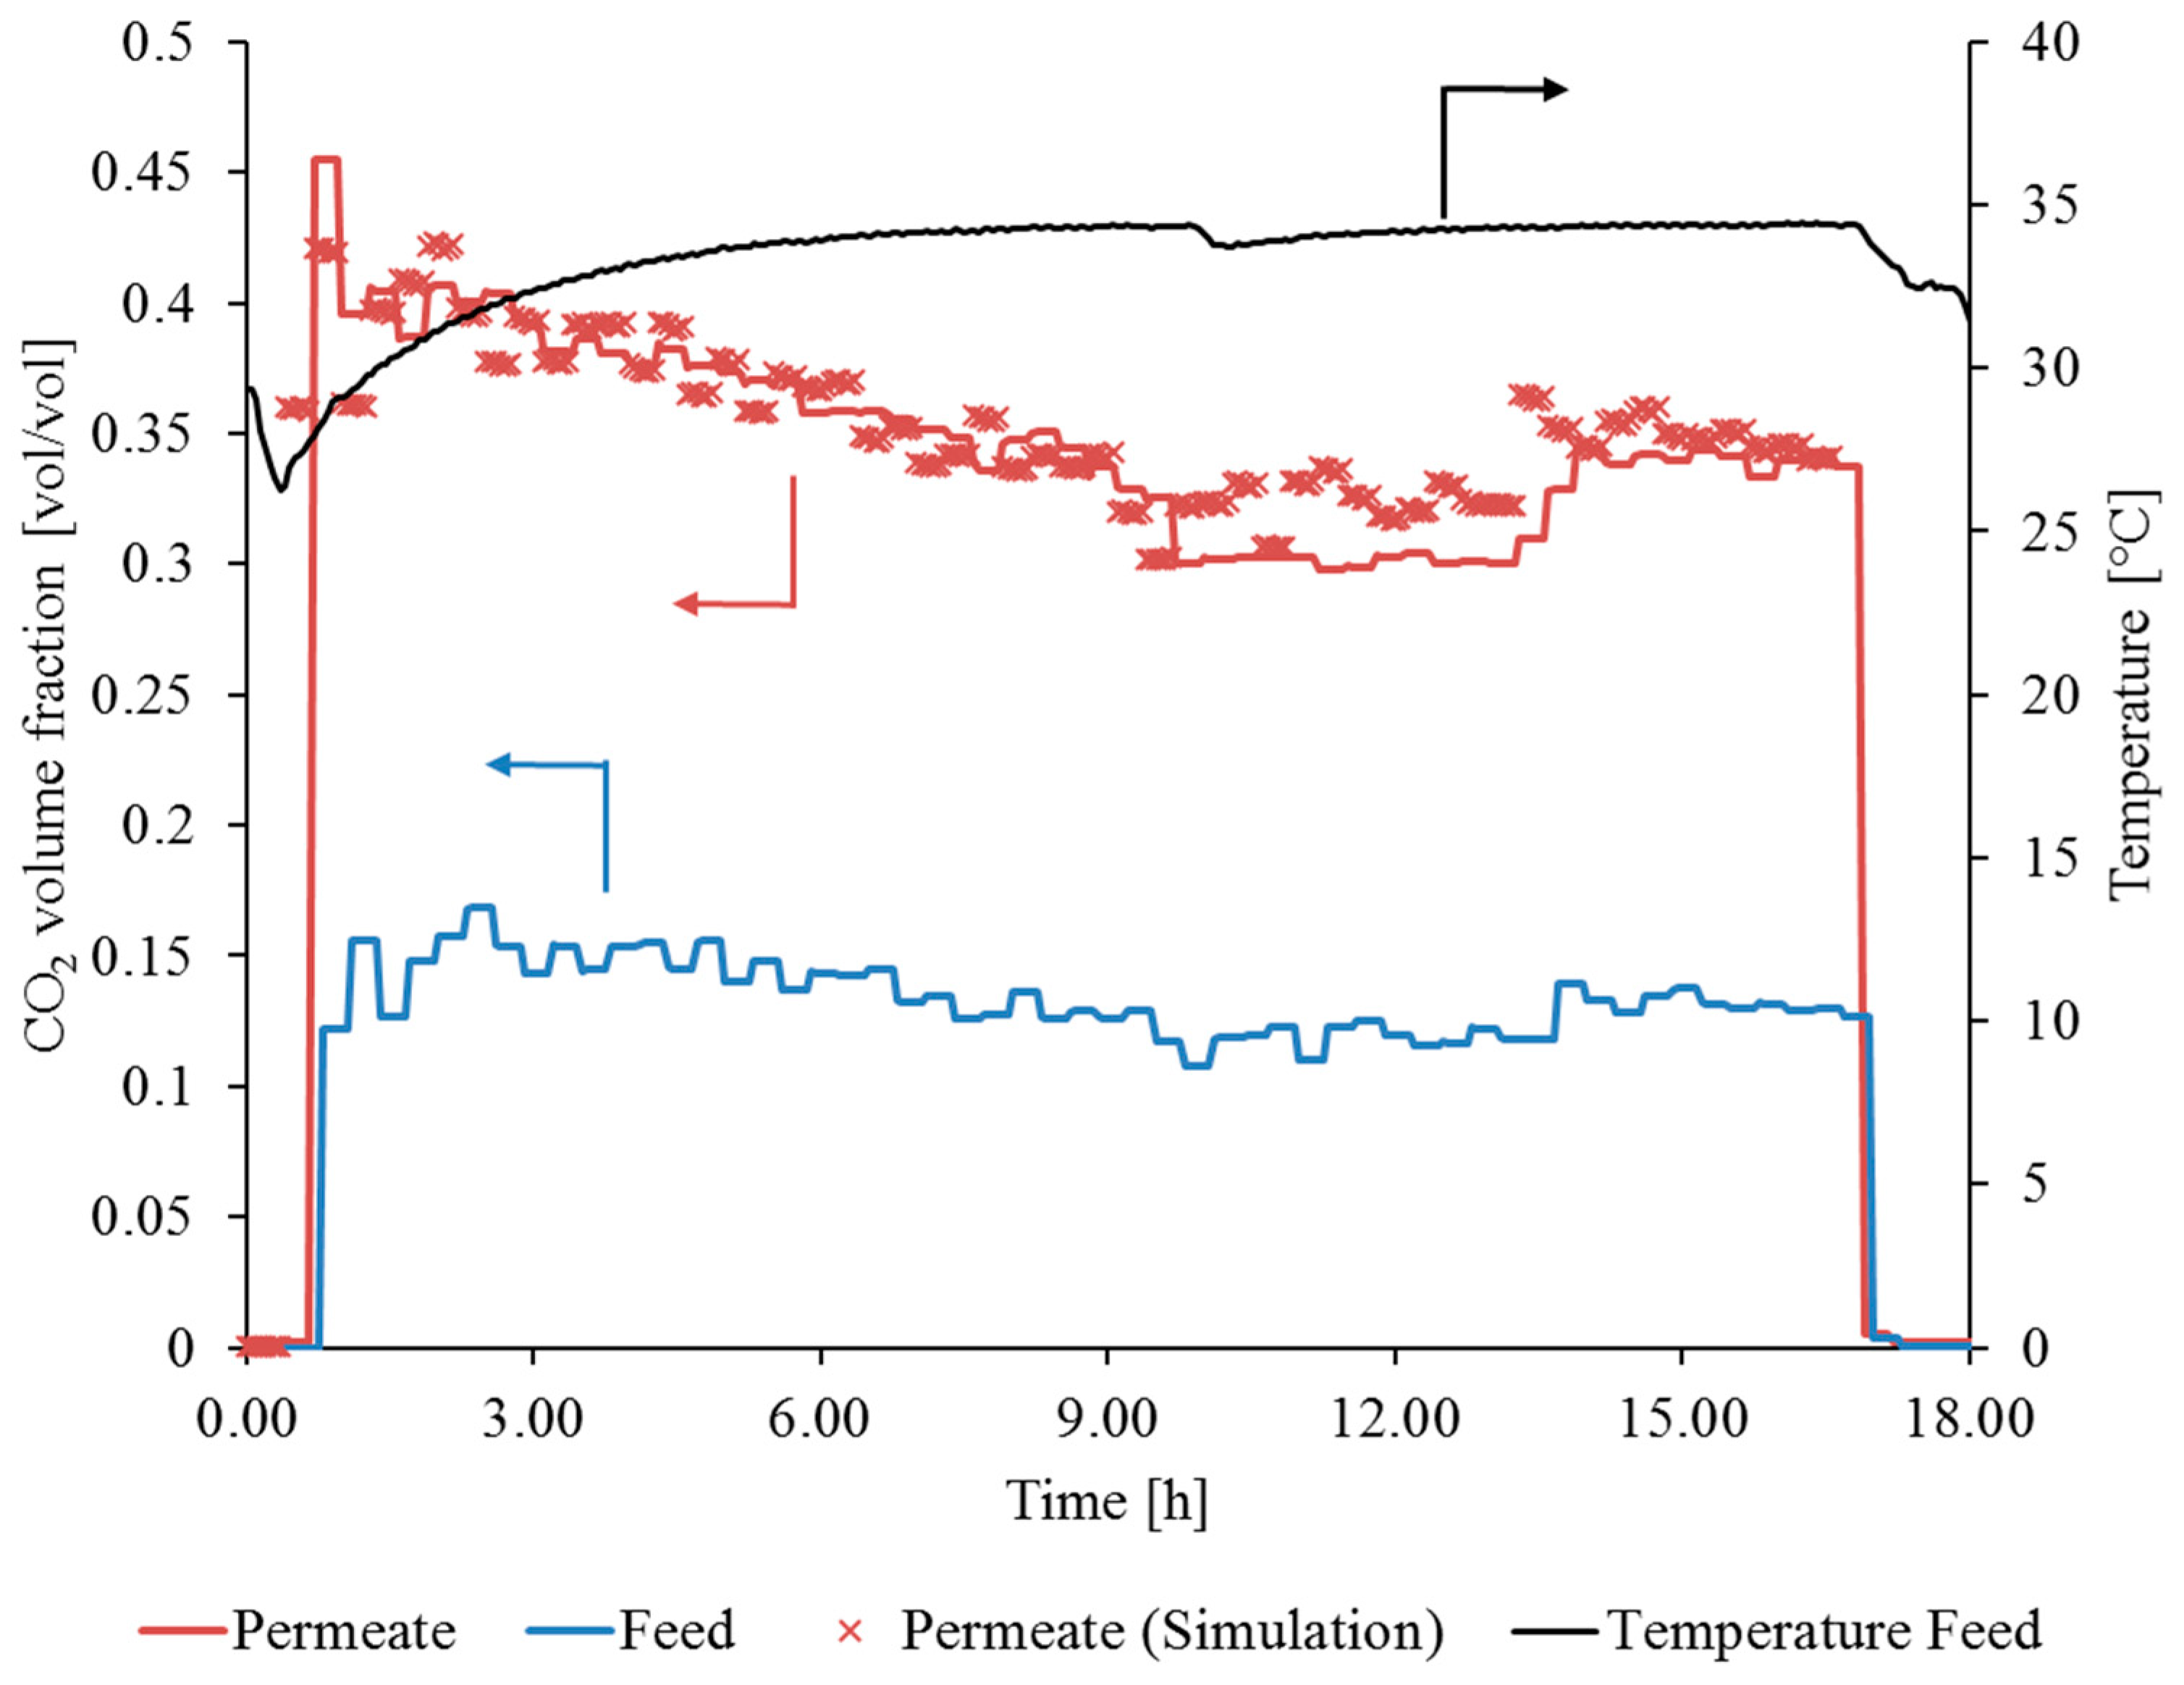
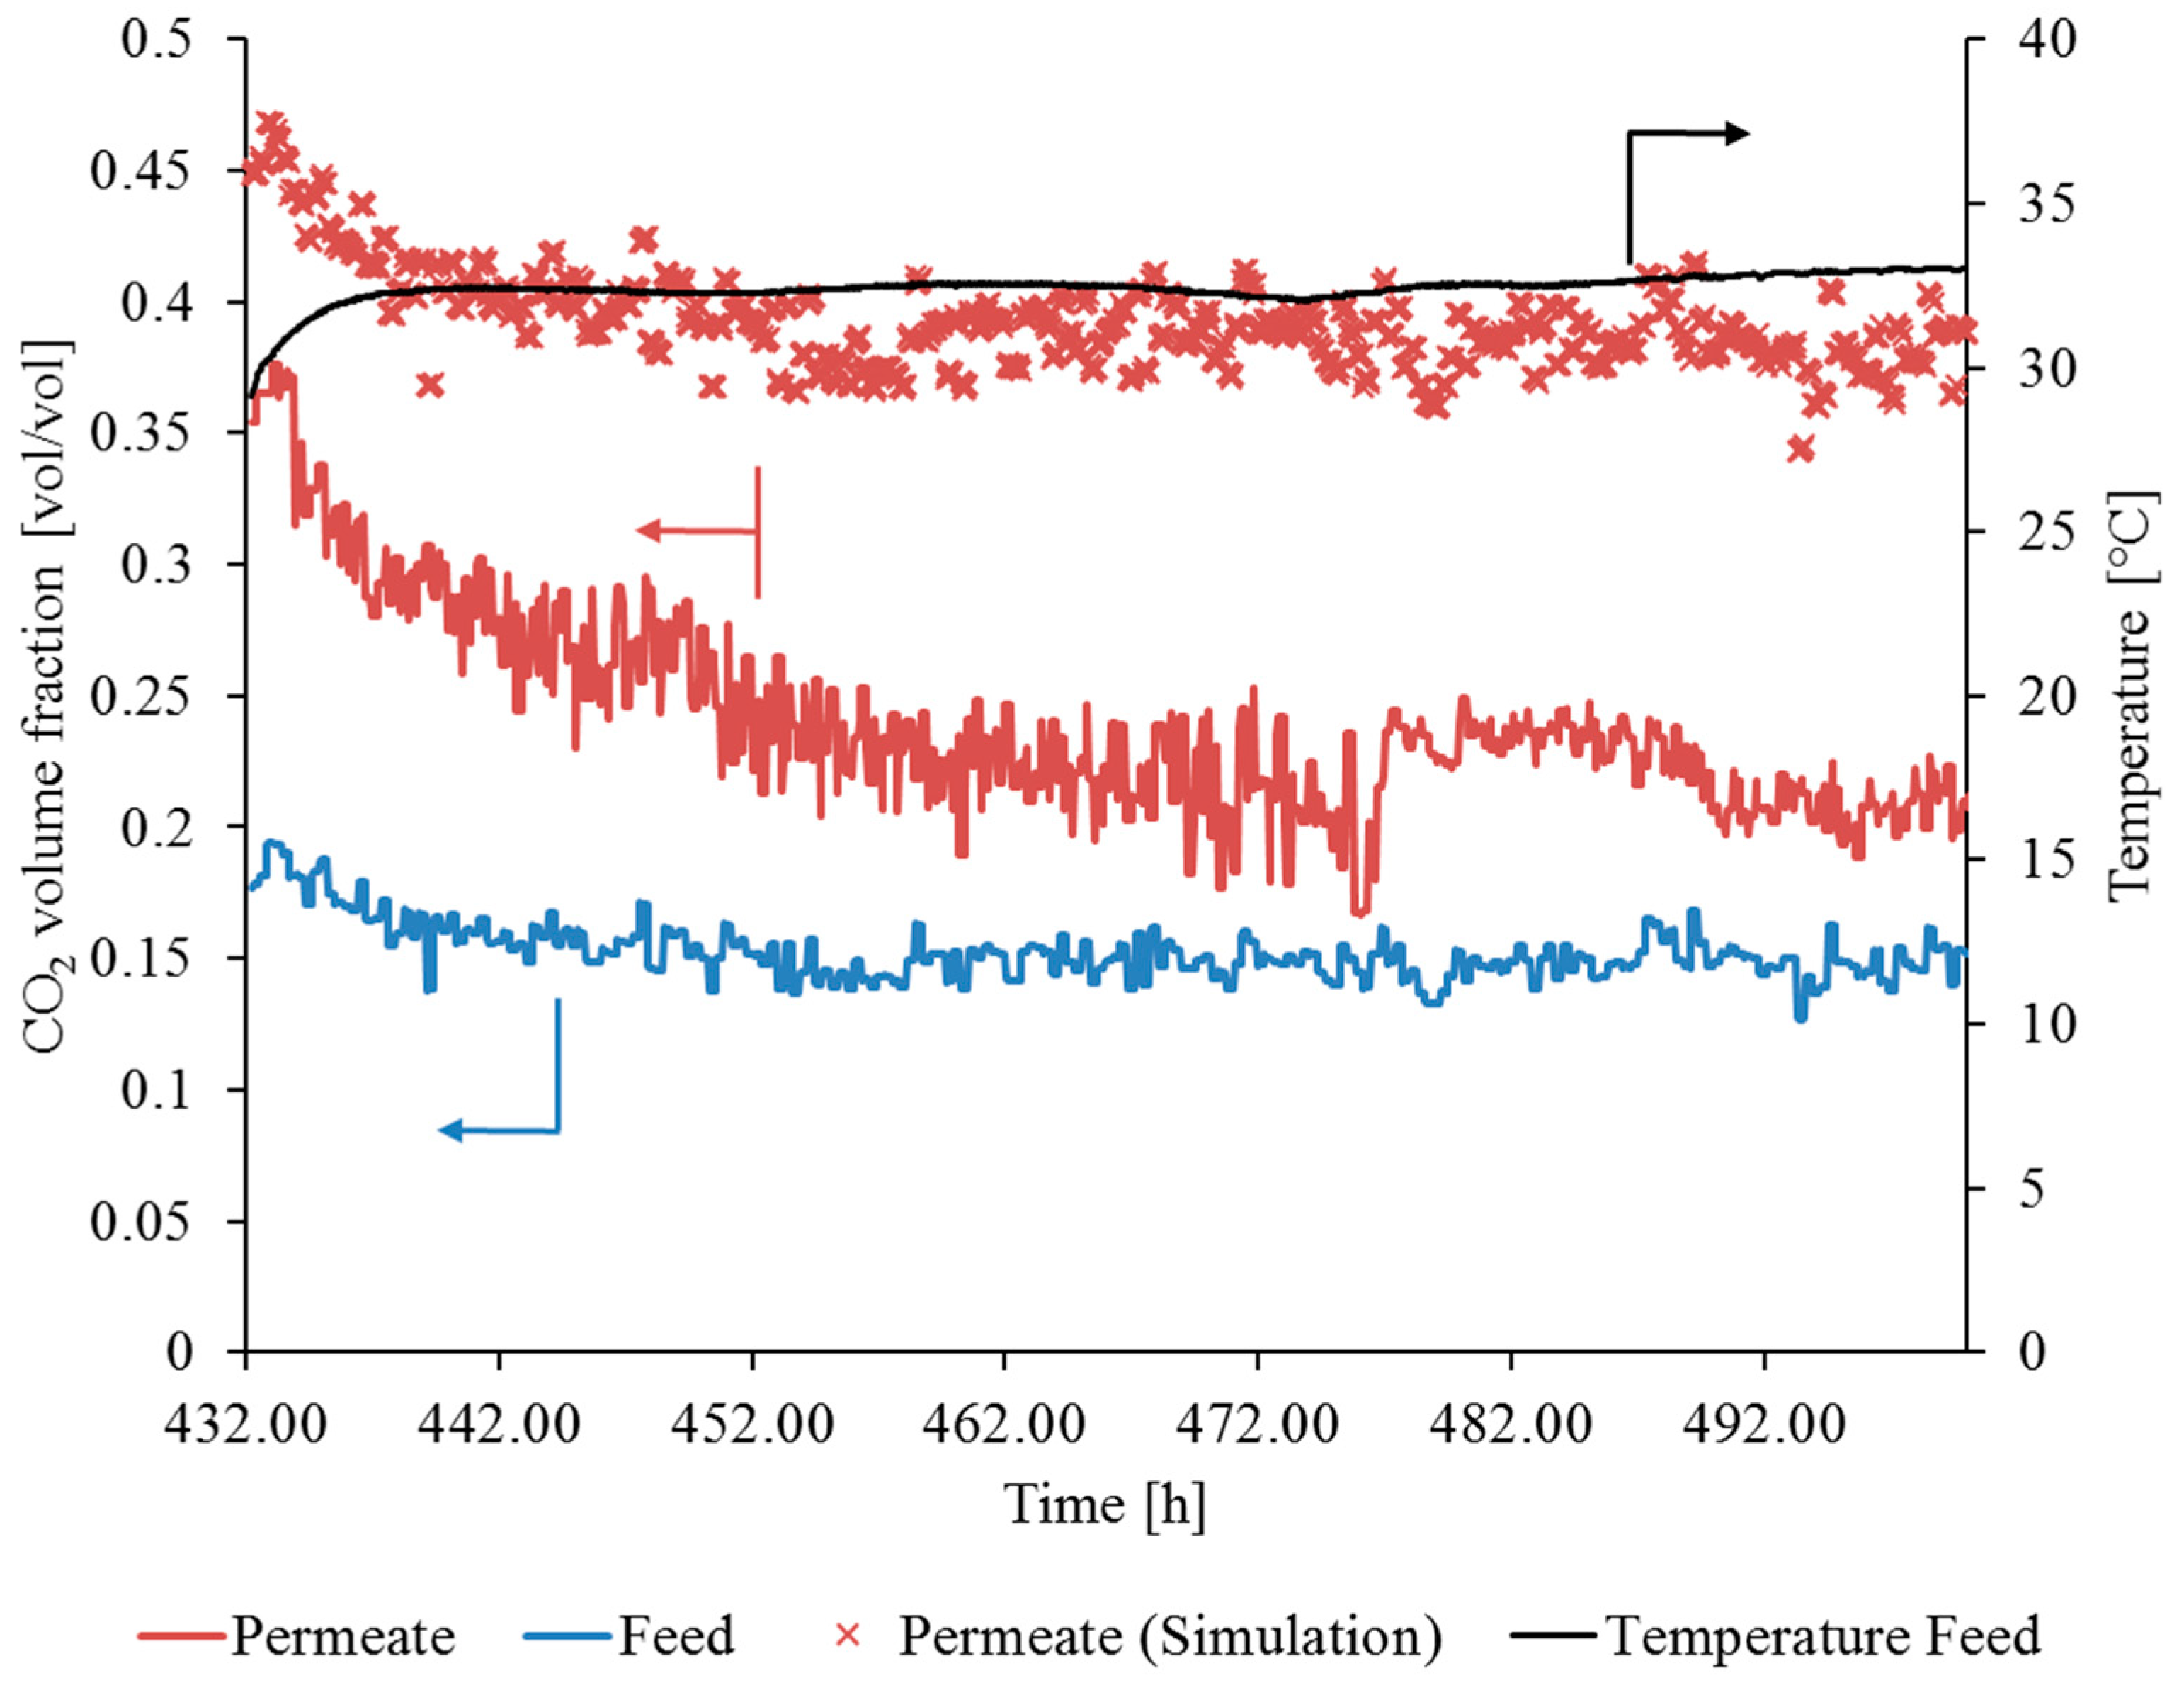
3.3.2. Gas Permeation Pilot Plant Investigation at Hard Coal-Fired Power Plant
3.4. Comparison of Flue Gas Compositions at Both Experimental Sites
4. Conclusions
Author Contributions
Funding
Acknowledgments
Conflicts of Interest
References
- Lashof, D.A.; Ahuja, D.R. Relative contributions of greenhouse gas emissions to global warming. Nature 1990, 344, 529. [Google Scholar] [CrossRef]
- Ansolobehere, S.; Beer, J.; Deutch, J.; Ellerman, A.D.; Friedman, J.; Herzog, H.; Jacoby, H.; Joskow, P.; McRae, G.; Lester, R.; et al. The Future of Coal—Options for a Carbon Constrained World, an Interdisciplinary MIT Study; Massachusetts Institute of Technology: Cambridge, MA, USA, 2007. [Google Scholar]
- Erneuerbare Energien. Available online: https://www.bmwi.de/Redaktion/DE/Dossier/erneuerbare-energien.html (accessed on 29 November 2017).
- Pires, J.C.M.; Martins, F.G.; Alvim-Ferraz, M.C.M.; Simões, M. Recent developments on carbon capture and storage: An overview. Chem. Eng. Res. Des. 2011, 89, 1446–1460. [Google Scholar] [CrossRef]
- Araújo, O.d.Q.F.; de Medeiros, J.L. Carbon capture and storage technologies: Present scenario and drivers of innovation. Curr. Opin. Chem. Eng. 2017, 17, 22–34. [Google Scholar] [CrossRef]
- D’Alessandro, D.M.; Smit, B.; Long, J.R. Carbon dioxide capture: prospects for new materials. Angew. Chem. Int. Ed. 2010, 49, 6058–6082. [Google Scholar] [CrossRef] [PubMed]
- Luis, P. Use of monoethanolamine (MEA) for CO2 capture in a global scenario: Consequences and alternatives. Desalination 2016, 380, 93–99. [Google Scholar] [CrossRef]
- Bushuyev, O.S.; De Luna, P.; Dinh, C.T.; Tao, L.; Saur, G.; van de Lagemaat, J.; Kelley, S.O.; Sargent, E.H. What Should We Make with CO2 and How Can We Make It? Joule 2018, 2, 825–832. [Google Scholar] [CrossRef]
- Brinkmann, T.; Lillepärg, J.; Notzke, H.; Pohlmann, J.; Shishatskiy, S.; Wind, J.; Wolff, T. Development of CO2 Selective Poly(Ethylene Oxide)-Based Membranes: From Laboratory to Pilot Plant Scale. Engineering 2017, 3, 485–493. [Google Scholar] [CrossRef]
- Li, M.; Zhang, X.; Zeng, S.; Bai, L.; Gao, H.; Deng, J.; Yang, Q.; Zhang, S. Pebax-based composite membranes with high gas transport properties enhanced by ionic liquids for CO2 separation. RSC Adv. 2017, 7, 6422–6431. [Google Scholar] [CrossRef]
- Pilot Testing of a Membrane System for Postcombustion CO2 Capture. Available online: https://www.osti.gov/scitech/biblio/1337555 (accessed on 30 November 2017).
- Plechkova, N.V.; Seddon, K.R. Applications of ionic liquids in the chemical industry. Chem. Soc. Rev. 2008, 37, 123–150. [Google Scholar] [CrossRef] [PubMed]
- Walden, P. Molecular weights and electrical conductivity of several fused salts. Bull. Acad. Imp. Sci. (St. Petersburg) 1914, 8, 405–422. [Google Scholar]
- Earle, M.J.; Esperanca, J.M.; Gilea, M.A.; Lopes, J.N.; Rebelo, L.P.; Magee, J.W.; Seddon, K.R.; Widegren, J.A. The distillation and volatility of ionic liquids. Nature 2006, 439, 831–834. [Google Scholar] [CrossRef] [PubMed]
- Anderson, J.L.; Ding, R.; Ellern, A.; Armstrong, D.W. Structure and properties of high stability geminal dicationic ionic liquids. J. Am. Chem. Soc. 2005, 127, 593–604. [Google Scholar] [CrossRef] [PubMed]
- Smiglak, M.; Reichert, W.M.; Holbrey, J.D.; Wilkes, J.S.; Sun, L.; Thrasher, J.S.; Kirichenko, K.; Singh, S.; Katritzky, A.R.; Rogers, R.D. Combustible ionic liquids by design: Is laboratory safety another ionic liquid myth? Chem. Commun. 2006, 24, 2554–2556. [Google Scholar] [CrossRef] [PubMed]
- Ohno, H.; Yoshizawa, M.; Mizumo, T. Ionic Conductivity. In Electrochemical Aspects of Ionic Liquids; John Wiley & Sons: Hoboken, NJ, USA, 2005; pp. 75–81. [Google Scholar]
- Grünauer, J.; Shishatskiy, S.; Abetz, C.; Abetz, V.; Filiz, V. Ionic liquids supported by isoporous membranes for CO2/N2 gas separation applications. J. Membr. Sci. 2015, 494, 224–233. [Google Scholar] [CrossRef]
- Grünauer, J.; Filiz, V.; Shishatskiy, S.; Abetz, C.; Abetz, V. Scalable application of thin film coating techniques for supported liquid membranes for gas separation made from ionic liquids. J. Membr. Sci. 2016, 518, 178–191. [Google Scholar] [CrossRef]
- Tome, L.C.; Marrucho, I.M. Ionic liquid-based materials: A platform to design engineered CO2 separation membranes. Chem. Soc. Rev. 2016, 45, 2785–2824. [Google Scholar] [CrossRef] [PubMed]
- Zhou, J.; Mok, M.M.; Cowan, M.G.; McDanel, W.M.; Carlisle, T.K.; Gin, D.L.; Noble, R.D. High-Permeance Room-Temperature Ionic-Liquid-Based Membranes for CO2/N2 Separation. Ind. Eng. Chem. Res. 2014, 53, 20064–20067. [Google Scholar] [CrossRef]
- Dai, Z.; Noble, R.D.; Gin, D.L.; Zhang, X.; Deng, L. Combination of ionic liquids with membrane technology: A new approach for CO2 separation. J. Membr. Sci. 2016, 497, 1–20. [Google Scholar] [CrossRef]
- Wang, B.; Qin, L.; Mu, T.; Xue, Z.; Gao, G. Are Ionic Liquids Chemically Stable? Chem. Rev. 2017, 117, 7113–7131. [Google Scholar] [CrossRef] [PubMed]
- Crosthwaite, J.M.; Muldoon, M.J.; Dixon, J.K.; Anderson, J.L.; Brennecke, J.F. Phase transition and decomposition temperatures, heat capacities and viscosities of pyridinium ionic liquids. J. Chem. Thermodyn. 2005, 37, 559–568. [Google Scholar] [CrossRef]
- Froba, A.P.; Kremer, H.; Leipertz, A. Density, refractive index, interfacial tension, and viscosity of ionic liquids [EMIM][EtSO4], [EMIM][NTf2], [EMIM][N(CN)2], and [OMA][NTf2] in dependence on temperature at atmospheric pressure. J. Phys. Chem. B 2008, 112, 12420–12430. [Google Scholar] [CrossRef] [PubMed]
- Buschatz, H.; Hicke, H.-G.; Paul, D.; Peters, G.; Scharnagl, N. Membranen aus Polyacrylnitril. EP 0840645A2, 13 May 1998. [Google Scholar]
- Yave, W.; Car, A.; Wind, J.; Peinemann, K.V. Nanometric thin film membranes manufactured on square meter scale: Ultra-thin films for CO2 capture. Nanotechnology 2010, 21, 395301. [Google Scholar] [CrossRef] [PubMed]
- Mushardt, H.; Kramer, V.; Hülagü, D.; Brinkmann, T.; Kraume, M. Development of Solubility Selective Mixed Matrix Membranes for Gas Separation. Chem. Ing. Tech. 2014, 86, 83–91. [Google Scholar] [CrossRef]
- Escorihuela, S.; Tena, A.; Shishatskiy, S.; Escolastico, S.; Brinkmann, T.; Serra, J.M.; Abetz, V. Gas Separation Properties of Polyimide Thin Films on Ceramic Supports for High Temperature Applications. Membranes 2018, 8, 16. [Google Scholar] [CrossRef] [PubMed]
- Ohlrogge, K.; Wind, J.; Brinkmann, T.; Scheel, H.; Stegger, J.; Tiberi, T. 2.9 Progress in the Use of Membrane Technology to Separate Volatile Organic Compounds (VOCs). In Comprehensive Membrane Science and Engineering; Elsevier: Amsterdam, The Netherlands, 2017; pp. 226–255. [Google Scholar]
- Brinkmann, T.; Pohlmann, J.; Withalm, U.; Wind, J.; Wolff, T. Theoretical and experimental investigations of flat sheet membrane module types for high capacity gas separation applications. Chem. Ing. Tech. 2013, 85, 1210–1220. [Google Scholar] [CrossRef]
- Ohlrogge, K.; Ebert, K. Membranen: Grundlagen, Verfahren und Industrielle Anwendungen; Wiley-VCH: Weinheim, Gernamy, 2006. [Google Scholar]
- Der Hochleistungswäscher REAplus. Available online: http://www.rwe.com/web/cms/mediablob/de/254152/data/974594/4/rwe/innovation/kraftwerke/fossil-gefeuerte-kraftwerke/hochleistungswaescher-reaplus/Broschuere-Der-Hochleistungswaescher-REAplus.pdf (accessed on 10 April 2018).
- Pohlmann, J.; Bram, M.; Wilkner, K.; Brinkmann, T. Pilot scale separation of CO2 from power plant flue gases by membrane technology. Int. J. Greenh. Gas Control 2016, 53, 56–64. [Google Scholar] [CrossRef]
- Aspen Custom Modeler. Available online: https://www.aspentech.com/en/products/pages/aspen-custom-modeler (accessed on 14 March 2018).
- Kabadi, V.N.; Danner, R.P. A modified Soave-Redlich-Kwong equation of state for water-hydrocarbon phase equilibria. Ind. Eng. Chem. Process Des. Dev. 1985, 24, 537–541. [Google Scholar] [CrossRef]
- Zha, F.F.; Fane, A.G.; Fell, C.J.D.; Schofield, R.W. Critical displacement pressure of a supported liquid membrane. J. Membr. Sci. 1992, 75, 69–80. [Google Scholar] [CrossRef]
- Moser, P.; Wiechers, G.; Stahl, K.; Stoffregen, T.; Vorberg, G.; Lozano, G.A. Solid Particles as Nuclei for Aerosol Formation and Cause of Emissions—Results from the Post-combustion Capture Pilot Plant at Niederaussem. Energy Procedia 2017, 114, 1000–1016. [Google Scholar] [CrossRef]
- Moser, P.; Schmidt, S.; Stahl, K.; Vorberg, G.; Lozano, G.A.; Stoffregen, T.; Richter, T. The wet electrostatic precipitator as a cause of mist formation—Results from the amine-based post-combustion capture pilot plant at Niederaussem. Int. J. Greenh. Gas Control 2015, 41, 229–238. [Google Scholar] [CrossRef]
- Saha, C.; Irvin, J.H. Real-time aerosol measurements in pilot scale coal fired post-combustion CO2 capture. J. Aerosol Sci. 2017, 104, 43–57. [Google Scholar] [CrossRef]
- Schaber, K. Aerosol formation in absorption processes. Chem. Eng. Sci. 1995, 50, 1347–1360. [Google Scholar] [CrossRef]
- Li, Z.; Jiang, J.; Ma, Z.; Wang, S.; Duan, L. Effect of selective catalytic reduction (SCR) on fine particle emission from two coal-fired power plants in China. Atmos. Environ. 2015, 120, 227–233. [Google Scholar] [CrossRef]
- Brachert, L.; Kochenburger, T.; Schaber, K. Facing the Sulfuric Acid Aerosol Problem in Flue Gas Cleaning: Pilot Plant Experiments and Simulation. Aerosol Sci. Technol. 2013, 47, 1083–1091. [Google Scholar] [CrossRef]
- Merkel, T.C.; Lin, H.; Wei, X.; Baker, R. Power plant post-combustion carbon dioxide capture: An opportunity for membranes. J. Membr. Sci. 2010, 359, 126–139. [Google Scholar] [CrossRef]


| Abbreviation | Structure | Molecular Mass [g/mol] | Viscosity at 25 °C [mPa·s] | Density at 25 °C [kg/m3] |
|---|---|---|---|---|
| EMIM Tf2N |  | 391.3 | 32 [24] | 1518 [25] |
| PAN Membrane | Solvent Variant | Doctor Blade Gap Width [µm] | PAN Thickness [µm] |
|---|---|---|---|
| M1a | 1 | 150 | 28.3 |
| M1b | 1 | 170 | 28.8 |
| M1c | 1 | 200 | 30.6 |
| M2a | 2 | 150 | 21.3 |
| M2b | 2 | 170 | 21.6 |
| M2c | 2 | 200 | 22.6 |
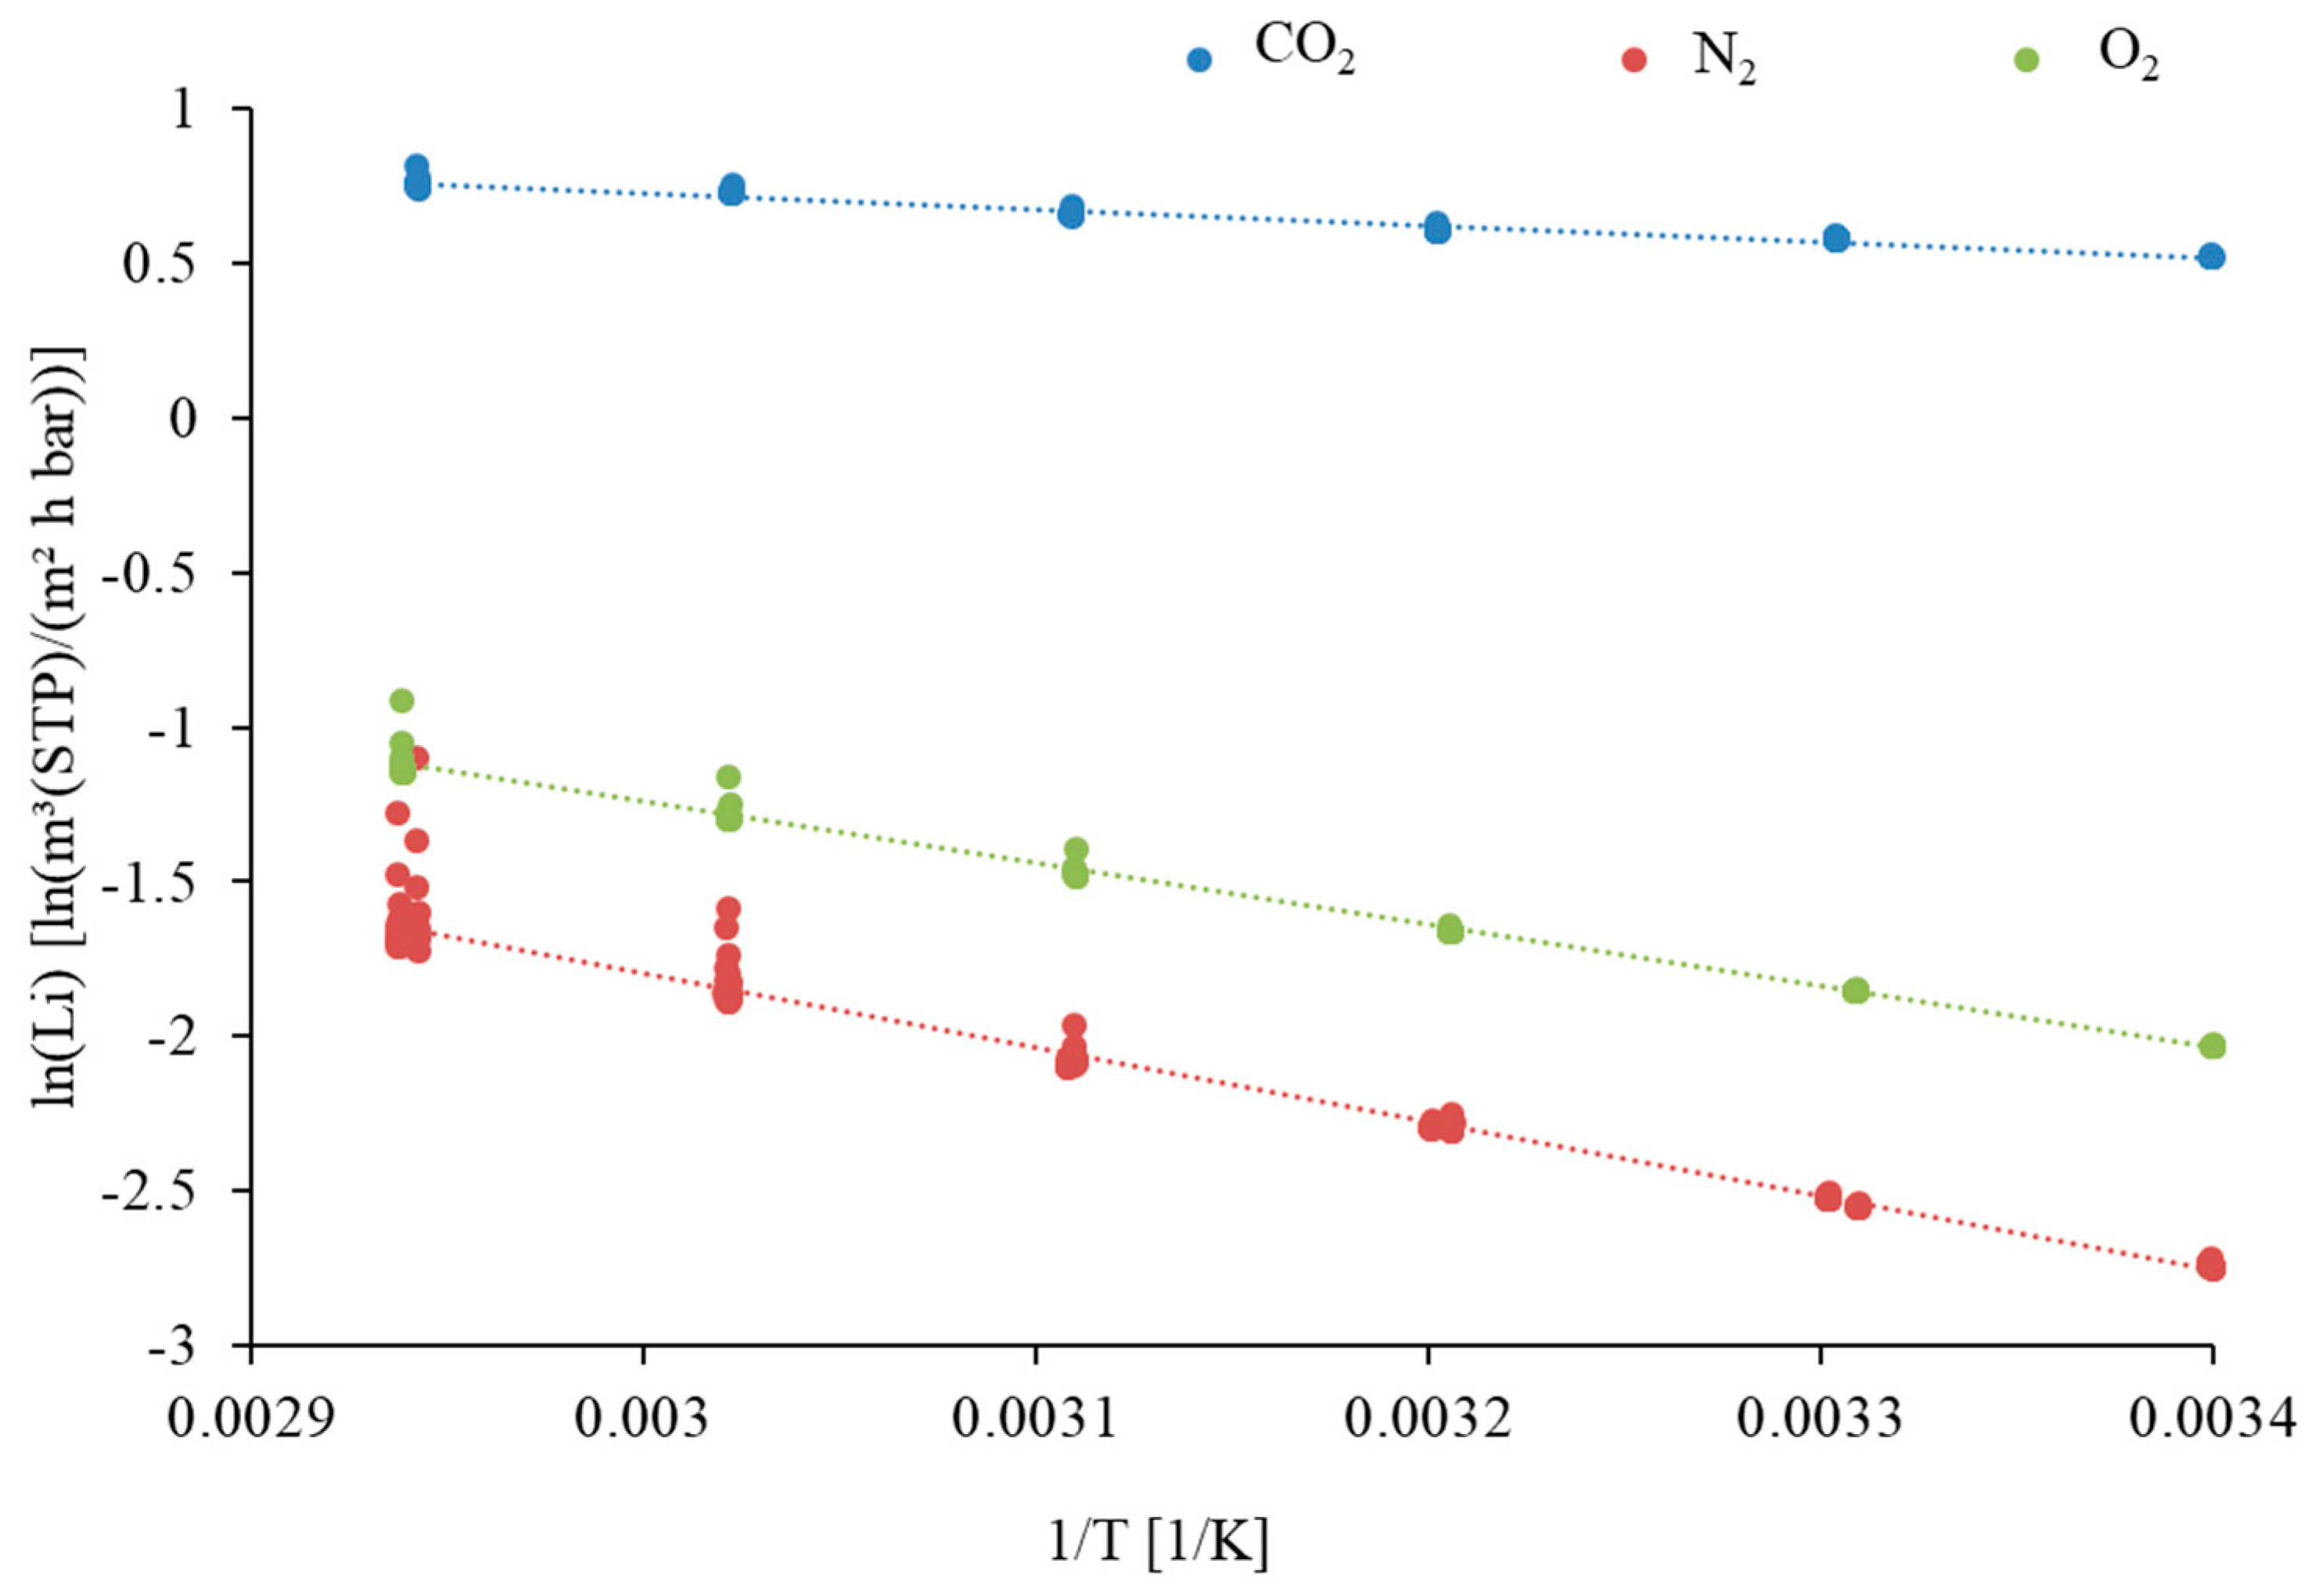
| Component | Li at 33 °C [m3(STP)/(m2·h·bar)] | [m3(STP)/(m2·h·bar)] | Ei [kJ/mol] |
|---|---|---|---|
| CO2 | 1.82 | 6.21 | 3.122 |
| O2 | 0.17 | 74.00 | 15.439 |
| N2 | 0.09 | 206.00 | 19.766 |
| Total Membrane Area [m2] | LCO2 [m3(STP)/(m2·h·bar)] | αCO2/N2 [-] | αO2/N2 [-] |
|---|---|---|---|
| 0.67 | 1.53 ± 0.35 | 22.97 ± 1.54 | 1.79 ± 0.34 |
| Feed Gas for Quality Control | LO2 [m3(STP)/(m2·h·bar)] | LN2 [m3(STP)/(m2·h·bar)] | αO2/N2 [-] |
|---|---|---|---|
| Compressed air | 0.12 | 0.09 | 1.33 |
| Single gases | 0.13 | 0.08 | 1.63 |
| Parameter | Sample 1 | Sample 2 | ||
|---|---|---|---|---|
| Before Experiment | After Experiment | Before Experiment | After Experiment | |
| CO2 permeance [m3(STP)/(m2·h·bar)] | 2.43 | 2.68 | 2.46 | 2.90 |
| N2 Permeance [m3(STP)/(m2·h·bar)] | 0.09 | 0.16 | 0.11 | 0.45 |
| CO2/N2 selectivity [-] | 27.00 | 17.11 | 22.36 | 6.44 |
| Component | CO2 | O2 | N2 |
|---|---|---|---|
| Average permeance before flue gas operation [m3(STP)/(m2·h·bar)] | 1.53 ± 0.35 | 0.12 ± 0.03 | 0.07 ± 0.02 |
| Average relative change of permeance after flue gas operation [%] | −41 ± 8 | 41 ± 40 | 131 ± 84 |
| Power Station | Coal Type | SCR | ESP | FGD |
|---|---|---|---|---|
| RWE Niederaussem (block K) | Rhenish low-sulphur lignite | NO (reduction of NOx by combustion measures) | YES | WFGD and FGDplus pilot plant (∆T = 105–67 °C [38]) |
| EnBW Karlsruhe (block 8) | Different hard coals | YES | YES | WFGD (∆T = 140–65 °C) |
| Influence on formation of SO3 aerosols | - the higher the content of sulphur, the higher the percentage of SO2 and thus SO3 in the flue gas | - catalytic enhancement of SO2 oxidation to sulphur trioxide (SO3) [42] - due to the reducing agent, ammonia (NH3), ammonium sulphate and/or bisulphate may be formed [42] | - the oxidation of SO2 to SO3 could occur as a result of ozone formation [38] | - sharp cooling of the flue gas in the FGD causes aerosol formation by heterogeneous or homogeneous nucleation due to supersaturation [43] |
| SILM | c(SO42−) [mg/L] | c(NH4+) [mg/L] |
|---|---|---|
| Non-flue-gas-exposed | <0.1 | 0.54 |
| Flue-gas-exposed | <0.1 | 10.4 |
© 2019 by the authors. Licensee MDPI, Basel, Switzerland. This article is an open access article distributed under the terms and conditions of the Creative Commons Attribution (CC BY) license (http://creativecommons.org/licenses/by/4.0/).
Share and Cite
Klingberg, P.; Wilkner, K.; Schlüter, M.; Grünauer, J.; Shishatskiy, S. Separation of Carbon Dioxide from Real Power Plant Flue Gases by Gas Permeation Using a Supported Ionic Liquid Membrane: An Investigation of Membrane Stability. Membranes 2019, 9, 35. https://doi.org/10.3390/membranes9030035
Klingberg P, Wilkner K, Schlüter M, Grünauer J, Shishatskiy S. Separation of Carbon Dioxide from Real Power Plant Flue Gases by Gas Permeation Using a Supported Ionic Liquid Membrane: An Investigation of Membrane Stability. Membranes. 2019; 9(3):35. https://doi.org/10.3390/membranes9030035
Chicago/Turabian StyleKlingberg, Patrik, Kai Wilkner, Markus Schlüter, Judith Grünauer, and Sergey Shishatskiy. 2019. "Separation of Carbon Dioxide from Real Power Plant Flue Gases by Gas Permeation Using a Supported Ionic Liquid Membrane: An Investigation of Membrane Stability" Membranes 9, no. 3: 35. https://doi.org/10.3390/membranes9030035