How Molecular Weight Cut-Offs and Physicochemical Properties of Polyether Sulfone Membranes Affect Peptide Migration and Selectivity during Electrodialysis with Filtration Membranes


Abstract
:1. Introduction
2. Materials and Methods
2.1. Chemicals
2.2. Membranes
2.3. Whey Protein Hydrolysate
2.4. Electrodialysis Cell and EDFM Configuration
2.5. Protocol
2.6. Analyses
2.6.1. Membranes Physicochemical Properties
2.6.2. Total Peptide Concentration and Migration Rate in Recovery Compartments
2.6.3. Peptides Sequencing and Characterization
2.6.4. Statistical Analyses
3. Results and Discussion
3.1. Physicochemical Properties of FM
3.2. Global Rate of Peptides Migration to Recovery Compartments
3.3. Individual Peptide Migration to Recovery Compartments: Peptides Selectivity
3.3.1. Selective peptide migration to A−RC
3.3.2. Selective Peptide Migration to C+RC
4. Conclusions
Author Contributions
Funding
Acknowledgments
Conflicts of Interest
Abbreviations
| AEM | Anion exchange membrane |
| AP | Anionic peptides |
| A−RC | Anionic peptide recovery compartment |
| CEM | Cation exchange membrane |
| CP | Cationic peptides |
| C+RC | Cationic peptide recovery compartment |
| Da | Dalton |
| ED | Electrodialysis |
| EDFM | Electrodialysis with filtration membranes |
| FM | Filtration membrane |
| kDa | Kilo Dalton |
| MW | Molecular weight |
| MWCO | Molecular weight cut-off |
| mS | Milli-Siemens (electrical conductivity unit) |
| PES | Polyether sulfone |
| PSD | Pore size distribution |
| PVDF | Polyvinylidene fluoride |
| RA | Relative abundance |
| UPLC-MS-QTOF | Ultra-high-performance liquid chromatography-mass spectrometry-quadrupole time-of-flight |
| WPI | Whey protein isolate |
| ZP | Zeta potential |
References
- Kang, E.; Lee, Y.; Chon, K.; Cho, J. Effects of hydrodynamic conditions (diffusion vs. convection) and solution chemistry on effective molecular weight cut-off of negatively charged nanofiltration membranes. Desalination 2014, 352, 136–141. [Google Scholar] [CrossRef]
- Scott, K. Membrane materials, preparation and characterisation. In Handbook of Industrial Membranes; Scott, K., Ed.; Elsevier Science: Amsterdam, The Netherlands, 1995; pp. 187–269. ISBN 978-1-85617-233-2. [Google Scholar]
- Mehta, A.; Zydney, A.L. Permeability and selectivity analysis for ultrafiltration membranes. J. Membr. Sci. 2005, 249, 245–249. [Google Scholar] [CrossRef]
- Mochizuki, S.; Zydney, A.L. Theoretical analysis of pore size distribution effects on membrane transport. J. Membr. Sci. 1993, 82, 211–227. [Google Scholar] [CrossRef]
- Chabeaud, A.; Vandanjon, L.; Bourseau, P.; Jaouen, P.; Guérard, F. Fractionation by ultrafiltration of a saithe protein hydrolysate (Pollachius virens): Effect of material and molecular weight cut-off on the membrane performances. J. Food Eng. 2009, 91, 408–414. [Google Scholar] [CrossRef]
- Pouliot, Y.; Wijers, M.C.; Gauthier, S.F.; Nadeau, L. Fractionation of whey protein hydrolysates using charged UF/NF membranes. J. Membr. Sci. 1999, 158, 105–114. [Google Scholar] [CrossRef]
- Bazinet, L.; Firdaous, L. Separation of Bioactive peptides by Membrane Processes: Technologies and Devices. Recent Pat. Biotechnol. 2013, 7, 9–27. [Google Scholar] [CrossRef] [PubMed]
- Roblet, C.; Doyen, A.; Amiot, J.; Pilon, G.; Marette, A.; Bazinet, L. Enhancement of glucose uptake in muscular cell by soybean charged peptides isolated by electrodialysis with ultrafiltration membranes (EDUF): Activation of the AMPK pathway. Food Chem. 2014, 147, 124–130. [Google Scholar] [CrossRef]
- Langevin, M.-E.; Roblet, C.; Moresoli, C.; Ramassamy, C.; Bazinet, L. Comparative application of pressure-and electrically-driven membrane processes for isolation of bioactive peptides from soy protein hydrolysate. J. Membr. Sci. 2012, 403, 15–24. [Google Scholar] [CrossRef]
- Henaux, L.; Thibodeau, J.; Pilon, G.; Gill, T.; Marette, A.; Bazinet, L. How Charge and Triple Size-Selective Membrane Separation of Peptides from Salmon Protein Hydrolysate Orientate their Biological Response on Glucose Uptake. Int. J. Mol. Sciences 2019, 20, 1939. [Google Scholar] [CrossRef]
- Doyen, A.; Beaulieu, L.; Saucier, L.; Pouliot, Y.; Bazinet, L. Impact of Ultrafiltration Membrane Material on Peptide Separation from a Snow Crab Byproduct Hydrolysate by Electrodialysis with Ultrafiltration Membranes. J. Agric. Food Chem. 2011, 59, 1784–1792. [Google Scholar] [CrossRef]
- Mohammad, A.W.; Ng, C.Y.; Lim, Y.P.; Ng, G.H. Ultrafiltration in Food Processing Industry: Review on Application, Membrane Fouling, and Fouling Control. Food Bioproc. Technol. 2012, 5, 1143–1156. [Google Scholar] [CrossRef]
- Bargeman, G.; Koops, G.H.; Houwing, J.; Breebaart, I.; Van Der Horst, H.C.; Wessling, M. The development of electro-membrane filtration for the isolation of bioactive peptides: The effect of membrane selection and operating parameters on the transport rate. Desalination 2002, 149, 369–374. [Google Scholar] [CrossRef]
- Aider, M.; Brunet, S.; Bazinet, L. Electroseparation of chitosan oligomers by electrodialysis with ultrafiltration membrane (EDUF) and impact on electrodialytic parameters. J. Membr. Sci. 2008, 309, 222–232. [Google Scholar] [CrossRef]
- Kadel, S.; Persico, M.; Thibodeau, J.; Lainé, C.; Bazinet, L. Use of redundancy analysis and multivariate regression models to select the significant membrane properties affecting peptide migration during electrodialysis with filtration membranes. Sep. Purif. Technol. 2019, 221, 114–125. [Google Scholar] [CrossRef]
- Suwal, S.; Roblet, C.; Amiot, J.; Doyen, A.; Beaulieu, L.; Legault, J.; Bazinet, L. Recovery of valuable peptides from marine protein hydrolysate by electrodialysis with ultra filtration membrane: Impact of ionic strength. Food Res. Int. 2014, 65, 407–415. [Google Scholar] [CrossRef]
- Bazinet, L.; Araya-Farias, M. Effect of calcium and carbonate concentrations on cationic membrane fouling during electrodialysis. J. Colloid Interface Sci. 2005, 281, 188–196. [Google Scholar] [CrossRef]
- Kumbur, E.C.; Sharp, K.V.; Mench, M.M. Validated Leverett Approach for Multiphase Flow in PEFC Diffusion Media. J. Electrochem. Soc. 2007, 154, B1315. [Google Scholar] [CrossRef]
- Persico, M.; Mikhaylin, S.; Doyen, A.; Firdaous, L.; Nikonenko, V.; Pismenskaya, N.; Bazinet, L. Prevention of peptide fouling on ion-exchange membranes during electrodialysis in overlimiting conditions. J. Membr. Sci. 2017, 543, 212–221. [Google Scholar] [CrossRef]
- Nystrom, M.; Lindström, M.; Matthiasson, E. Streaming Potential as a Tool in the Characterization of Ultrafiltration Membranes. Colloids Surf. 1989, 36, 297–312. [Google Scholar] [CrossRef]
- Drioli, E.; Criscuoli, A.; Curcio, E. Membrane Contactors: Fundamentals, Applications and Potentialities; Elsevier Science: Amsterdam, The Netherlands, 2006; Chapter 2: Membrane materials; pp. 40–104. [Google Scholar]
- Bazinet, L.; Poulin, J.F.; Amiot, J. Effect of Conditioning Ultrafiltration Membranes on their Performances in Electrodialysis with Ultrafiltration Membrane Effect of Conditioning Ultrafiltration Membranes on their Performances in Electrodialysis with Ultrafiltration. Sep. Purif. Technol. 2007, 42, 2501–2518. [Google Scholar]
- Strathmann, H. Electrodialytic membrane processes and their practical application. Studies Environ. Sci. 1994, 59, 495–533. [Google Scholar]
- Lalia, B.S.; Kochkodan, V.; Hashaikeh, R.; Hilal, N. A review on membrane fabrication: Structure, properties and performance relationship. Desalination 2013, 326, 77–95. [Google Scholar] [CrossRef]
- Galier, S.; Balmann, H.R. The electrophoretic membrane contactor: A mass-transfer-based methodology applied to the separation of whey proteins. Sep. Purif. Technol. 2011, 77, 237–244. [Google Scholar] [CrossRef]
- Luo, J.; Wan, Y. Effect of highly concentrated salt on retention of organic solutes by nanofiltration polymeric membranes. J. Membr. Sci. 2011, 372, 145–153. [Google Scholar] [CrossRef]
- Luo, J.; Wan, Y. Effects of pH and salt on nanofiltration—a critical review. J. Membr. Sci. 2013, 438, 18–28. [Google Scholar] [CrossRef]
- Bazinet, L.; Degrandpré, Y.; Porter, A. Electromigration of tobacco polyphenols. Sep. Purif. Technol. 2005, 41, 101–107. [Google Scholar] [CrossRef]
- Manickam, S.S.; Mccutcheon, J.R. Characterization of polymeric nonwovens using porosimetry, porometry and X-ray computed tomography. J. Membr. Sci. 2012, 407–408, 108–115. [Google Scholar] [CrossRef]
- Hilal, N.; Al-zoubi, H.; Mohammad, A.W.; Darwish, N.A. Nanofiltration of highly concentrated salt solutions up to seawater salinity. Desalination 2005, 184, 315–326. [Google Scholar] [CrossRef]
- Khayet, M.; Mengual, J.I.; Matsuura, T. Porous hydrophobic/hydrophilic composite membranes: Application in desalination using direct contact membrane distillation. J. Membr. Sci. 2005, 252, 101–113. [Google Scholar] [CrossRef]
- Adamson, N.J.; Reynolds, E.C. Rules relating electrophoretic mobility, charge and molecular size of peptides and proteins. J. Chromatogr. B: Biomed. Sci. Appl. 1997, 699, 133–147. [Google Scholar] [CrossRef]
- Ndiaye, N.; Pouliot, Y.; Saucier, L.; Beaulieu, L.; Bazinet, L. Electroseparation of bovine lactoferrin from model and whey solutions. Sep. Purif. Technol. 2010, 74, 93–99. [Google Scholar] [CrossRef]
- Groleau, P.E.; Morin, P.; Gauthier, S.F.; Pouliot, Y. Effect of Physicochemical Conditions on Peptide − Peptide Interactions in a Tryptic Hydrolysate of β-Lactoglobulin and Identification of Aggregating Peptides. J. Agric. Food Chem. 2003, 51, 4370–4375. [Google Scholar] [CrossRef] [PubMed]
- Caessens, P.W.J.R.; Visser, S.; Gruppen, H.; Voragen, A.G.J. β-Lactoglobulin Hydrolysis. 1. Peptide Composition and Functional Properties of Hydrolysates Obtained by the Action of Plasmin, Trypsin, and Staphylococcus aureus V8 Protease. J. Agric. Food Chem. 1999, 47, 2973–2979. [Google Scholar] [CrossRef]


| Peptide Sequences | Observed Molecular Mass (Da) | Global Charge at pH 7 | GRAVY | Relative Abundance | Peptide Source |
|---|---|---|---|---|---|
| GLDIQK | 672.38 | 0 | −0.5 | 3.5 ± 0.2 | BLG |
| IDALNENK | 915.46 | −1 | −1 | 4.7 ± 0.2 | BLG |
| ALPMHIR | 836.47 | 1 | 0.386 | 6.1 ± 0.2 | BLG |
| LIVTQTMK | 932.53 | 1 | 0.7 | 4.5 ± 0.2 | BLG |
| TKIPAVFK | 902.56 | 2 | 0.4 | 1.4 ±0.5 | BLG |
| TPEVDDEALEK | 1244.58 | −4 | −1.264 | 5.5 ± 0.3 | BLG |
| VLVLDTDYKK | 1192.67 | 0 | −0.1 | 8.1 ± 0.7 | BLG |
| IPAVFK | 673.42 | 1 | 1.3 | BLG | |
| TPEVDDEALEKFDK | 1634.76 | −4 | −1.321 | 2.1 ± 0.1 | BLG |
| VAGTWY | 695.33 | 0 | 0.5 | 12.4 ± 0.3 | BLG |
| VLVLDTDYK | 1064.57 | −1 | 0.344 | 10.2 ± 0.1 | BLG |
| VGINYWLAHK | 1199.65 | 1 | 0.11 | ALA | |
| Not identified | 2905.30 | − | - | 2.1 ± 0.2 | - |
| WENGECAQK + LSFNPTQLEEQCHI | 2719.19 | −1 −2 | −1.7 −0.1 | 3.6 ± 0.4 | BLG |
| Not identified | 1262.66 | - | - | - | |
| Not identified | 2777.20 | - | - | 4.5 ± 0.1 | - |
| VYVEELKPTPEGDLEILLQK | 2312.25 | −3 | −0.3 | 15.1 ± 0.3 | BLG |
| SLAMAASDISLLDAQSAPLR | 2029.05 | −1 | 0.54 | 11.8 ± 0.1 | BLG |
| Not identified | 3313.53 | - | - | 4.2 ± 0.1 | - |
| 5 kDa | 10 kDa | 20 kDa | 50 kDa | 100 kDa | 300 kDa | P-Value | |
|---|---|---|---|---|---|---|---|
| Zeta Potential (mV) | −14.7 ± 1.6a | −9.6 ± 0.6b | −13.6 ± 2.3a | −13.4 ± 0.8a | −11 ± 1.2ab | −11.2 ± 1.6ab | p ≤ 0.038 |
| Roughness (Ra) | 1.0 ± 0.3a | 0.8 ± 0.2a | 1.2 ± 0.10a | 1.0 ± 0.2a | 0.8 ± 0.0a | 1.2 ± 0.2a | p < 0.05 |
| Roughness (Rz) | 7.4 ± 1.5b | 5.5 ± 1.4bc | 10.3 ± 2.4a | 9.0 ± 2.1b | 5.9 ± 0.5ab | 8.1 ± 1.4b | p ≤ 0.045 |
| Thickness (μm) | 186 ± 5ab | 179 ± 12a | 186 ± 8ab | 203 ± 4b | 187 ± 6ab | 221 ± 4c | p ≤ 0.010 |
| Contact Angle (°) | 65 ± 3a | 59 ± 2a | 72 ± 6b | 79 ± 6c | 70 ± 1b | 62 ± 3a | p ≤ 0.041 |
| Hydrophilic Porosity (%) | 77 ± 2a | 100 ± 0c | 100±0c | 84 ± 4b | 85 ± 4ab | 89 ± 4b | p ≤ 0.050 |
| Conductivity (mS/cm) | 4.2 ± 0.2a | 4.8 ± 0.3b | 5.0 ± 0.2b | 6.4 ± 0.2d | 5.7 ± 0.3c | 9.1 ± 0.5e | p ≤ 0.023 |
| Total Porosity (cm3/cm3) | 0.43 ± 0.02a | 0.42 ± 0.02a | 0.47 ± 0.02ab | 0.52 ± 0.05b | 0.52 ± 0.00c | 0.60 ± 0.01c | p ≤ 0.019 |
| Porosity of filtration layer (cm3/cm3) | 0.20 ± 0.01ab | 0.17 ± 0.01a | 0.22 ± 0.03abc | 0.25 ± 0.05bc | 0.27 ± 0.04c | 0.44 ± 0.02d | p ≤ 0.028 |
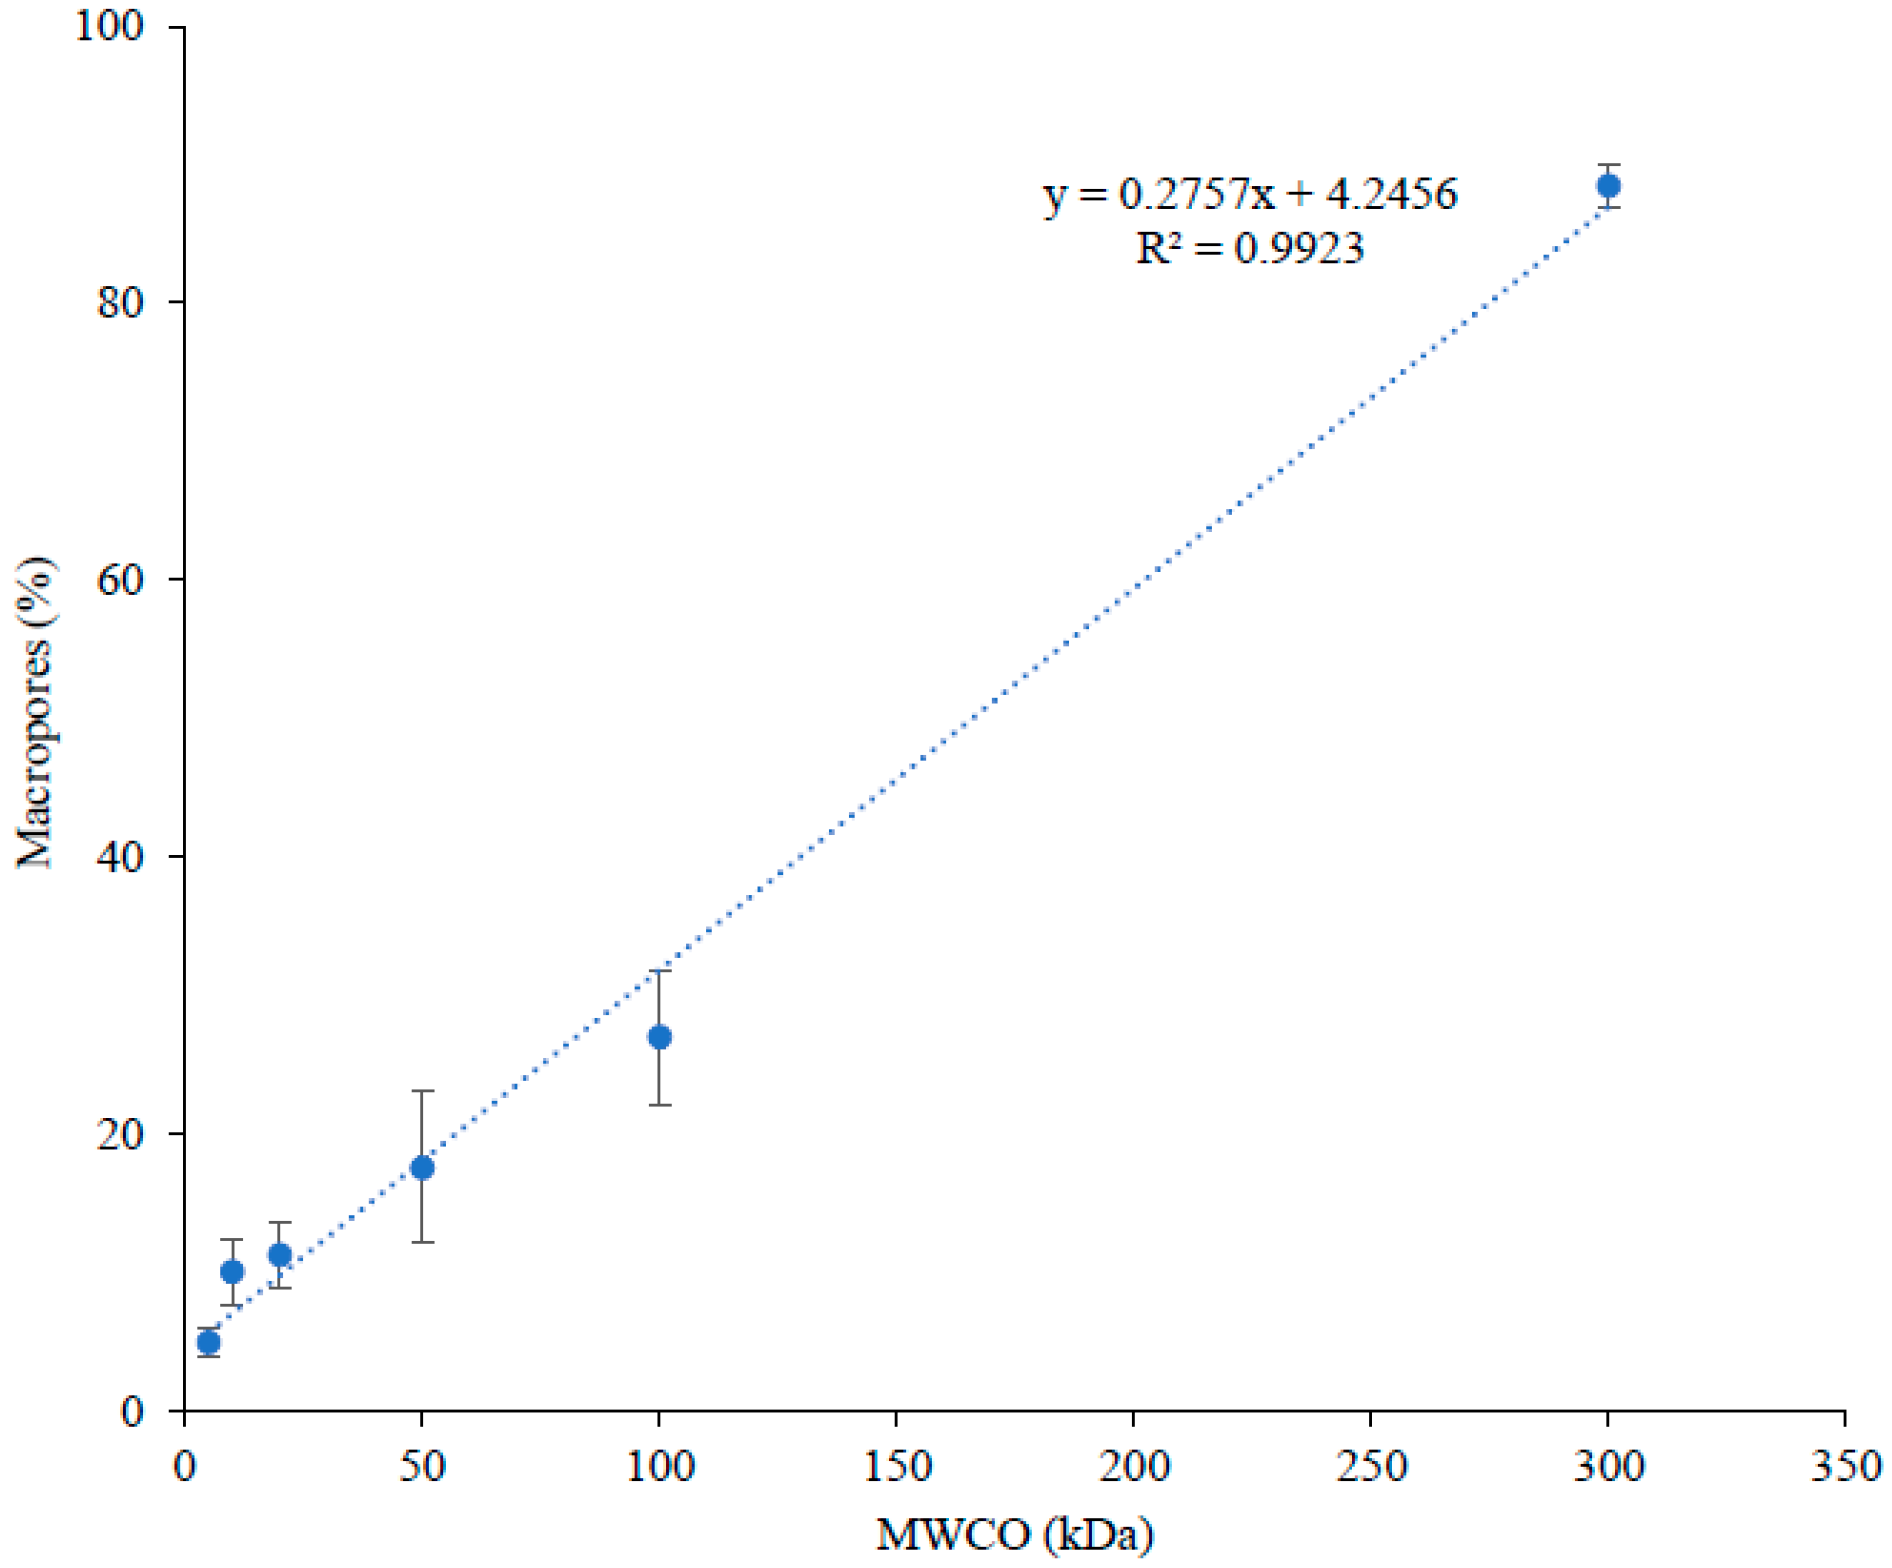
| Macropores in filtration layer (%) | 5 ± 1a | 10 ± 2a | 11 ± 2a | 18 ± 5b | 27 ± 5c | 88 ± 2d | p ≤ 0.046 |
| Peptides (Grouping) | Relative Abundance (%) | |||||
|---|---|---|---|---|---|---|
| 5 kDa | 10 kDa | 20 kDa | 50 kDa | 100 kDa | 300 kDa | |
| IDALNENK (AP1) | 18.9 ± 3.0d | 16.0 ± 1.1c | 14.4 ± 1.9c | 11.4 ± 0.4b | 10.2 ± 0.3ab | 7.9 ± 0.7a |
| VLVLDTDYK (AP1) | 25.7 ± 1.4d | 24.7 ± 0.6d | 11.3 ± 2.2a | 16.3 ± 1.0c | 13.7 ± 0.4b | 11.0 ± 0.2a |
| TPEVDDEALEK (AP2) | 6.6 ± 2.4a | 9.0 ± 0.8a | 14.2 ± 0.1bc | 13.3 ± 1.2b | 16.4 ± 0.6cd | 17.3 ± 1.8d |
| TPEVDDEALEKFDK (AP2) | 2.0 ± 1.2a | 2.1 ± 0.4a | 4.0 ± 0.9b | 2.5 ± 0.4a | 5.0 ± 0.1b | 5.3 ± 0.6b |
| VYVEELKPTPEGDLEILLQK (AP2) | 7.8 ± 3.5a | 10.4 ± 0.7a | 14.1 ± 1.2b | 16.1 ± 1.5b | 17.3 ± 0.3b | 20.5 ± 1.0c |
| SLAMAASDISLLDAQSAPLR (AP3) | 7.3 ± 2.7a | 12.1 ± 2.1a | 8.4 ± 2.3a | 8.5 ± 1.7a | 8.3 ± 1.0a | 9.4 ± 0.9a |
| WENGECVAQK+ LSFNPTQLEEQCHI/Not identified (AP3) | 3.2 ± 0.3a | 4.7 ± 0.5b | 5.2 ± 0.4b | 4.7 ± 0.6b | 4.6 ± 0.8b | 4.4 ± 0.5b |
| VAGTWY | 19.8 ± 6.9c | 10.6 ± 1.1ab | 13.2 ± 3.2bc | 10.7 ± 1.8ab | 9.0 ± 0.8ab | 7.7 ± 0.9a |
| GLDIQK | 5.4 ± 1.6b | 4.0 ± 0.6ab | 3.7 ± 0.8ab | 3.4 ± 0.5a | 3.0 ± 0.1a | 2.5 ± 0.5a |
| Not identified (MW = 2905.30 Da) | 0a | 2.5 ± 0.3b | 2.8 ± 0.4b | 2.6 ± 0.4b | 2.7 ± 0.0b | 2.8 ± 0.4b |
| Not identified (MW = 2777.20 Da) | 3.3 ± 0.5a | 3.9 ± 0.8a | 5.4 ± 0.4bc | 6.4 ± 0.9cd | 6.1 ± 0.3cd | 7.1 ± 0.6d |
| Not identified (MW = 3313.53 Da) | 0a | 3.0 ± 0.7b | 3.2 ± 0.0bc | 4.1 ± 0.4bc | 3.6 ± 0.1c | 4.1 ± 0.3c |
| Peptides (Grouping) | Relative Abundance (%) | |||||
|---|---|---|---|---|---|---|
| 5 kDa | 10 kDa | 20 kDa | 50 kDa | 100 kDa | 300 kDa | |
| IPAVFK (CP1) | 32.6 ± 0.2c | 33.2 ± 2.2c | 30.2 ± 0.4bc | 32.5 ± 2.1c | 27.8 ± 1.2ab | 25.2 ± 0.5a |
| ALPMHIR (CP1) | 28.9 ± 2.4b | 26.1 ± 2.8ab | 25.9 ± 0.5ab | 23.0 ± 2.8a | 23.4 ± 0.9a | 21.2 ± 1.1a |
| LIVTQTMK (CP2) | 2.9 ± 0.7a | 5.0 ± 2.0ab | 6.0 ± 1.6bc | 6.7 ± 0.5bc | 6.8 ± 1.0bc | 8.7 ± 0.7c |
| VLVLDTDYK/ VGINYWLAHK (CP2) | 3.6 ± 0.5a | 4.4 ± 1.4ab | 6.0 ± 0.5bc | 5.5 ± 0.9b | 5.9 ± 0.4bc | 7.4 ± 0.1c |
| TKIPAVFK (CP3) | 10.1 ± 0.2a | 9.8 ± 2.2a | 8.9 ± 0.6a | 7.5 ± 0.7a | 8.4 ± 0.4a | 7.6 ± 0.7a |
| GLDIQK | 4.9 ± 0.1a | 5.2 ± 0.3ab | 5.3 ± 0.4ab | 5.2 ± 0.2ab | 5.9 ± 0.3c | 5.5 ± 0.1bc |
| VAGTWY | 16.9 ± 1.9a | 16.4 ± 2.4a | 17.9 ± 0.7a | 18.2 ± 1.2a | 18.4 ± 0.2a | 19.0 ± 0.1a |
| IDALNENK | 0 | 0 | 0 | 1.3 ± 0.2a | 1.1 ± 0.3a | 1.8 ± 0.4a |
| SLAMAASDISLLDAQSAPLR | 0 | 0 | 0 | 0 | 2.3 ± 0.7a | 3.5 ± 0.3b |
© 2019 by the authors. Licensee MDPI, Basel, Switzerland. This article is an open access article distributed under the terms and conditions of the Creative Commons Attribution (CC BY) license (http://creativecommons.org/licenses/by/4.0/).
Share and Cite
Kadel, S.; Pellerin, G.; Thibodeau, J.; Perreault, V.; Lainé, C.; Bazinet, L. How Molecular Weight Cut-Offs and Physicochemical Properties of Polyether Sulfone Membranes Affect Peptide Migration and Selectivity during Electrodialysis with Filtration Membranes. Membranes 2019, 9, 153. https://doi.org/10.3390/membranes9110153
Kadel S, Pellerin G, Thibodeau J, Perreault V, Lainé C, Bazinet L. How Molecular Weight Cut-Offs and Physicochemical Properties of Polyether Sulfone Membranes Affect Peptide Migration and Selectivity during Electrodialysis with Filtration Membranes. Membranes. 2019; 9(11):153. https://doi.org/10.3390/membranes9110153
Chicago/Turabian StyleKadel, Sabita, Geneviève Pellerin, Jacinthe Thibodeau, Véronique Perreault, Carole Lainé, and Laurent Bazinet. 2019. "How Molecular Weight Cut-Offs and Physicochemical Properties of Polyether Sulfone Membranes Affect Peptide Migration and Selectivity during Electrodialysis with Filtration Membranes" Membranes 9, no. 11: 153. https://doi.org/10.3390/membranes9110153