
Ultrafiltration and Nanofiltration for the Removal of Pharmaceutically Active Compounds from Water: The Effect of Operating Pressure on Electrostatic Solute—Membrane Interactions

 ,
,  and
and
Abstract
:1. Introduction
2. Materials and Methods
2.1. Membranes
2.2. Experimental Procedure
2.3. Analytical Methods
3. Theory
3.1. Evaluation of Concentration Polarization by Film Theory
3.2. Membrane Transport Models
3.2.1. Solution-Diffusion Model
3.2.2. Spiegler–Kedem–Katchalsky Model
- Reflection coefficient (σ), which is responsible for indicating the selectivity of a membrane to a given solute. σ = 1 represents that the membrane is impermeable to the solute (total reflection), while σ = 0 indicates a complete permeation of the solute.
- Solute permeability coefficient (PS), which represents the velocity of solute permeation through the membrane and is characteristic of a given membrane/solute system.
4. Results and Discussion
5. Conclusions
- (i)
- Operating pressure: the higher the operating pressure is, the lower the rejection rate;
- (ii)
- Surface charge of the PhAC: solutes with a negative charge, the same as of the membranes, presented higher rejections than those with a positive charge, despite having similar MW;
- (iii)
- MW of PhAC: among the solutes with a negative charge, the one with the highest MW had the highest rejections.
Supplementary Materials
Author Contributions
Funding
Institutional Review Board Statement
Data Availability Statement
Acknowledgments
Conflicts of Interest
References
- Halden, R.U. Epistemology of Contaminants of Emerging Concern and Literature Meta-Analysis. J. Hazard. Mater. 2015, 282, 2–9. [Google Scholar] [CrossRef] [PubMed]
- Vasantha Raman, N.; Dubey, A.; Millar, E.; Nava, V.; Leoni, B.; Gallego, I. Monitoring Contaminants of Emerging Concern in Aquatic Systems through the Lens of Citizen Science. Sci. Total Environ. 2023, 874, 162527. [Google Scholar] [CrossRef]
- Battaglin, W.A.; Kolok, A. Featured Collection Introduction: Contaminants of Emerging Concern II. JAWRA J. Am. Water Resour. Assoc. 2014, 50, 261–265. [Google Scholar] [CrossRef]
- Chaves, M.d.J.S.; Barbosa, S.C.; Primel, E.G. Emerging Contaminants in Brazilian Aquatic Environment: Identifying Targets of Potential Concern Based on Occurrence and Ecological Risk. Environ. Sci. Pollut. Res. 2021, 28, 67528–67543. [Google Scholar] [CrossRef] [PubMed]
- de Souza, D.I.; Dottein, E.M.; Giacobbo, A.; Rodrigues, M.A.S.; de Pinho, M.N.; Bernardes, A.M. Nanofiltration for the Removal of Norfloxacin from Pharmaceutical Effluent. J. Environ. Chem. Eng. 2018, 6, 6147–6153. [Google Scholar] [CrossRef]
- AL Falahi, O.A.; Abdullah, S.R.S.; Hasan, H.A.; Othman, A.R.; Ewadh, H.M.; Kurniawan, S.B.; Imron, M.F. Occurrence of Pharmaceuticals and Personal Care Products in Domestic Wastewater, Available Treatment Technologies, and Potential Treatment Using Constructed Wetland: A Review. Process Saf. Environ. Prot. 2022, 168, 1067–1088. [Google Scholar] [CrossRef]
- de Souza, D.I.; Giacobbo, A.; da Silva Fernandes, E.; Rodrigues, M.A.S.; de Pinho, M.N.; Bernardes, A.M. Experimental Design as a Tool for Optimizing and Predicting the Nanofiltration Performance by Treating Antibiotic-Containing Wastewater. Membranes 2020, 10, 156. [Google Scholar] [CrossRef] [PubMed]
- Pokkiladathu, H.; Farissi, S.; Sakkarai, A.; Muthuchamy, M. Degradation of Bisphenol A: A Contaminant of Emerging Concern, Using Catalytic Ozonation by Activated Carbon Impregnated Nanocomposite-Bimetallic Catalyst. Environ. Sci. Pollut. Res. 2022, 29, 72417–72430. [Google Scholar] [CrossRef]
- Al-Gheethi, A.; Noman, E.A.; Mohamed, R.; Razi, M.A.M.; Amir Hashim, M.K. Removal of Pharmaceutically Active Compounds from Contaminated Water and Wastewater Using Biochar as Low-Cost Adsorbents, an Overview. In Handbook of Environmental Materials Management; Hussain, C.M., Ed.; Springer International Publishing: Cham, Switzerland, 2019; pp. 951–959. [Google Scholar]
- Ahammad, N.A.; Ahmad, M.A.; Hameed, B.H.; Mohd Din, A.T. A Mini Review of Recent Progress in the Removal of Emerging Contaminants from Pharmaceutical Waste Using Various Adsorbents. Environ. Sci. Pollut. Res. 2022, in press. [CrossRef]
- Lu, H.; Li, Q.; Feng, W.; Zhang, X. Application Progress of O3/PMS Advanced Oxidation Technology in the Treatment of Organic Pollutants in Drinking Water. Sustainability 2022, 14, 11718. [Google Scholar] [CrossRef]
- Pishrafti, H.; Kamani, H.; Mansouri, N.; Hassani, A.H.; Ahmadpanahi, H. Photocatalytic Removal of the Erythromycin Antibiotic Using Fe-Doped TiO2@Fe3O4 Magnetic Nanoparticles: Investigation of Effective Parameters, Process Kinetics and Degradation End Products. Desalin. Water Treat. 2022, 262, 323–337. [Google Scholar] [CrossRef]
- Fonseca Couto, C.; Lange, L.C.; Santos Amaral, M.C. A Critical Review on Membrane Separation Processes Applied to Remove Pharmaceutically Active Compounds from Water and Wastewater. J. Water Process Eng. 2018, 26, 156–175. [Google Scholar] [CrossRef]
- Bai, Y.; Liu, B.; Li, J.; Li, M.; Yao, Z.; Dong, L.; Rao, D.; Zhang, P.; Cao, X.; Francisco Villalobos, L.; et al. Microstructure Optimization of Bioderived Polyester Nanofilms for Antibiotic Desalination via Nanofiltration. Sci. Adv. 2023, 9, eadg6134. [Google Scholar] [CrossRef] [PubMed]
- Giacobbo, A.; Bernardes, A.M. Membrane Separation Process in Wastewater and Water Purification. Membranes 2022, 12, 259. [Google Scholar] [CrossRef] [PubMed]
- Leichtweis, J.; Vieira, Y.; Welter, N.; Silvestri, S.; Dotto, G.L.; Carissimi, E. A Review of the Occurrence, Disposal, Determination, Toxicity and Remediation Technologies of the Tetracycline Antibiotic. Process Saf. Environ. Prot. 2022, 160, 25–40. [Google Scholar] [CrossRef]
- Wang, X.; Li, B.; Zhang, T.; Li, X. Performance of Nanofiltration Membrane in Rejecting Trace Organic Compounds: Experiment and Model Prediction. Desalination 2015, 370, 7–16. [Google Scholar] [CrossRef]
- dos Santos, D.F.; Moreira, W.M.; de Araújo, T.P.; Bergamasco, R.; Ostroski, I.C.; de Barros, M.A.S.D. Non-Conventional Processes Applied for the Removal of Pharmaceutics Compounds in Waters: A Review. Process Saf. Environ. Prot. 2022, 167, 527–542. [Google Scholar] [CrossRef]
- Heo, J.; Flora, J.R.; Her, N.; Park, Y.G.; Cho, J.; Son, A.; Yoon, Y. Removal of Bisphenol A and 17β-Estradiol in Single Walled Carbon Nanotubes–Ultrafiltration (SWNTs–UF) Membrane Systems. Sep. Purif. Technol. 2012, 90, 39–52. [Google Scholar] [CrossRef]
- Shakak, M.; Rezaee, R.; Maleki, A.; Jafari, A.; Safari, M.; Shahmoradi, B.; Daraei, H.; Lee, S.-M. Synthesis and Characterization of Nanocomposite Ultrafiltration Membrane (PSF/PVP/SiO2) and Performance Evaluation for the Removal of Amoxicillin from Aqueous Solutions. Environ. Technol. Innov. 2020, 17, 100529. [Google Scholar] [CrossRef]
- Giacobbo, A.; Soares, E.V.; Bernardes, A.M.; Rosa, M.J.; de Pinho, M.N. Atenolol Removal by Nanofiltration: A Case-Specific Mass Transfer Correlation. Water Sci. Technol. 2020, 81, 210–216. [Google Scholar] [CrossRef]
- Li, C.; Yang, Y.; Liu, Y.; Hou, L. Removal of PhACs and Their Impacts on Membrane Fouling in NF/RO Membrane Filtration of Various Matrices. J. Memb. Sci. 2018, 548, 439–448. [Google Scholar] [CrossRef]
- Bellona, C.; Heil, D.; Yu, C.; Fu, P.; Drewes, J.E. The Pros and Cons of Using Nanofiltration in Lieu of Reverse Osmosis for Indirect Potable Reuse Applications. Sep. Purif. Technol. 2012, 85, 69–76. [Google Scholar] [CrossRef]
- Soares, E.V.; Giacobbo, A.; Rodrigues, M.A.S.; de Pinho, M.N.; Bernardes, A.M. The Effect of PH on Atenolol/Nanofiltration Membranes Affinity. Membranes 2021, 11, 689. [Google Scholar] [CrossRef] [PubMed]
- Licona, K.P.M.; Geaquinto, L.D.O.; Nicolini, J.V.; Figueiredo, N.G.; Chiapetta, S.C.; Habert, A.C.; Yokoyama, L. Assessing Potential of Nanofiltration and Reverse Osmosis for Removal of Toxic Pharmaceuticals from Water. J. Water Process Eng. 2018, 25, 195–204. [Google Scholar] [CrossRef]
- Nghiem, L.D.; Schäfer, A.I.; Elimelech, M. Role of Electrostatic Interactions in the Retention of Pharmaceutically Active Contaminants by a Loose Nanofiltration Membrane. J. Memb. Sci. 2006, 286, 52–59. [Google Scholar] [CrossRef]
- Taheri, E.; Hadi, S.; Amin, M.M.; Ebrahimi, A.; Fatehizadeh, A.; Aminabhavi, T.M. Retention of Atenolol from Single and Binary Aqueous Solutions by Thin Film Composite Nanofiltration Membrane: Transport Modeling and Pore Radius Estimation. J. Environ. Manag. 2020, 271, 111005. [Google Scholar] [CrossRef] [PubMed]
- Yoon, Y.; Westerhoff, P.; Yoon, J.; Snyder, S.A. Removal of 17β Estradiol and Fluoranthene by Nanofiltration and Ultrafiltration. J. Environ. Eng. 2004, 130, 1460–1467. [Google Scholar] [CrossRef]
- Viegas, R.M.C.; Mestre, A.S.; Mesquita, E.; Machuqueiro, M.; Andrade, M.A.; Carvalho, A.P.; Rosa, M.J. Key Factors for Activated Carbon Adsorption of Pharmaceutical Compounds from Wastewaters: A Multivariate Modelling Approach. Water 2022, 14, 166. [Google Scholar] [CrossRef]
- Naddeo, V.; Secondes, M.F.N.; Borea, L.; Hasan, S.W.; Ballesteros, F.; Belgiorno, V. Removal of Contaminants of Emerging Concern from Real Wastewater by an Innovative Hybrid Membrane Process—UltraSound, Adsorption, and Membrane Ultrafiltration (USAMe®). Ultrason. Sonochem. 2020, 68, 105237. [Google Scholar] [CrossRef] [PubMed]
- Viegas, R.M.C.; Mesquita, E.; Campinas, M.; Rosa, M.J. Pilot Studies and Cost Analysis of Hybrid Powdered Activated Carbon/Ceramic Microfiltration for Controlling Pharmaceutical Compounds and Organic Matter in Water Reclamation. Water 2020, 12, 33. [Google Scholar] [CrossRef]
- Du, Y.; Pramanik, B.K.; Zhang, Y.; Jegatheesan, V. Influence of Molecular Weight Cut-off (MWCO) of Commercial Ultrafiltration Substrate on the Performance of Thin Film Composite Nanofiltration Membrane. Desalination 2022, 541, 116020. [Google Scholar] [CrossRef]
- Nghiem, L.D.; Schäfer, A.I.; Elimelech, M. Pharmaceutical Retention Mechanisms by Nanofiltration Membranes. Environ. Sci. Technol. 2005, 39, 7698–7705. [Google Scholar] [CrossRef] [PubMed]
- Liu, Y.L.; Wang, X.; Yang, H.; Xie, Y.F. Quantifying the Influence of Solute-Membrane Interactions on Adsorption and Rejection of Pharmaceuticals by NF/RO Membranes. J. Memb. Sci. 2018, 551, 37–46. [Google Scholar] [CrossRef]
- Babayev, M.; Du, H.; Botlaguduru, V.S.V.; Kommalapati, R.R. Zwitterion-Modified Ultrafiltration Membranes for Permian Basin Produced Water Pretreatment. Water 2019, 11, 1710. [Google Scholar] [CrossRef]
- Giacobbo, A.; Oliveira, M.; Duarte, E.C.N.F.; Mira, H.M.C.; Bernardes, A.M.; de Pinho, M.N. Ultrafiltration Based Process for the Recovery of Polysaccharides and Polyphenols from Winery Effluents. Sep. Sci. Technol. 2013, 48, 438–444. [Google Scholar] [CrossRef]
- da Trindade, C.D.M.; Giacobbo, A.; Ferreira, V.G.; Rodrigues, M.A.S.; Bernardes, A.M. Membrane Separation Processes Applied to the Treatment of Effluents from Nanoceramic Coating Operations. Desalin. Water Treat. 2015, 55, 28–38. [Google Scholar] [CrossRef]
- Fick, J.; Söderström, H.; Lindberg, R.H.; Phan, C.; Tysklind, M.; Larsson, D.G.J. Contamination of Surface, Ground, and Drinking Water from Pharmaceutical Production. Environ. Toxicol. Chem. 2009, 28, 2522–2527. [Google Scholar] [CrossRef]
- Brooks, M. 100 Best-Selling, Most Prescribed Branded Drugs through June. Available online: http://www.medscape.com/viewarticle/849457#vp_1 (accessed on 12 June 2022).
- Sabidó, M.; Hohenberger, T.; Grassi, G. Pharmacological Intervention in Hypertension Using Beta-Blockers: Real-world Evidence for Long-Term Effectiveness. Pharmacol. Res. 2018, 130, 191–197. [Google Scholar] [CrossRef]
- Montagner, C.C.; Sodré, F.F.; Acayaba, R.D.; Vidal, C.; Campestrini, I.; Locatelli, M.A.; Pescara, I.C.; Albuquerque, A.F.; Umbuzeiro, G.A.; Jardim, W.F. Ten Years-Snapshot of the Occurrence of Emerging Contaminants in Drinking, Surface and Ground Waters and Wastewaters from São Paulo State, Brazil. J. Braz. Chem. Soc. 2019, 30, 614–632. [Google Scholar] [CrossRef]
- Wang, J.; Zhuan, R.; Chu, L. The Occurrence, Distribution and Degradation of Antibiotics by Ionizing Radiation: An Overview. Sci. Total Environ. 2019, 646, 1385–1397. [Google Scholar] [CrossRef]
- DrugBank. Properties of Atenolol Reported in DrugBank. Available online: https://go.drugbank.com/drugs/DB00335 (accessed on 27 June 2022).
- DrugBank. Properties of Sulfamethoxazole Reported in DrugBank. Available online: https://go.drugbank.com/drugs/DB01015 (accessed on 27 June 2022).
- DrugBank. Properties of Rosuvastatin Reported in DrugBank. Available online: https://go.drugbank.com/drugs/DB01098 (accessed on 27 June 2022).
- Hussain, A.; Afzal, O.; Yasmin, S.; Haider, N.; Altamimi, A.S.A.; Martinez, F.; Acree, W.E.; Ramzan, M. Preferential Solvation Study of Rosuvastatin in the {PEG400 (1) + Water (2)} Cosolvent Mixture and GastroPlus Software-Based In Vivo Predictions. ACS Omega 2023, 8, 12761–12772. [Google Scholar] [CrossRef]
- Bird, R.B.; Stewart, W.E.; Lightfoot, E.N. Transport Phenomena; John Wiley and Sons, Inc.: New York, NY, USA, 1960. [Google Scholar]
- Giacobbo, A.; Bernardes, A.M.; Rosa, M.J.; de Pinho, M.N. Concentration Polarization in Ultrafiltration/Nanofiltration for the Recovery of Polyphenols from Winery Wastewaters. Membranes 2018, 8, 46. [Google Scholar] [CrossRef] [PubMed]
- Uragami, T. Fundamentals of Membrane Transport Phenomena. In Science and Technology of Separation Membranes; John Wiley and Sons, Inc.: New York, NY, USA, 2017. [Google Scholar]
- Wijmans, J.G.; Baker, R.W. The Solution-Diffusion Model: A Review. J. Memb. Sci. 1995, 107, 1–21. [Google Scholar] [CrossRef]
- Shah, I.A.; Ali, S.; Yang, Z.; Ihsanullah, I.; Huang, H. Effects of Water Matrix on the Rejection of Neutral Pharmaceutically Active Compound by Thin-Film Composite Nanofiltration and Reverse Osmosis Membranes. Chemosphere 2022, 303, 135211. [Google Scholar] [CrossRef] [PubMed]
- Kong, F.X.; Yang, H.W.; Wu, Y.Q.; Wang, X.M.; Xie, Y.F. Rejection of Pharmaceuticals during Forward Osmosis and Prediction by Using the Solution-Diffusion Model. J. Memb. Sci. 2015, 476, 410–420. [Google Scholar] [CrossRef]
- Yang, Y.; Li, C.; Hou, L. Impact of Dead Cells on Biofouling and Pharmaceutically Active Compounds Retention by NF/RO Membranes. Chem. Eng. J. 2018, 337, 51–59. [Google Scholar] [CrossRef]
- Hidalgo, A.M.; Gómez, M.; Murcia, M.D.; Gómez, E.; León, G.; Sánchez, A. Removal of Anilinic Compounds Using the NF-97 Membrane: Application of the Solution-Diffusion and SKK Models. Sep. Sci. Technol. 2016, 51, 2429–2439. [Google Scholar] [CrossRef]
- Hidalgo, A.M.; León, G.; Gómez, M.; Murcia, M.D.; Gómez, E.; Macario, J.A. Removal of Different Dye Solutions: A Comparison Study Using a Polyamide Nf Membrane. Membranes 2020, 10, 408. [Google Scholar] [CrossRef]
- Koter, S. Determination of the Parameters of the Spiegler-Kedem-Katchalsky Model for Nanofiltration of Single Electrolyte Solutions. Desalination 2006, 198, 335–345. [Google Scholar] [CrossRef]
- Nair, R.R.; Protasova, E.; Strand, S.; Bilstad, T. Implementation of Spiegler–Kedem and Steric Hindrance Pore Models for Analyzing Nanofiltration Membrane Performance for Smart Water Production. Membranes 2018, 8, 78. [Google Scholar] [CrossRef]
- Wu, F.; Feng, L.; Zhang, L. Rejection Prediction of Isopropylantipyrine and Antipyrine by Nanofiltration Membranes Based on the Spiegler-Kedem-Katchalsky Model. Desalination 2015, 362, 11–17. [Google Scholar] [CrossRef]
- Najjar, A.; Sabri, S.; Al-Gaashani, R.; Atieh, M.A.; Kochkodan, V. Antibiofouling Performance by Polyethersulfone Membranes Cast with Oxidized Multiwalled Carbon Nanotubes and Arabic Gum. Membranes 2019, 9, 32. [Google Scholar] [CrossRef] [PubMed]
- Goulas, A.K.; Kapasakalidis, P.G.; Sinclair, H.R.; Rastall, R.A.; Grandison, A.S. Purification of Oligosaccharides by Nanofiltration. J. Memb. Sci. 2002, 209, 321–335. [Google Scholar] [CrossRef]
- Ainscough, T.J.; Oatley-Radcliffe, D.L.; Barron, A.R. Groundwater Remediation of Volatile Organic Compounds Using Nanofiltration and Reverse Osmosis Membranes—A Field Study. Membranes 2021, 11, 61. [Google Scholar] [CrossRef] [PubMed]
- Nakatsuka, S.; Michaels, A.S. Transport and Separation of Proteins by Ultrafiltration through Sorptive and Non-Sorptive Membranes. J. Memb. Sci. 1992, 69, 189–211. [Google Scholar] [CrossRef]


| Parameter | Membrane Type | |||
|---|---|---|---|---|
| ST | XT | NF270 | NF90 | |
| Membrane active layer | Polyethersulfone a | Polyethersulfone a | Semi-aromatic Polyamide a,d | Fully aromatic Polyamide a,d |
| MWCO (Da) | 10,000 a | 1000 a | 400 f | 200 f |
| pH operating range | 3–9 a | 3–9 a | 3–10 a | 2–11 a |
| Maximum operating pressure (bar) | 8.3 a | 8.3 a | 41 a | 41 a |
| Zeta potential at pH 7 (mV) | n.a. | −20 e | −22 c; −29 d | −25 c; −32 d |
| Contact angle (°) | 72.2 b | 63.5 b | 54.3 d | 61.6 d |
| Pore radius (nm) | 7.84 b | 5.88 b | 0.44 d | 0.36 d |
| Manufacturer | Synder Filtration | Synder Filtration | Dow—FilmTec | Dow—FilmTec |
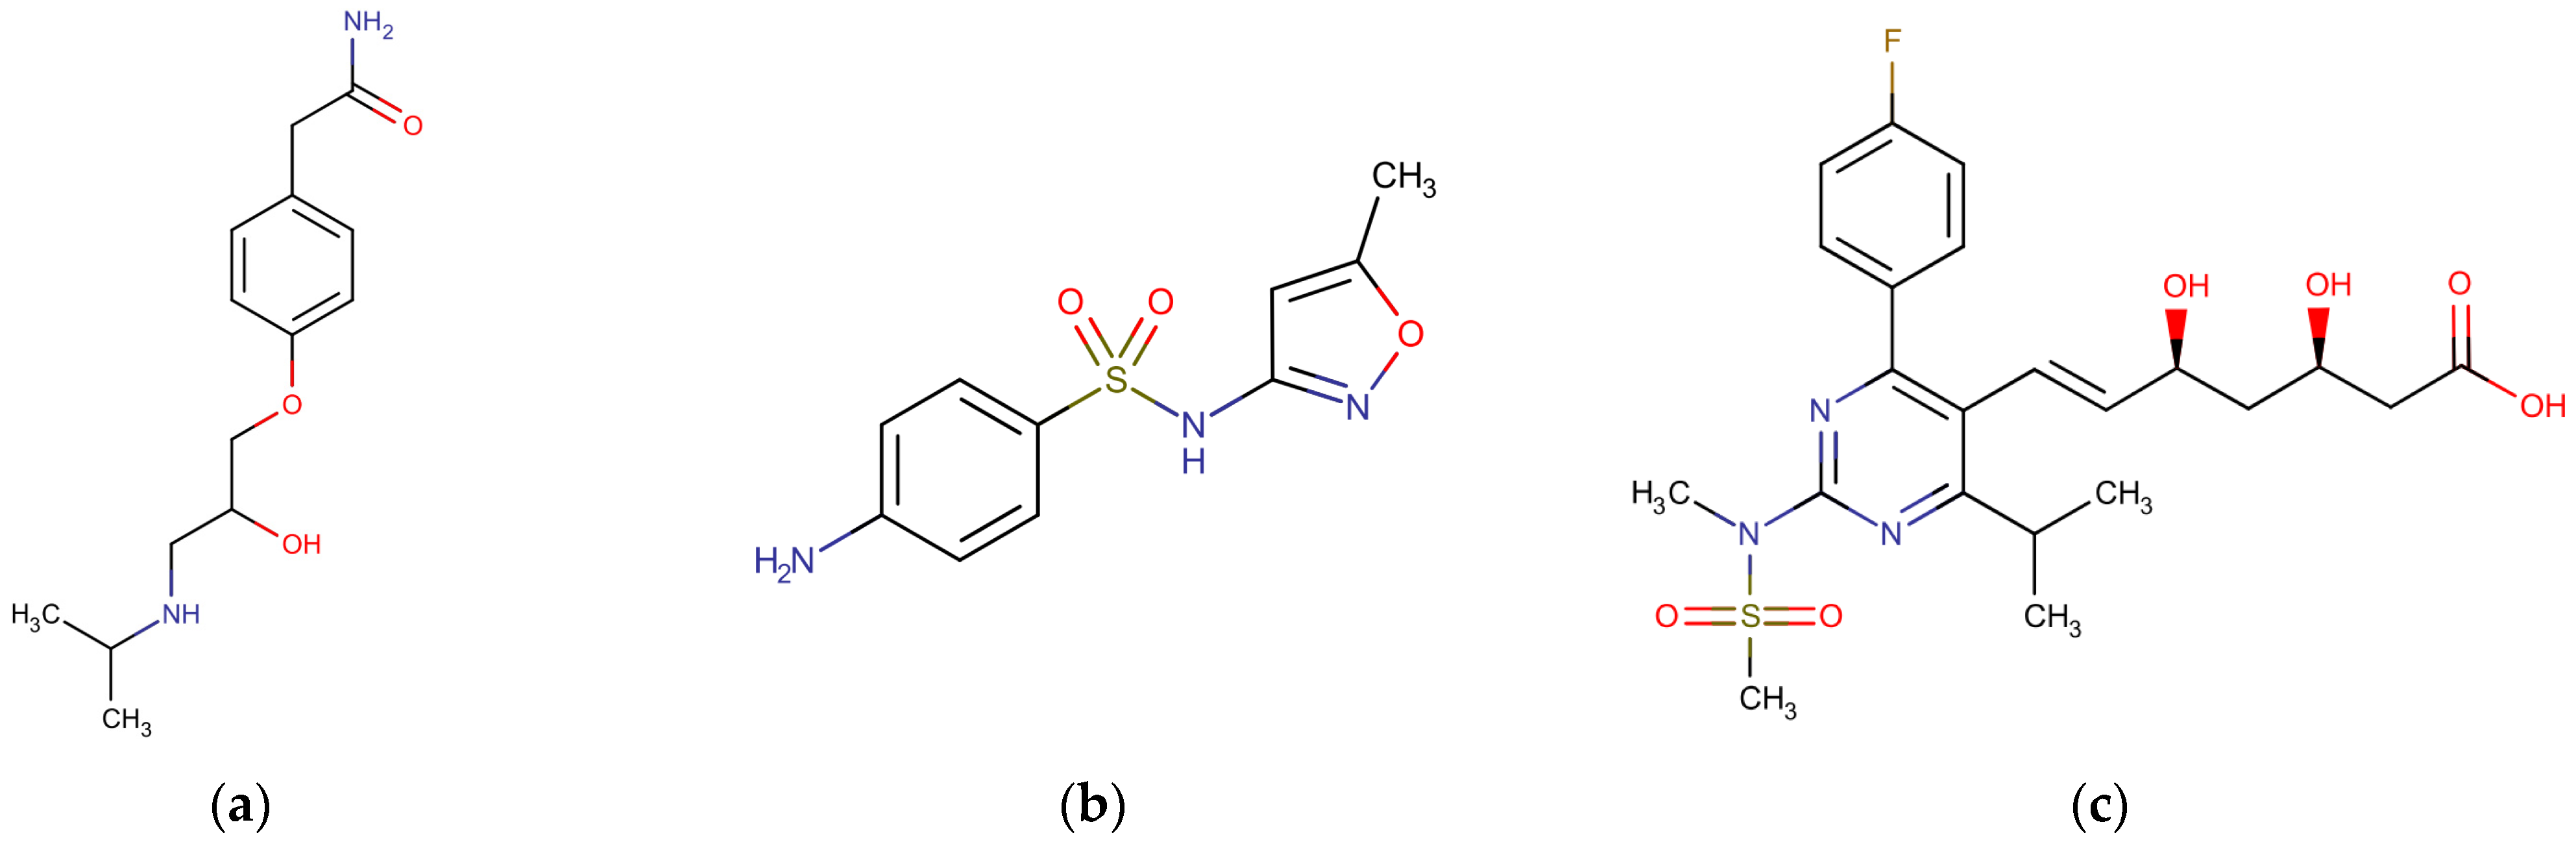
| Physicochemical Characteristic | ATN | SMX | ROS |
|---|---|---|---|
| Molecular formula | C14H22N2O3 a | C10H11N3O3S b | C22H28FN3O6S c |
| Molecular weight (Da) | 266 a | 253 b | 482 c |
| pKa | 9.6 a | 1.97; 6.16 b | 4.0 c |
| log KOW | 0.16 a | 0.89 b | 0.13 c |
| D (×10−10 m2 s−1, 25 °C) | 5.25 d | 6.17 d | 4.91 f |
| Stokes radius (nm) | 0.46 d | 0.40 d | 0.50 e |
| Surface charge at pH 7 | +1 a | −1 b | −1 c |
| Membrane | ATN | SMX | ROS | |||
|---|---|---|---|---|---|---|
| k × 10−5 (m s−1) | R′ (%) | k × 10−5 (m s−1) | R′ (%) | k × 10−5 (m s−1) | R′ (%) | |
| NF90 | 3.75 | 88 | 2.87 | 97 | 2.66 | 99 |
| NF270 | 3.51 | 77 | 18.4 | 80 | 3.65 | 96 |
| XT | 1.77 | 38 | 2.17 | 69 | 2.05 | 90 |
| ST | 1.98 | 57 | 2.57 | 62 | 2.48 | 86 |
Disclaimer/Publisher’s Note: The statements, opinions and data contained in all publications are solely those of the individual author(s) and contributor(s) and not of MDPI and/or the editor(s). MDPI and/or the editor(s) disclaim responsibility for any injury to people or property resulting from any ideas, methods, instructions or products referred to in the content. |
© 2023 by the authors. Licensee MDPI, Basel, Switzerland. This article is an open access article distributed under the terms and conditions of the Creative Commons Attribution (CC BY) license (https://creativecommons.org/licenses/by/4.0/).
Share and Cite
Giacobbo, A.; Pasqualotto, I.F.; Machado Filho, R.C.d.C.; Minhalma, M.; Bernardes, A.M.; Pinho, M.N.d. Ultrafiltration and Nanofiltration for the Removal of Pharmaceutically Active Compounds from Water: The Effect of Operating Pressure on Electrostatic Solute—Membrane Interactions. Membranes 2023, 13, 743. https://doi.org/10.3390/membranes13080743
Giacobbo A, Pasqualotto IF, Machado Filho RCdC, Minhalma M, Bernardes AM, Pinho MNd. Ultrafiltration and Nanofiltration for the Removal of Pharmaceutically Active Compounds from Water: The Effect of Operating Pressure on Electrostatic Solute—Membrane Interactions. Membranes. 2023; 13(8):743. https://doi.org/10.3390/membranes13080743
Chicago/Turabian StyleGiacobbo, Alexandre, Isabella Franco Pasqualotto, Rafael Cabeleira de Coronel Machado Filho, Miguel Minhalma, Andréa Moura Bernardes, and Maria Norberta de Pinho. 2023. "Ultrafiltration and Nanofiltration for the Removal of Pharmaceutically Active Compounds from Water: The Effect of Operating Pressure on Electrostatic Solute—Membrane Interactions" Membranes 13, no. 8: 743. https://doi.org/10.3390/membranes13080743