
Date Palm Tree Leaf-Derived Cellulose Nanocrystal Incorporated Thin-Film Composite forward Osmosis Membranes for Produced Water Treatment


Abstract
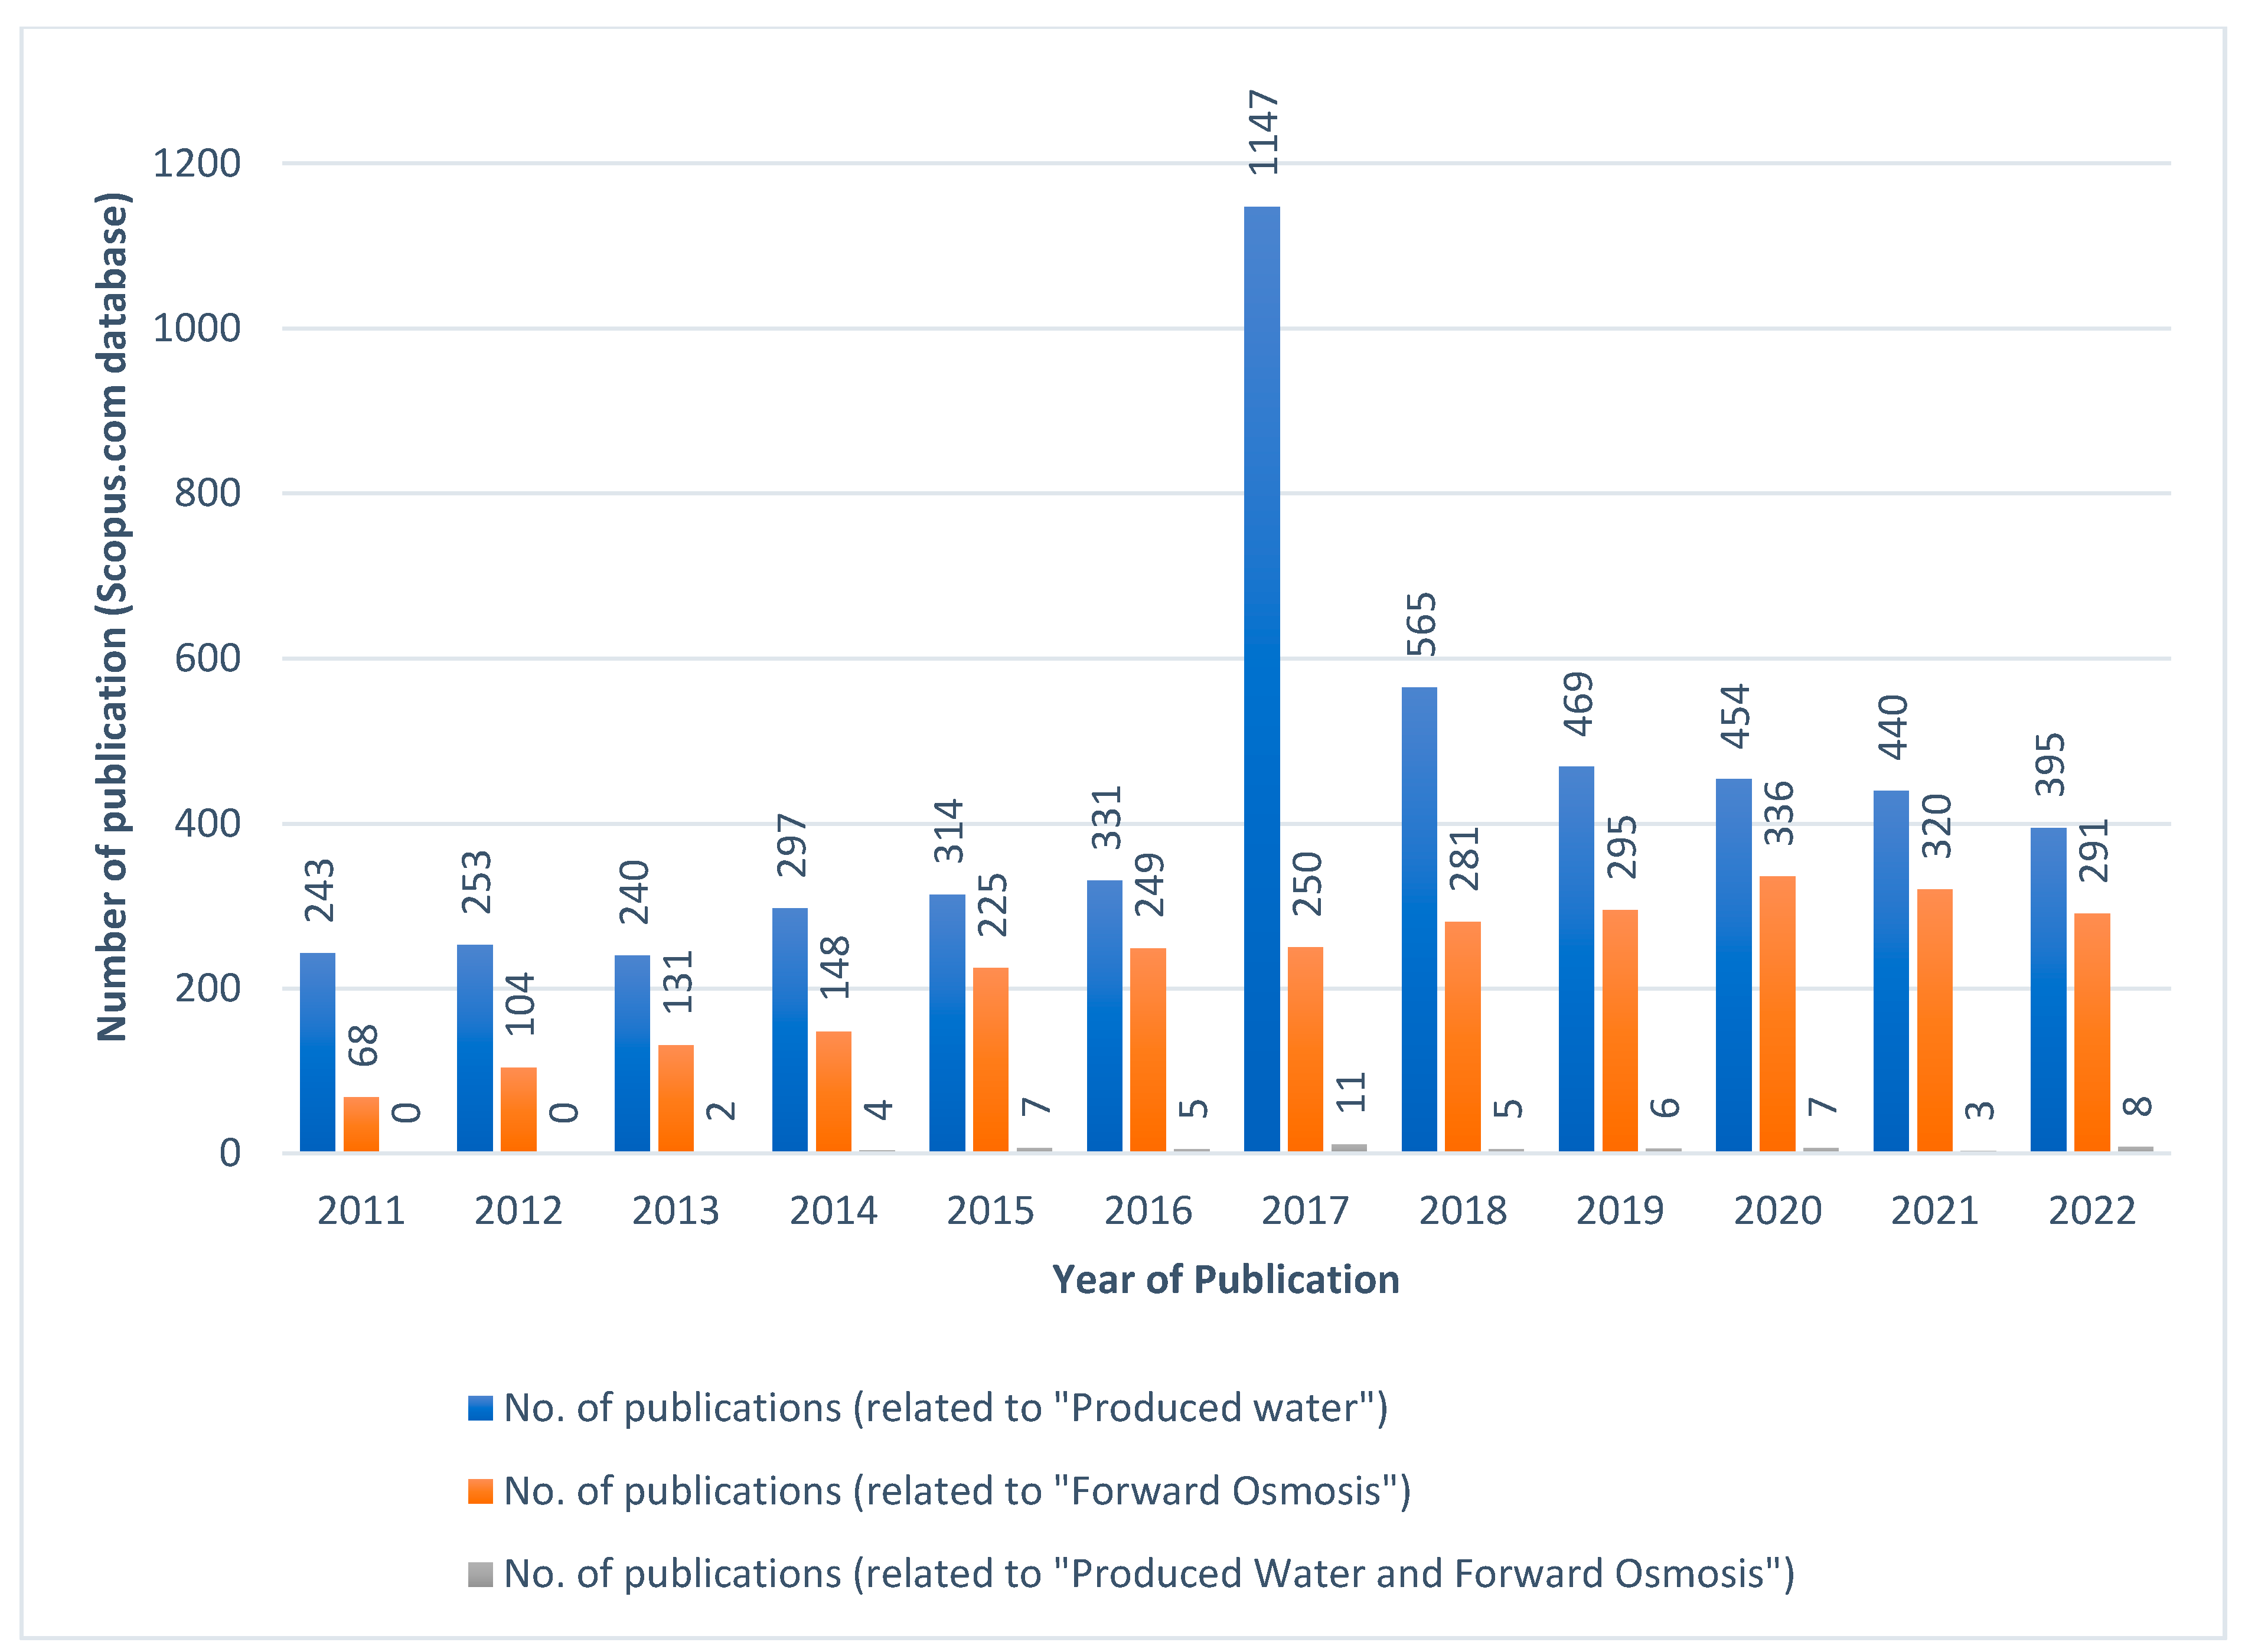
:1. Introduction
2. Experimental Section
2.1. Materials
2.2. Synthesis of CNC from Palm Tree Leaves
2.3. Developing the Membrane
2.4. Characterization of the Developed Cellulose Nanocrystals and Modified Membranes
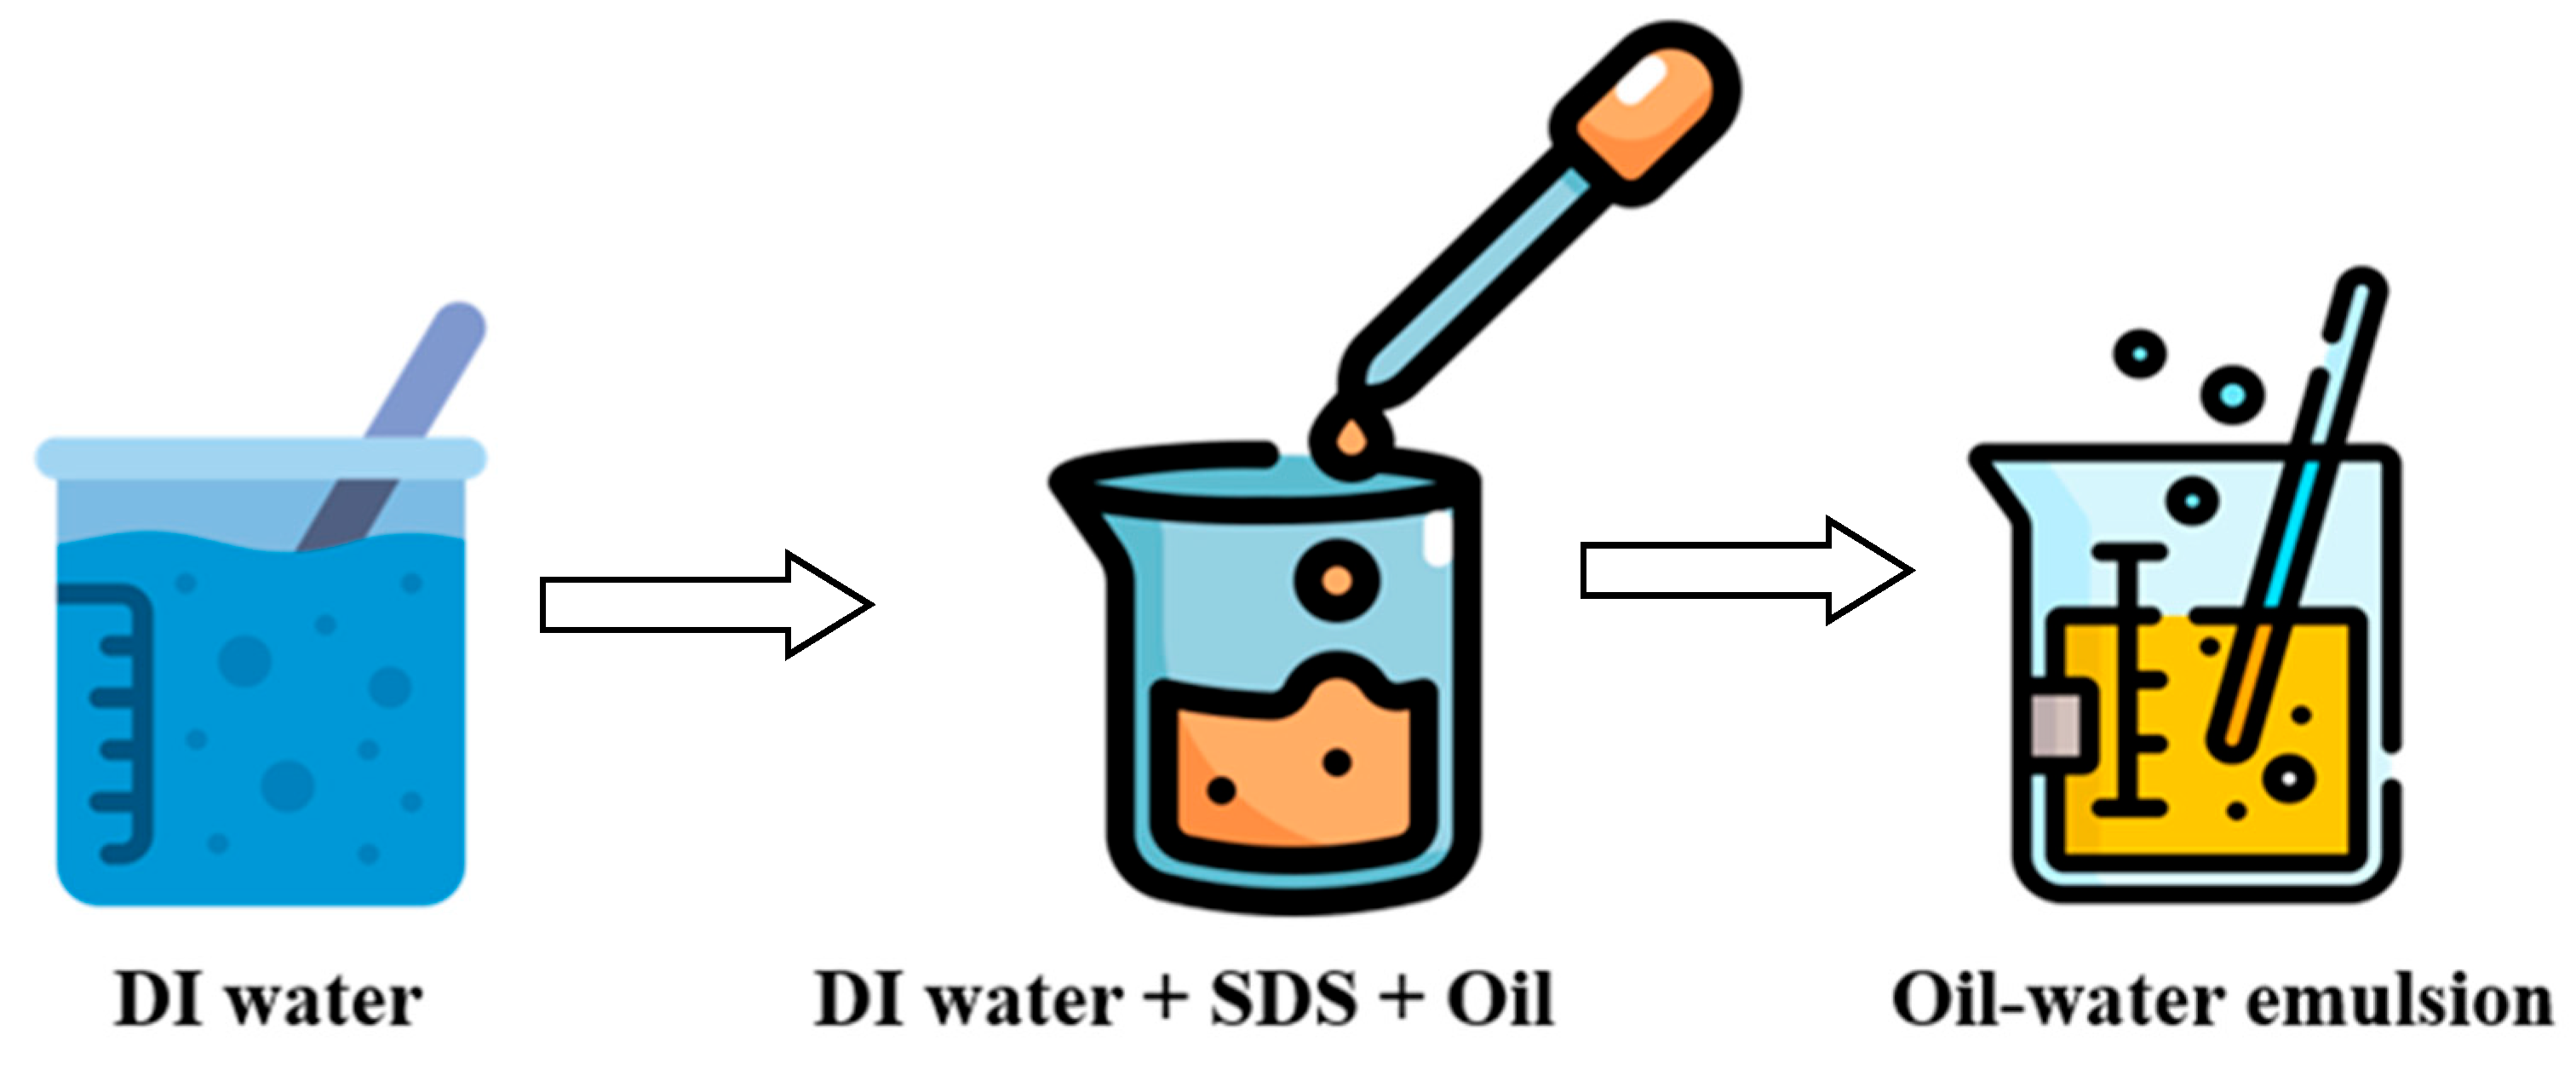
2.5. Preparation of Synthetic PW
2.6. Membrane Porosity, Thickness
2.7. Pure Water Permeability (A), Salt Permeability (B), Salt Rejection (Rs, %) and Oil Rejection (Ro, %)
2.8. FO Setup and Experiment (Water Flux, Reverse Salt Flux, Oil Flux)
2.9. Forward Osmosis Experimental Results Validation
3. Result and Discussion
3.1. Characterization of the Developed Cellulose Nanocrystals
3.1.1. FTIR Analysis
3.1.2. XRD Analysis
3.1.3. TEM Analysis
3.2. Membrane Characterization
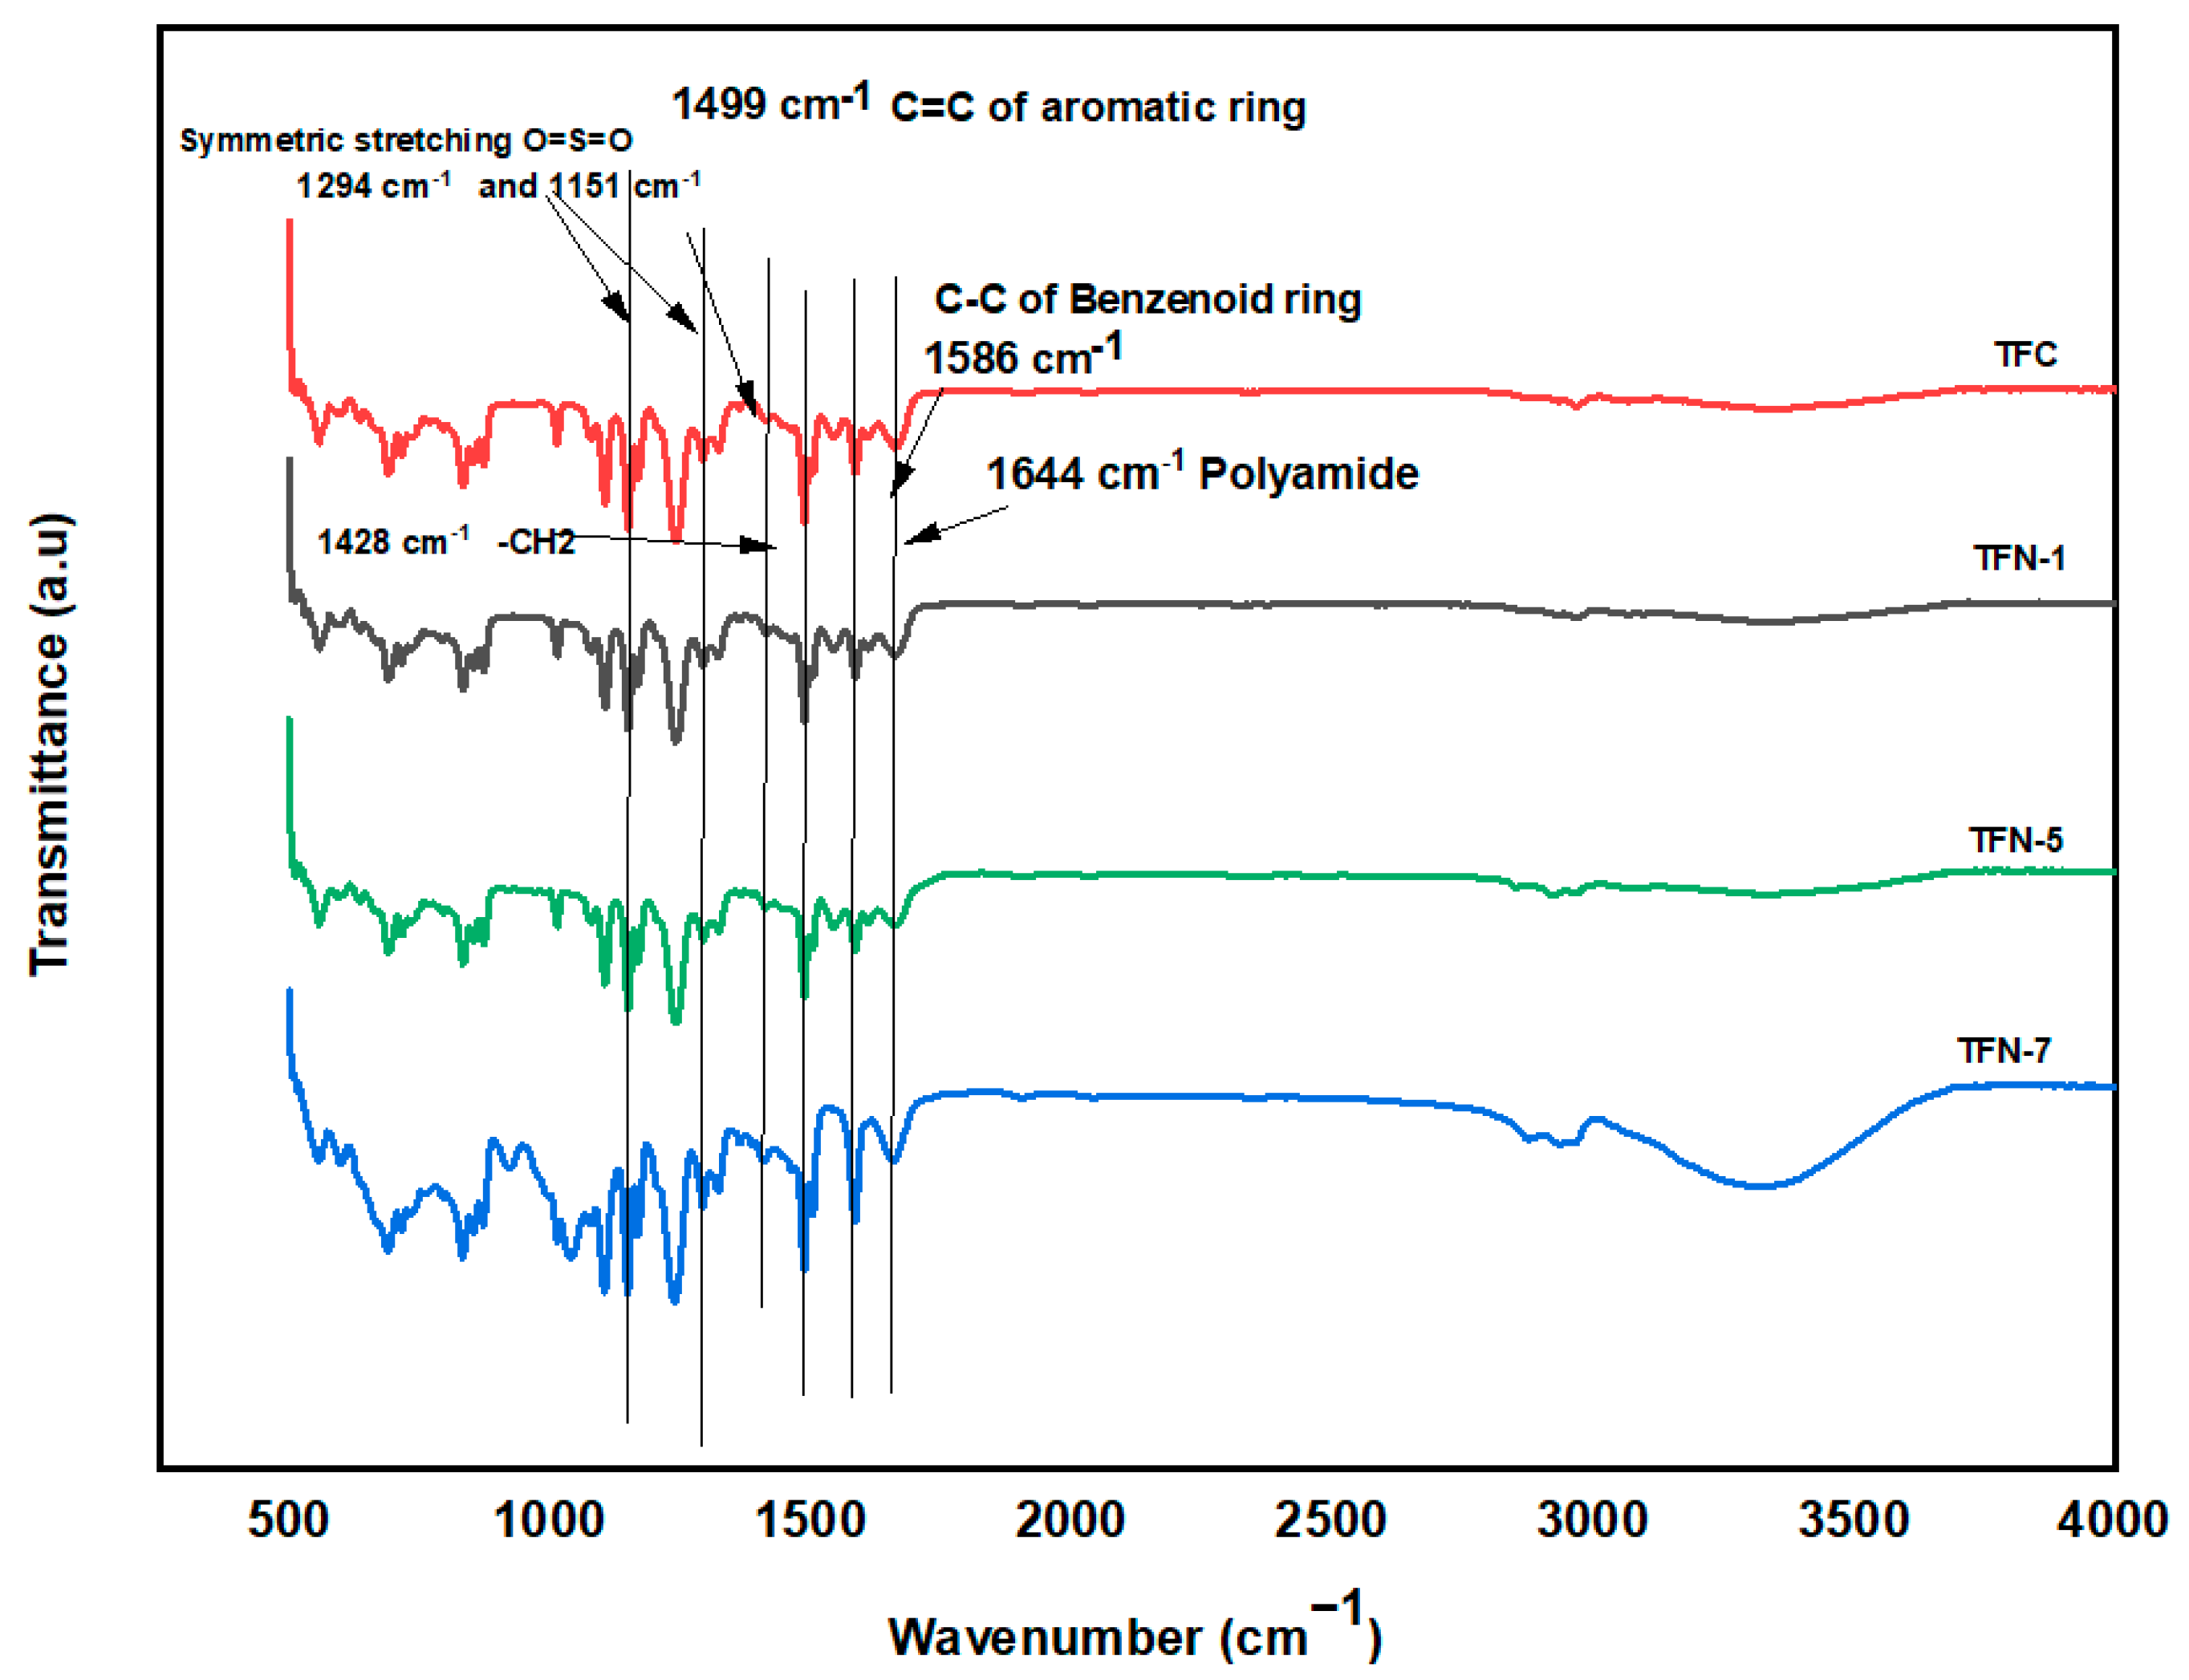
3.2.1. FTIR Analysis
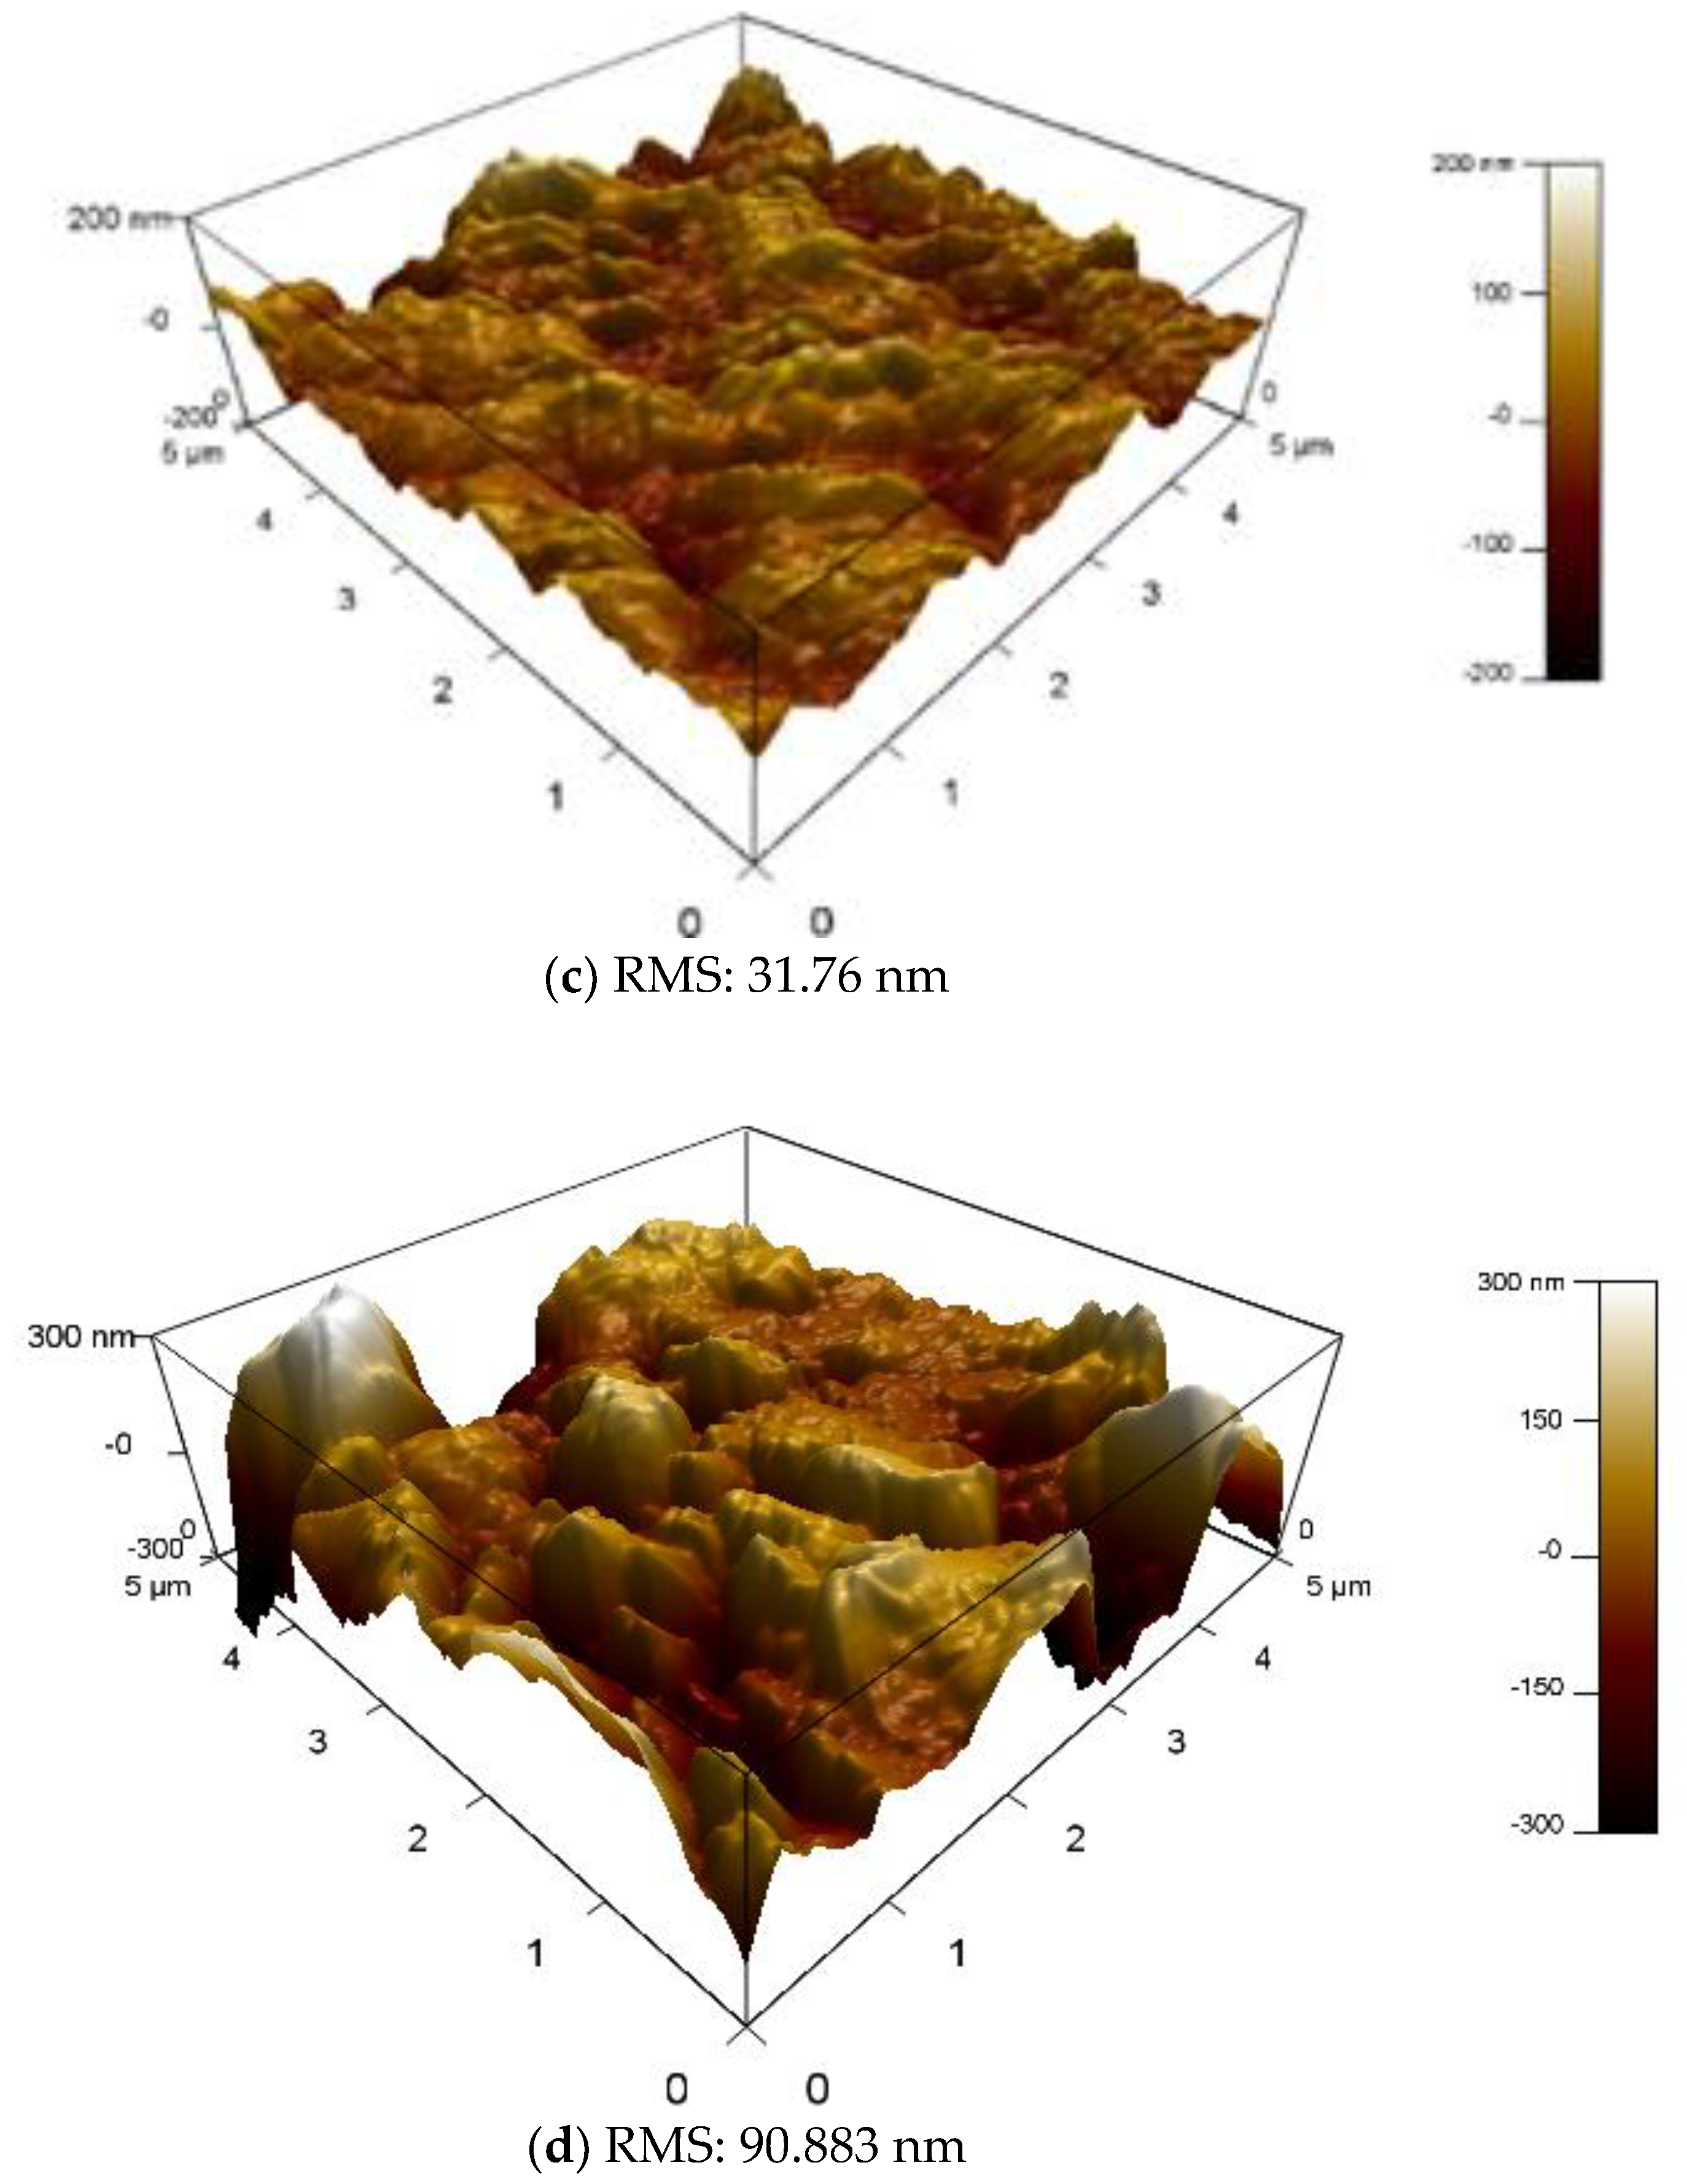
3.2.2. AFM Results
3.2.3. Contact Angle Analysis
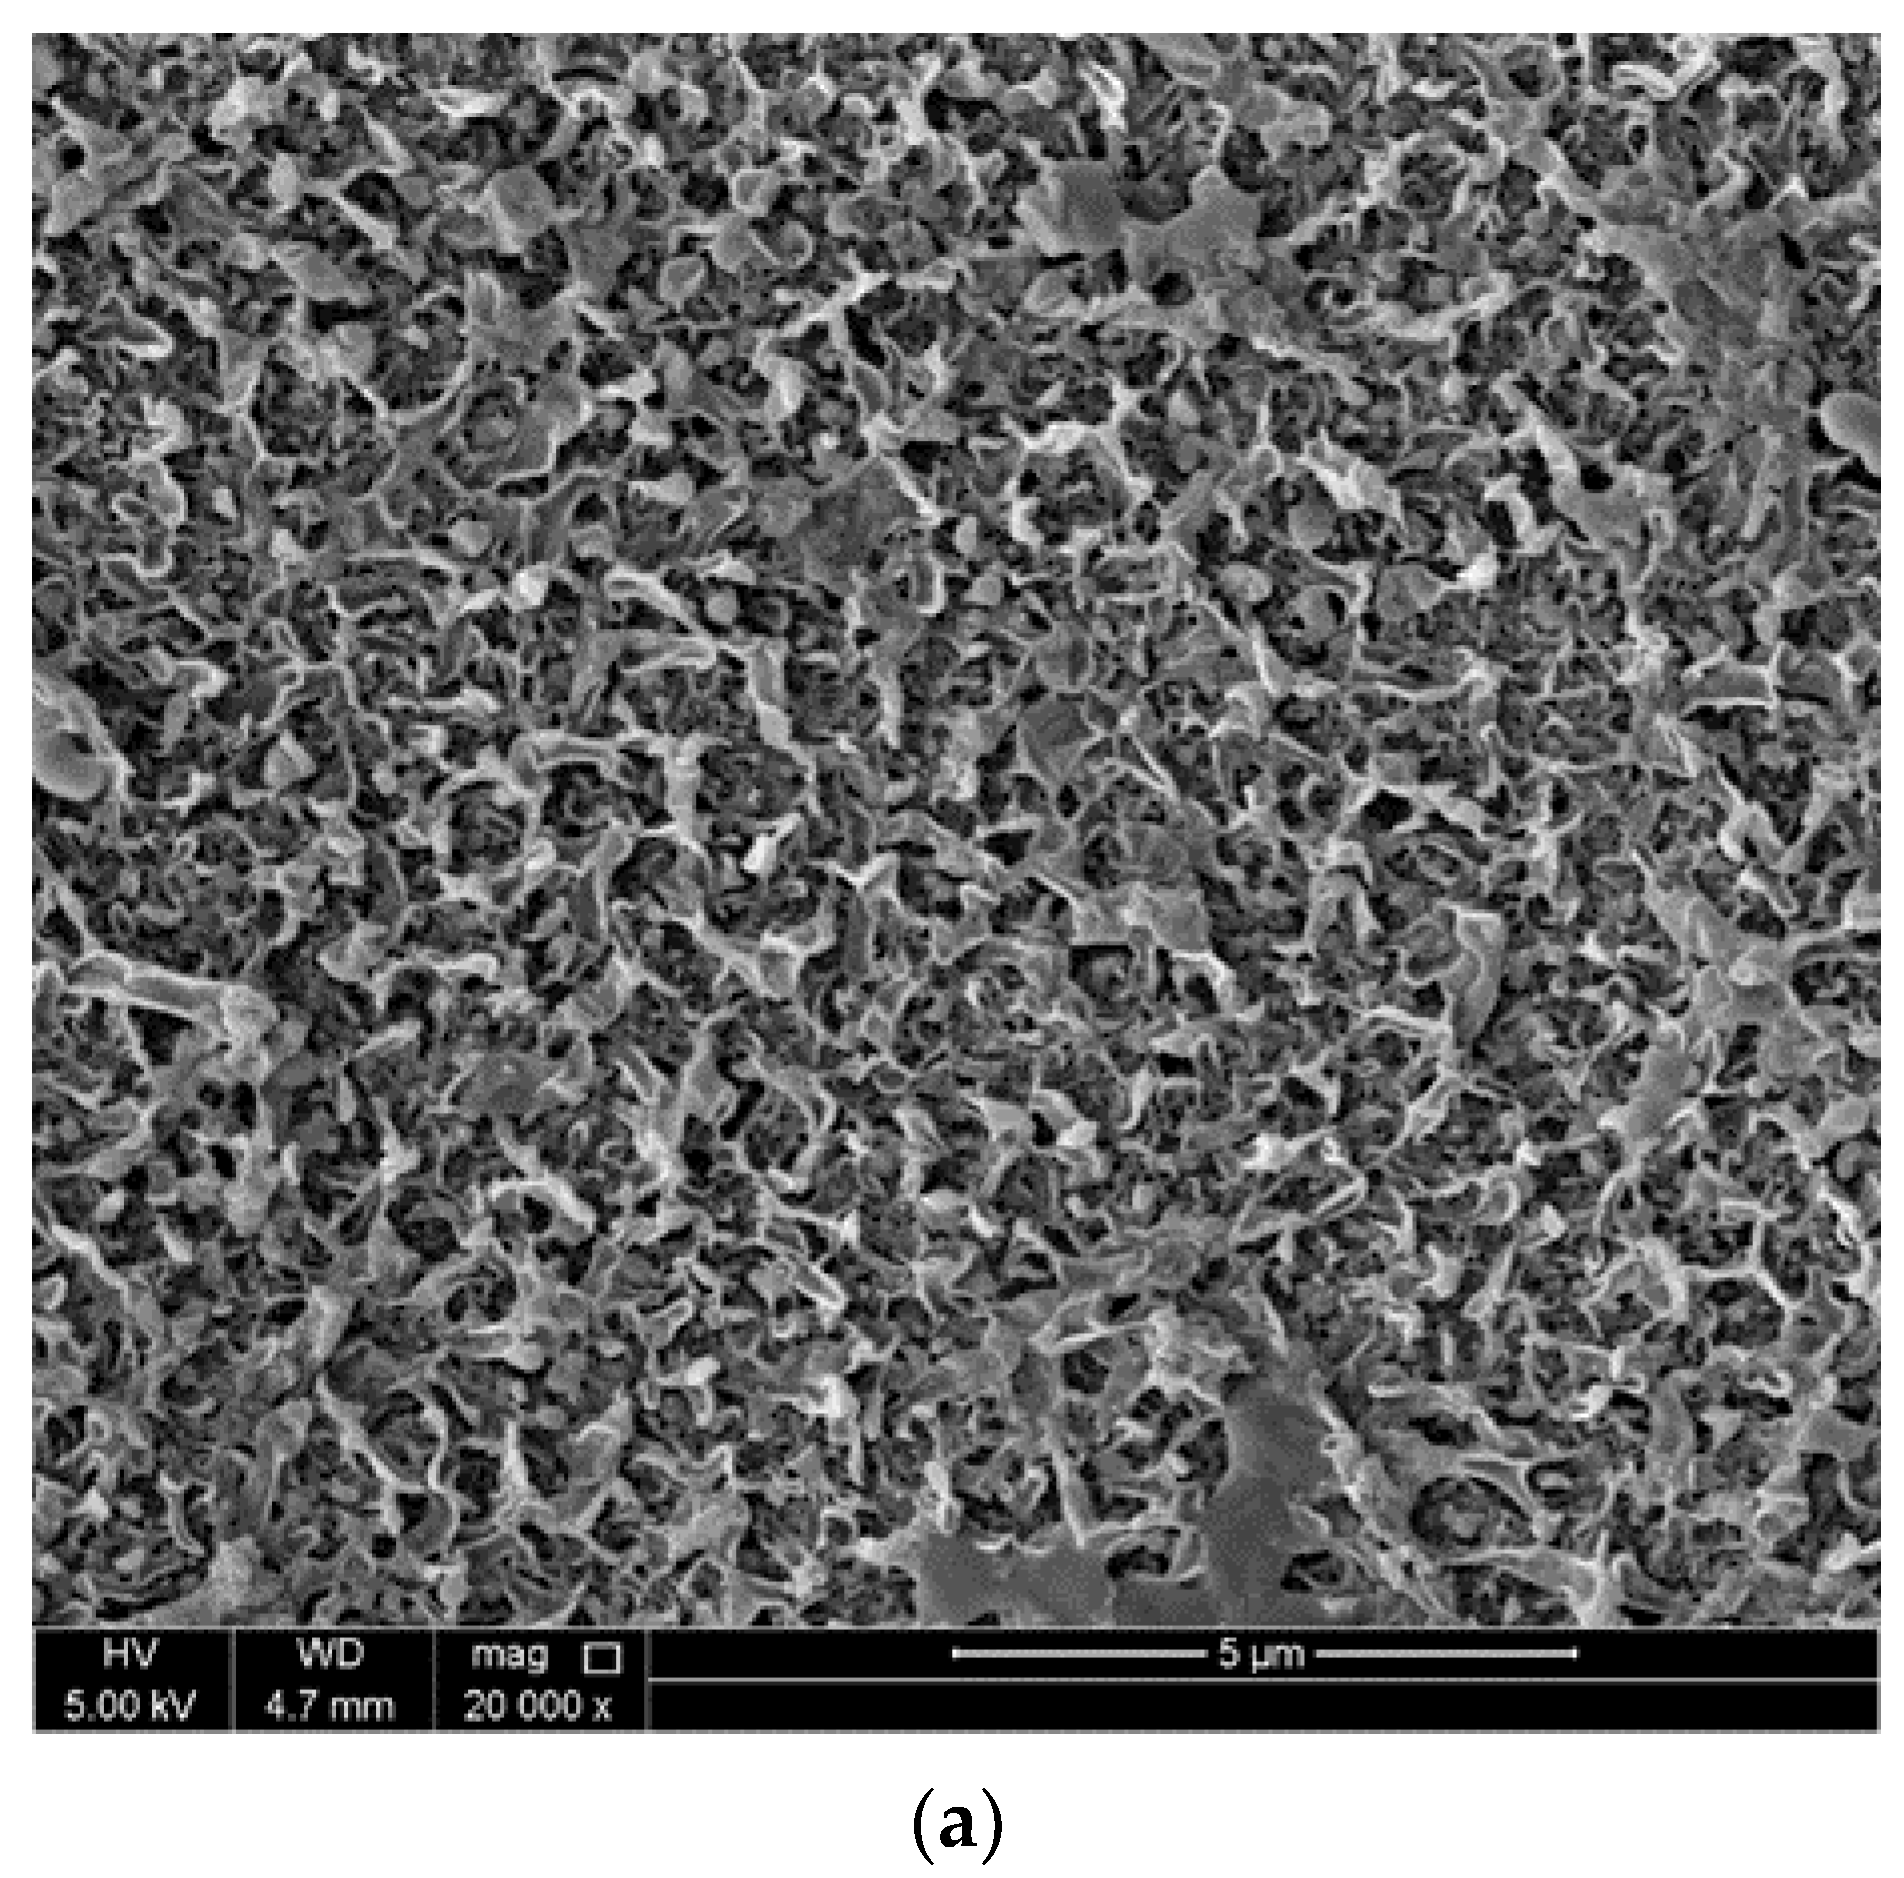
3.2.4. SEM Analysis of Different Membranes
3.3. Produced Water Treatment
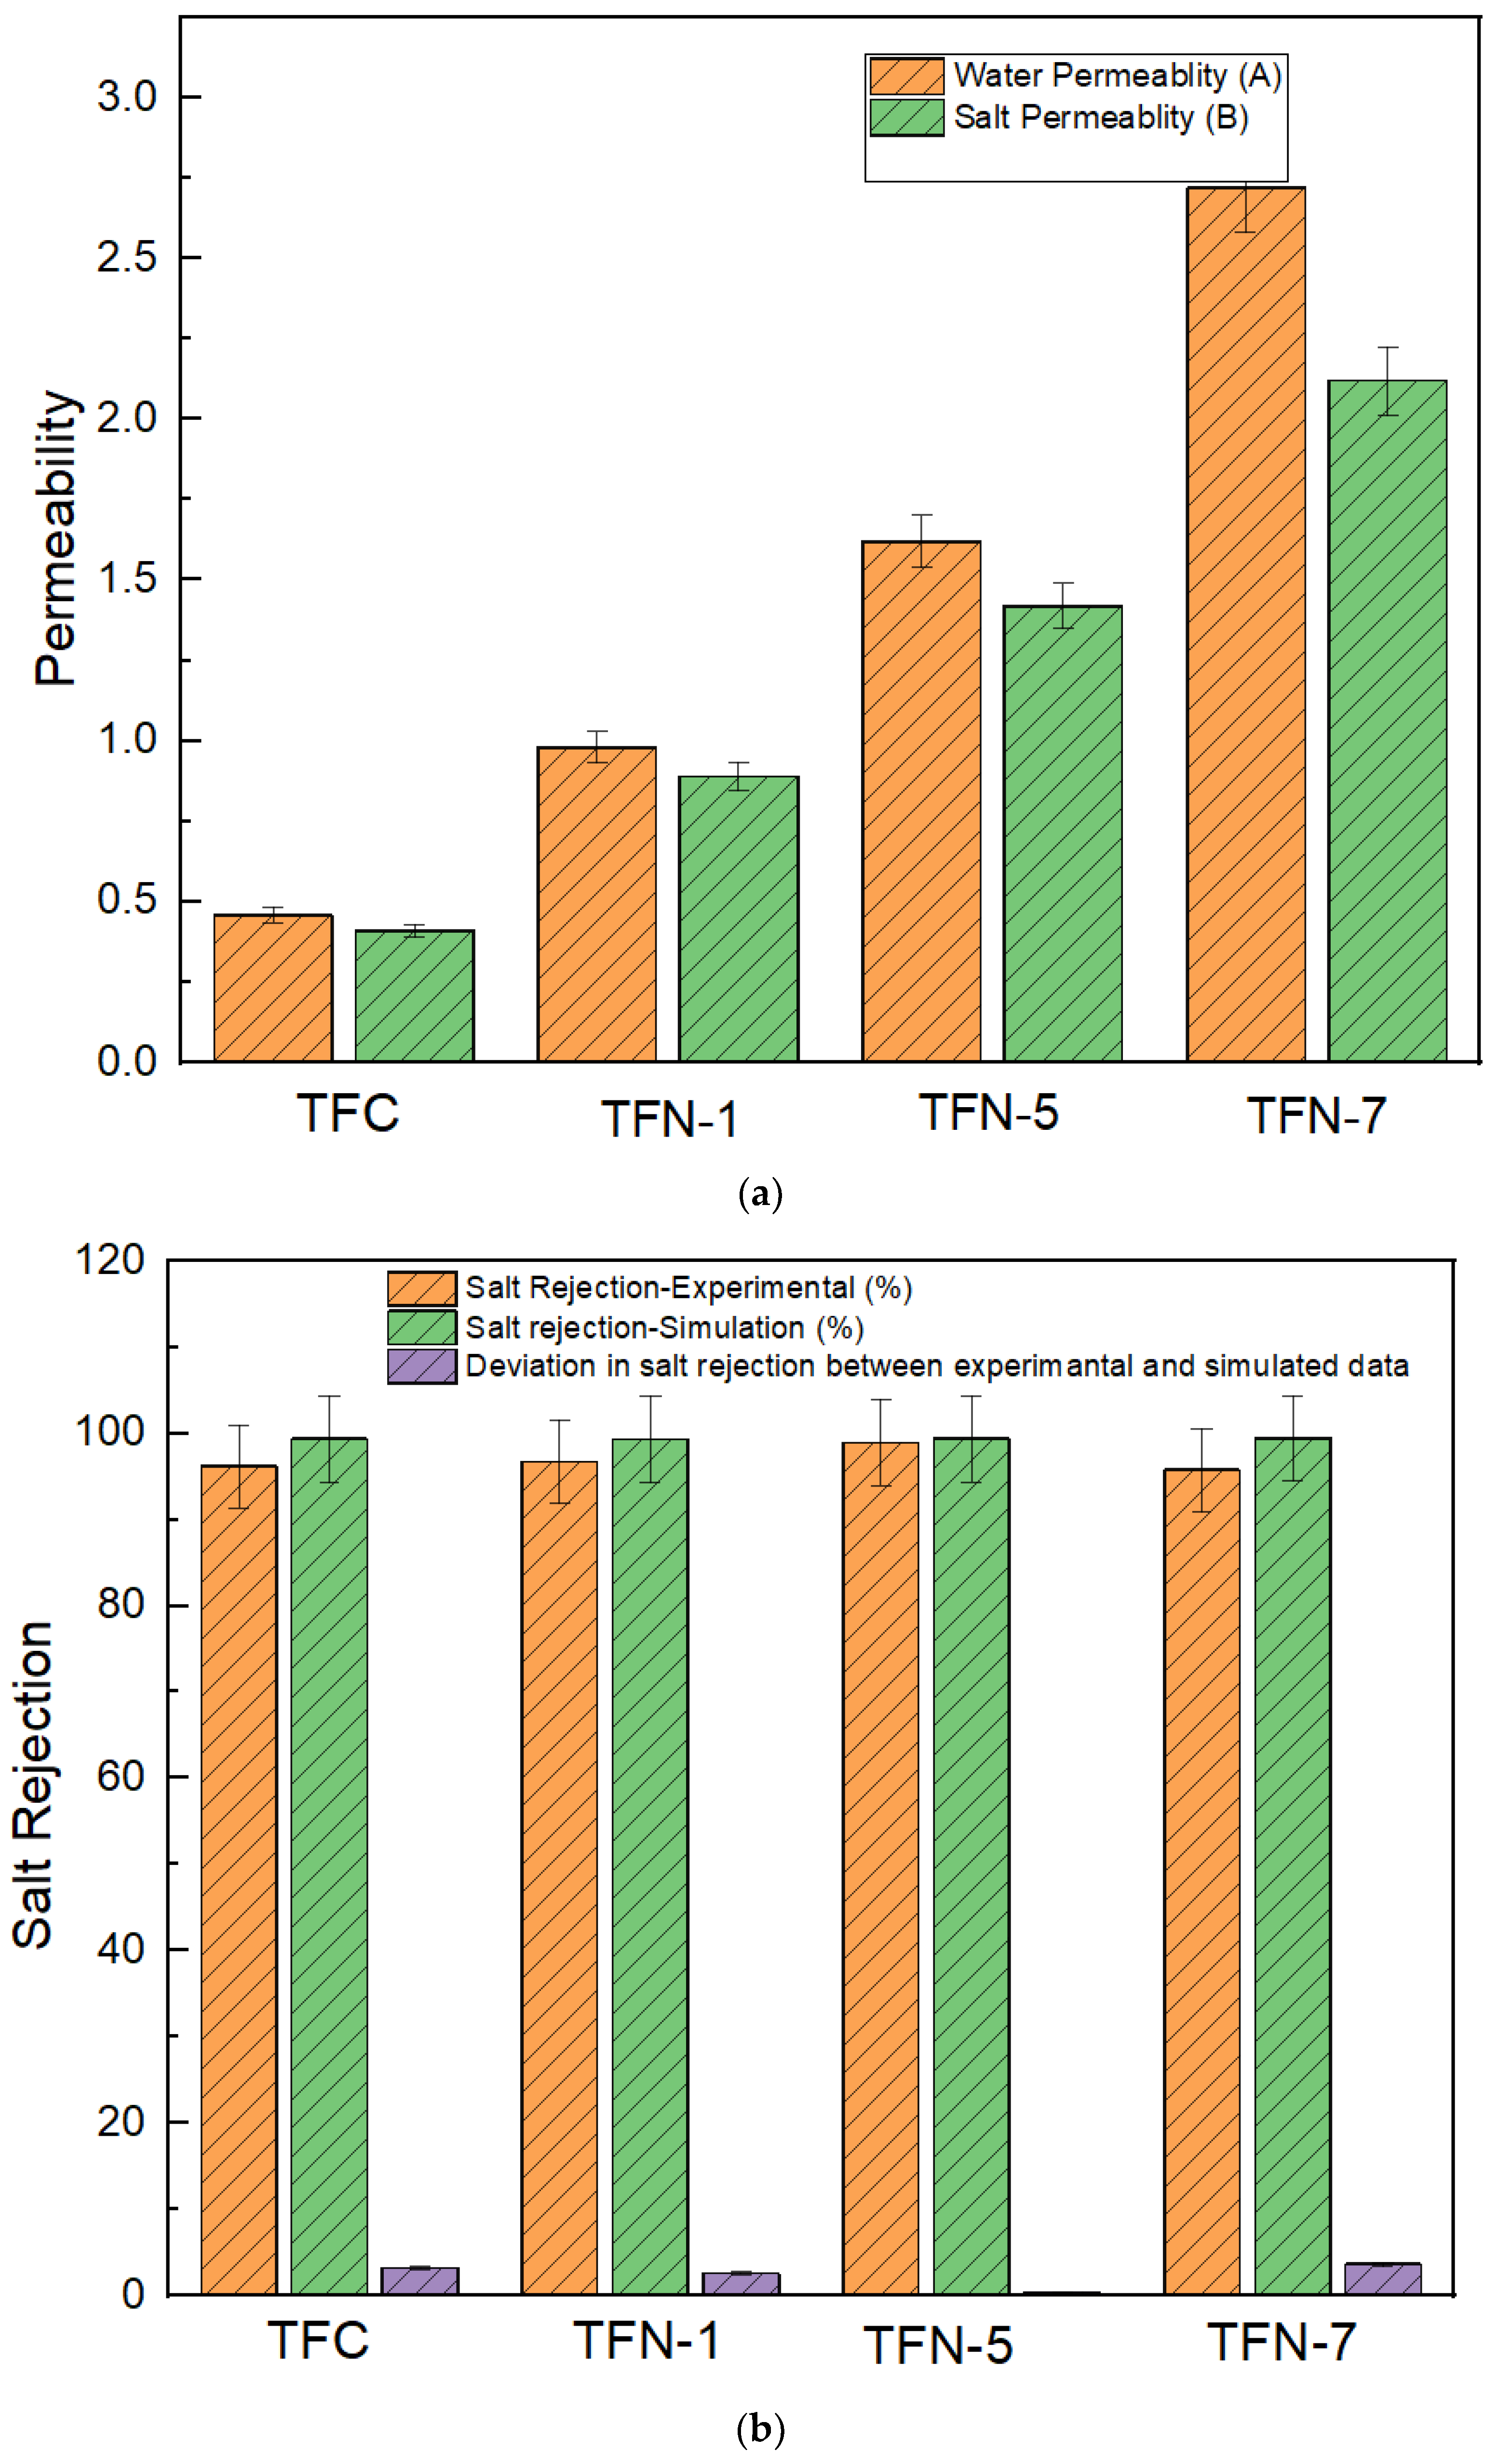
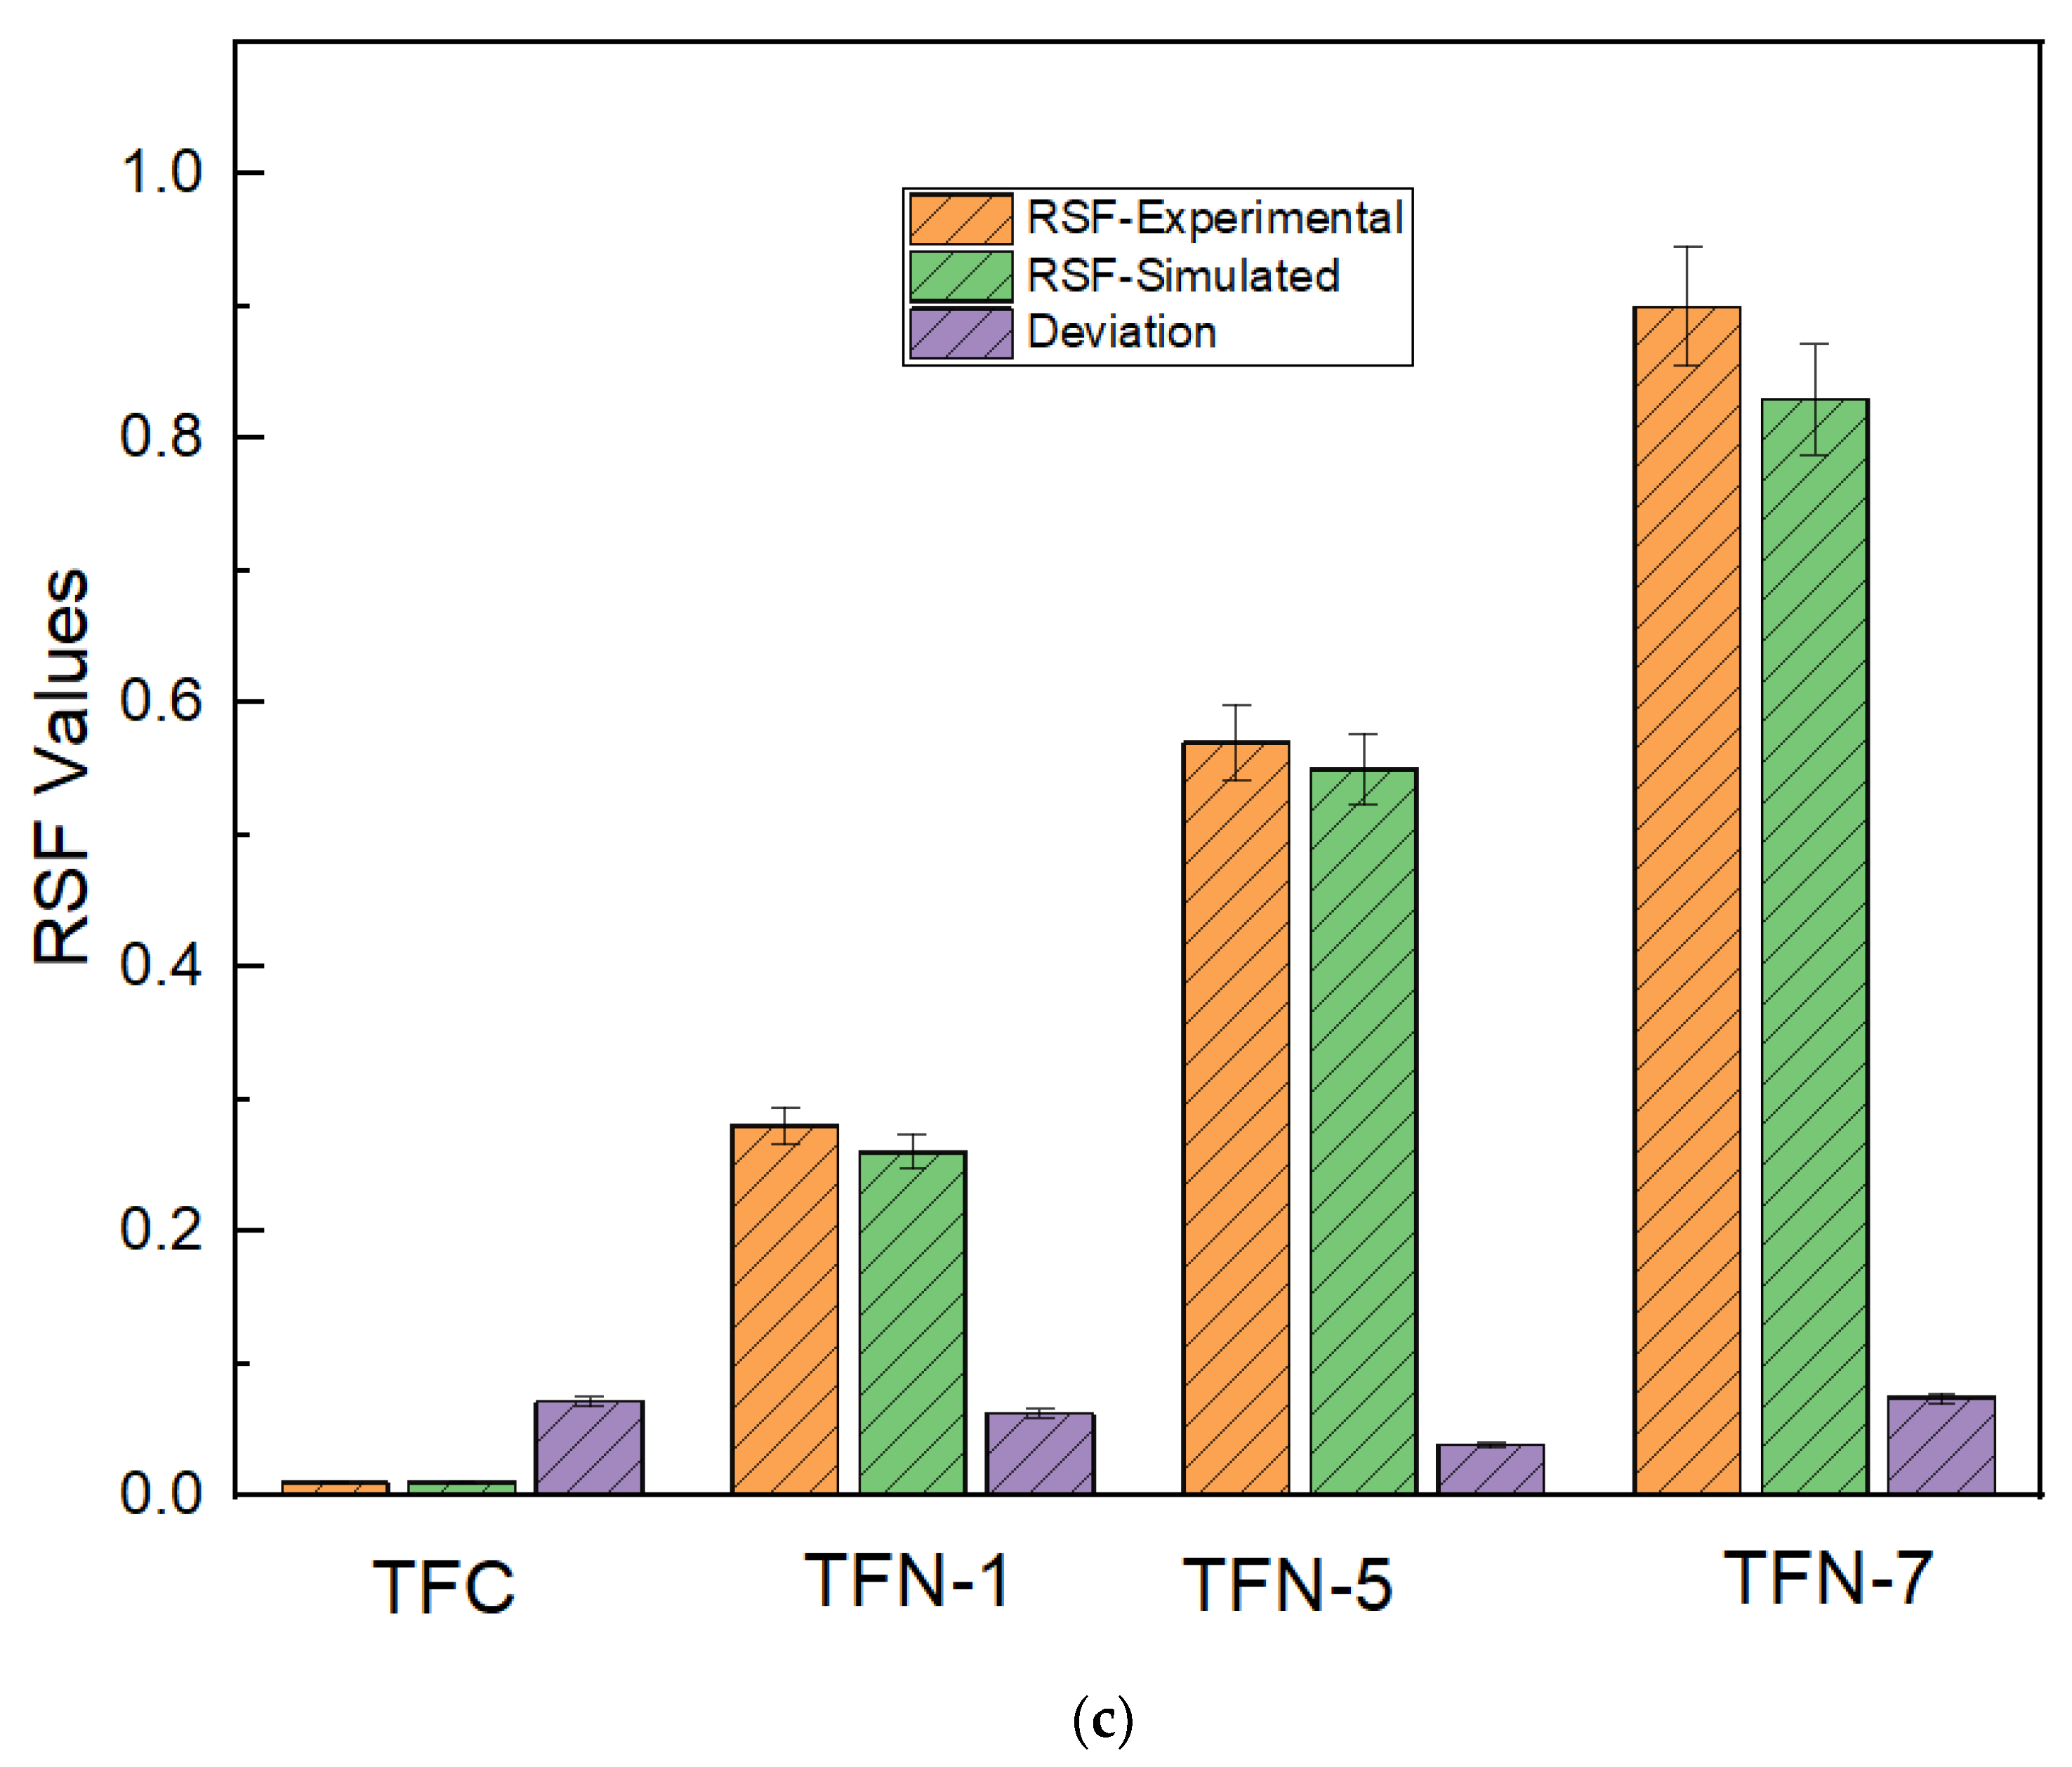
3.3.1. Permeability and Rejections
3.3.2. Water Flux, Reverse Salt Flux, and Oil Flux
3.3.3. Sustainable Methods for Draw Solution Treatment
- Bioremediation: Utilizing microorganisms, such as bacteria, fungi, or algae, to break down and metabolize the oil. These microorganisms can be added to the draw solution, or one can promote the growth of indigenous microorganisms by adding nutrients like nitrogen and phosphorus. This method may take longer than other approaches but is more environmentally friendly.
- Oleophilic materials: To remove the oil from the draw solution, oleophilic materials like oil-absorbent pads, sheets, or booms can be used. Most of these materials are hydrophobic, which means they repel water and prefer to attract oil. Once the oil has been absorbed, the oleophilic materials can be taken out and either regenerated or replaced.
- Natural coagulants: Instead of using chemical coagulants, use more environmentally friendly ones like Moringa oleifera seeds or chitosan, which come from the shells of crustaceans. These natural coagulants can help oil droplets and solids in suspension stick together, making it easier to separate them from the draw solution.
4. Conclusions
Author Contributions
Funding
Institutional Review Board Statement
Informed Consent Statement
Data Availability Statement
Conflicts of Interest
References
- Dawoud, H.D.; Saleem, H.; Alnuaimi, N.A.; Zaidi, S.J. Characterization and treatment technologies applied for produced water in Qatar. Water 2021, 13, 3573. [Google Scholar] [CrossRef]
- Sun, H.; Liu, Z.; Liu, K.; Gibril, M.E.; Kong, F.; Wang, S. Lignin-based superhydrophobic melamine resin sponges and their application in oil/water separation. Ind. Crops Prod. 2021, 170, 113798. [Google Scholar] [CrossRef]
- Yuan, H.; Hao, R.; Sun, H.; Zeng, W.; Lin, J.; Lu, S.; Chen, L. Engineered Janus cellulose membrane with the asymmetric-pore structure for the superhigh-water flux desalination. Carbohydr. Polym. 2022, 291, 119601. [Google Scholar] [CrossRef] [PubMed]
- Achilli, A.; Cath, T.Y.; Marchand, E.A.; Childress, A.E. The Forward Osmosis Membrane Bioreactor: A Low Fouling Alternative to MBR Processes. Desalination 2009, 239, 10–21. [Google Scholar] [CrossRef]
- Lee, S.; Boo, C.; Elimelech, M.; Hong, S. Comparison of Fouling Behavior in Forward Osmosis (FO) and Reverse Osmosis (RO). J. Memb. Sci. 2010, 365, 34–39. [Google Scholar] [CrossRef]
- Mi, B.; Elimelech, M. Organic Fouling of Forward Osmosis Membranes: Fouling Reversibility and Cleaning without Chemical Reagents. J. Memb. Sci. 2010, 348, 337–345. [Google Scholar] [CrossRef]
- Alzahrani, S.; Mohammad, A.W.; Hilal, N.; Abdullah, P.; Jaafar, O. Identification of Foulants, Fouling Mechanisms and Cleaning Efficiency for NF and RO Treatment of Produced Water. Sep. Purif. Technol. 2013, 118, 324–341. [Google Scholar] [CrossRef]
- Coday, B.D.; Miller-Robbie, L.; Beaudry, E.G.; Munakata-Marr, J.; Cath, T.Y. Life Cycle and Economic Assessments of Engineered Osmosis and Osmotic Dilution for Desalination of Haynesville Shale Pit Water. Desalination 2015, 369, 188–200. [Google Scholar] [CrossRef] [Green Version]
- Abounahia, N.M.; El-Sayed, A.M.A.; Saleem, H.; Zaidi, S.J. An overview on the progress in produced water desalination by membrane-based technology. J. Water Process Eng. 2023, 51, 103479. [Google Scholar]
- Duong, P.H.H.; Chung, T.S. Application of Thin Film Composite Membranes with Forward Osmosis Technology for the Separation of Emulsified Oil-Water. J. Memb. Sci. 2014, 452, 117–126. [Google Scholar] [CrossRef]
- Hickenbottom, K.L.; Hancock, N.T.; Hutchings, N.R.; Appleton, E.W.; Beaudry, E.G.; Xu, P.; Cath, T.Y. Forward Osmosis Treatment of Drilling Mud and Fracturing Wastewater from Oil and Gas Operations. Desalination 2013, 312, 60–66. [Google Scholar] [CrossRef]
- Zaidi, S.J.; Saleem, H. Reverse Osmosis Membrane Performance Degradation. J. Reverse Osmosis Syst. 2022, 343–373. [Google Scholar]
- Putri, R.E.D.; Nasir, S.; Hadiah, F. Application of Ceramic Filter and Reverse Osmosis Membrane for Produced Water Treatment. Pollution 2022, 8, 1103–1115. [Google Scholar]
- Liu, N.; Yang, J.; Hu, X.; Zhao, H.; Chang, H.; Liang, Y.; Liang, H. Fouling and chemically enhanced backwashing performance of low-pressure membranes during the treatment of shale gas produced water. Sci. Total Environ. 2022, 840, 156664. [Google Scholar] [CrossRef]
- Phuntsho, S.; Shon, H.K.; Hong, S.; Lee, S.; Vigneswaran, S. A Novel Low Energy Fertilizer Driven Forward Osmosis Desalination for Direct Fertigation: Evaluating the Performance of Fertilizer Draw Solutions. J. Memb. Sci. 2011, 375, 172–181. [Google Scholar] [CrossRef]
- Alamoudi, T.; Nawaz, M.S.; Obaid, M.; Jin, Y.; Soukane, S.; Son, H.S.; Gudideni, V.; Al-Qahtani, A.; Ghaffour, N. Optimization of osmotic backwashing cleaning protocol for produced water fouled forward osmosis membranes. J. Membr. Sci. 2022, 663, 121013. [Google Scholar] [CrossRef]
- Higuchi, H.; Miyagawa, M.; Takaba, H. Solvent—Solute Interaction Effect on Permeation Flux through Forward Osmosis Membranes Investigated by Non-Equilibrium Molecular Dynamics. Membranes 2022, 12, 1249. [Google Scholar] [CrossRef]
- Yu, Y.; Zhang, X.; Lu, P.; He, D.; Shen, L.; Li, Y. Enhanced Separation Performance of Polyamide Thin-Film Nanocomposite Membranes with Interlayer by Constructed Two-Dimensional Nanomaterials: A Critical Review. Membranes 2022, 12, 1250. [Google Scholar] [CrossRef]
- Zhao, Y.; Duan, L.; Liu, X.; Song, Y. Study on the Changes in the Microcosmic Environment in Forward Osmosis Membranes to Reduce Membrane Resistance. Membranes 2022, 12, 1203. [Google Scholar] [CrossRef]
- Suwaileh, W.; Pathak, N.; Shon, H.; Hilal, N. Forward osmosis membranes and processes: A comprehensive review of research trends and future outlook. Desalination 2020, 485, 114455. [Google Scholar] [CrossRef]
- Kim, Y.; Li, S.; Ghaffour, N. Evaluation of different cleaning strategies for different types of forward osmosis membrane fouling and scaling. J. Membr. Sci. 2020, 596, 117731. [Google Scholar] [CrossRef]
- Im, S.J.; Viet, N.D.; Jang, A. Real-time monitoring of forward osmosis membrane fouling in wastewater reuse process performed with a deep learning model. Chemosphere 2021, 275, 130047. [Google Scholar] [CrossRef] [PubMed]
- Zhao, Y.; Duan, L.; Liu, X.; Song, Y. Influence of Membrane Fouling and Reverse Salt Flux on Membrane Impedance of Forward Osmosis Microbial Fuel Cell. Membranes 2022, 12, 1165. [Google Scholar] [CrossRef] [PubMed]
- Ghazi, Z.M.; Rizvi, S.W.F.; Shahid, W.M.; Abdulhameed, A.M.; Saleem, H.; Zaidi, S.J. An overview of water desalination systems integrated with renewable energy sources. Desalination 2022, 542, 116063. [Google Scholar] [CrossRef]
- Salamanca, M.; López-Serna, R.; Palacio, L.; Hernandez, A.; Prádanos, P.; Peña, M. Ecological Risk Evaluation and Removal of Emerging Pollutants in Urban Wastewater by a Hollow Fiber Forward Osmosis Membrane. Membranes 2022, 12, 293. [Google Scholar] [CrossRef]
- Hafiz, M.; Alfahel, R.; Hawari, A.H.; Hassan, M.K.; Altaee, A. A Hybrid Nf-Fo-Ro Process for the Supply of Irrigation Water from Treated Wastewater: Simulation Study. Membranes 2021, 11, 191. [Google Scholar] [CrossRef]
- Wang, Y.; Nie, Y.; Chen, C.; Zhao, H.; Zhao, Y.; Jia, Y.; Li, J.; Li, Z. Preparation and Characterization of a Thin-Film Composite Membrane Modified by MXene Nano-Sheets. Membranes 2022, 12, 368. [Google Scholar] [CrossRef]
- Saleem, H.; Goh, P.S.; Saud, A.; Khan, M.A.W.; Munira, N.; Ismail, A.F.; Zaidi, S.J. Graphene Quantum Dot-Added Thin-Film Composite Membrane with Advanced Nanofibrous Support for Forward Osmosis. Nanomaterials 2022, 12, 4154. [Google Scholar] [CrossRef]
- Saleem, H.; Saud, A.; Munira, N.; Goh, P.S.; Ismail, A.F.; Siddiqui, H.R.; Zaidi, S.J. Improved forward osmosis performance of thin film composite membranes with graphene quantum dots derived from eucalyptus tree leaves. Nanomaterials 2022, 12, 3519. [Google Scholar] [CrossRef]
- Altmann, T.; Das, R. Process improvement of sea water reverse osmosis (SWRO) and subsequent decarbonization. Desalination 2021, 499, 114791. [Google Scholar] [CrossRef]
- Hassan, E.; Hassan, M.; Abou-zeid, R.; Berglund, L.; Oksman, K. Use of Bacterial Cellulose and Crosslinked Cellulose Nanofibers Membranes for Removal of Oil from Oil-in-Water Emulsions. Polymers 2017, 9, 388. [Google Scholar] [CrossRef] [Green Version]
- Lee, W.J.; Goh, P.S.; Lau, W.J.; Ong, C.S.; Ismail, A.F. Antifouling Zwitterion Embedded Forward Osmosis Thin Film Composite Membrane for Highly Concentrated Oily Wastewater Treatment. Sep. Purif. Technol. 2019, 268, 40–50. [Google Scholar] [CrossRef]
- Asadi, A.; Gholami, F.; Zinatizadeh, A.A. Enhanced Oil Removal from a Real Polymer Production Plant by Cellulose Nanocrystals-Serine Incorporated Polyethersulfone Ultrafiltration Membrane. Environ. Sci. Pollut. Res. 2022, 29, 37144–37158. [Google Scholar] [CrossRef]
- Han, G.; Chan, S.S.; Chung, T.S. Forward Osmosis (FO) for Water Reclamation from Emulsified Oil/Water Solutions: Effects of Membrane and Emulsion Characteristics. ACS Sustain. Chem. Eng. 2016, 4, 5021–5032. [Google Scholar] [CrossRef]
- Huang, J.; Ren, Y.; Wang, X.; Li, H.; Wang, Y.; Zhang, J.; Wang, Z.; Li, Z.; Yue, T.; Gao, Z. Dealcoholization of kiwi wine by forward osmosis: Evaluation of membrane fouling propensity and product quality. Chem. Eng. Res. Des. 2022, 178, 189–198. [Google Scholar] [CrossRef]
- Cheng, X.; Xu, Y.; Lei, Z.; Du, J. Investigation on operational parameters and membrane fouling performance in treating synthetic aquaculture wastewater via forward osmosis with sucrose as draw solution. Sci. Total Environ. 2022, 847, 157573. [Google Scholar] [CrossRef]
- Ji, C.C.; Chen, K.Y.; Deng, S.K.; Wang, J.X.; Hu, Y.X.; Xu, X.H.; Cheng, L.H. Fouling evolution of extracellular polymeric substances in forward osmosis based microalgae dewatering. Water Res. 2023, 229, 119395. [Google Scholar] [CrossRef]
- Zhan, M.; Gwak, G.; Kim, D.I.; Park, K.; Hong, S. Quantitative analysis of the irreversible membrane fouling of forward osmosis during wastewater reclamation: Correlation with the modified fouling index. J. Membr. Sci. 2020, 597, 117757. [Google Scholar] [CrossRef]
- Ma, C.; Li, Q.; Liu, J.; Bao, H.; Wang, L.; Zhao, B.; Zhang, Z. Forward osmosis treatment of algal-rich water: Characteristics and mechanism of membrane fouling. J. Hazard. Mater. 2022, 423, 126984. [Google Scholar] [CrossRef]
- Huang, M.; Liang, Z.; Ren, L.F.; Wu, Q.; Li, J.; Song, J.; Meng, L. Robust mitigation of FO membrane fouling by coagulation-floatation process: Role of microbubbles. Desalination 2022, 531, 115693. [Google Scholar] [CrossRef]
- Liden, T.; Santos, I.C.; Hildenbrand, Z.L.; Schug, K.A. Treatment modalities for the reuse of produced waste from oil and gas development. Sci. Total Environ. 2018, 643, 107–118. [Google Scholar] [CrossRef] [PubMed]
- Rahman, S.N.; Saleem, H.; Zaidi, S.J. Progress in membranes for pressure retarded osmosis application. Desalination 2023, 549, 116347. [Google Scholar] [CrossRef]
- Ding, C.; Zhang, X.; Xiong, S.; Shen, L.; Yi, M.; Liu, B.; Wang, Y. Organophosphonate draw solution for produced water treatment with effectively mitigated membrane fouling via forward osmosis. J. Membr. Sci. 2020, 593, 117429. [Google Scholar] [CrossRef]
- Bell, E.A.; Poynor, T.E.; Newhart, K.B.; Regnery, J.; Coday, B.D.; Cath, T.Y. Produced water treatment using forward osmosis membranes: Evaluation of extended-time performance and fouling. J. Membr. Sci. 2017, 525, 77–88. [Google Scholar] [CrossRef]
- Yang, Z.; Sun, P.F.; Li, X.; Gan, B.; Wang, L.; Song, X.; Park, H.D.; Tang, C.Y. A Critical Review on Thin-Film Nanocomposite Membranes with Interlayered Structure: Mechanisms, Recent Developments, and Environmental Applications. Environ. Sci. Technol. 2020, 54, 15563–15583. [Google Scholar] [CrossRef]
- Bakly, S.; Ibrar, I.; Saleem, H.; Yadav, S.; Al-Juboori, R.; Naji, O.; Altaee, A.; Zaidi, S.J. Polymer-based nano-enhanced forward osmosis membranes. In Advancement in Polymer-Based Membranes for Water Remediation; Elsevier: Amsterdam, The Netherlands, 2022; pp. 471–501. [Google Scholar]
- Zhu, P.; Feng, L.; Ding, Z.; Bai, X. Preparation of spherical cellulose nanocrystals from microcrystalline cellulose by mixed acid hydrolysis with different pretreatment routes. Int. J. Mol. Sci. 2022, 23, 10764. [Google Scholar] [CrossRef]
- Aziz, T.; Haq, F.; Farid, A.; Kiran, M.; Faisal, S.; Ullah, A.; Ullah, N.; Bokhari, A.; Mubashir, M.; Chuah, L.F.; et al. Challenges associated with cellulose composite material: Facet engineering and prospective. Environ. Res. 2023, 223, 115429. [Google Scholar] [CrossRef]
- Siqueira, G.; Bras, J.; Dufresne, A. Cellulosic bionanocomposites: A review of preparation, properties and applications. Polymers 2010, 2, 728–765. [Google Scholar] [CrossRef] [Green Version]
- Lalia, B.S.; Guillen, E.; Arafat, H.A.; Hashaikeh, R. Nanocrystalline cellulose reinforced PVDF-HFP membranes for membrane distillation application. Desalination 2014, 332, 134–141. [Google Scholar] [CrossRef]
- Saud, A.; Saleem, H.; Zaidi, S.J. Progress and prospects of nanocellulose-based membranes for desalination and water treatment. Membranes 2022, 12, 462. [Google Scholar] [CrossRef]
- Fan, X.M.; Yu, H.Y.; Wang, D.C.; Mao, Z.H.; Yao, J.; Tam, K.C. Facile and Green Synthesis of Carboxylated Cellulose Nanocrystals as Efficient Adsorbents in Wastewater Treatments. ACS Sustain. Chem. Eng. 2019, 7, 18067–18075. [Google Scholar] [CrossRef]
- Grishkewich, N.; Mohammed, N.; Tang, J.; Tam, K.C. Recent Advances in the Application of Cellulose Nanocrystals. Curr. Opin. Colloid Interface Sci. 2017, 29, 32–45. [Google Scholar] [CrossRef]
- Rezaei-DashtArzhandi, M.; Sarrafzadeh, M.H.; Goh, P.S.; Lau, W.J.; Ismail, A.F.; Wong, K.C.; Mohamed, M.A. Enhancing the desalination performance of forward osmosis membrane through the incorporation of green nanocrystalline cellulose and halloysite dual nanofillers. J. Chem. Technol. Biotechnol. 2020, 95, 2359–2370. [Google Scholar] [CrossRef]
- Abid, W.; Ammar, E. Date Palm (Phoenix dactylifera L.) Wastes Valorization: A Circular Economy Approach. In Mediterranean Fruits Bio-Wastes: Chemistry, Functionality and Technological Applications; Springer International Publishing: Cham, Switzerland, 2022; pp. 403–430. [Google Scholar]
- Elseify, L.A.; Midani, M.; Shihata, L.A.; El-Mously, H. Review on cellulosic fibers extracted from date palms (Phoenix Dactylifera L.) and their applications. Cellulose 2019, 26, 2209–2232. [Google Scholar] [CrossRef]
- Xu, C.; Chen, W.; Gao, H.; Xie, X.; Chen, Y. Cellulose Nanocrystal/Silver (CNC/Ag) Thin-Film Nanocomposite Nanofiltration Membranes with Multifunctional Properties. Environ. Sci. Nano 2020, 7, 803–816. [Google Scholar] [CrossRef]
- Asempour, F.; Emadzadeh, D.; Matsuura, T.; Kruczek, B. Synthesis and Characterization of Novel Cellulose Nanocrystals-Based Thin Film Nanocomposite Membranes for Reverse Osmosis Applications. Desalination 2018, 439, 179–187. [Google Scholar] [CrossRef]
- Alothman, O.Y.; Kian, L.K.; Saba, N.; Jawaid, M.; Khiari, R. Cellulose Nanocrystal Extracted from Date Palm Fibre: Morphological, Structural and Thermal Properties. Ind. Crops Prod. 2021, 159, 113075. [Google Scholar] [CrossRef]
- Kim, W.J.; Campanella, O.; Heldman, D.R. A stepwise approach to predict the performance of forward osmosis operation: Effect of temperature and flow direction. Desalination 2022, 538, 115889. [Google Scholar] [CrossRef]
- Thakur, M.; Sharma, A.; Ahlawat, V.; Bhattacharya, M.; Goswami, S. Process optimization for the production of cellulose nanocrystals from rice straw derived α-cellulose. Mater. Sci. Energy Technol. 2020, 3, 328–334. [Google Scholar] [CrossRef]
- Sai Prasanna, N.; Mitra, J. Isolation and Characterization of Cellulose Nanocrystals from Cucumis Sativus Peels. Carbohydr. Polym. 2020, 247, 3–6. [Google Scholar] [CrossRef]
- Rhim, J.W.; Reddy, J.P.; Luo, X. Isolation of Cellulose Nanocrystals from Onion Skin and Their Utilization for the Preparation of Agar-Based Bio-Nanocomposites Films. Cellulose 2015, 22, 407–420. [Google Scholar] [CrossRef]
- Mehanny, S.; Abu-El Magd, E.E.; Ibrahim, M.; Farag, M.; Gil-San-Millan, R.; Navarro, J.; El Habbak, A.E.H.; El-Kashif, E. Extraction and Characterization of Nanocellulose from Three Types of Palm Residues. J. Mater. Res. Technol. 2021, 10, 526–537. [Google Scholar] [CrossRef]
- Yang, X.; Liu, H.; Zhao, Y.; Liu, L. Preparation and Characterization of Polysulfone Membrane Incorporating Cellulose Nanocrystals Extracted from Corn Husks. Fibers Polym. 2016, 17, 1820–1828. [Google Scholar] [CrossRef]
- Sun, X.F.; Xu, F.; Sun, R.C.; Fowler, P.; Baird, M.S. Characteristics of Degraded Cellulose Obtained from Steam-Exploded Wheat Straw. Carbohydr. Res. 2005, 340, 97–106. [Google Scholar] [CrossRef]
- Bai, L.; Liu, Y.; Bossa, N.; Ding, A.; Ren, N.; Li, G.; Liang, H.; Wiesner, M.R. Incorporation of Cellulose Nanocrystals (CNCs) into the Polyamide Layer of Thin-Film Composite (TFC) Nanofiltration Membranes for Enhanced Separation Performance and Antifouling Properties. Environ. Sci. Technol. 2018, 52, 11178–11187. [Google Scholar] [CrossRef]
- Zhang, R.; Yu, S.; Shi, W.; Wang, W.; Wang, X.; Zhang, Z.; Li, L.; Zhang, B.; Bao, X. A Novel Polyesteramide Thin Film Composite Nanofiltration Membrane Prepared by Interfacial Polymerization of Serinol and Trimesoyl Chloride (TMC) Catalyzed by 4-dimethylaminopyridine (DMAP). J. Memb. Sci. 2017, 542, 68–80. [Google Scholar] [CrossRef]
- Mohammad, A.W.; Teow, Y.H.; Ang, W.L.; Chung, Y.T.; Oatley-Radcliffe, D.L.; Hilal, N. Nanofiltration Membranes Review: Recent Advances and Future Prospects. Desalination 2015, 356, 226–254. [Google Scholar] [CrossRef]
- Cho, K.; Hill, A.; Caruso, F.; Kentish, S. Chlorine resistant glutaraldehyde crosslinked polyelectrolyte multilayer membranes for desalination. Adv. Mater. 2015, 27, 2791–2796. [Google Scholar] [CrossRef]
- Pang, R.; Zhang, K. A facile and viable approach to fabricate polyamide membranes functionalized with graphene oxide nanosheets. RSC Adv. 2017, 7, 53463–53471. [Google Scholar] [CrossRef] [Green Version]
- Isogai, A.; Saito, T.; Fukuzumi, H. TEMPO-oxidized cellulose nanofibers. Nanoscale 2011, 3, 71–85. [Google Scholar] [CrossRef]
- Chami Khazraji, A.; Robert, S. Interaction effects between cellulose and water in nanocrystalline and amorphous regions: A novel approach using molecular modeling. J. Nanomater. 2013, 2013, 1–10. [Google Scholar] [CrossRef] [Green Version]
- Ng, H.Y.; Tang, W.; Wong, W.S. Performance of forward (direct) osmosis process: Membrane structure and transport phenomenon. Environ. Sci. Technol. 2006, 40, 2408–2413. [Google Scholar] [CrossRef]


| Membrane Nomenclature | MPD wt% | MPD Deposition Time (min) | TMC wt% | Curing Time (s) and Temperature °C | CNC wt (g) |
|---|---|---|---|---|---|
| TFC | 1 | 10 | 0.15 | 60, 55 | 0 |
| TFN-1 | 1 | 10 | 0.15 | 60, 55 | 0.01 |
| TFN-5 | 1 | 10 | 0.15 | 60, 55 | 0.05 |
| TFN-7 | 1 | 10 | 0.15 | 60, 55 | 0.07 |
| Membrane | CNC% | RMS | Contact Angle (°) |
|---|---|---|---|
| TFC | 0 | 64.357 | 62.32 |
| TFN-1 | 0.01 | 44.050 | 56.21 |
| TFN-5 | 0.05 | 31.76 | 40.11 |
| TFN-7 | 0.07 | 90.88 | 33.17 |
Disclaimer/Publisher’s Note: The statements, opinions and data contained in all publications are solely those of the individual author(s) and contributor(s) and not of MDPI and/or the editor(s). MDPI and/or the editor(s) disclaim responsibility for any injury to people or property resulting from any ideas, methods, instructions or products referred to in the content. |
© 2023 by the authors. Licensee MDPI, Basel, Switzerland. This article is an open access article distributed under the terms and conditions of the Creative Commons Attribution (CC BY) license (https://creativecommons.org/licenses/by/4.0/).
Share and Cite
Saud, A.; Saleem, H.; Khan, A.W.; Munira, N.; Khan, M.; Zaidi, S.J. Date Palm Tree Leaf-Derived Cellulose Nanocrystal Incorporated Thin-Film Composite forward Osmosis Membranes for Produced Water Treatment. Membranes 2023, 13, 513. https://doi.org/10.3390/membranes13050513
Saud A, Saleem H, Khan AW, Munira N, Khan M, Zaidi SJ. Date Palm Tree Leaf-Derived Cellulose Nanocrystal Incorporated Thin-Film Composite forward Osmosis Membranes for Produced Water Treatment. Membranes. 2023; 13(5):513. https://doi.org/10.3390/membranes13050513
Chicago/Turabian StyleSaud, Asif, Haleema Saleem, Aquib Wakeel Khan, Nazmin Munira, Maryam Khan, and Syed Javaid Zaidi. 2023. "Date Palm Tree Leaf-Derived Cellulose Nanocrystal Incorporated Thin-Film Composite forward Osmosis Membranes for Produced Water Treatment" Membranes 13, no. 5: 513. https://doi.org/10.3390/membranes13050513