
Model-Based Performance Analysis of Membrane Reactor with Ethanol Steam Reforming over a Monolith


Abstract
:1. Introduction
2. Reactor Model
2.1. Configuration of Reactor
2.1.1. Catalyst Bed Configuration
2.1.2. Design of Membrane Module
2.1.3. Gap Flow Characterization
2.2. Model Description
- Both the reaction and transport are conducted isothermally. This assumption for the endothermic reaction of ethanol reforming signifies that sufficient heat is supplied to maintain an approximately constant reaction temperature.
- The internal mass transfer resistance of the catalytic washcoat over the metallic monolith is neglected.
- Negligible pressure drop occurs across the membrane reactor.
- The permeation of hydrogen through the dense layer of the membrane module follows Sievert’s law.
- Molecular and Knudsen diffusions control in the hydrogen and argon transport through the gas-permeable layers of the membrane support.
- A perfect-gas equation of state relates the density, pressure, temperature and composition.
2.2.1. Feed-Side Compartment Model
Reaction Description
Dispersion of Mass
Stagnate Flow in the Gap
2.2.2. Sweep-Side Reactor Model
Dense Layer
Gas-Permeable Layers
Sweep Compartment
2.3. Numerical Solution Strategy
3. Results and Discussion
3.1. Base, Reference Case
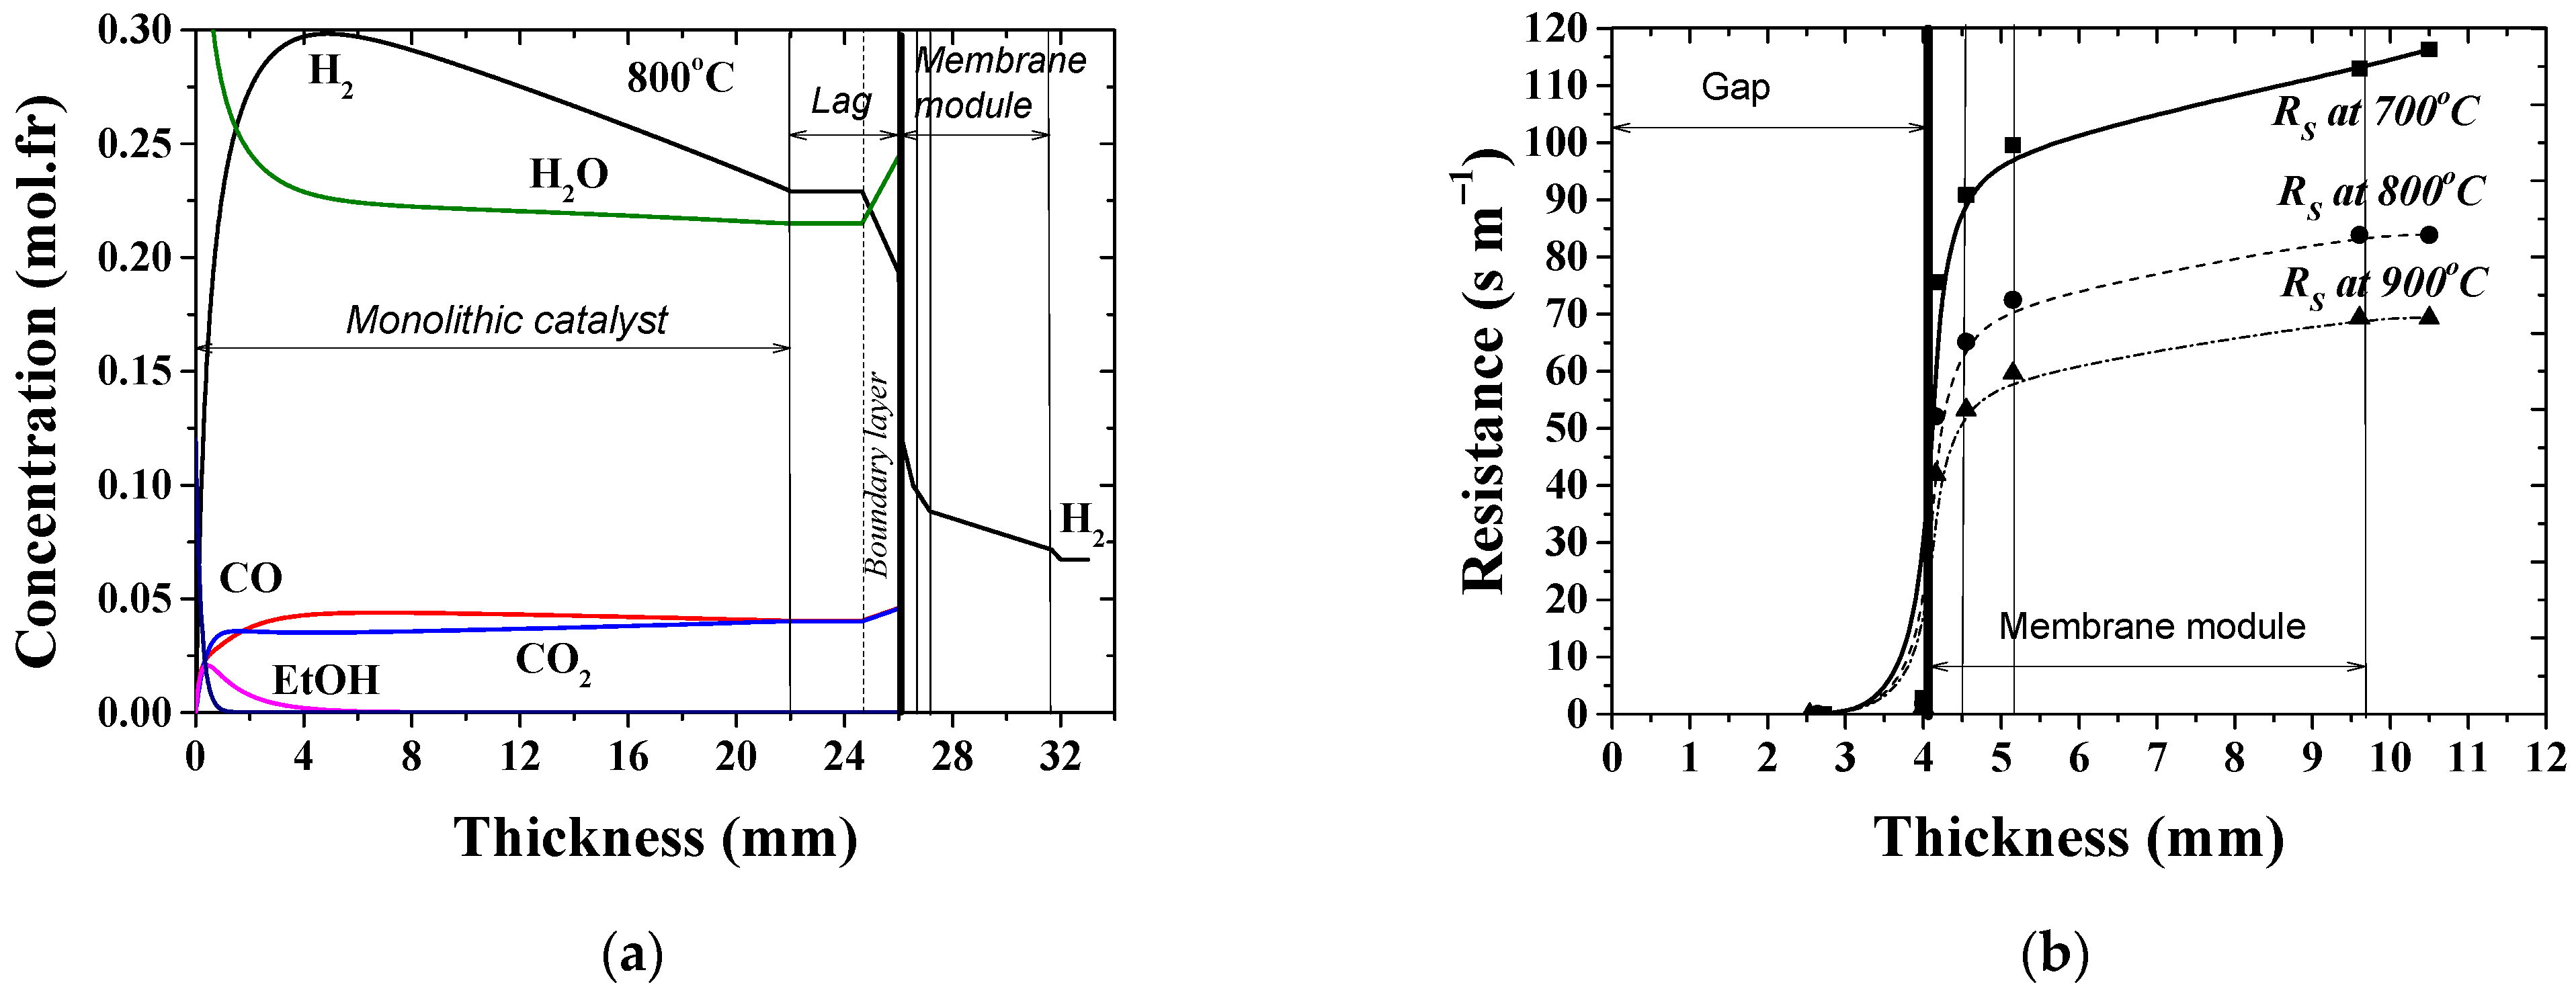
3.1.1. Verification of the Model Formulation and Computational Simulations
3.1.2. Performance Analysis
3.2. Parametric Study
4. Conclusions
- the use of a catalytic monolith with stagnant flow between the catalyst and membrane surface may increase both the production and flux of hydrogen, as well as reactor efficiency characteristics compared to a packed bed MR;
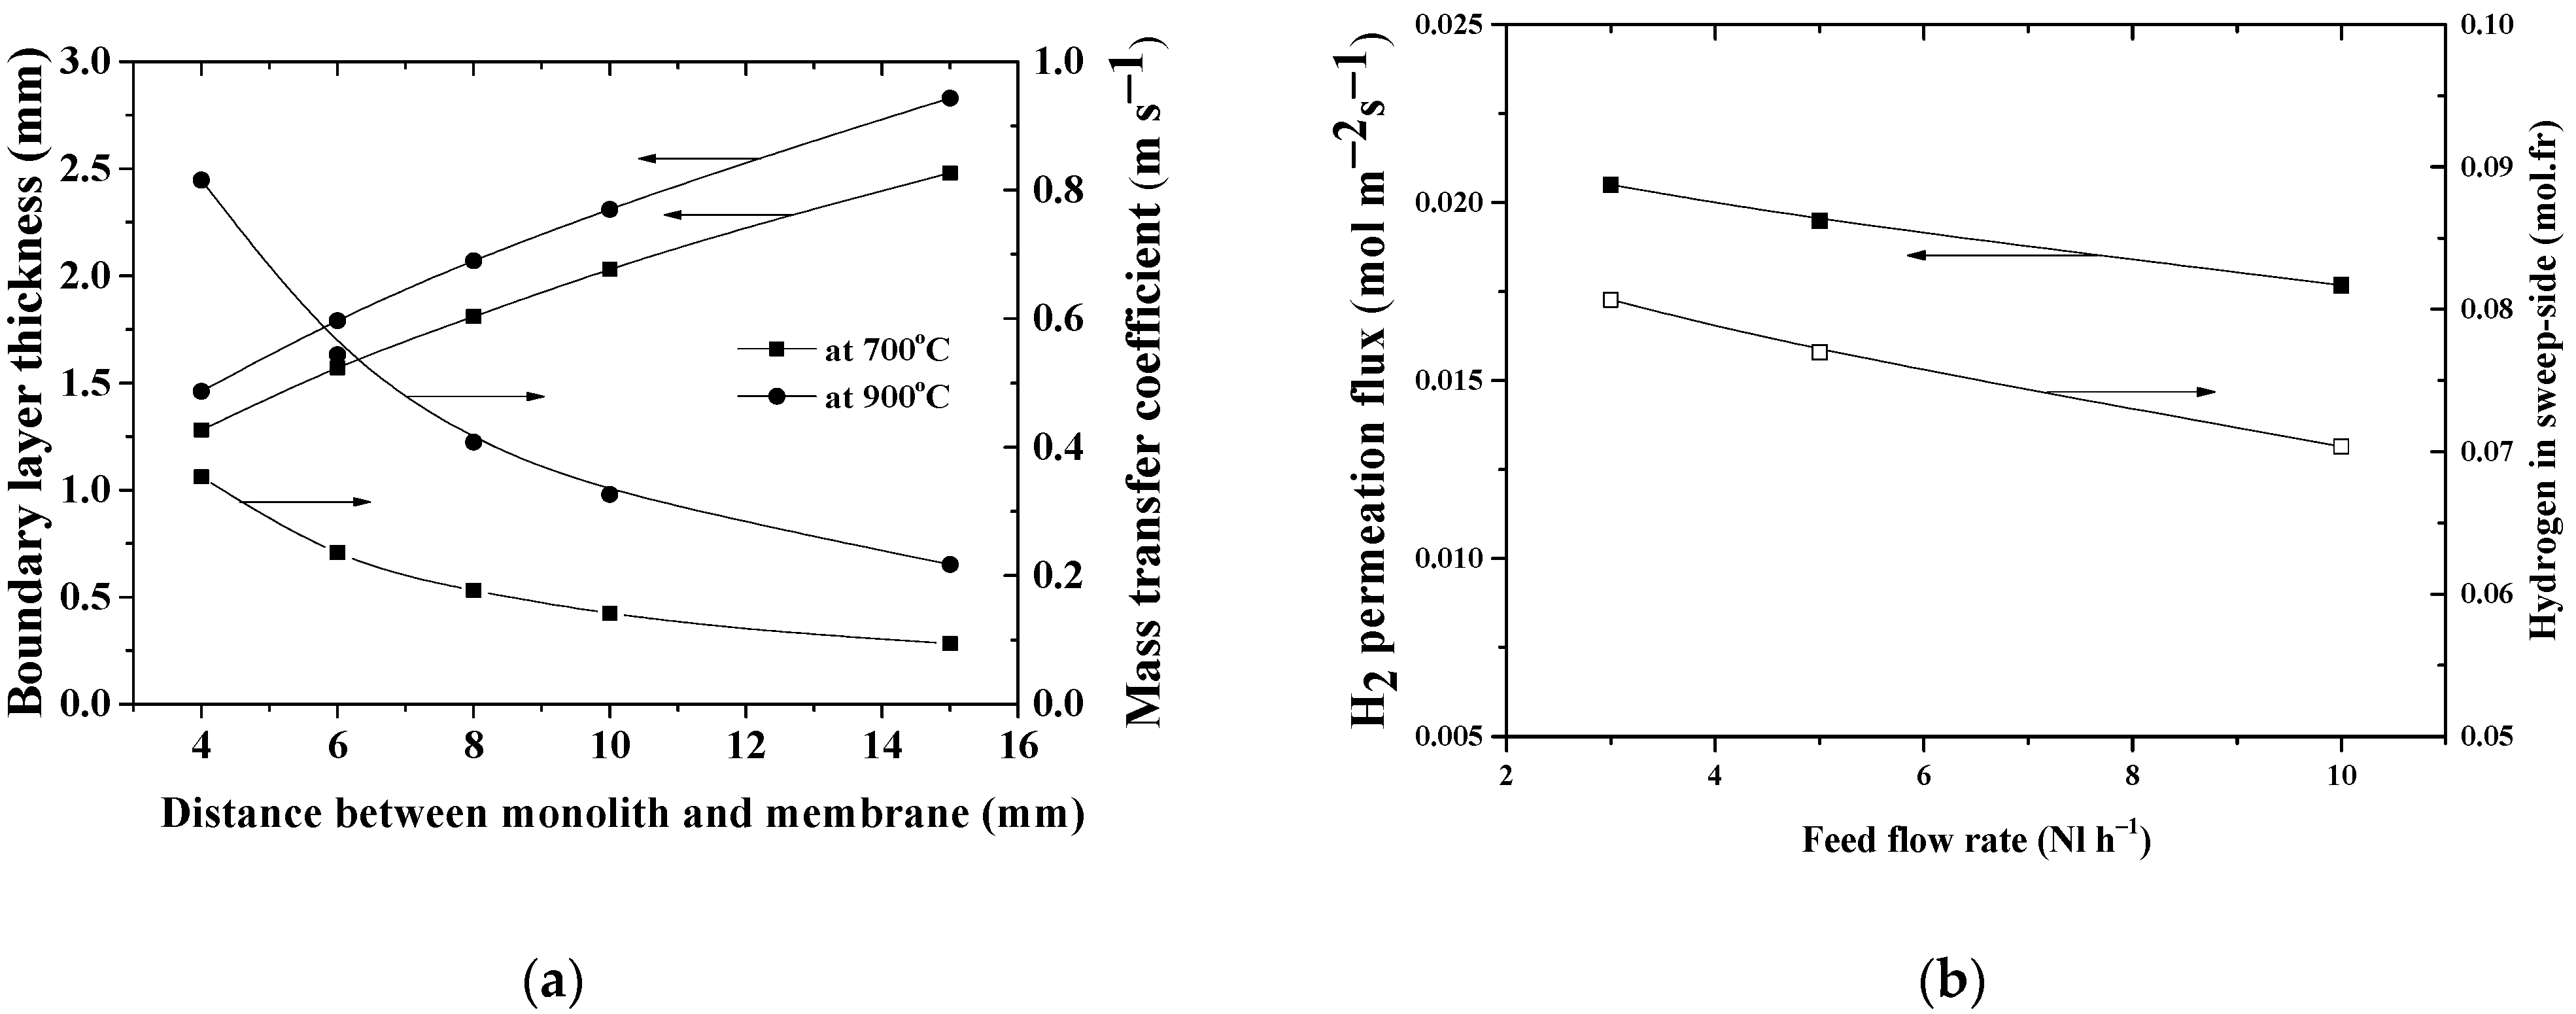
- the stagnate feed flow configuration must be adequately taken into account for the specific reactor design and the operating conditions; otherwise incorrect conclusions about the technological parameters will be derived. Thus, increasing the distance between the monolith and the membrane surface from 4 to 15 mm increases the thickness of the boundary layer from 1.28 mm to 2.48 mm at 700 °C, and from 1.46 mm to 2.83 mm at 900 °C with a corresponding reduction in the hydrogen flux (about 3–4%);
- at higher feed flow rates, the thickness of the boundary layer on the feed-side of the membrane decreases. However, in this case, lower values of both the hydrogen flux and hydrogen concentration in the sweep compartment are obtained, due to an increase in the hydrogen concentration in the retentate flow leaving the gap space. The higher the feed rate, the higher the negative effect of a greater gap height above the membrane surface can be;
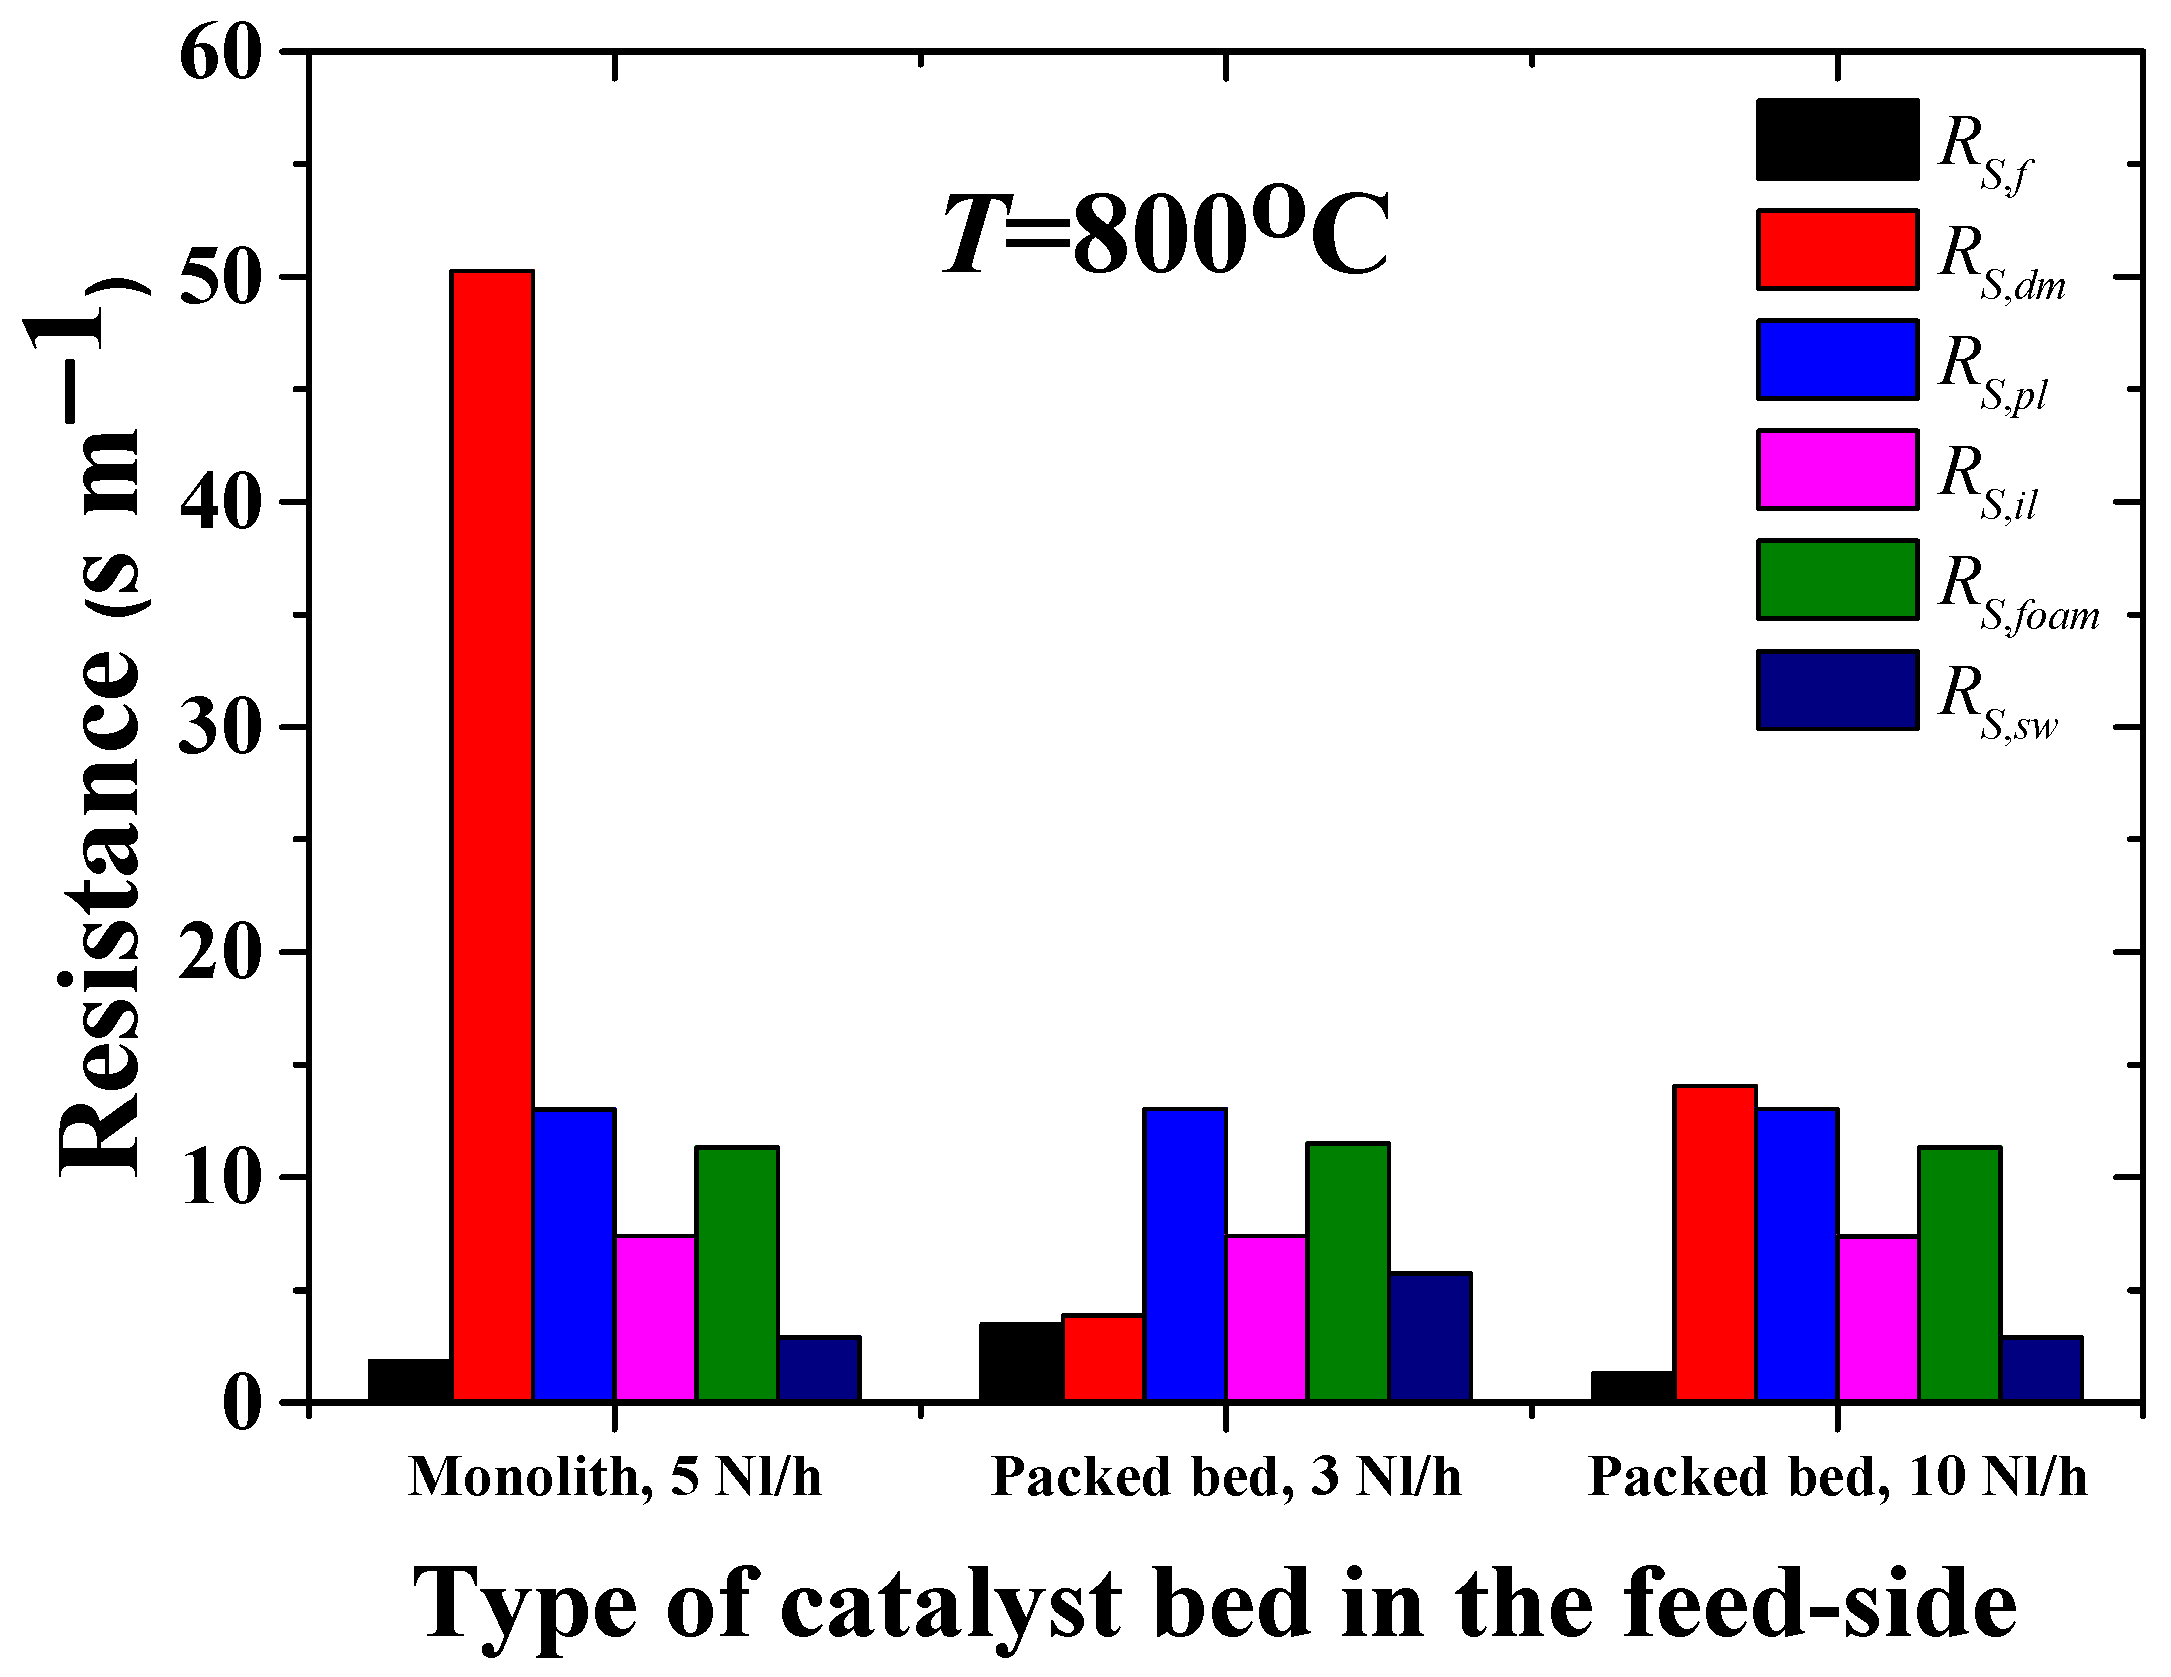
- the hierarchically structured asymmetric membrane support, which is often necessary for industrial applications, demonstrates a similar extent of resistance to hydrogen transport in the constituent gas-permeable layers of the membrane used in the study of MRs with monolith and packed bed catalysts and for different feed-flow rates. A variable contribution of the permselective layer is observed, and the permeation rate in the MR with the monolith is limited by the permeability of the dense membrane layer.
Author Contributions
Funding
Institutional Review Board Statement
Informed Consent Statement
Data Availability Statement
Conflicts of Interest
Nomenclature
| Am | effective area of the permeating surface (m2): |
| Amth | catalytic monolith cross section area (m2); |
| dcell | cell diameter of the foam layer in the membrane (m); |
| dpore,pl(il) | hydraulic pore diameter in the powder (intermediate) layer (m); |
| dp,foam | average diameter of the windows which connect the cells (m); |
| ds,avg | average cylindrical strut size (m); |
| Dij | binary diffusion coefficients (m2 s−1); |
| dh,mth | equivalent channel diameter of the catalytic monolith (m); |
| inlet feed molar gas flow rate (mol s−1); | |
| retentate product flow (mol s−1); | |
| hdm | thickness of the dense layer in the membrane module (m); |
| hfoam | thickness of the foam layer in the membrane module (m); |
| hgap | height of the gap with stagnate flow (m); |
| hil | thickness of the intermediate layer in the membrane module (m); |
| hmth | height of the catalytic monolith (m); |
| hpl | thickness of the powder layer in the membrane module (m); |
| hydrogen permeate flux through the asymmetric membrane (mol m−2 s−1); | |
| Mi | molecular mass of i-th component (g mol−1); |
| Mf | average molecular mass (g mol−1); |
| hydrogen partial pressure at the catalyst/membrane interface (Pa); | |
| Qdm | membrane permeance (mol m−2 s−1); |
| Re | Reynolds number; |
| Sc | Schmidt number; |
| SV,foam | foam layer of the membrane volumetric surface area (m2 m−3); |
| SV,il | intermediate layer of the membrane volumetric surface area (m2 m−3); |
| SV,mth | catalytic monolith volumetric surface area (m2 m−3); |
| SV,pl | powder layer of the membrane volumetric surface area (m2 m−3); |
| T | operation temperature (K or °C); |
| u | stagnation velocity gradient (s−1); |
| molar fraction of hydrogen the catalyst/dense layer interphase; | |
| molar fraction of hydrogen in the feed-side (-); | |
| xi,f | molar fraction of gas species in the feed-side (-); |
| Greek letters | |
| β | effective mass transfer coefficient (m s−1); |
| εfoam | porosity of the foam layer in the membrane module (-); |
| εil | porosity of the intermediate layer in the membrane (-); |
| εmth | porosity of the catalytic monolith (-); |
| εpl | porosity of the powder layer in the membrane module (-); |
| Θ | permeability (mol m−1 s−1 Pa−0.5); |
| mf | dynamic viscosity of the feed mixture (kg s−1 m−1) or (Pa s); |
| mfoam | dynamic viscosity of the gas mixture in foam layer (kg s−1 m−1) or (Pa s); |
| mI | dynamic viscosities of a specie (kg s−1 m−1) or (Pa s); |
| ρf | fluid density in the feed side (kg m−3); |
| ρtot | total molar density (mol m−3); |
| τfoam | tortuosity of the foam layer in the membrane module (-); |
| τil | tortuosity of the intermediate layer in the membrane module (-); |
| τpl | tortuosity of the powder layer in the membrane module (-). |
References
- Osman, A.I.; Mehta, N.; Elgarahy, A.M.; Hefny, M.; Al-Hinai, A.; Al-Muhtaseb, A.H.; Rooney, D.W. Hydrogen production, storage, utilisation and environmental impacts: A review. Environ. Chem. Lett. 2022, 20, 153–188. [Google Scholar] [CrossRef]
- Agyekum, E.B.; Nutakor, C.; Agwa, A.M.; Kamel, S. A critical review of renewable hydrogen production methods: Factors affecting their scale-up and its role in future energy generation. Membranes 2022, 12, 173. [Google Scholar] [CrossRef]
- Matson, S.L.; Quinn, J.A. Membrane reactors. In Membrane Handbook; Ho, W.S., Sirkar, K.K., Eds.; Van Nostrand Reinhold: New York, NY, USA, 1992; pp. 809–832. [Google Scholar]
- Nagy, E. Basic Equations of Mass Transport through a Membrane Layer, 2nd ed.; Elsevier: Amsterdam, The Netherlands, 2019. [Google Scholar]
- Algieri, C.; Coppola, G.; Mukherjee, D.; Shammas, M.I.; Calabro, V.; Curcio, S.; Chakraborty, S. Catalytic membrane reactors: The industrial applications perspective. Catalysts 2021, 11, 691. [Google Scholar] [CrossRef]
- Drioli, E.; Brunetti, A.; Profio, G.D.; Barbieri, G. Process intensification strategies and membrane engineering. Green Chem. 2012, 14, 1561–1572. [Google Scholar] [CrossRef]
- Amiri, T.Y.; Ghasemzageh, K.; Iulianelli, I.A. Membrane reactors for sustainable hydrogen production through steam reforming of hydrocarbons: A review. Chem. Eng. Proces. Process Intensif. 2020, 157, 108148. [Google Scholar] [CrossRef]
- Alique, D.; Bruni, G.; Sanz, R.; Calles, J.A.; Tosti, S. Ultra-pure hydrogen via co-valorization of olive mill wastewater and bioethanol in Pd-membrane reactors. Processes 2020, 8, 219. [Google Scholar] [CrossRef] [Green Version]
- Di Marcoberardino, G.; Binotti, M.; Manzolini, G.; Viviente, J.L.; Arratibel, A.; Roses, L.; Gallucci, F. Achievements of European projects on membrane reactor for hydrogen production. J. Clean Prod. 2017, 161, 1442–1450. [Google Scholar] [CrossRef] [Green Version]
- Taghizadeh, M.; Aghili, F. Recent advances in membrane reactors for hydrogen production by steam reforming of ethanol as a renewable resource. Rev. Chem. Eng. 2019, 35, 377–392. [Google Scholar] [CrossRef]
- Iulianelli, A.; Palma, V.; Bagnato, G.; Ruocco, C.; Huang, Y.; Veziroğlu, N.T.; Basile, A. From bioethanol exploitation to high grade hydrogen generation: Steam reforming promoted by a Co-Pt catalyst in a Pd-based membrane reactor. Renew. Energy 2018, 119, 834–843. [Google Scholar] [CrossRef]
- Basile, A.; Pinacci, P.; Iulianelli, A.; Broglia, M.; Drago, F.; Liguori, S.; Longo, T.; Calabrò, V. Ethanol steam reforming reaction in a porous stainless steel supported palladium membrane reactor. Int. J. Hydrogen Energy 2011, 36, 2029–2037. [Google Scholar] [CrossRef]
- Iulianelli, A.; Liguori, S.; Vita, A.; Italiano, C.; Fabiano, C.; Huang, Y.; Basile, A. The oncoming energy vector: Hydrogen produced in Pd-composite membrane reactor via bioethanol reforming over Ni/CeO2 catalyst. Catal. Today 2016, 259, 368–375. [Google Scholar] [CrossRef]
- Iulianelli, A.; Basile, A. Hydrogen production from ethanol via inorganic membrane reactors technology: A review. Catal. Sci. Technol. 2011, 1, 366–379. [Google Scholar] [CrossRef]
- Chen, W.-H.; Li, S.-C.; Lim, S.; Chen, Z.-Y.; Juan, J.C. Reaction and hydrogen production phenomena of ethanol steam reforming in a catalytic membrane reactor. Energy 2021, 220, 119737. [Google Scholar] [CrossRef]
- Mattos, L.V.; Jacobs, G.; Davis, B.H.; Noronha, F.B. Production of hydrogen from ethanol: Review of reaction mechanism and catalyst deactivation. Chem Rev. 2012, 112, 4094–4123. [Google Scholar] [CrossRef]
- Andreev, D.V.; Makarshin, L.L.; Gribovskii, A.G.; Zaikovskii, V.I.; Parmon, V.N. Ethanol steam reforming over Co/ZnO and Rh/Al2O3 catalysts in a microchannel catalytic reactor. Kinet Catal. 2014, 55, 798–808. [Google Scholar] [CrossRef]
- Sun, S.; Yan, W.; Sun, P.; Chen, J. Thermodynamic analysis of ethanol reforming for hydrogen production. Energy 2012, 44, 911–924. [Google Scholar] [CrossRef]
- Saidi, M.; Jahangiri, A. Theoretical study of hydrogen production by ethanol steam reforming: Technical evaluation and performance analysis of catalytic membrane reactor. Int. J. Hydrogen Energy 2018, 43, 15306–15320. [Google Scholar] [CrossRef]
- Contreras, J.L.; Salmones, J.; Colín-Luna, J.A.; Nuco, L.; Quintana, B.; Cyrdova, I.; Zeifert, B.; Tapia, C.; Fuentes, G.A. Catalysts for H2 production using the ethanol steam reforming (a review). Int. J. Hydrogen Energy 2014, 39, 18835–18853. [Google Scholar] [CrossRef]
- Hou, T.; Zhang, S.; Chen, Y.; Wang, D.; Cai, W. Hydrogen production from ethanol reforming: Catalysts and reaction mechanism. Renew. Sustain. Energy Rev. 2015, 44, 132–148. [Google Scholar] [CrossRef]
- Soykal, I.I.; Sohn, H.; Ozkan, U.S. Effect of support particle size in steam reforming of ethanol over Co/CeO2 catalysts. ACS Catal. 2012, 2, 2335–2348. [Google Scholar] [CrossRef]
- Liu, Z.Y.; Duchon, T.; Wang, H.R.; Peterson, E.W.; Zhou, Y.H.; Luo, S.; Zhou, J.; Matolin, V.; Stacchiola, D.J.; Rodriguez, J.A.; et al. Mechanistic insights of ethanol steam reforming over Ni-CeOx(111): The importance of hydroxyl groups for suppressing coke formation. J. Phys. Chem. C 2015, 119, 18248–18256. [Google Scholar] [CrossRef]
- Mondal, T.; Pant, K.K.; Dalai, A.K. Mechanistic kinetic modeling of oxidative steam reforming of bioethanol for hydrogen production over Rh-Ni/CeO2-ZrO2 catalyst. Ind. Eng. Chem. Res. 2016, 55, 86–98. [Google Scholar] [CrossRef]
- Anil, S.; Indraja, S.; Singh, R.; Appari, S.; Roy, B. A review on ethanol steam reforming for hydrogen production over Ni/Al2O3 and Ni/CeO2 based catalyst powders. Int. J. Hydrogen Energy 2022, 47, 8177–8213. [Google Scholar] [CrossRef]
- Słowik, G.; Greluk, M. The Influence of active phase composition and reaction temperature on the catalytic properties of K-promoted Co–Ni/CeO2 catalysts in the steam reforming of ethanol. Catal. Lett. 2022, in press. [Google Scholar] [CrossRef]
- Ferreira, G.R.; Nogueira, F.G.; Lucrédio, A.F.; Assaf, E.M. Ethanol steam reforming by Ni catalysts for H2 production: Evaluation of Gd effect in CeO2 support. Catal. Lett. 2022, in press. [Google Scholar] [CrossRef]
- Mulewa, W.; Tahir, M.; Amin, N.A.S. Ethanol steam reforming for renewable hydrogen production over La-modified TiO2 catalyst. Chem. Eng. Trans. 2017, 56, 349–354. [Google Scholar]
- Rajabi, Z.; Martinelli, M.; Upton, G.F.; Watson, C.D.; Cronauer, D.C.; Kropf, A.J.; Jacobs, G. Low temperature ethanol steam reforming: Selectivity control with lithium doping of Pt/m-ZrO2. Catal. Today 2022, in press. [Google Scholar] [CrossRef]
- Dalena, F.; Giglio, E.; Marino, A.; Aloise, A.; Giorgianni, G.; Migliori, M.; Giordano, G. Steam Reforming of Bioethanol Using Metallic Catalysts on Zeolitic Supports: An Overview. Catalysts 2022, 12, 617. [Google Scholar] [CrossRef]
- Bepari, S.; Sarkar, J.J.; Pradhan, N.C. Kinetics of ethanol steam reforming over Ni/Olivine catalyst. Int. J. Hydrogen Energy 2022, in press. [Google Scholar] [CrossRef]
- Elharati, M.A.; Lee, K.M.; Hwang, S.; Hussain, A.M.; Miura, Y.; Dong, S.; Fukuyama, Y.; Dale, N.; Saunders, S.; Kim, T.; et al. The effect of silica oxide support on the catalytic activity of nickel-molybdenum bimetallic catalyst toward ethanol steam reforming for hydrogen production. Chem. Eng. J. 2022, 441, 135916. [Google Scholar] [CrossRef]
- Chen, B.; Xu, Y.; Xiong, C.; Rickard, S.; Boscoboinik, J.A.; Jiang, D.E.; Kidder, M.; Savara, A. Mechanism for acetone and crotonaldehyde production during steam reforming of ethanol over La0.7Sr0.3MnO3–x perovskite: Evidence for a shared C4 aldol addition intermediate. ACS Catal. 2022, 12, 4358–4374. [Google Scholar] [CrossRef]
- Li, X.; Li, J. Fluxes and driving forces in membrane separation processes. In Encyclopedia of Membranes; Drioli, E., Giorno, L., Eds.; Springer: Berlin/Heidelberg, Germany, 2015; pp. 1–3. [Google Scholar]
- Matsuura, T. Membrane separation technologies. In Wastewater Recycle, Reuse, and Reclamation; Vigneswaran, S., Ed.; EOLSS: Abu Dhabi, United Arab Emirates, 2009; Volume 1, pp. 98–135. [Google Scholar]
- Manohar. Development & characterization of ceramic membranes. Int. J. Mod. Eng. Res. 2021, 2, 1492–1506. [Google Scholar]
- Gozόlvez-Zafrilla, J.M.; Santafé-Moros, A.; Escolástico, S.; Serra, J.M. Fluid dynamic modeling of oxygen permeation through mixed ionic–electronic conducting membranes. J. Membr. Sci. 2011, 378, 290–300. [Google Scholar] [CrossRef]
- Hong, J.; Kirchen, P.; Ghoniem, A. Numerical simulation of ion transport membrane reactors: Oxygen permeation and transport and fuel conversion. J. Membr. Sci. 2012, 407–408, 71–85. [Google Scholar] [CrossRef]
- Khodaei, M.; Darabi, Z.; Omidifar, M. Modeling and simulation of the fluid dynamic and performance of the Pd-based membrane by CFD for hydrogen separation. Iran. J. Hydrog. Fuel Cell 2022, 9, 19–25. [Google Scholar]
- Sheintuch, M.; Nekhamkina, O. Architecture alternative for propane dehydrogenation in a membrane reactor. Chem. Eng. J. 2018, 347, 900–912. [Google Scholar] [CrossRef]
- Ghasemzadeh, K.; Aghaeinejad-Meybodi, A.; Iulianelli, A.; Basile, A. Theoretical performance evaluation of inorganic (non Pd-based) membranes for hydrogen separation. J. Membr. Sci. Res. 2018, 4, 198–203. [Google Scholar]
- Arratibel Plazaola, A.; Pacheco Tanaka, D.A.; van Sint Annaland, M.; Gallucci, F. Recent advances in Pd-based membranes for membrane reactors. Molecules 2017, 22, 51. [Google Scholar] [CrossRef] [PubMed] [Green Version]
- Miachon, S.; Dalmon, J.-A. Catalysis in membrane reactors: What about the catalyst? Top. Catal. 2004, 29, 59–65. [Google Scholar] [CrossRef]
- Sadykov, V.A.; Eremeev, N.F.; Fedorova, Y.E.; Krasnov, A.V.; Bobrova, L.N.; Bespalko, Y.N.; Lukashevich, A.I.; Skriabin, P.I.; Smorygo, O.L.; Van Veen, A.C. Design and performance of asymmetric supported membranes for oxygen and hydrogen separation. Int. J. Hydrogen Energy 2021, 46, 20222–20239. [Google Scholar] [CrossRef]
- Bobrova, L.; Eremeev, N.; Vernikovskaya, N.; Sadykov, V.; Smorygo, O. Effect of asymmetric membrane structure on hydrogen transport resistance and performance of a catalytic membrane reactor for ethanol steam reforming. Membranes 2021, 11, 332. [Google Scholar] [CrossRef] [PubMed]
- Montebelli, A.; Visconti, C.G.; Groppi, G.; Tronconi, E.; Cristiani, C.; Ferreira, C.; Kohler, S. Methods for the catalytic activation of metallic structured substrates. Catal. Sci. Technol. 2014, 4, 2846–2870. [Google Scholar] [CrossRef]
- Haase, S.; Murzin, D.Y.; Salmi, T. Review on hydrodynamics and mass transfer in minichannel wall reactors with gas–liquid Taylor flow. Chem. Eng. Res. Des. 2016, 113, 304–329. [Google Scholar] [CrossRef]
- Eremeev, N.; Krasnov, A.; Bespalko, Y.; Bobrova, L.; Smorygo, O.; Sadykov, V. An experimental performance study of a catalytic membrane reactor for ethanol steam reforming over a metal honeycomb catalyst. Membranes 2021, 11, 790. [Google Scholar] [CrossRef]
- Boon, M. Scientific concepts in the engineering sciences epistemic tools for creating and intervening with phenomena. In Scientific Concepts and Investigative Practice; Feest, J., Steinle, F., Eds.; De Gruyter: Berlin, Germany, 2012; pp. 219–243. [Google Scholar]
- Bespalko, Y.; Eremeev, N.; Skryabin, P.; Krieger, T.; Chesalov, Y.; Lapina, O.; Khabibulin, D.; Ulihin, A.; Uvarov, N.; Sadykov, V. Structural and transport properties of neodymium tungstates prepared via mechanochemical activation. Ceram. Int. 2019, 45, 9529–9536. [Google Scholar] [CrossRef]
- Leonov, A.; Romashko, A. Laminar Ni-NixAl-Al2O3 foam material with high oxidation resistance. In Proceedings of the International Conference on Cellular metals and Metal Foaming Technology, Berlin, Germany, 23–25 June 2003; Banhart, J., Fleck, N.A., Mortensen, A., Eds.; MIT-Verlag: Berlin, Germany, 2003; pp. 271–274. [Google Scholar]
- Grelf.Net—Joyce Loebl Magiscan Image Analyser. Available online: https://www.grelf.net/magiscan.html (accessed on 20 July 2022).
- Reedy, C.L.; Anderson, J.; Reedy, T.J.; Liu, Y. Image analysis in quantitative particle studies of archaeological ceramic thin sections. Adv. Archaeol. Pract. 2014, 2, 252–268. [Google Scholar] [CrossRef] [Green Version]
- Wang, C.Y. Similarity stagnation point solutions of the Navier-Stokes equations—Review and extension. Eur. J. Mech. B Fluids 2008, 27, 678–683. [Google Scholar] [CrossRef]
- Homann, F. Der Einfluss grosser Zahigkeit bei der Stromung um den Zylinder und um die Kugel. Z. Angew. Math. Mech. 1936, 16, 153–164. [Google Scholar] [CrossRef]
- Matera, S.; Reuter, K. Transport limitations and bistability for in situ CO oxidation at RuO2 (110): First-principles based multiscale modeling. Phys. Rev. B Condens. Matter Mater. Phys. 2010, 82, 085446. [Google Scholar] [CrossRef] [Green Version]
- Matera, S.; Reuter, K. When atomic-scale resolution is not enough: Spatial effects on in situ model catalyst studies. J. Catal. 2012, 295, 261–268. [Google Scholar] [CrossRef] [Green Version]
- Zanier, F.; Michelon, N.; Canu, P. Design and characterization of a stagnation flow reactor for heterogeneous microkinetic studies. Chem. Eng. J. 2017, 315, 67–82. [Google Scholar] [CrossRef]
- Levenspiel, O. Chemical Reaction Engineering, 3rd ed.; John Wiley & Sons: New York, NY, USA, 1999. [Google Scholar]
- Incropera, F.P.; Bergman, T.L.; Lavine, A.S.; DeWitt, D.P. Fundamentals of Heat and Mass Transfer, 8th ed.; Wiley: Hoboken, NJ, USA, 2018; 992p. [Google Scholar]
- López, E.; Divins, N.J.; Anzola, A.; Schbib, S.; Borio, D.; Llorca, J. Ethanol steam reforming for hydrogen generation over structured catalysts. Int. J. Hydrogen Energy 2013, 38, 4418–4428. [Google Scholar] [CrossRef]
- Taylor, G. Dispersion of soluble matter in solvent flowing slowly through a tube. Proc. R. Soc. Lond. Math. Phys. Eng. Sci. 1953, 219, 186–203. [Google Scholar]
- Aris, R. On the dispersion of a solute in a fluid flowing through a tube. Proc. R.Soc. Lond. Math. Phys. Eng. Sci. 1956, 235, 67–77. [Google Scholar]
- Reid, R.C.; Sherwood, T.K.; Prausnitz, J. The Properties of Gases and Liquids, 3rd ed.; McGraw-Hill: New York, NY, USA, 1977. [Google Scholar]
- Fuller, E.N.; Schettler, P.D.; Giddings, J.C. A new method for prediction of binary gas-phase diffusion coefficients. Ind. Eng. Chem. 1966, 58, 19–27. [Google Scholar] [CrossRef]
- Hiemenz, K. Die Grenzschicht an einem in den gleichformingen Flussigkeits-strom einge-tauchten graden Kreiszylinder. Dinglers Polytech. J. 1911, 326, 321–324. [Google Scholar]
- Seader, J.D.; Henley, E.J.; Roper, K. Separation Process Principles: Chemical and Biochemical Operations, 3rd ed.; Wiley: Hoboken, NJ, USA, 2011. [Google Scholar]
- Siblukin, M. Heat transfer near the forward stagnation point of a body of revolution. J. Aeronaut. Sci. 1952, 19, 570–571. [Google Scholar]
- Truitt, R.W. Fundamentals of Aerodynamic Heating; Ronald Press: New York, NY, USA, 1960. [Google Scholar]
- Schlichting, H. Boundary Layer Theory, 4th ed.; McGraw-Hill Book Company: New York, NY, USA; London, UK, 1960. [Google Scholar]
- Nagy, E. Basic Equations of the Mass Transport Through a Membrane Layer, 1st ed.; Elsevier Insights, Elsevier: Amsterdam, The Netherlands; Boston, MA, USA, 2012. [Google Scholar]
- Deveau, N.D.; Ma, Y.H.; Datta, R. Beyond Sieverts’ law: A comprehensive microkinetic model of hydrogen permeation in dense metal membranes. J. Membr. Sci. 2013, 437, 298–311. [Google Scholar] [CrossRef]
- Suzuki, A.; Yukawa, H.; Nambu, T.; Matsumoto, Y.; Murata, Y. Consistent description of hydrogen permeability through metal membrane based on hydrogen chemical potential. Int. J. Hydrogen Energy 2014, 39, 7919–7924. [Google Scholar] [CrossRef]
- Suzuki, A.; Yukawa, H. A Review for consistent analysis of hydrogen permeability through dense metallic membranes. Membranes 2020, 10, 120. [Google Scholar] [CrossRef] [PubMed]
- Uvarov, N.F.; Ulichin, A.C.; Bespalko, Y.N.; Eremeeev, N.F.; Krasnov, A.V.; Skriabin, P.I.; Sadykov, V.A. Study of proton conductivity of composite metal-ceramic materials based on neodimium tugstates using a four-electrode technique with ionic probes. Int. J. Hydrogen Energy 2018, 43, 19521–19527. [Google Scholar] [CrossRef]
- Ambrosetti, M.; Bracconi, M.; Groppi, G.; Tronconi, E. Analytical geometrical model of open cell foams with detailed description of strut-node intersection. Chem. Ing. Tech. 2017, 89, 915–925. [Google Scholar] [CrossRef]
- Inayat, A.; Klumpp, M.; Lämmermann, M.; Freund, H.; Schwieger, W. Development of a new pressure drop correlation for open-cell foams. Chem. Eng. J. 2016, 287, 70–719. [Google Scholar] [CrossRef]
- Bracconi, M.; Ambrosetti, M.; Maestri, M.; Groppi, G.; Tronconi, E. A fundamental investigation of gas/solid mass transfer in open-cell foams using a combined experimental and CFD approach. Chem. Eng. J. 2018, 352, 558–571. [Google Scholar] [CrossRef]
- Bhattacharya, S.; Hwang, S.-T. Concentration polarization, separation factor, and Peclet number in membrane processes. J. Membr. Sci. 1997, 132, 73–90. [Google Scholar] [CrossRef]
- Nagy, E.; Vitai, M. Analysis of mass transport through anisotropic, catalytic/bio-catalytic membrane reactors. Catalysts 2019, 9, 358. [Google Scholar] [CrossRef] [Green Version]
- Henis, J.M.; Tripodi, M.K. Composite hollow fiber membranes for gas separation: The resistance model approach. J. Membr. Sci. 1981, 8, 233–246. [Google Scholar] [CrossRef]
- Huang, T.C.; Wie, M.C.; Chen, H.I. Permeation of hydrogen through palladium/alumina composite membrane. Sep. Sci. Technol. 2001, 36, 199–222. [Google Scholar] [CrossRef]
- Iwuchukwu, I.J.; Sheth, A. Mathematical modeling of high temperature and high-pressure dense membrane separation of hydrogen from gasification. Chem. Eng. Proc. 2008, 47, 1292–1304. [Google Scholar] [CrossRef]
- Cardoso, S.P.; Lin, Z.; Portugal, I.; Rodrigues, A.E.; Silva, C.M. Synthesis, dynamic characterization, and modeling studies of an AM-3 membrane for light gases separation. Microporous Mesoporous Mater. 2018, 261, 170–180. [Google Scholar] [CrossRef]


| Variable | Units | Value |
| Feed-side | ||
| Catalytic monolith: | ||
| Height (hmth) | mm | 22 |
| Diameter (dmth) | mm | 24 |
| Cross section area (Amth) | mm2 | 452.16 |
| Equivalent channel diameter (dh,mth) | mm | 0.6926 |
| Porosity (εmth) | (-) | 0.58 |
| Volumetric surface area (SV,mth) | m2 m−3 | 3355 |
| Flow rate of ethanol | Nl h−1 | 0.6 |
| Flow rate of steam | Nl h−1 | 2.4 |
| Flow rate of argon | Nl h−1 | 2.0 |
| Gap with stagnate flow: | ||
| height (hgap) | mm | 4 |
| Sweep-side | ||
| Membrane module: | ||
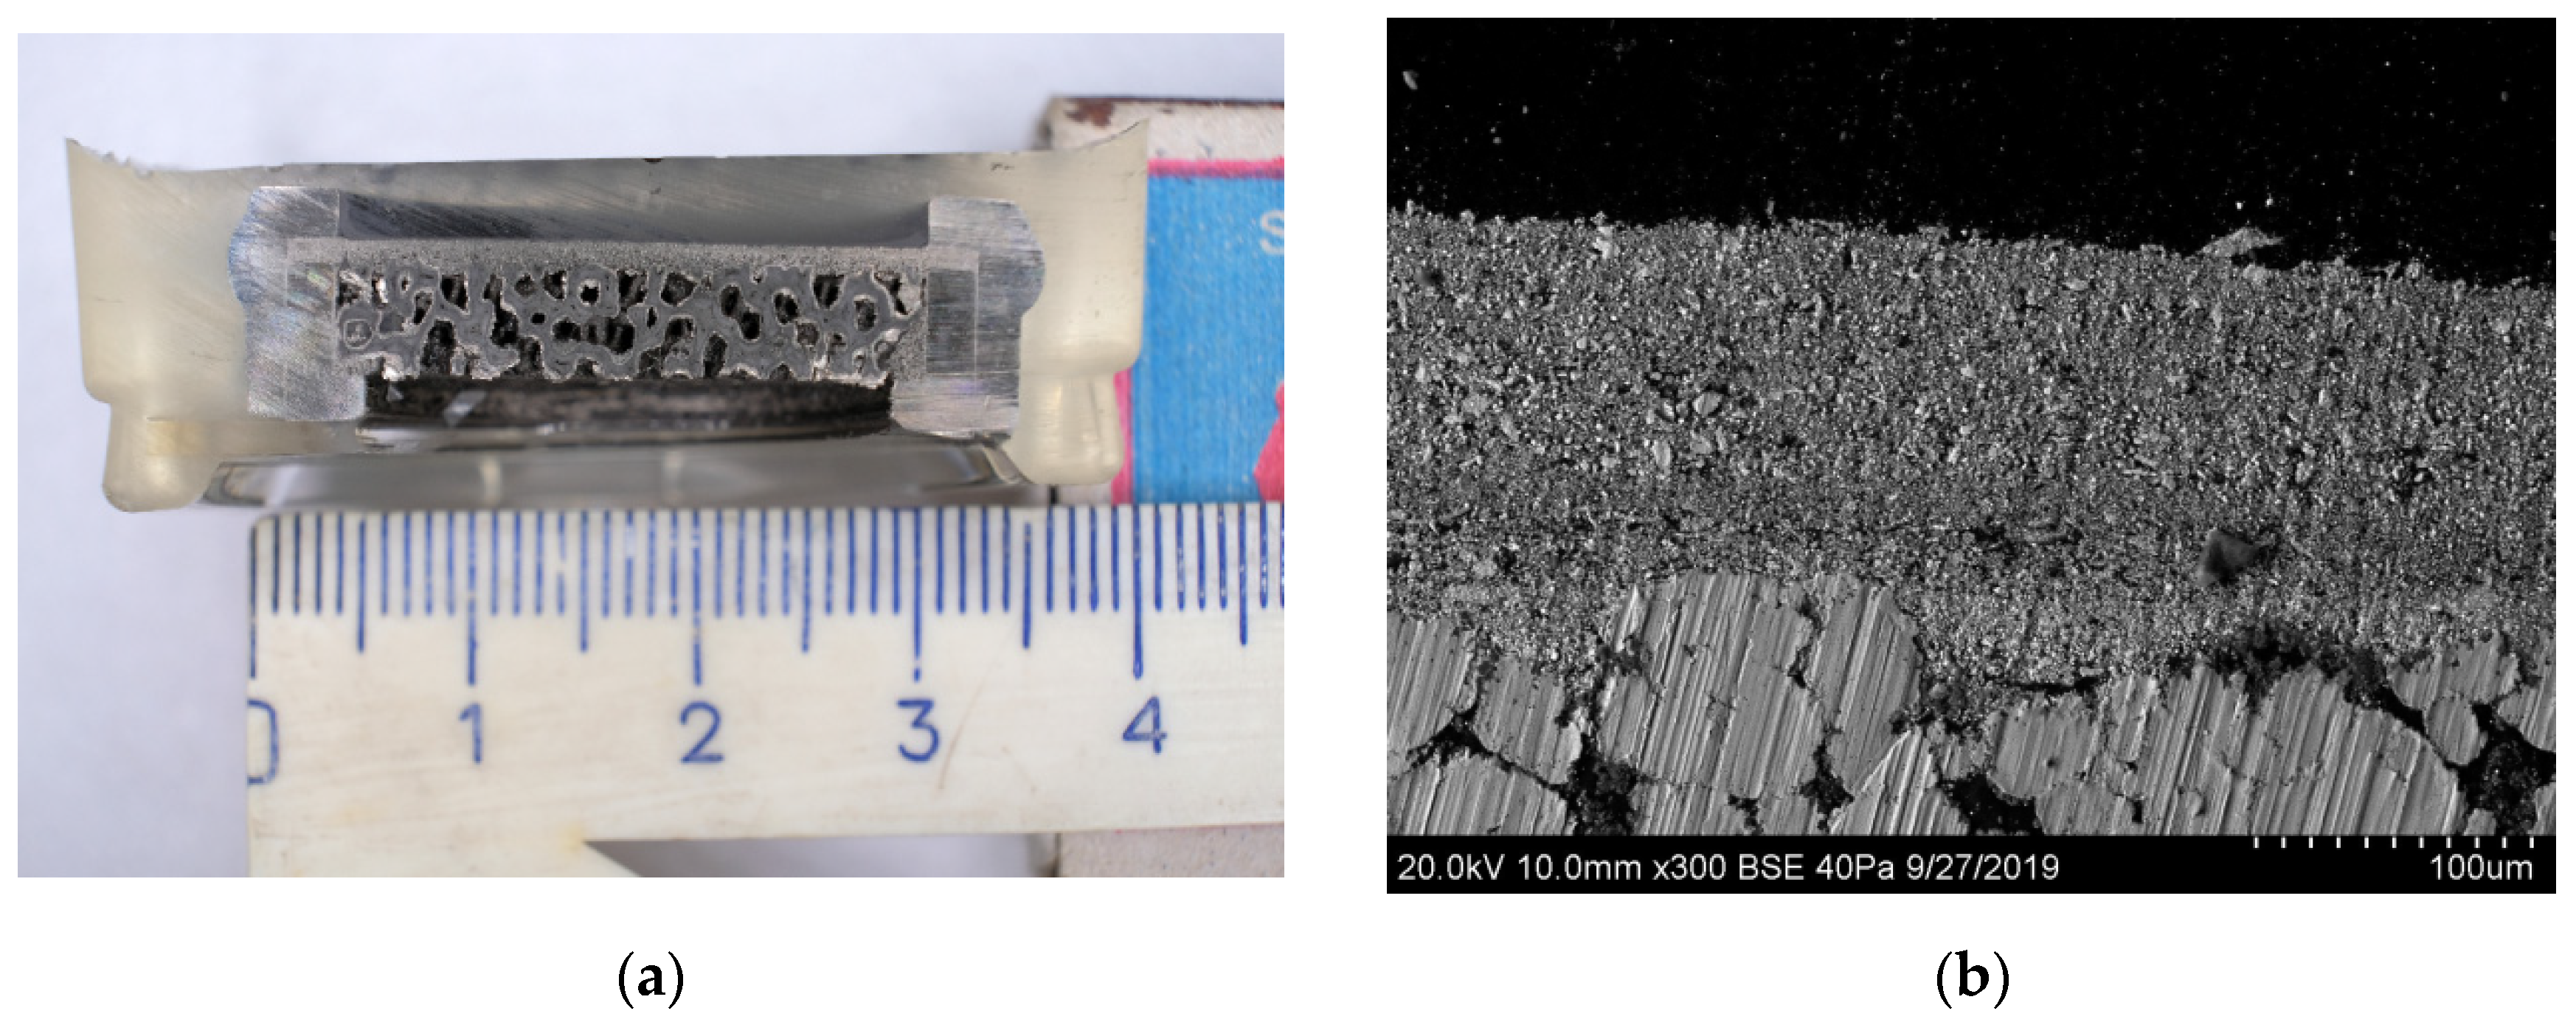
| Dense layer | ||
| Thickness (hdm) | mm | 0.15 |
| Powder layer | ||
| Thickness (hpl) | mm | 0.4 |
| Particle size (dpl) | mm | 0.072 |
| Hydraulic pore diameter (dpore,pl) | mm | 0.012 |
| Porosity (εpl) | (-) | 0.2 |
| Tortuosity(τpl) | (-) | 4.2 |
| Volumetric surface area (SV,pl) | m2 m−3 | 66,667 |
| Intermediate layer | ||
| Thickness (hil) | mm | 0.6 |
| Particle size (dil) | mm | 0.061 |
| Hydraulic pore diameter(dpore,il) | mm | 0.027 |
| Porosity (εil) | (-) | 0.4 |
| Tortuosity (τil) | (-) | 3.4 |
| Volumetric surface area (SV,il) | m2 m−3 | 59,259 |
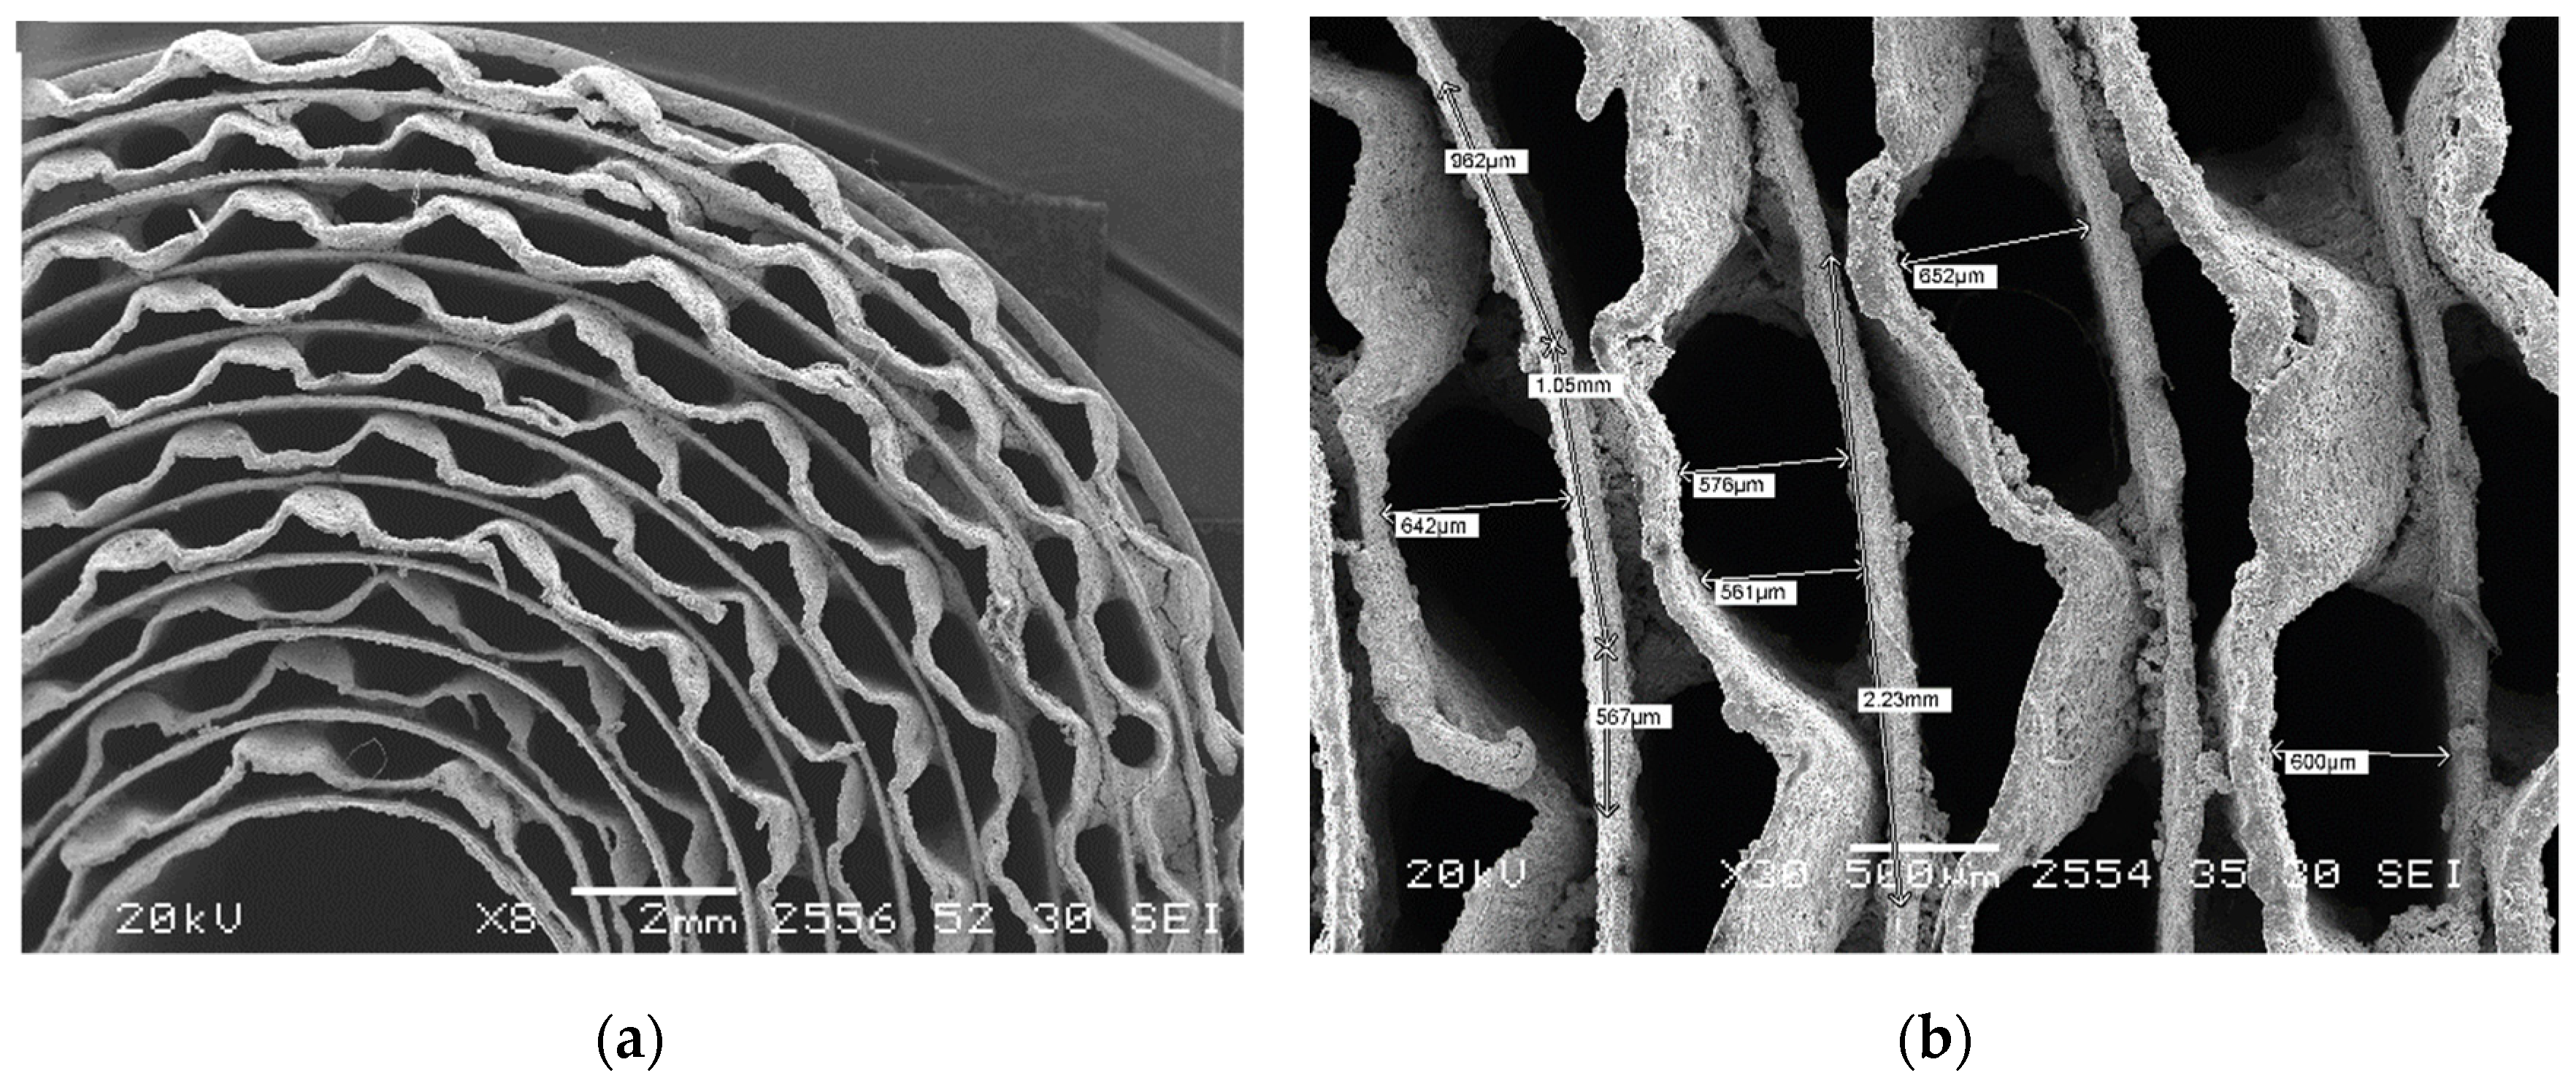
| Foam layer | ||
| Thickness (hfoam) | mm | 4.5 |
| Cell diameter (dcell) | mm | 2.2 |
| Hydraulic pore diameter (dp,foam) | mm | 1.006 |
| Porosity (εfoam) | (-) | 0.75 |
| Tortuosity (τfoam) | (-) | 1.42 |
| Volumetric surface area (SV,foam) | m2 m−3 | 1395.4 |
| Flow rate of argon | Nl h−1 | 10 |
| Layer | Composition | Thickness (µm) | True Density (g cm−3) | Particle Size b (µm) | Pore Diameter b (µm) | Porosity c (%) |
|---|---|---|---|---|---|---|
| Dense layer | Ni–Cu/Nd5.5WO11.25-δ | 93.3–115 (center); 194–256 (edge) | 6.6 | 0.045 for Ni–Cu, 0.1–1 for Nd5.5WO11.25-δ | 15 (x) 42 (y) | ~4 |
| Powder layer | Ni-Al | 380–440 | ~7 | 65 (x) 81 (y) | 12 (x) 11 (y) | 12–14 |
| Intermediate layer | Ni-Al | 400–1300 | 5.34 | 45 (x) 50 (y) | 27 (x) 27 (y) | 27–32 |
| Foam layer | Al2O3-SiO2 foam with Ni-Al coating | 4500–5000 | 4.63 | 2400(x) a 1800 (y) a | 1000 (x) 1100 (y) | 38–40 83 d |
| Monolith bed | |
| Component molar balance , where | |
| Conservation equation for the change in the total molar flow rate | |
| Boundary conditions | |
| Inlet (z = 0): | |
| Outlet (z = hmth): | |
| Gap with stagnate flow | |
| Retentate product flow | |
| Mole fractions in the retentate gas flow | |
| Reactions | Rate Equations | |||||
|---|---|---|---|---|---|---|
| Kinetic rate constant | Equilibrium constant | Reaction quotient for a reaction | ||||
| Parameters of the rate equations for the reactions | ||||||
| Unit | ||||||
| 1.4 × 10⁴ | 51 | - | - | |||
| 1.86 × 10⁵ | 72 | 1 | 2 | |||
| 4.08 × 10⁴ | 52 | 1 | 1 | |||
| 1.408 × 10⁴ | 81 | 1 | 1.25 | |||
| Effective axial dispersion of mass in the monolith | |||
| Hydrogen mass transfer coefficient at feed-side of the membrane | |||
| The reference viscosity at reference temperature and Sutherland’s temperature for gaseous substances | |||
| Substance | C, Sutherland’s temperature (K) | T0, reference temperature (K) | reference viscosity (kg s−1 m−1) |
| H2O | 673 | 873.16 | 3.09 × 10⁻⁵ |
| CH4 | 164 | 873.16 | 2.46 × 10⁻⁵ |
| CO2 | 240 | 873.16 | 3.61 × 10⁻⁵ |
| CO | 102 | 873.16 | 3.63 × 10⁻⁵ |
| H2 | 72 | 873.16 | 1.83 × 10⁻⁵ |
| Ar | 142 | 873.16 | 4.87 × 10⁻⁵ |
| Dense layer of a thickness hdm in the membrane module | ||
| Hydrogen flow at steady state | ||
| Real solution of a quadratic from the parity equation for | ||
| Activation energy (J mol−1) 60,000 | ||
| Powder layer of the membrane module | ||
| Boundary conditions: at z = hmth + hgap + hdm: | ||
| at z = hmth + hgap + hdm + hpl: | ||
| Intermediate layer of the membrane module | ||
| Boundary conditions: at z = hmth + hgap + hdm + hpl: | ||
| at z = hmth + hgap + hdm + hpl + hil: | ||
| Foam layer in the membrane module | ||
| where pore diameter | Tortuosity | |
| Boundary conditions: at z = hmth + hgap + hdm + hpl + hil: at z = hmth + hgap + hdm + hpl + hil + hfoam: | ||
| Hydrogen effective mass transfer coefficient at the sweep-side | ||
| Sweep compartment | ||
| Volumetric gas flow rate and | ||
Publisher’s Note: MDPI stays neutral with regard to jurisdictional claims in published maps and institutional affiliations. |
© 2022 by the authors. Licensee MDPI, Basel, Switzerland. This article is an open access article distributed under the terms and conditions of the Creative Commons Attribution (CC BY) license (https://creativecommons.org/licenses/by/4.0/).
Share and Cite
Bobrova, L.; Vernikovskaya, N.; Eremeev, N.; Sadykov, V. Model-Based Performance Analysis of Membrane Reactor with Ethanol Steam Reforming over a Monolith. Membranes 2022, 12, 741. https://doi.org/10.3390/membranes12080741
Bobrova L, Vernikovskaya N, Eremeev N, Sadykov V. Model-Based Performance Analysis of Membrane Reactor with Ethanol Steam Reforming over a Monolith. Membranes. 2022; 12(8):741. https://doi.org/10.3390/membranes12080741
Chicago/Turabian StyleBobrova, Ludmilla, Nadezhda Vernikovskaya, Nikita Eremeev, and Vladislav Sadykov. 2022. "Model-Based Performance Analysis of Membrane Reactor with Ethanol Steam Reforming over a Monolith" Membranes 12, no. 8: 741. https://doi.org/10.3390/membranes12080741