
Seaweed and Dendritic Growth in Unsaturated Fatty Acid Monolayers


Abstract
:
1. Introduction
2. Materials and Methods
2.1. Materials
2.2. Pockels-Langmuir Trough and Isotherms
2.3. Brewster Angle Microscopy (BAM)
2.4. Image Processing
2.4.1. Contrast Enhancement
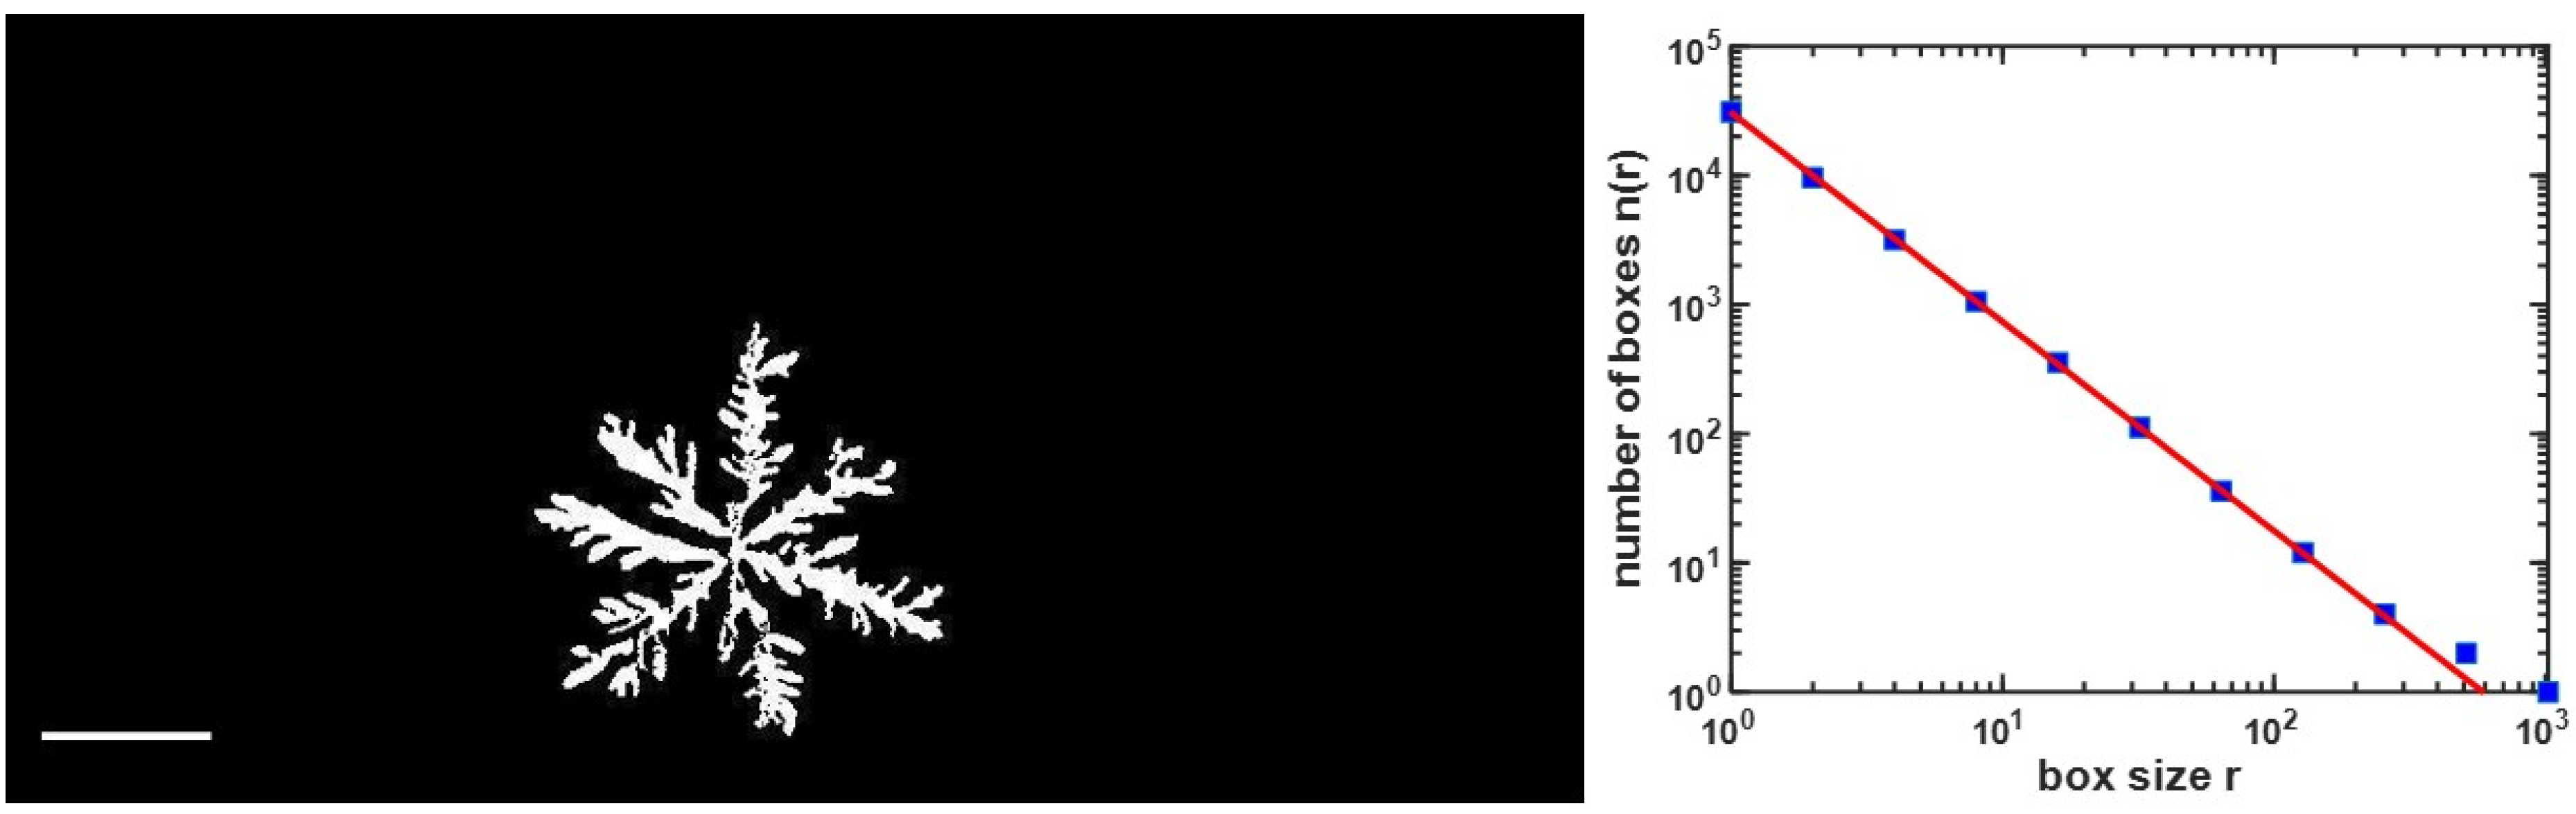
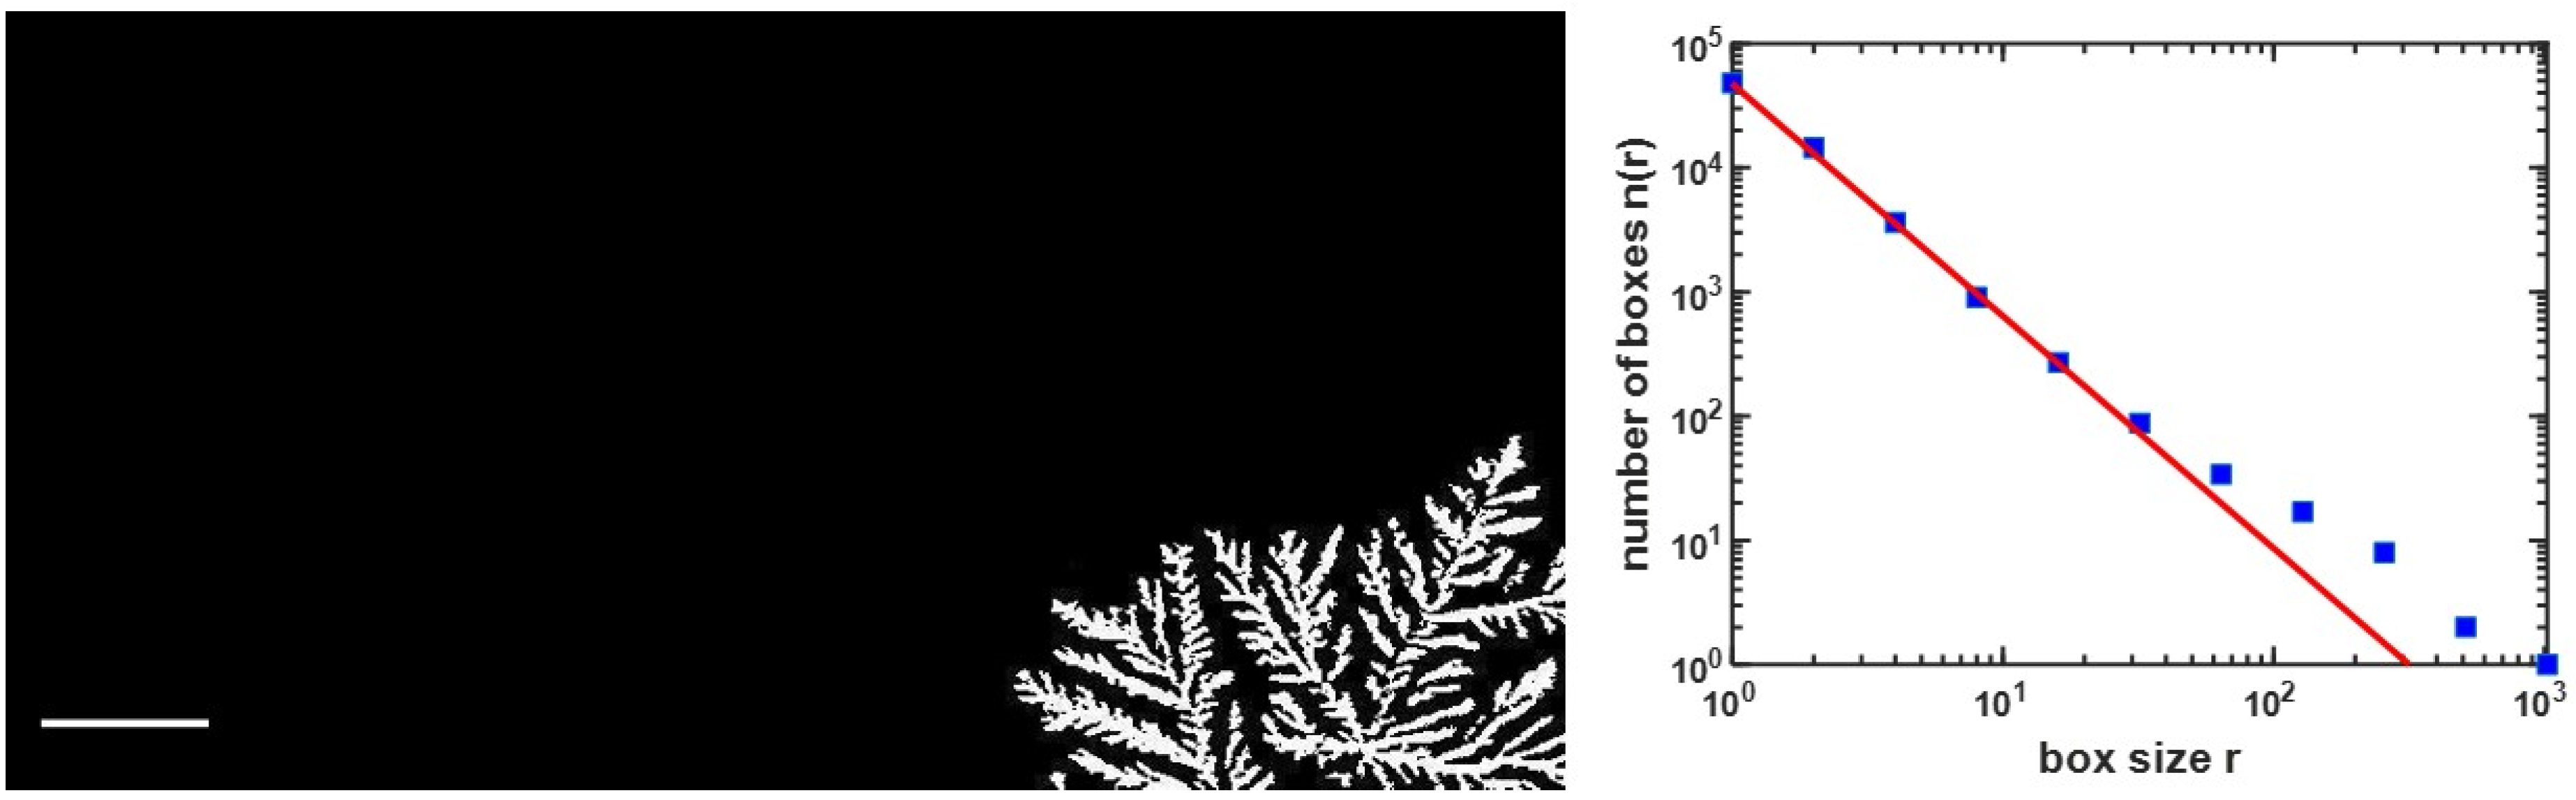
2.4.2. Determination of the Fractal Dimension
3. Results and Discussion
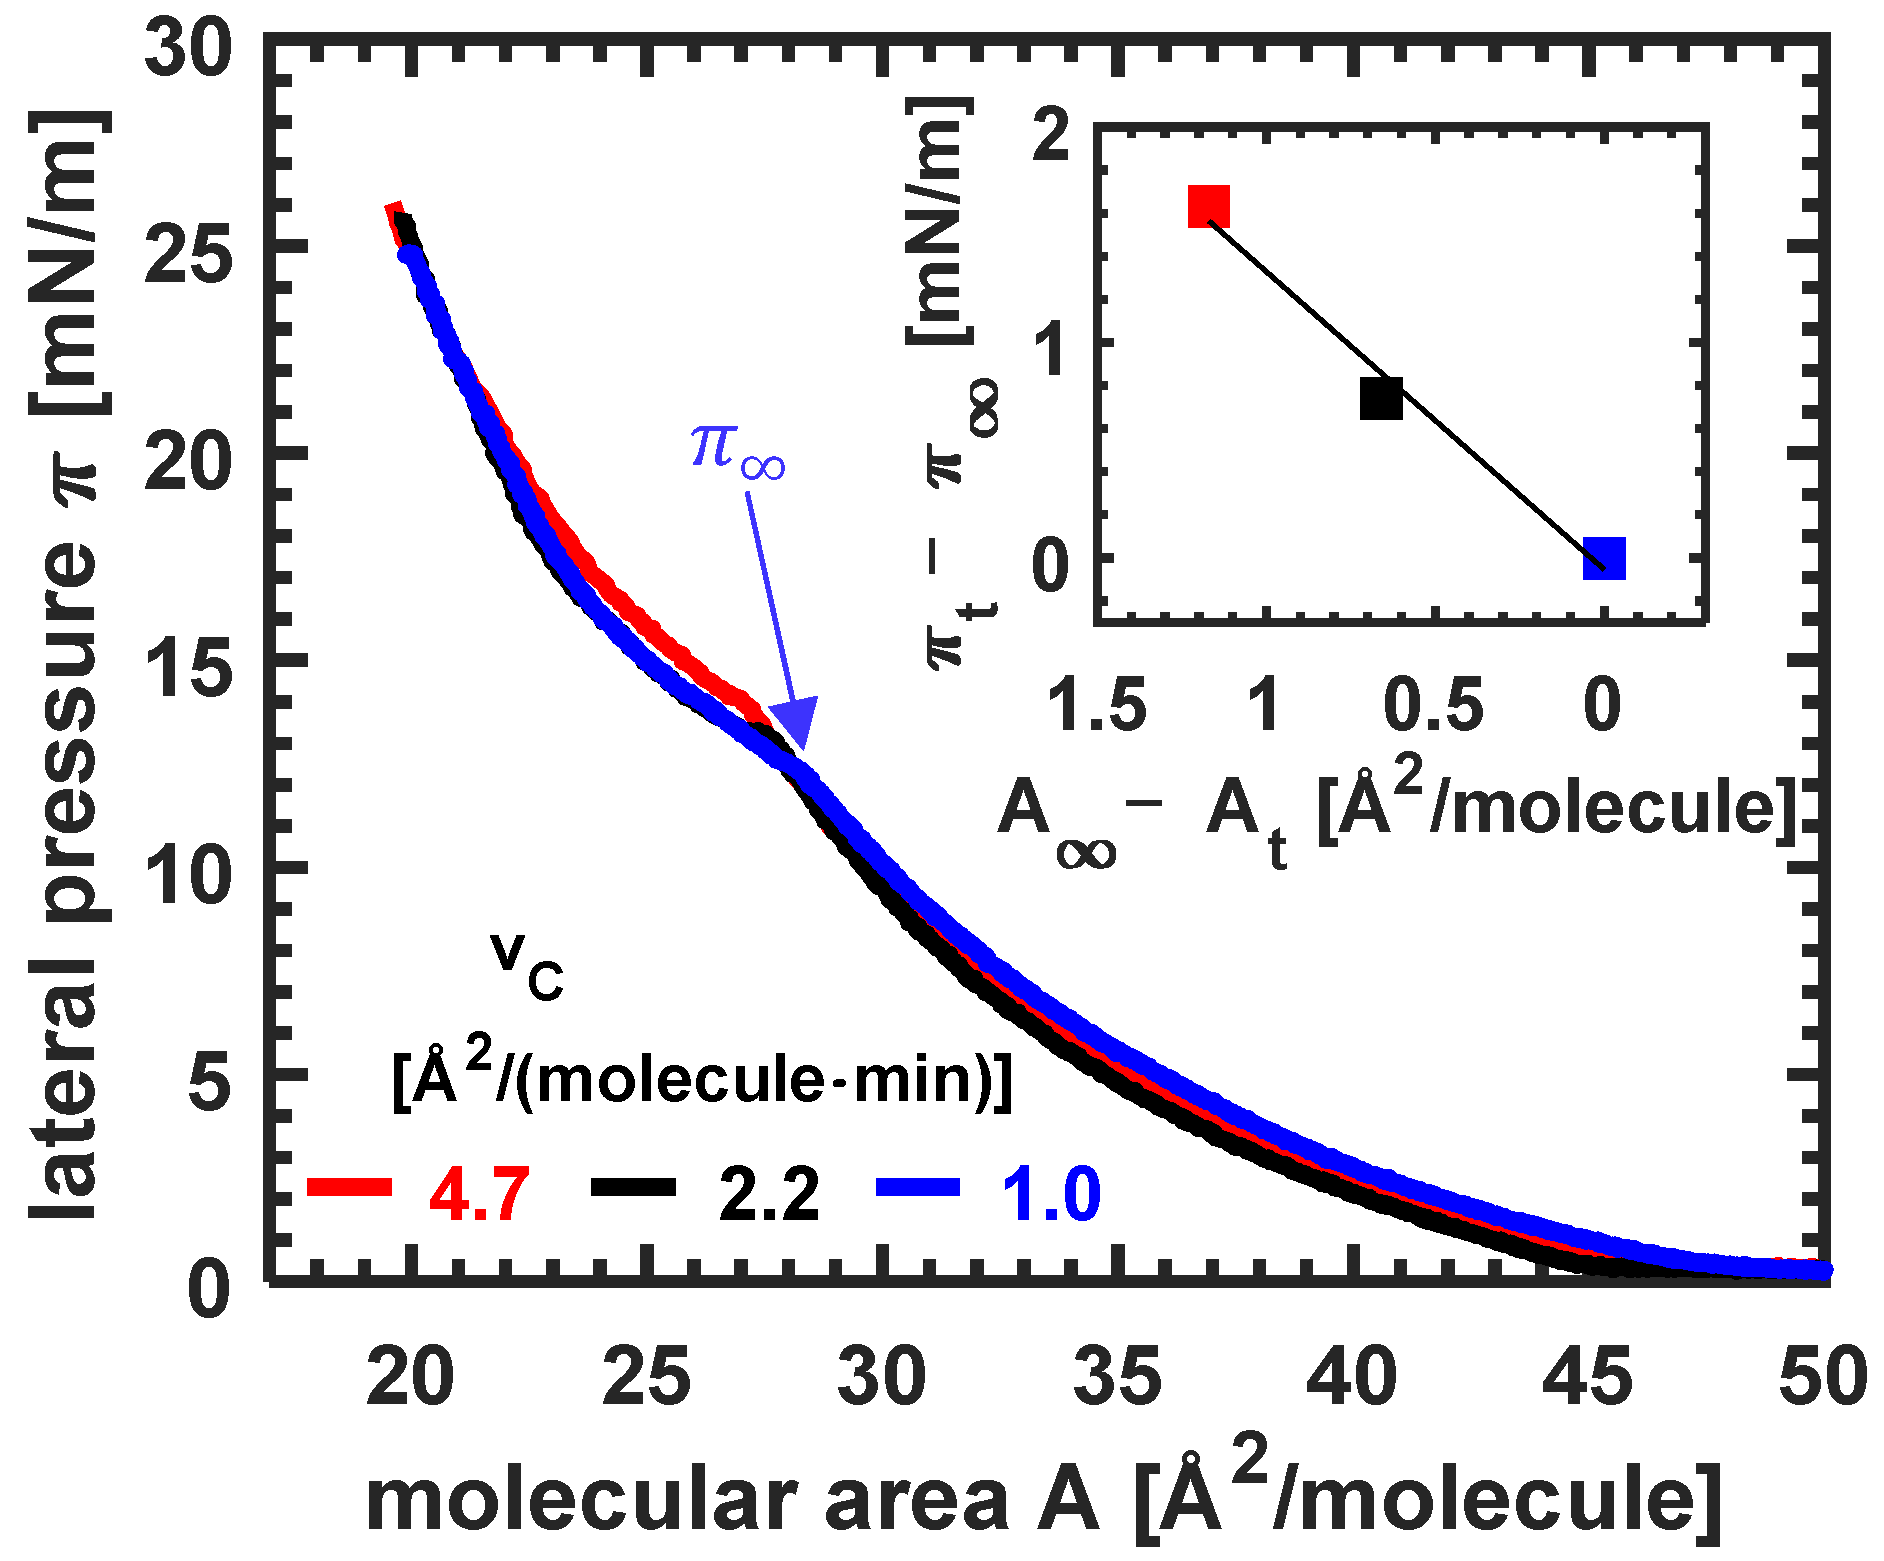
3.1. Isotherms of Erucic Acid Monolayers at Different Compression Velocities
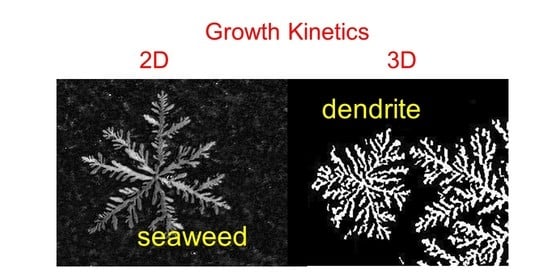
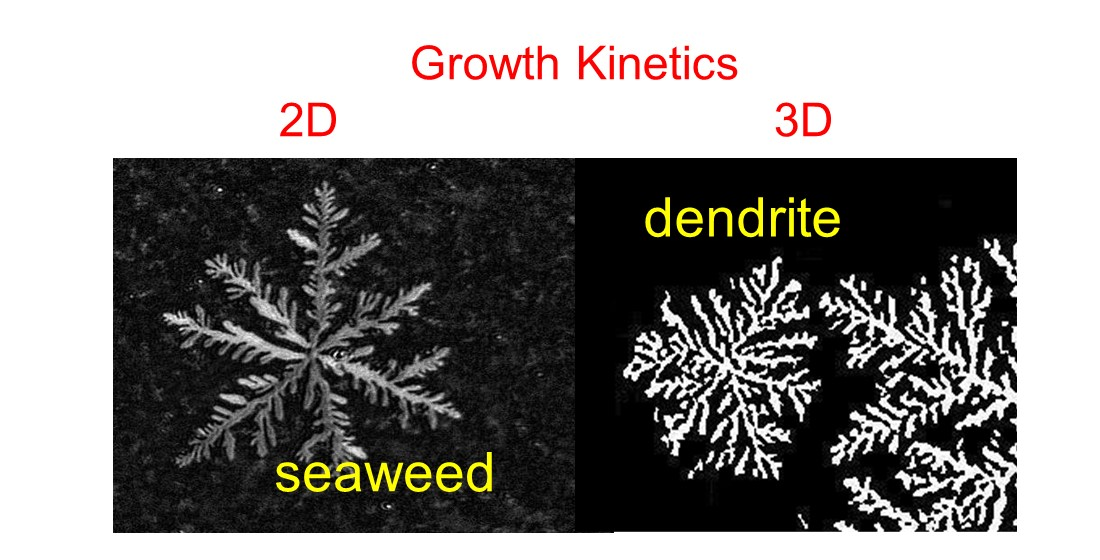
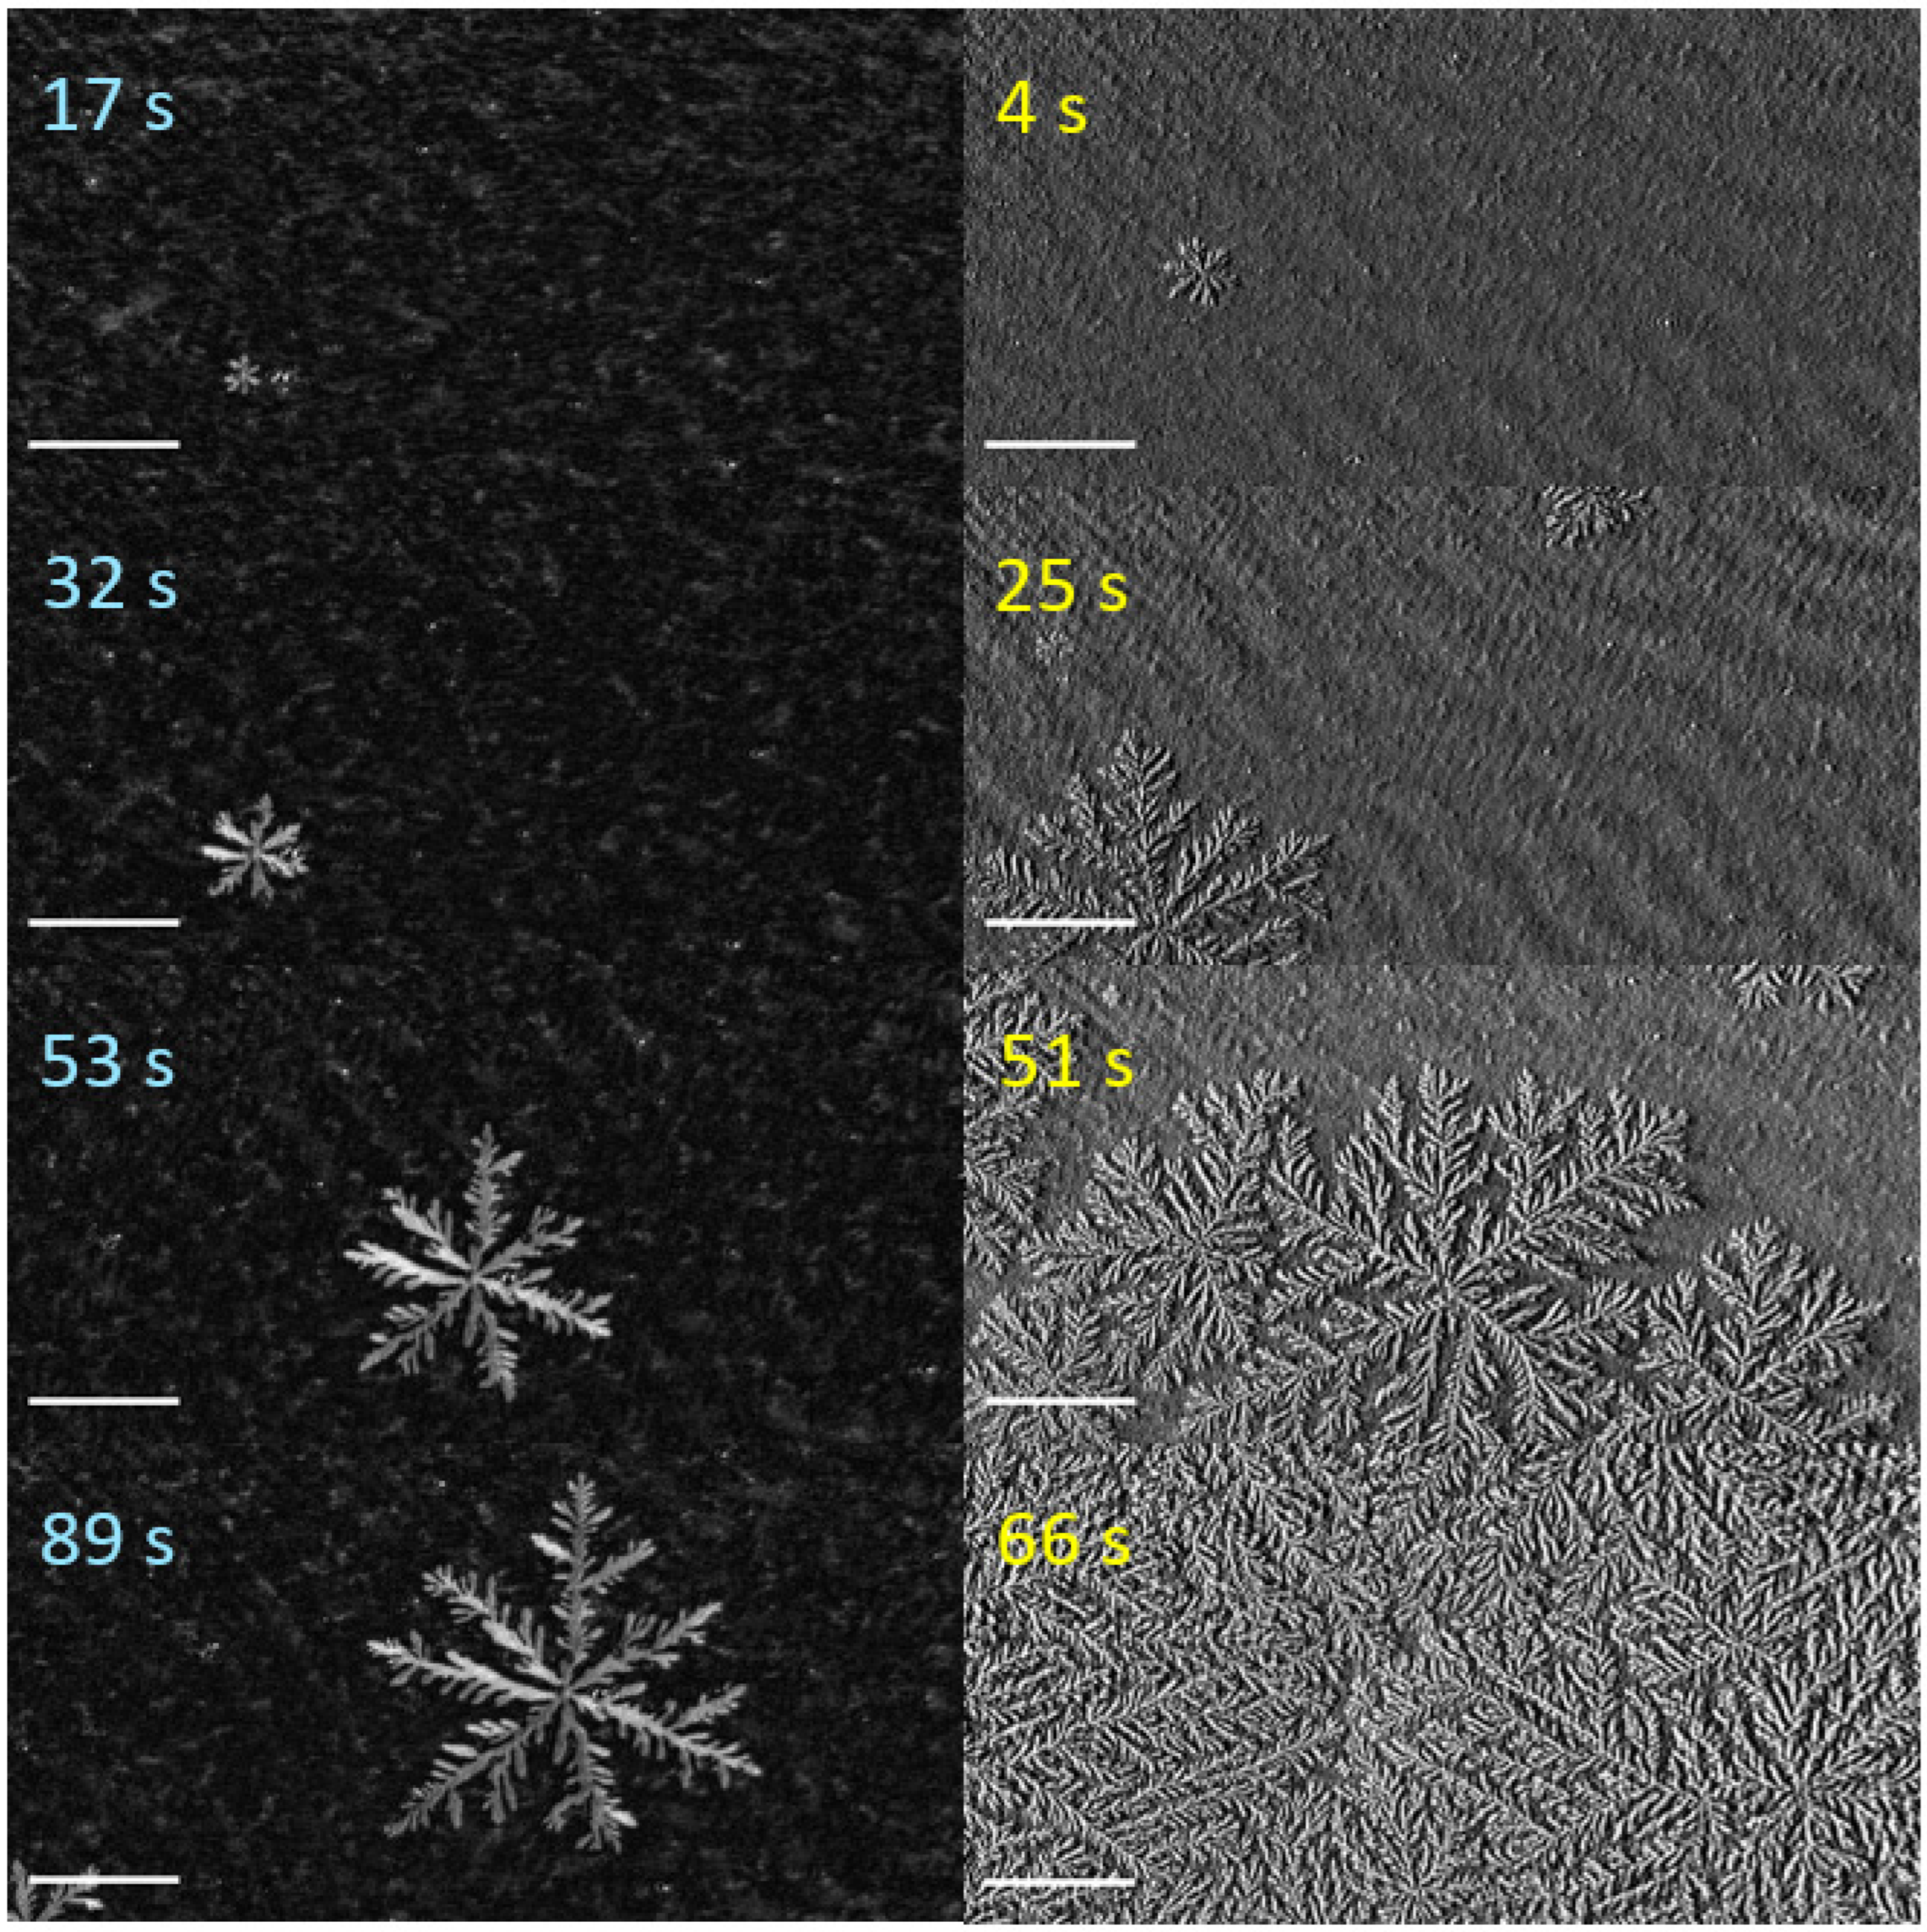
3.2. Domain Growth Visualized with Brewster Angle Microscopy (BAM) Videos
3.3. Parameters Characterizing Domain Growth
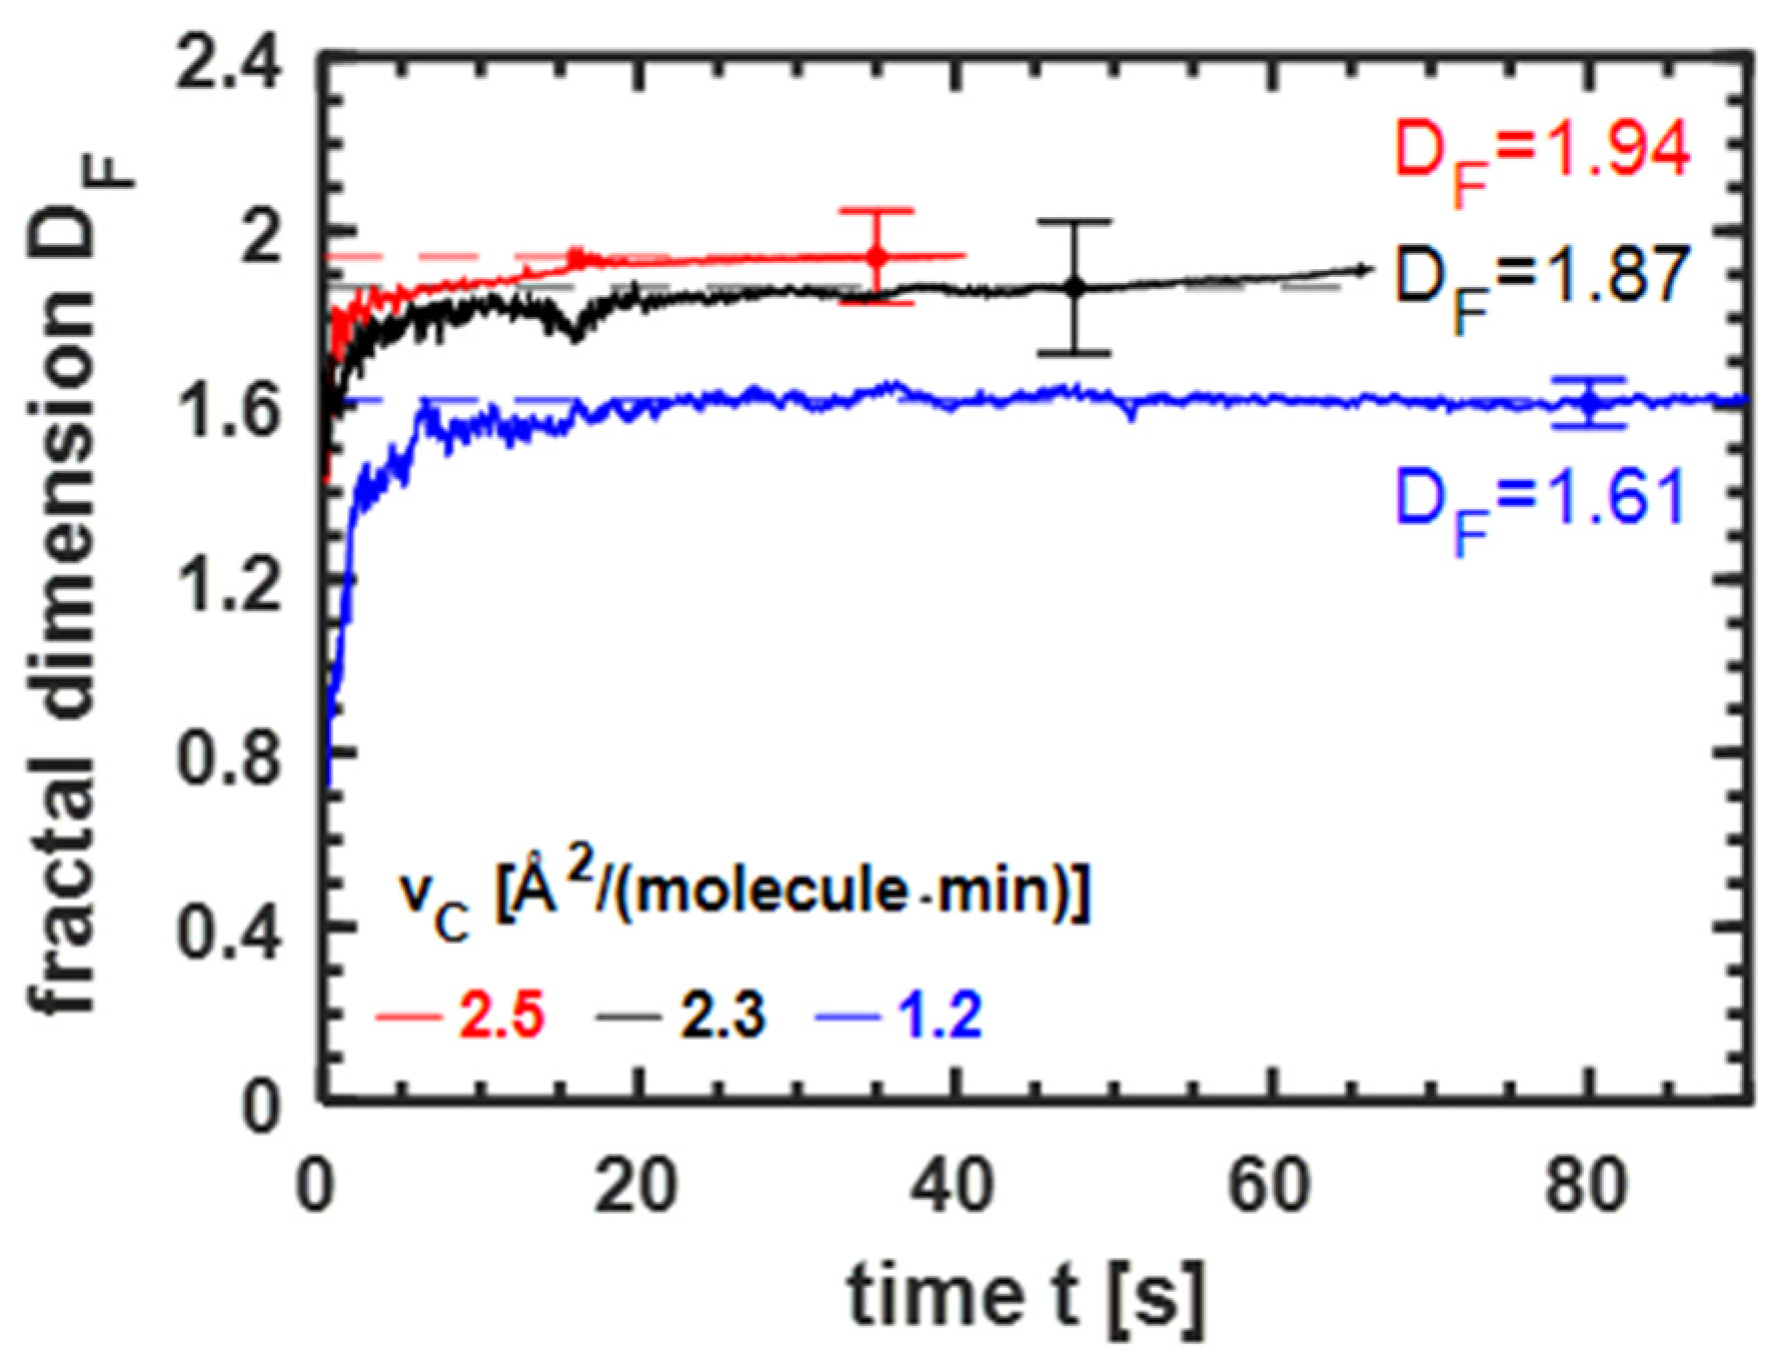
3.3.1. Influence of the Compression Velocity on Fractal Dimension
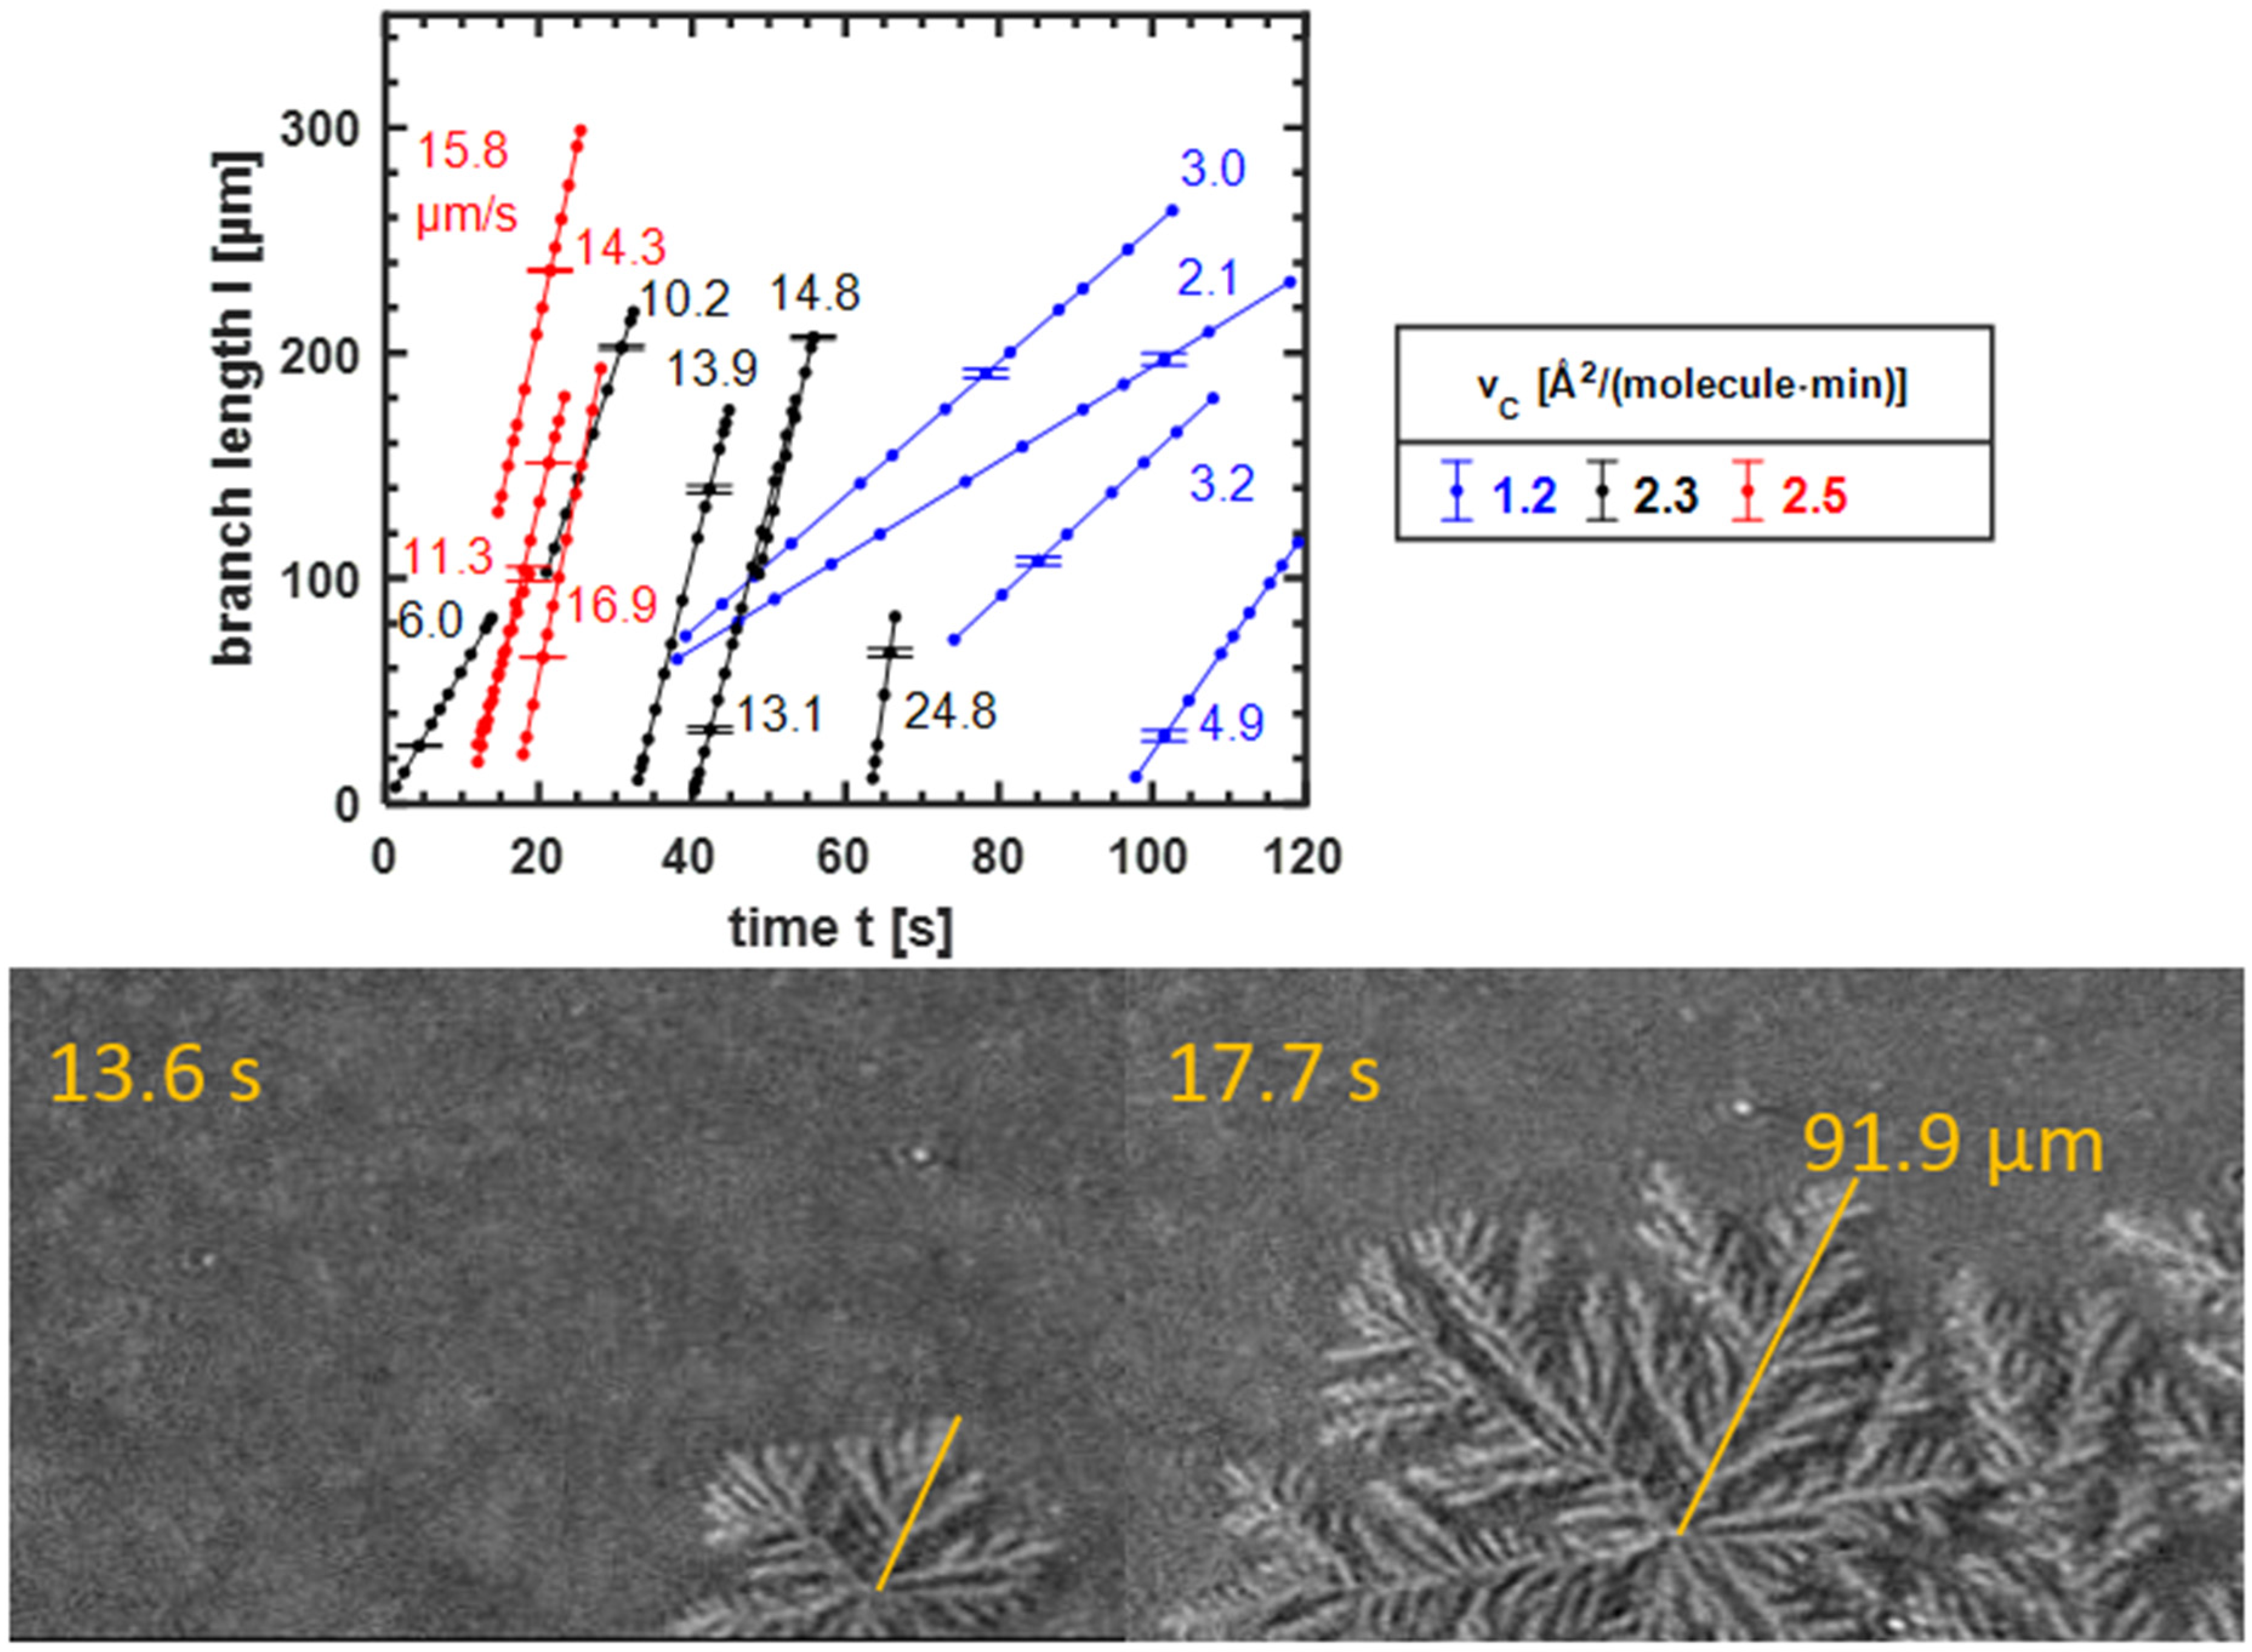
3.3.2. The Growth Speed of the Domains
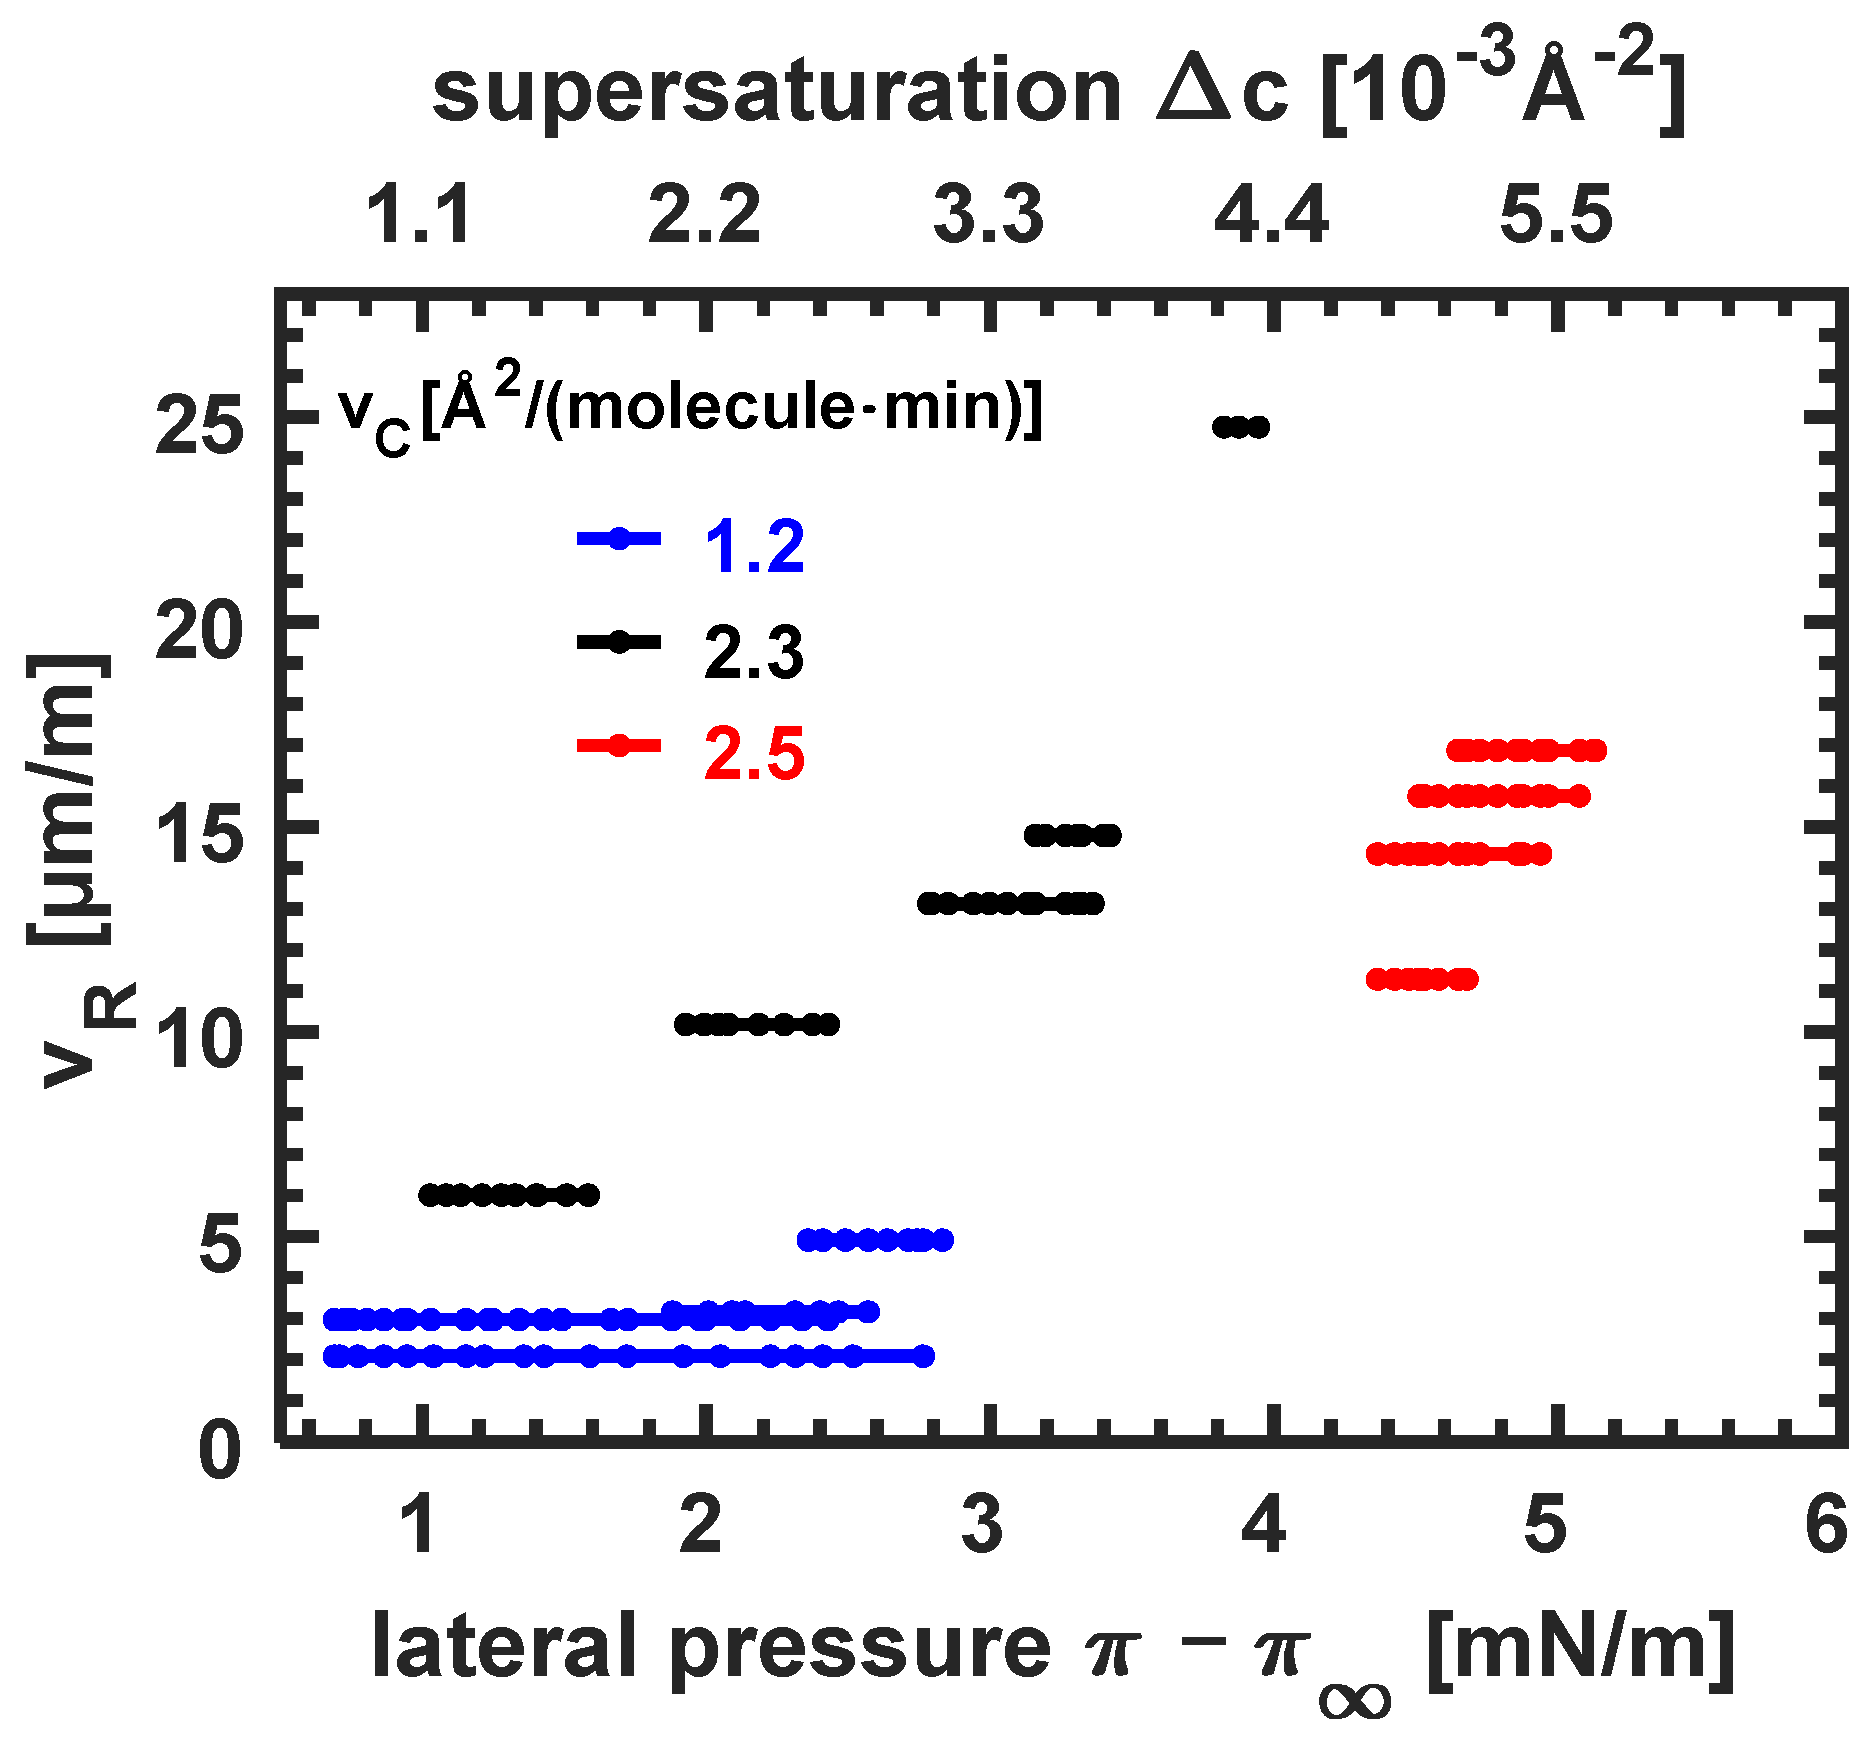
3.3.3. Dependence of Growth Speed on Compression Velocity and Supersaturation
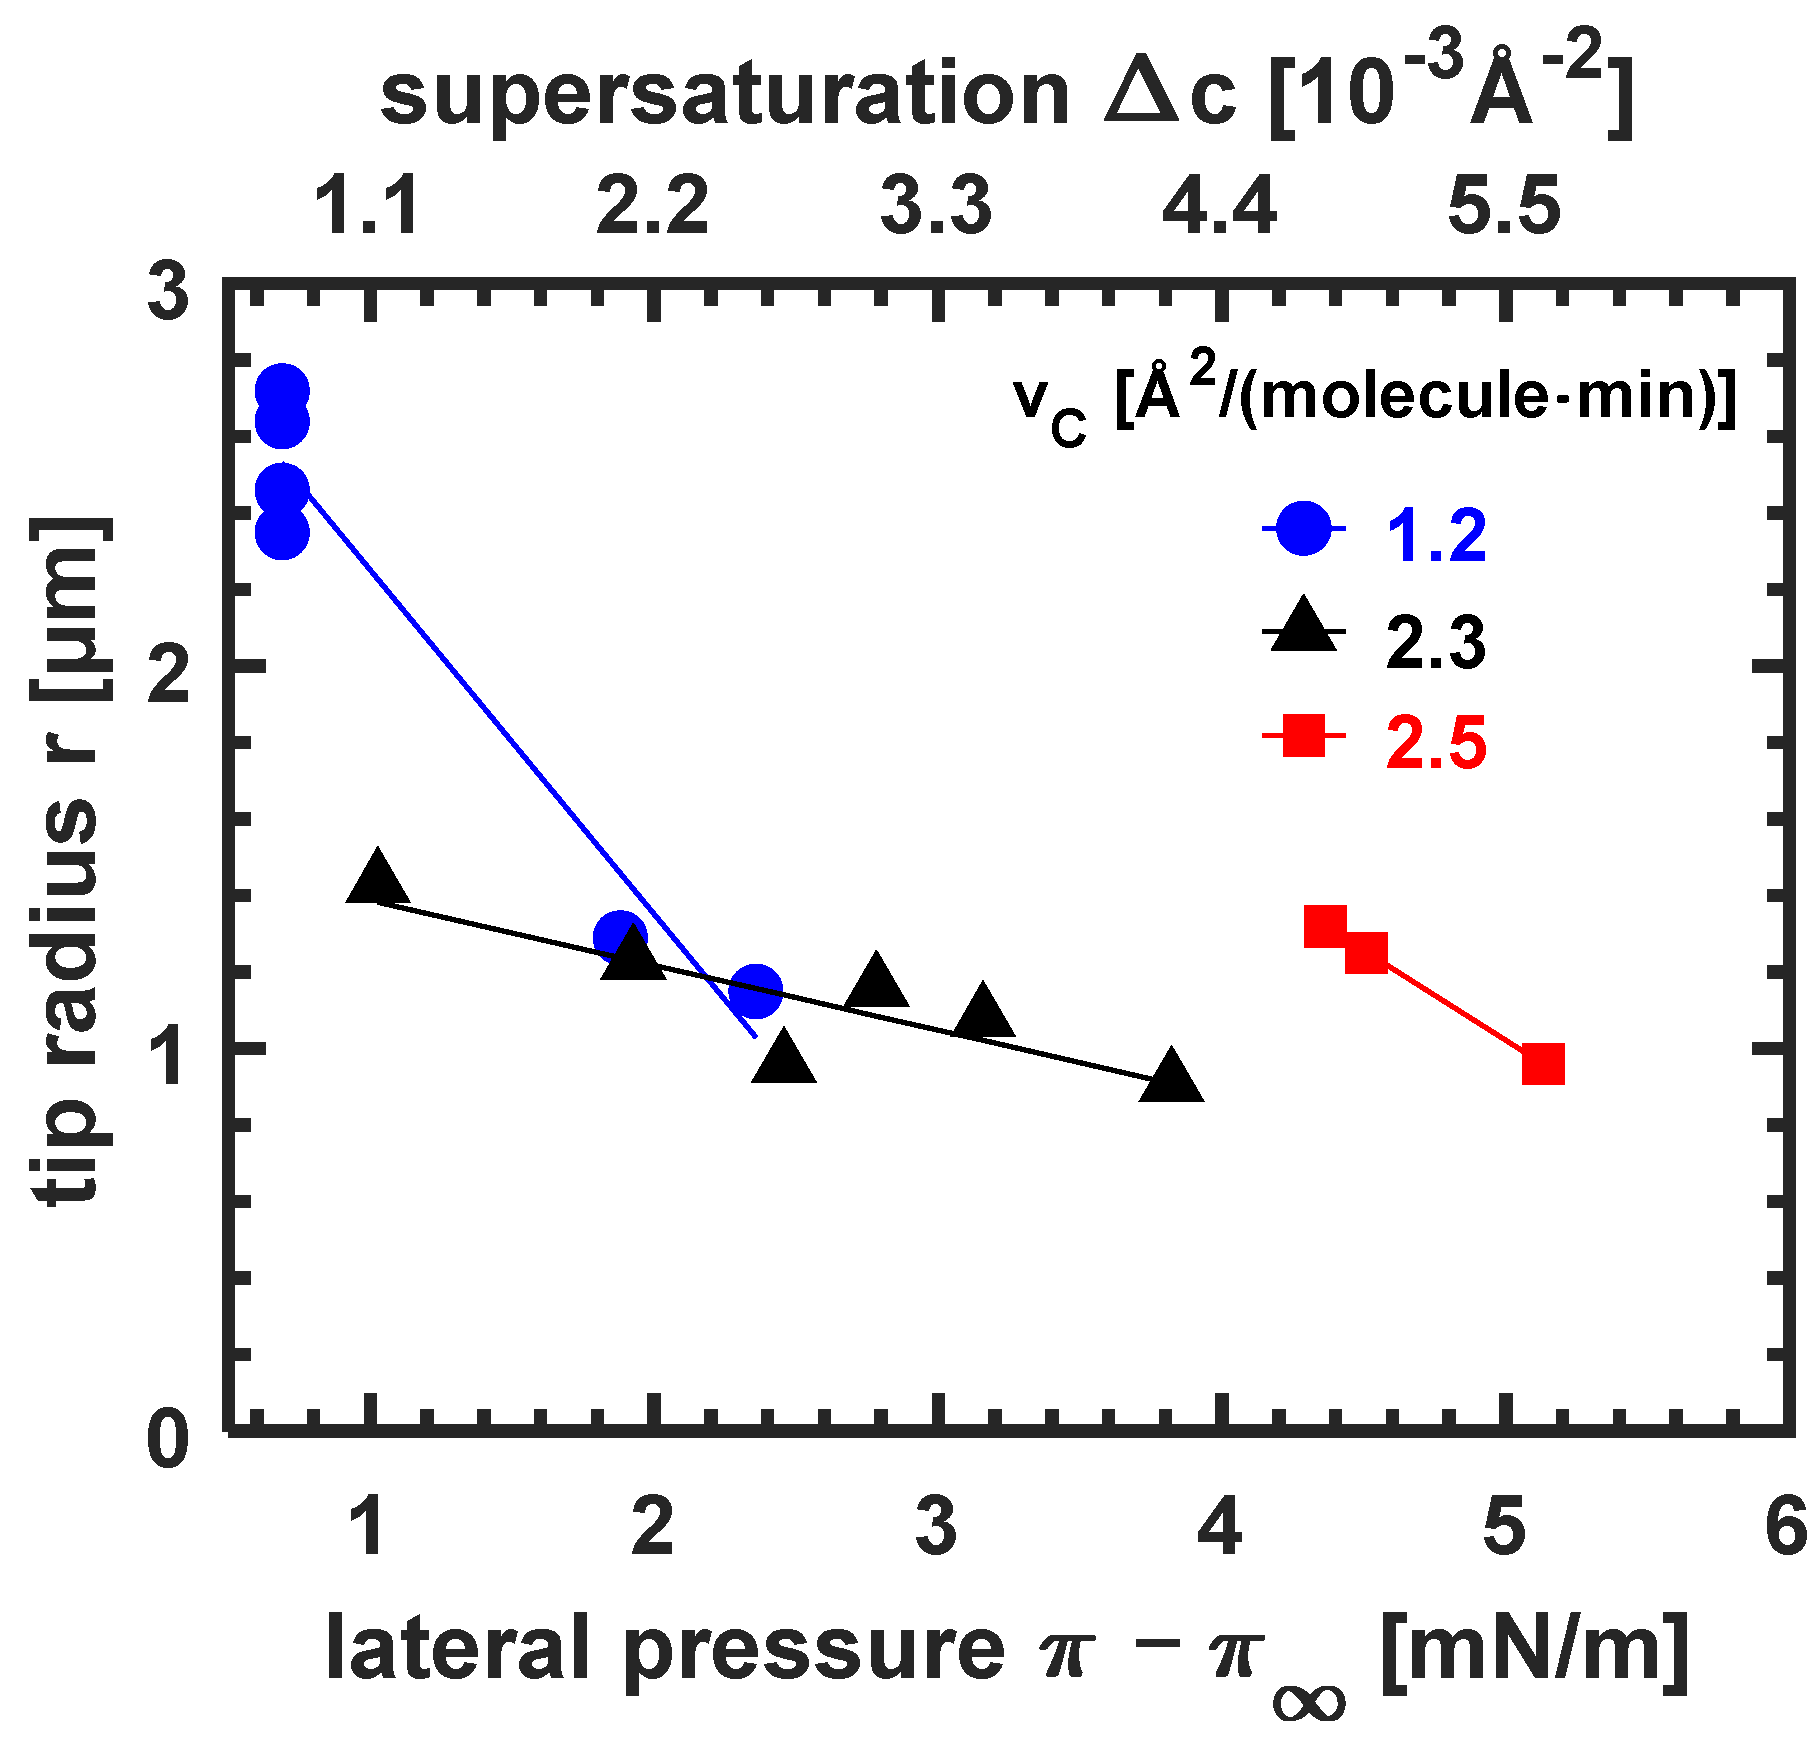
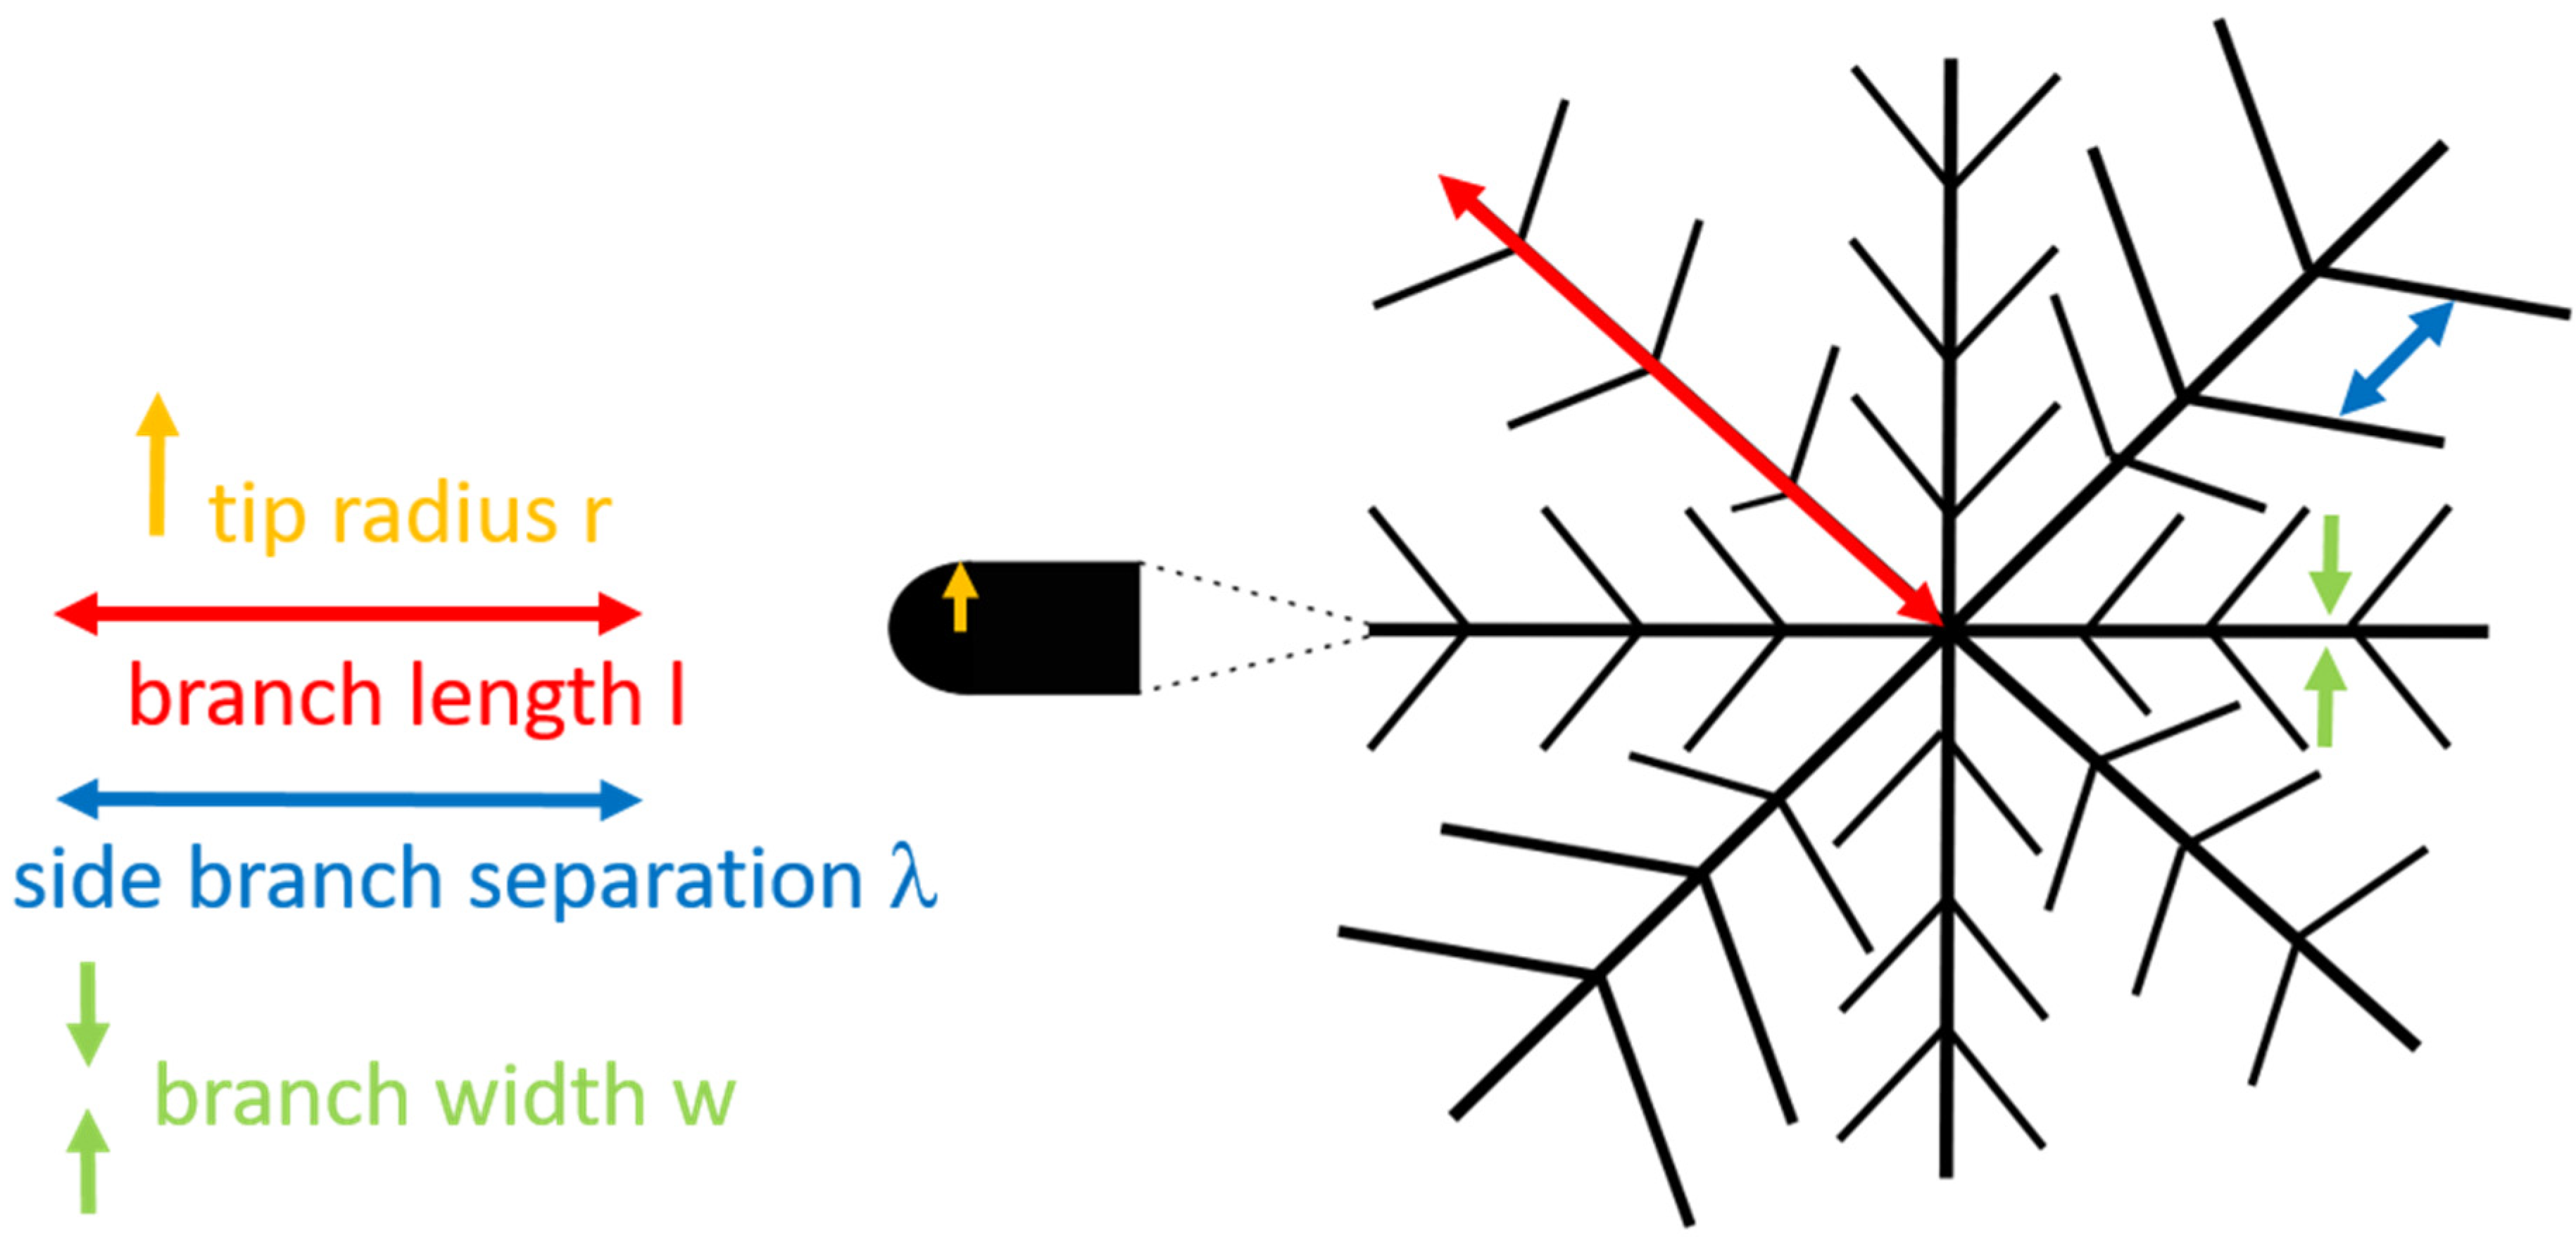
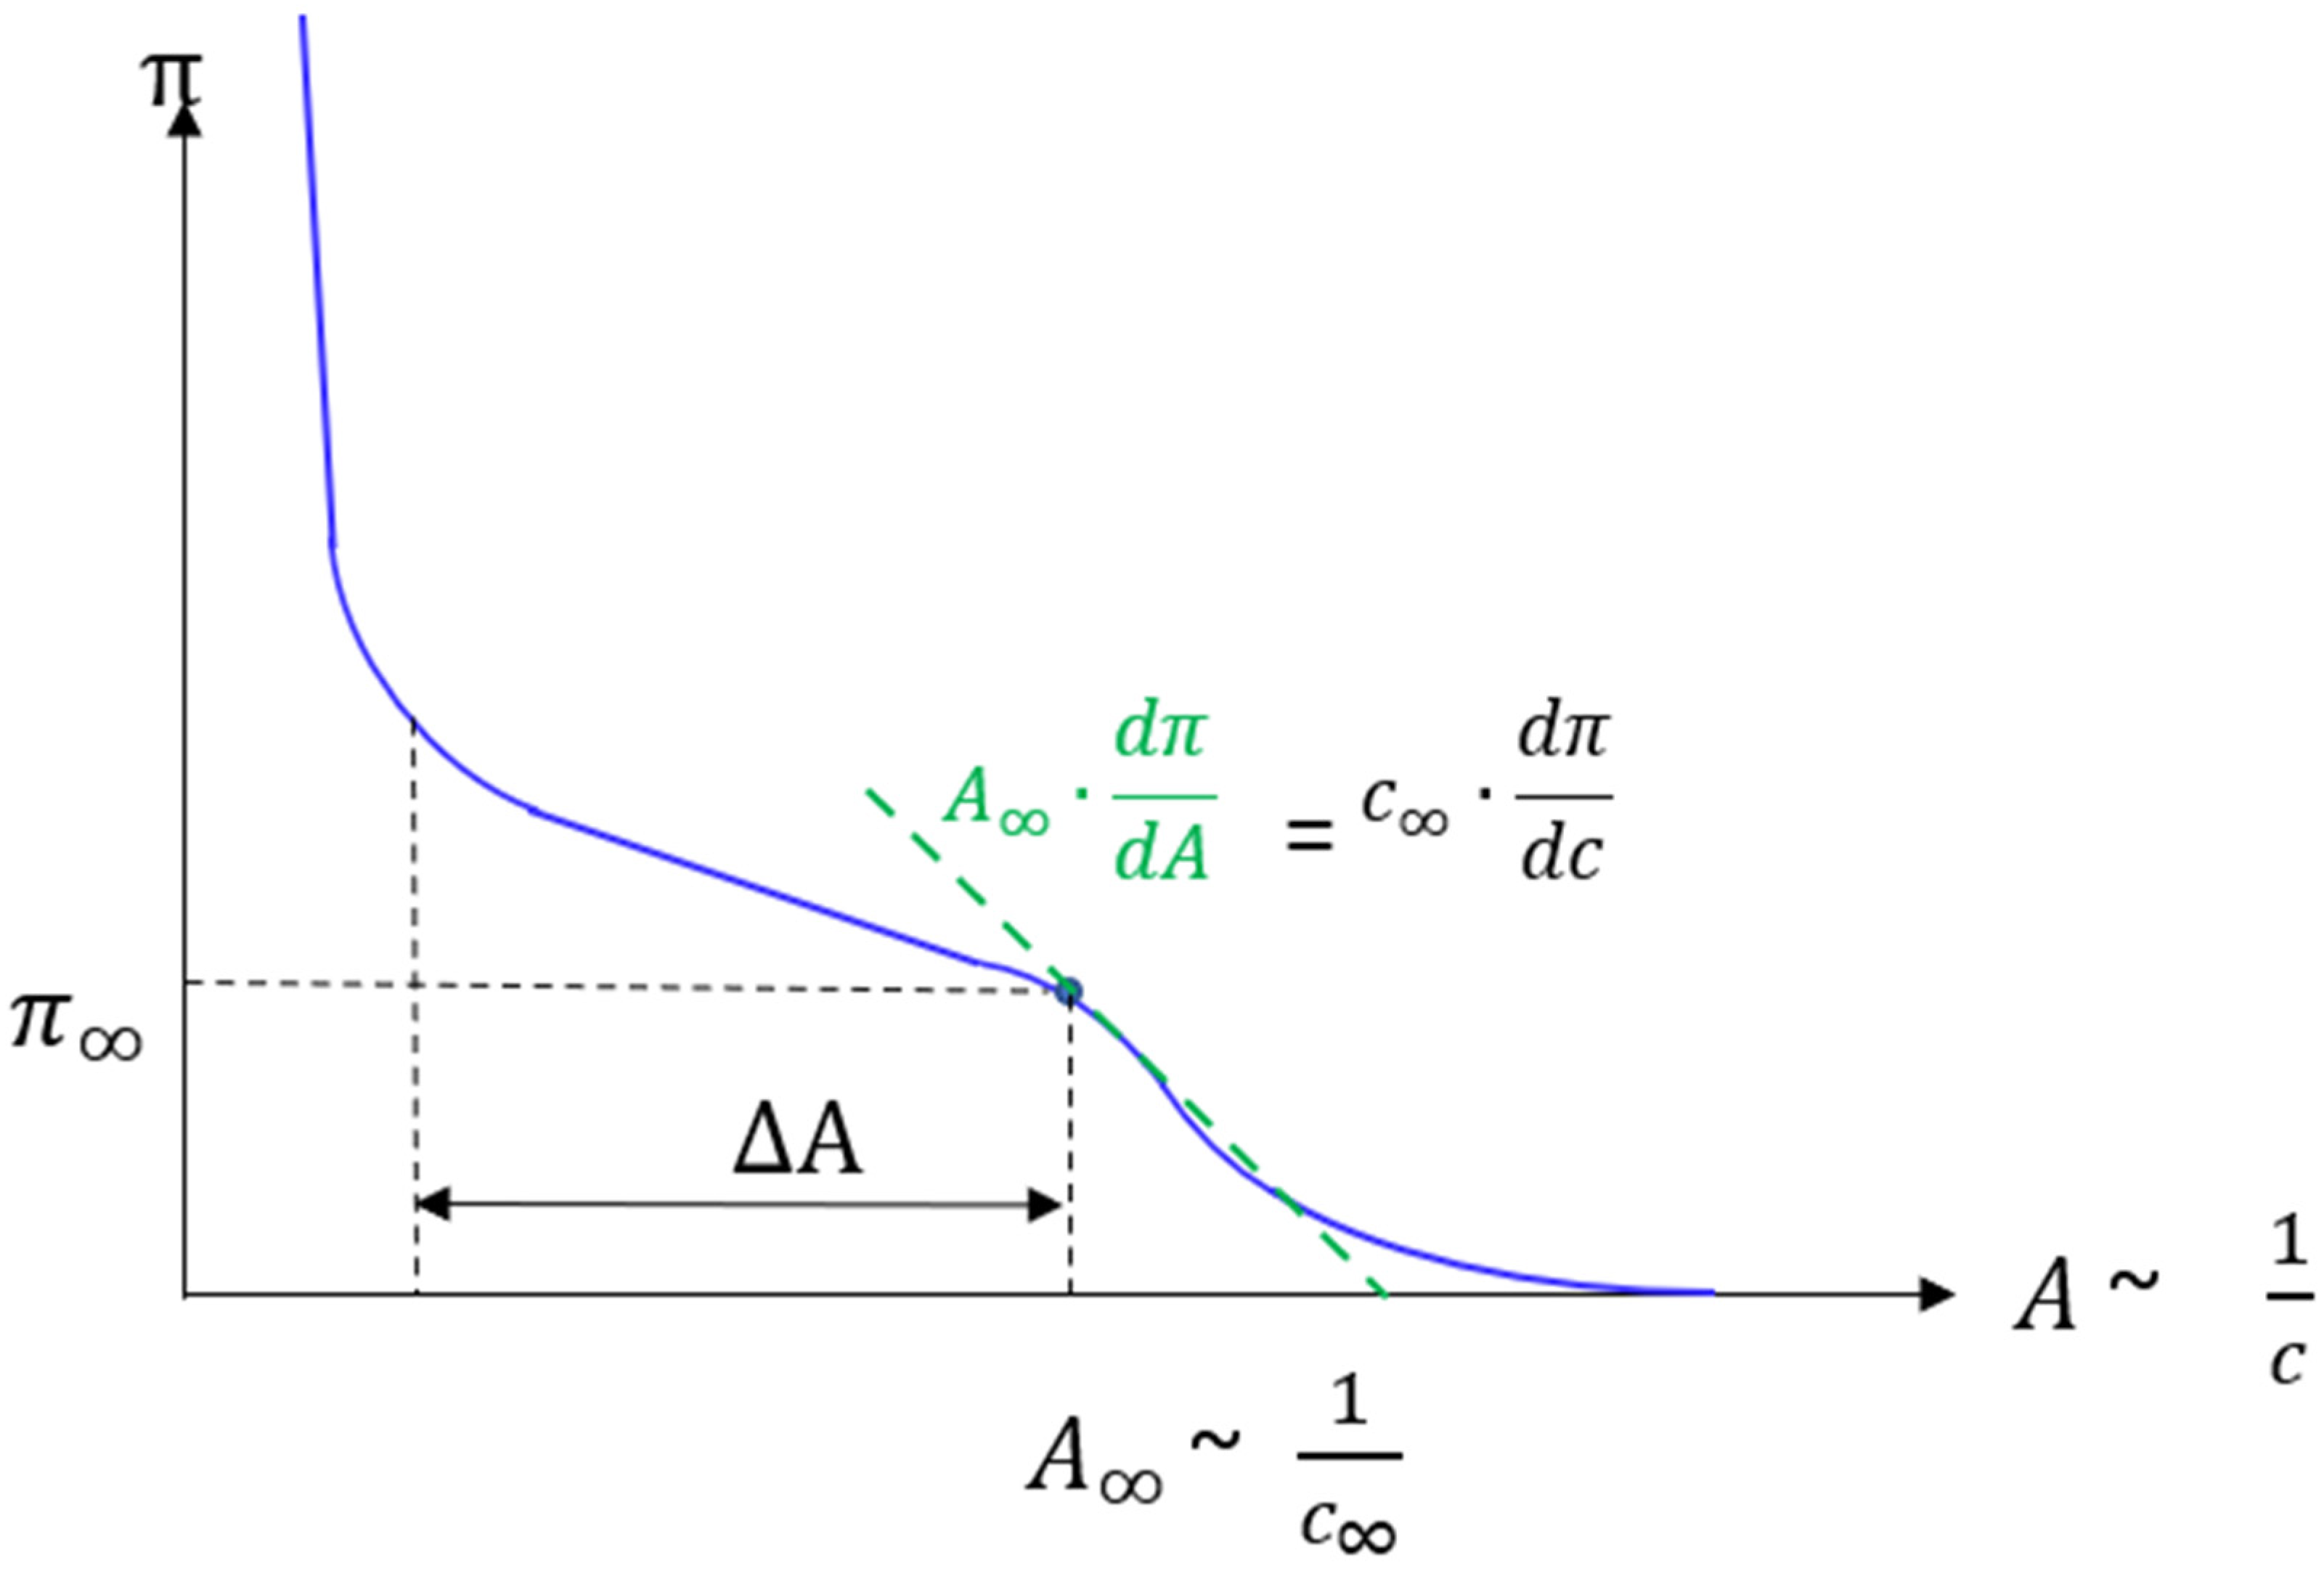
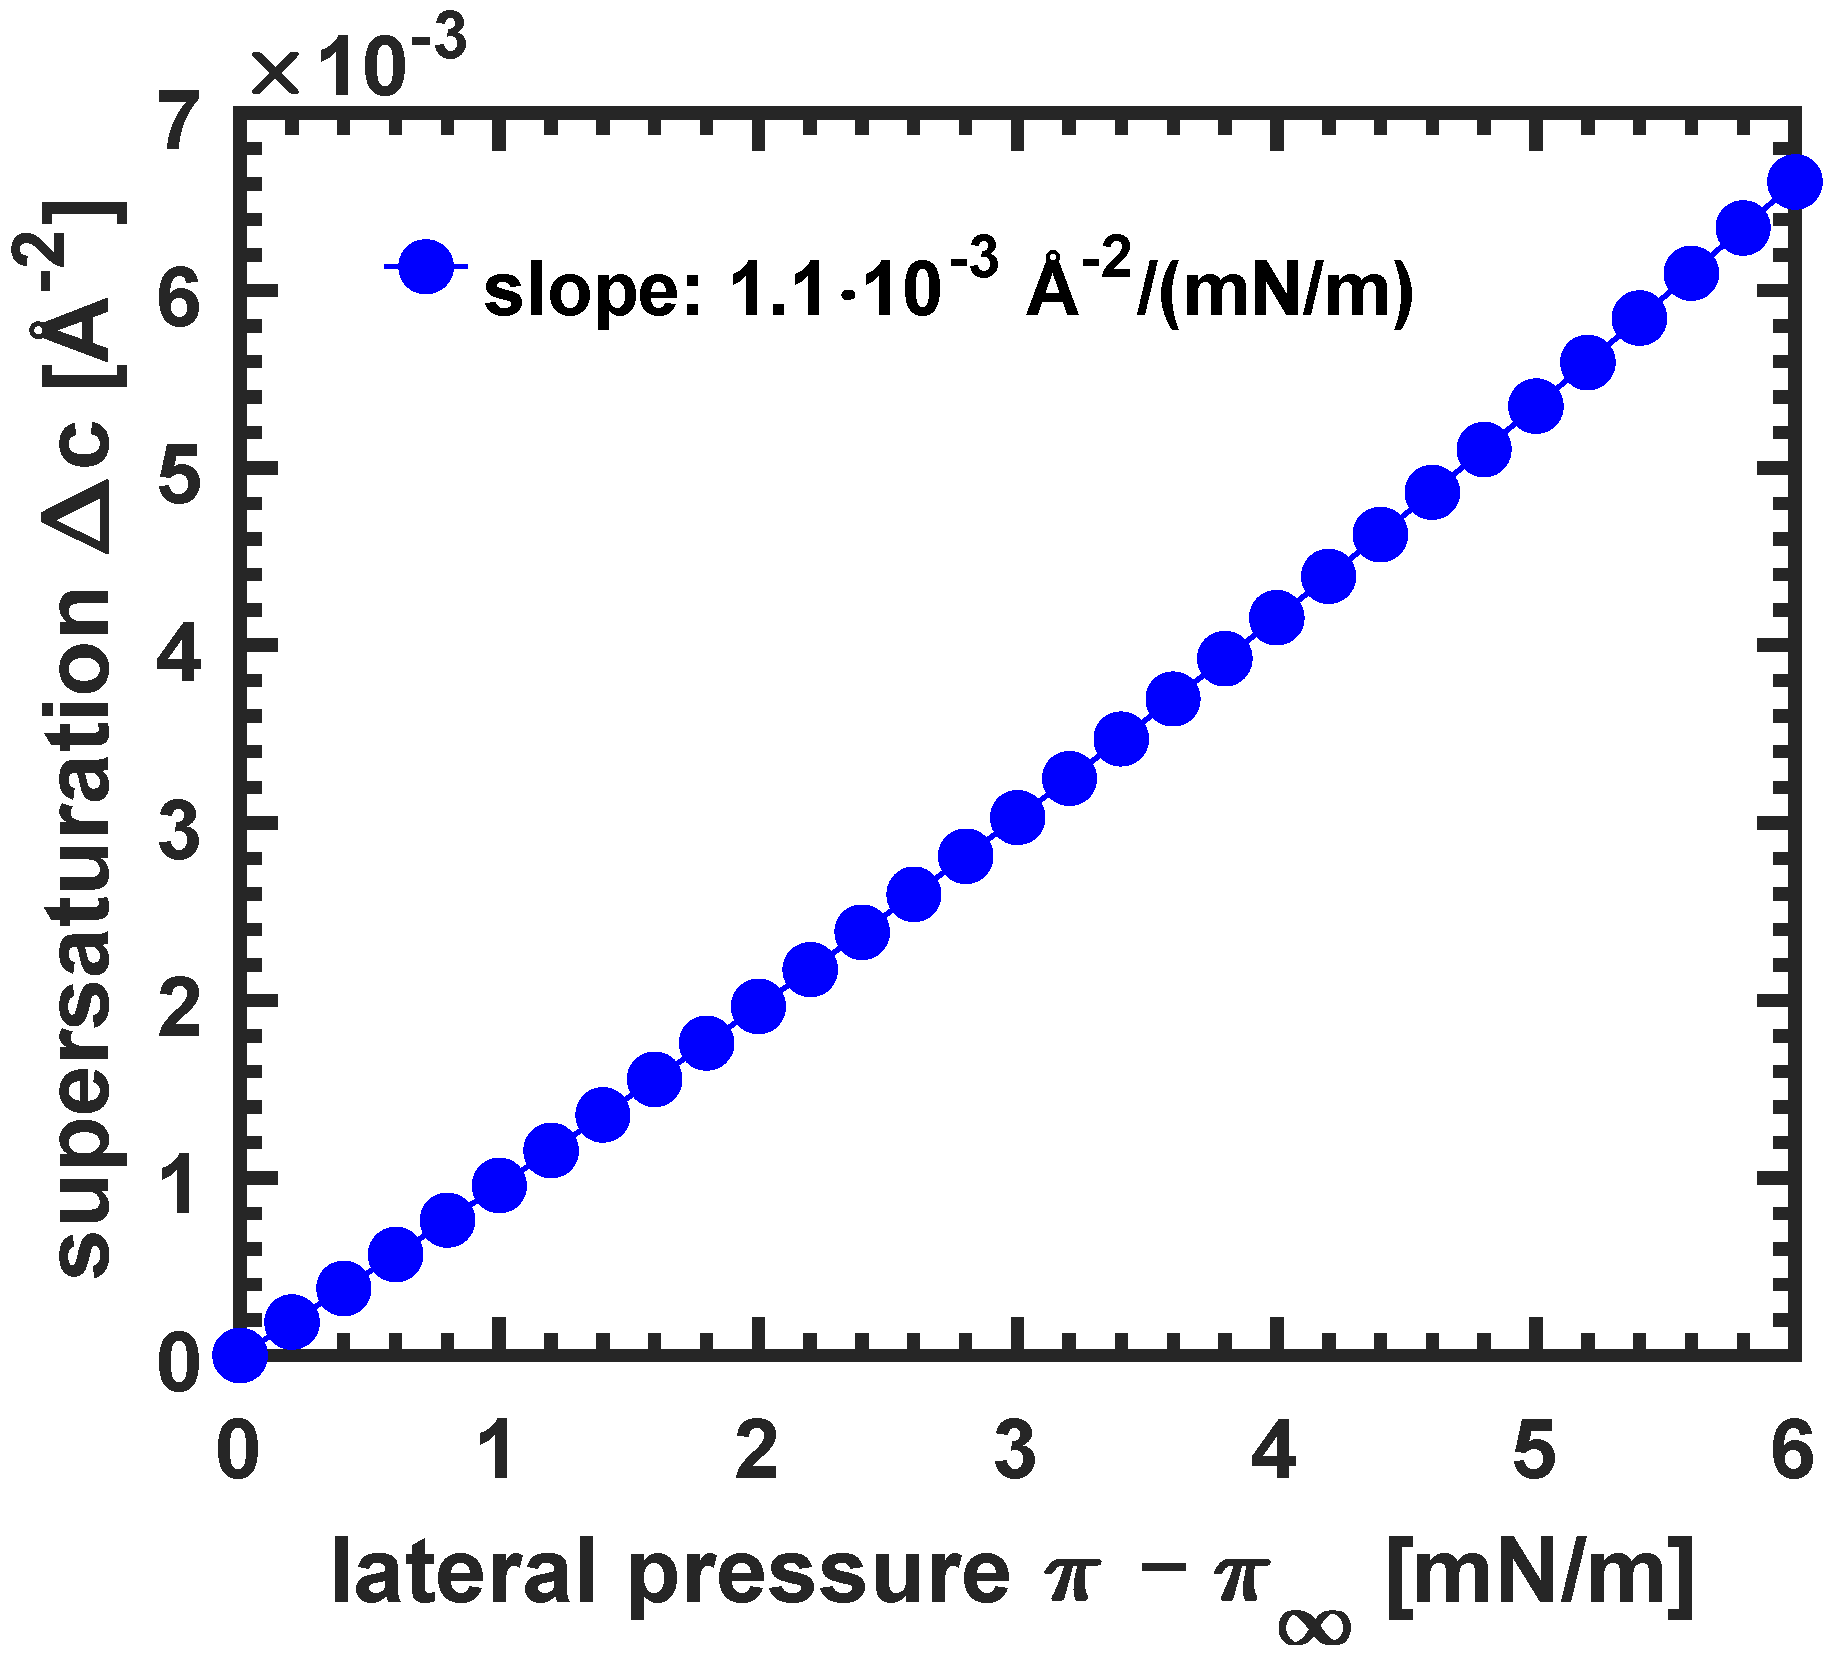
3.3.4. The Influence of Excess Lateral Pressure and Supersaturation on the Tip Radius
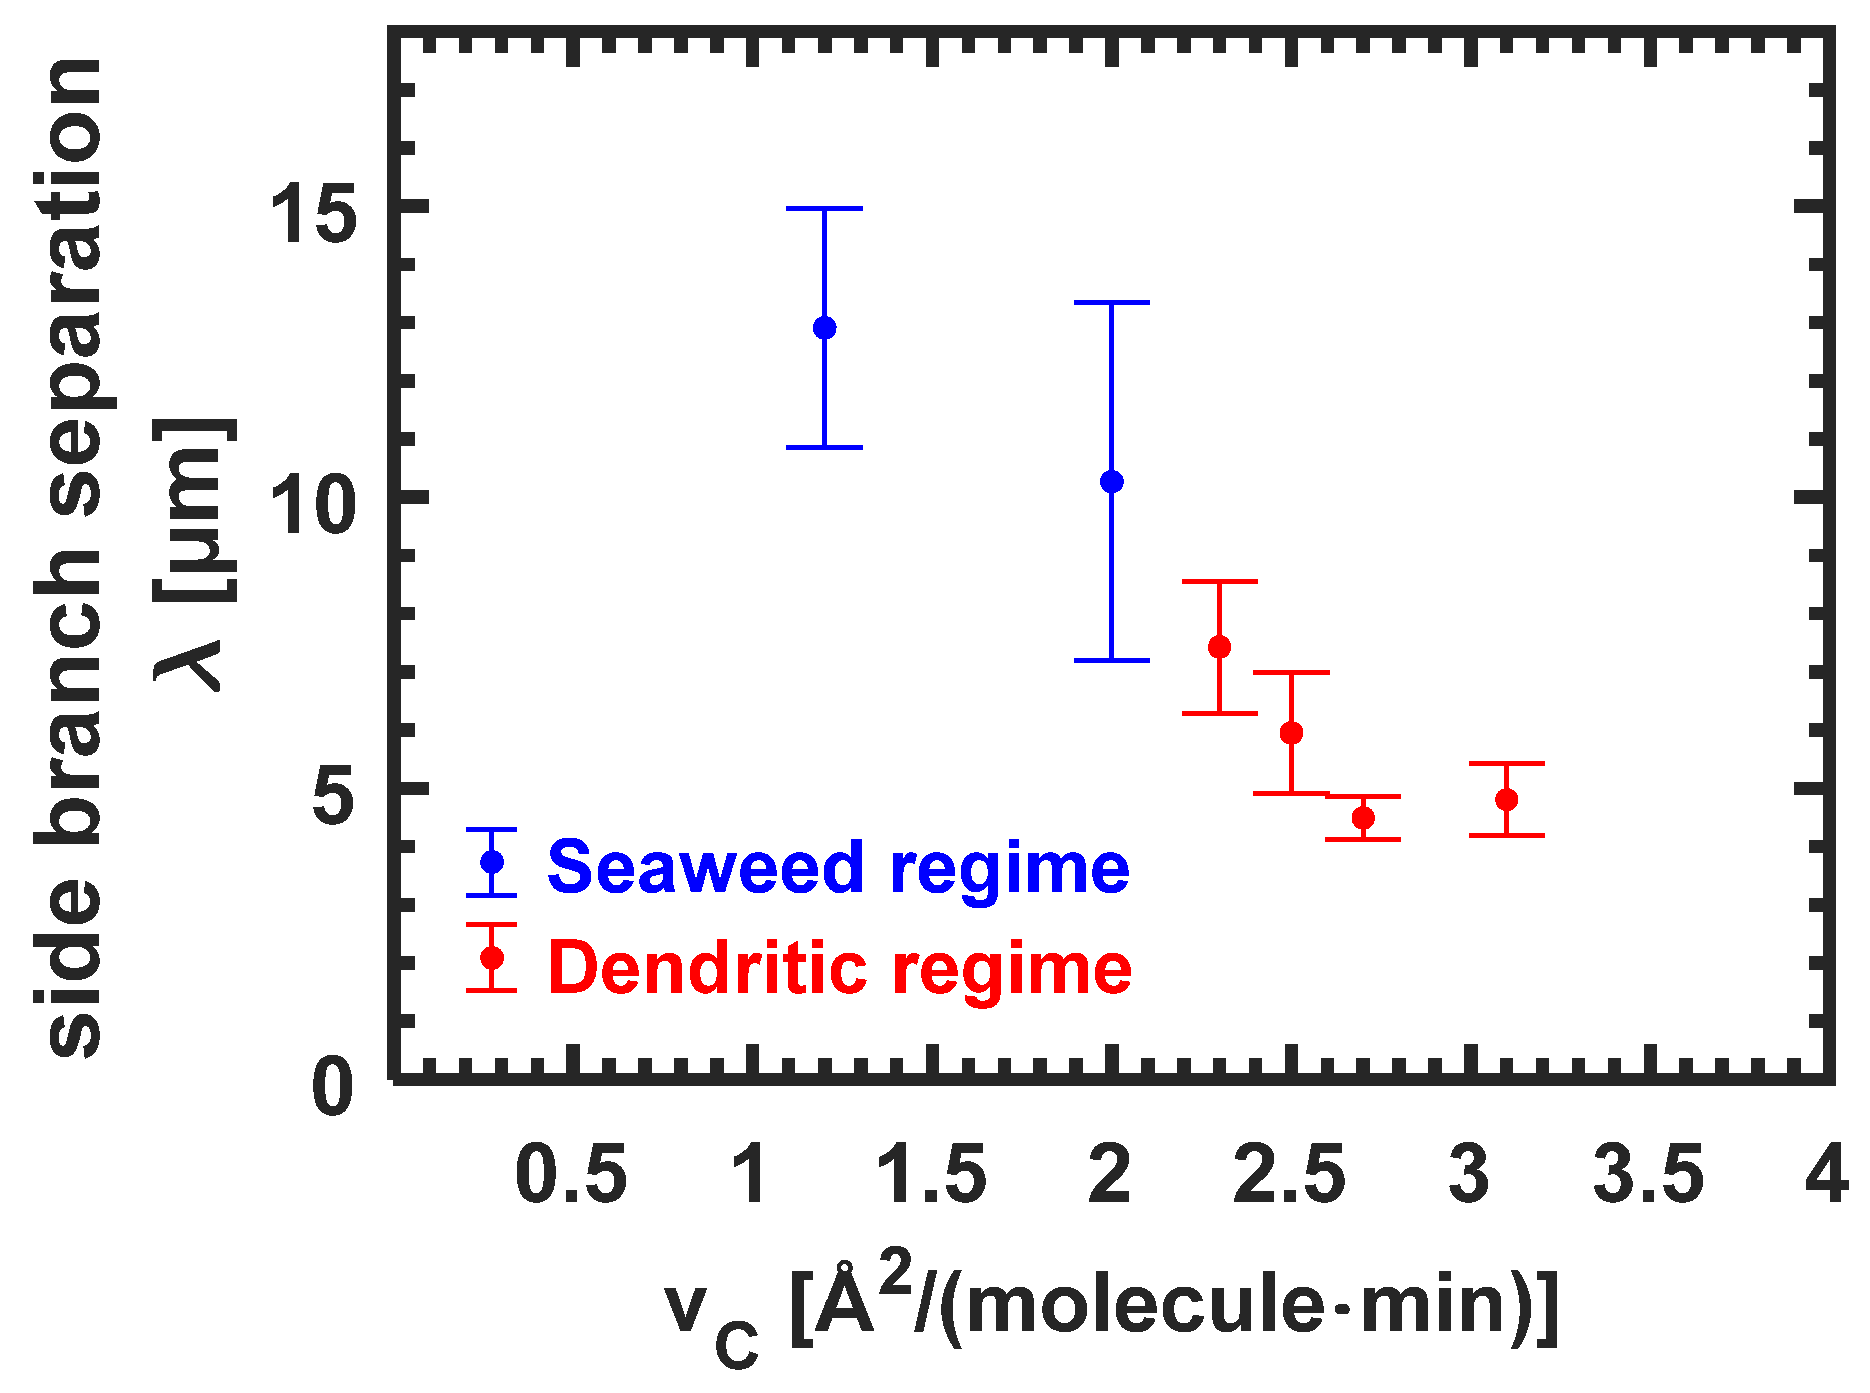
3.3.5. Side Branch Separation λ for Seaweed Domains and Dendrites
3.3.6. Influence of the Compression Velocity on the Flow in the LE Phase
4. Conclusions
Author Contributions
Funding
Acknowledgments
Conflicts of Interest
Appendix A


| 0 | 27.50 | 0.00 | 0.0000 | 0.000 |
| 0.4 | 27.22 | 0.28 | 0.0004 | 0.010 |
| 1 | 26.80 | 0.70 | 0.0010 | 0.026 |
| 2 | 26.10 | 1.40 | 0.0020 | 0.054 |
| 3 | 25.40 | 2.10 | 0.0030 | 0.083 |
| 4 | 24.70 | 2.81 | 0.0041 | 0.114 |
| 5 | 24.00 | 3.51 | 0.0053 | 0.146 |
| 6 | 23.30 | 4.21 | 0.0066 | 0.181 |

Appendix B
Determination of the Fractal Dimension


References
- Oliveira, O.N., Jr.; Caseli, L.; Ariga, K. The past and the future of Langmuir and Langmuir–Blodgett films. Chem. Rev. 2022, 122, 6459–6513. [Google Scholar] [CrossRef] [PubMed]
- Kaganer, V.M.; Möhwald, H.; Dutta, P. Structure and phase transitions in Langmuir monolayers. Rev. Mod. Phys. 1999, 71, 779–819. [Google Scholar] [CrossRef] [Green Version]
- Blume, A. Lipids at the air–water interface. ChemTexts 2018, 4, 1–25. [Google Scholar] [CrossRef]
- Stefaniu, C.; Brezesinski, G.; Möhwald, H. Langmuir monolayers as models to study processes at membrane surfaces. Adv. Colloid Interface Sci. 2014, 208, 197–213. [Google Scholar] [CrossRef]
- Miller, A.; Helm, C.A.; Möhwald, H. The colloidal nature of phospholipid monolayers. J. Phys. 1987, 48, 693–701. [Google Scholar] [CrossRef]
- Miller, A.; Möhwald, H. Diffusion limited growth of crystalline domains in phospholipid monolayers. J. Chem. Phys. 1987, 86, 4258–4265. [Google Scholar] [CrossRef]
- Gutierrez-Campos, A.; Diaz-Leines, G.; Castillo, R. Domain growth, pattern formation, and morphology transitions in Langmuir monolayers. A new growth instability. J. Phys. Chem. B 2010, 114, 5034–5046. [Google Scholar] [CrossRef] [Green Version]
- Flores, A.; Corvera-Poire, E.; Garza, C.; Castillo, R. Pattern formation and morphology evolution in Langmuir monolayers. J. Phys. Chem. B 2006, 110, 4824–4835. [Google Scholar] [CrossRef] [PubMed] [Green Version]
- Akamatsu, S.; Bouloussa, O.; To, K.; Rondelez, F. Two-dimensional dendritic growth in Langmuir monolayers of D-myristoyl alanine. Phys. Rev. A 1992, 46, R4504. [Google Scholar] [CrossRef]
- Yoon, D.K.; Zhu, C.; Kim, Y.H.; Shen, Y.; Jung, H.-T.; Clark, N.A. Dendritic growth in a two-dimensional smectic E freely suspended film. Mol. Syst. Des. Eng. 2020, 5, 815–819. [Google Scholar] [CrossRef]
- Mullins, W.W.; Sekerka, R.F. Morphological stability of a particle growing by diffusion or heat flow. J. Appl. Phys. 1963, 34, 323–329. [Google Scholar] [CrossRef]
- Mullins, W.W.; Sekerka, R. Stability of a planar interface during solidification of a dilute binary alloy. J. Appl. Phys. 1964, 35, 444–451. [Google Scholar] [CrossRef]
- Bruinsma, R.; Rondelez, F.; Levine, A. Flow-controlled growth in Langmuir monolayers. Eur. Phys. J. E 2001, 6, 191–200. [Google Scholar] [CrossRef]
- Luviano, A.S.; Campos-Terán, J.; Langevin, D.; Castillo, R.; Espinosa, G. Mechanical properties of DPPC–POPE mixed langmuir monolayers. Langmuir 2019, 35, 16734–16744. [Google Scholar] [CrossRef]
- Espinosa, G.; López-Montero, I.; Monroy, F.; Langevin, D. Shear rheology of lipid monolayers and insights on membrane fluidity. Proc. Natl. Acad. Sci. USA 2011, 108, 6008–6013. [Google Scholar] [CrossRef] [Green Version]
- Vollhardt, D. Effect of unsaturation in fatty acids on the main characteristics of Langmuir monolayers. J. Phys. Chem. C 2007, 111, 6805–6812. [Google Scholar] [CrossRef]
- Moisy, F. Boxcount (MATLAB Central File Exchange). 2008. Available online: https://ww2.mathworks.cn/matlabcentral/fileexchange/13063-boxcount (accessed on 18 June 2022).
- Vysotsky, Y.B.; Belyaeva, E.; Fainerman, V.; Vollhardt, D.; Aksenenko, E.; Miller, R. Thermodynamics of the clusterization process of cis isomers of unsaturated fatty acids at the air/water interface. J. Phys. Chem. B 2009, 113, 4347–4359. [Google Scholar] [CrossRef]
- Miller, A.; Knoll, W.; Möhwald, H. Fractal growth of crystalline phospholipid domains in monomolecular layers. Phys. Rev. Lett. 1986, 56, 2633. [Google Scholar] [CrossRef]
- Li, J.; Miller, R.; Möhwald, H. Characterisation of phospholipid layers at liquid interfaces 2. Comparison of isotherms of insoluble and soluble films of phospholipids at different fluid/water interfaces. Colloids Surf. A Physicochem. Eng. Asp. 1996, 114, 123–130. [Google Scholar] [CrossRef]
- Helm, C.A.; Moehwald, H. Equilibrium and nonequilibrium features determining superlattices in phospholipid monolayers. J. Phys. Chem. 1988, 92, 1262–1266. [Google Scholar] [CrossRef]
- Mandelbrot, B.B. The Fractal Geometry of Nature; WH Freeman and Company: New York, NY, USA, 1982; Volume 1. [Google Scholar]
- Ivantsov, G. Temperature Field Around a Spherical, Cylindrical, and Needle-Shaped Crystal, Growing in a Pre-Cooled Melt. In Temperature Field Around a Spherical; Akademiya Nauk SSR: Kiev, Ukraine, 1985; Volume 58, pp. 567–569. [Google Scholar]
- Ihle, T.; Müller-Krumbhaar, H. Fractal and compact growth morphologies in phase transitions with diffusion transport. Phys. Rev. E 1994, 49, 2972. [Google Scholar] [CrossRef] [PubMed] [Green Version]
- McFadden, S.; Browne, D.J. A generalised version of an Ivantsov-based dendrite growth model incorporating a facility for solute measurement ahead of the tip. Comput. Mater. Sci. 2012, 55, 245–254. [Google Scholar] [CrossRef]
- Dhar, P.; Eck, E.; Israelachvili, J.N.; Lee, D.W.; Min, Y.; Ramachandran, A.; Waring, A.J.; Zasadzinski, J.A. Lipid-protein interactions alter line tensions and domain size distributions in lung surfactant monolayers. Biophys. J. 2012, 102, 56–65. [Google Scholar] [CrossRef] [PubMed] [Green Version]
- Bouda, M.; Caplan, J.S.; Saiers, J.E. Box-counting dimension revisited: Presenting an efficient method of minimizing quantization error and an assessment of the self-similarity of structural root systems. Front. Plant Sci. 2016, 7, 149. [Google Scholar] [CrossRef] [PubMed] [Green Version]
- Dehkhoda, P.; Tavakoli, A. Crown-Sierpinski microstrip antenna: Further reduction of the size of a crown square fractal. In Proceedings of the 2005 IEEE Antennas and Propagation Society International Symposium, Washington, DC, USA, 3–8 July 2005; pp. 247–250. [Google Scholar]


| 1.2 | 0.46 | 76.67 | 2.1–4.9 | 0.8–1.2 |
| 2.3 | 1.08 | 180.00 | 6.0–24.8 | 3.8–5.5 |
| 2.5 | 1.20 | 200.00 | 11.3–16.9 | 4.3–6.3 |
Publisher’s Note: MDPI stays neutral with regard to jurisdictional claims in published maps and institutional affiliations. |
© 2022 by the authors. Licensee MDPI, Basel, Switzerland. This article is an open access article distributed under the terms and conditions of the Creative Commons Attribution (CC BY) license (https://creativecommons.org/licenses/by/4.0/).
Share and Cite
Gellert, F.; Ahrens, H.; Wulff, H.; Helm, C.A. Seaweed and Dendritic Growth in Unsaturated Fatty Acid Monolayers. Membranes 2022, 12, 698. https://doi.org/10.3390/membranes12070698
Gellert F, Ahrens H, Wulff H, Helm CA. Seaweed and Dendritic Growth in Unsaturated Fatty Acid Monolayers. Membranes. 2022; 12(7):698. https://doi.org/10.3390/membranes12070698
Chicago/Turabian StyleGellert, Florian, Heiko Ahrens, Harm Wulff, and Christiane A. Helm. 2022. "Seaweed and Dendritic Growth in Unsaturated Fatty Acid Monolayers" Membranes 12, no. 7: 698. https://doi.org/10.3390/membranes12070698