Article

Cobalt-Based Cathode Catalysts for Oxygen-Reduction Reaction in an Anion Exchange Membrane Fuel Cell

1
Department of Chemical and Materials Engineering, National Kaohsiung University of Science and Technology, 415, Chien-Kuo Road, Kaohsiung 80782, Taiwan
2
Department of Chemical and Materials Engineering, National Yu-Lin University of Science & Technology, 123, Section 3, University Road, Dou-Liu City 64301, Taiwan
*
Authors to whom correspondence should be addressed.
Membranes 2022, 12(7), 699; https://doi.org/10.3390/membranes12070699
Submission received: 10 June 2022 / Revised: 2 July 2022 / Accepted: 6 July 2022 / Published: 11 July 2022
(This article belongs to the Special Issue Advances in Porous and Dense Membranes: Fabrication and Applications)

Abstract

:
A novel cobalt-chelating polyimine (Co-PIM) containing an additional amine group is prepared from the condensation polymerization of diethylene triamine (DETA) and terephthalalehyde (PTAl) by the Schiff reaction. A Co, N-co-doped carbon material (Co-N-C), obtained from two-stage calcination in different gas atmospheres is used as the cathode catalyst of an anion exchange membrane fuel cell (AEMFC). The Co-N-C catalyst demonstrates a CoNx-type single-atom structure seen under high-resolution transmission electron microscopy (HRTEM). The Co-N-C catalysts are characterized by FTIR, XRD, and Raman spectroscopy as well. Their morphologies are also illustrated by SEM and TEM micrographs, respectively. Surface area and pore size distribution are found by BET analysis. Co-N-C catalysts exhibit a remarkable oxygen reduction reaction (ORR) at 0.8 V in the KOH(aq). From the LSV (linear-sweeping voltammetry) curves, the onset potential relative to RHE is 1.19–1.37 V, the half wave potential is 0.73–0.78 V, the Tafel slopes are 76.9–93.6 mV dec−1, and the average number of exchange electrons is 3.81. The limiting reduction current of CoNC-1000A-900 is almost the same as that of commercial 20 wt% Pt-deposited carbon particles (Pt/C), and the max power density (Pmax) of the single cell using CoNC-1000A-900 as the cathode catalyst reaches 361 mW cm−2, which is higher than Pt/C (284 mW cm−2).

Graphical Abstract

1. Introduction

Fuel cell catalysts based on elements, such as Pt, require abundant surface area to contact with gas fuels. Therefore, people usually prepare nanoscale Pt by impregnating Pt onto conductive carbon black (CB) surfaces, so-called Pt/C. Consequently, reduction reactions from the Pt ions to Pt nanoparticles are usually carried out in the presence of conductive CBs, leading to Pt/C [1,2,3,4]. For convenience, certain amino organic chemicals could also behave like reducing agents to prepare Pt nanoparticles by hydrothermal methods [5,6,7], microwave-assisted heating [8,9], or often calcination [10]. However, to improve the electron transport ability (conductivity) of Pt-nanoparticles deposited on non-conductive carbonaceous substrates, calcination in the absence of air is required to convert most of the sp3-carbon substrates into the conjugated sp2-carbon system (more aromatic structures). Naturally, during the synthesis of Pt/C, amine groups containing aromatic polymers, such as polyaniline, were adopted, behaving as both chelating and reducing agents. However, thermal annealing can also generate larger Pt particles and greatly decrease the amount of surface area.
To avoid spending budgets on the preparation of conductive materials for expensive catalysts, such as Pt, non-precious metals, such as Fe, or Co-doped nitrogen-containing carbon substrates (FeNC or CoNC) [11,12], turned out to be candidates to replace expensive Pt/C. Typical works of outperformance of non-Pt metal catalysts that improve the ORR (oxygen-reduction reaction) in a cathode are described in ref. [13,14]. We have been investigating chelating iron or cobalt ions with nitrogen-containing (N-containing) compounds, which were then calcined to become metal–organic frameworks as cathode catalysts for proton exchange membranes (PEMs) or anion exchange membrane fuel cells (AEMFCs) [15,16,17,18]. In this study, we needed more robust Co ion absorbers, which can be converted into Co-doped nitrogen-containing carbonaceous composites (Co-N-C) as cathode catalysts of AEMFCs. The carbonaceous matrix acts as a conducting medium, allowing electrons generated from the anode to transport into cathode and contact with the Co active centers in the Co-N-Cs. Since the coordination numbers for Co is 6, they are not easily fixed into the carbon matrices, whose coordination numbers is 4. However, upon nitrogen doping, not only the polarity of the carbon matrix increases, but nitrogen also can chelate with Co ions and introduce them into a stable Co, N-doped carbon network after calcination.
Aromatic polyimine (APIM) with C=N bonds can firmly coordinate with Co ions, and the polymer chains can be calcined to become highly conjugated conductive carbon matrices. However, there is only one imine in a monomer unit available to chelate with Co ions. In addition, the curved nature of the polymer long molecules can hinder the approaching Co ions from contacting with the imine unit. Therefore, less Co ions are able to touch and chelate with APIM, which will significantly impair the catalytic ability of the Co-N-C catalysts. Additionally, the imine groups linked with two large aromatic rings at both ends only left limited space to accommodate the Co ions for chelation, resulting in less chelated Co ions available.
Diethylene diamine (DETA) which owns three aminos is used to replace aromatic diamine to provide additional amine and more space to chelate more Co ions [19,20] in the preparation of polyimine, which then calcines into a Co-N-C network and acts as the cathode catalysts for AEMFC. The Co-N-C obtained is characterized by FTIR, X-ray diffraction, and Raman spectroscopy. Morphologies are studied by SEM, TEM, and HR-TEM. The electrochemical properties, including polarization (current-voltage curve) and linear sweeping voltage (LSV), are measured by rotating disk electrodes (RDE). Eventually, a membrane electrode assembly (MEA) is fabricated, and the power density of the single cell testing is recorded to evaluate the feasibility of using Co-N, doped carbon frameworks as the cathode catalysts of AEMFC.

2. Materials and Methods

2.1. Materials

Materials include DETA (Tokyo Kasei Kogyo Co., Ltd., Tokyo, Japan), TPAl (Tokyo Kasei Kogyo Co., Ltd., Tokyo, Japan), and anhydrous cobalt(II) chloride (CoCl2, J.T. Baker, Radnor, PA, USA).

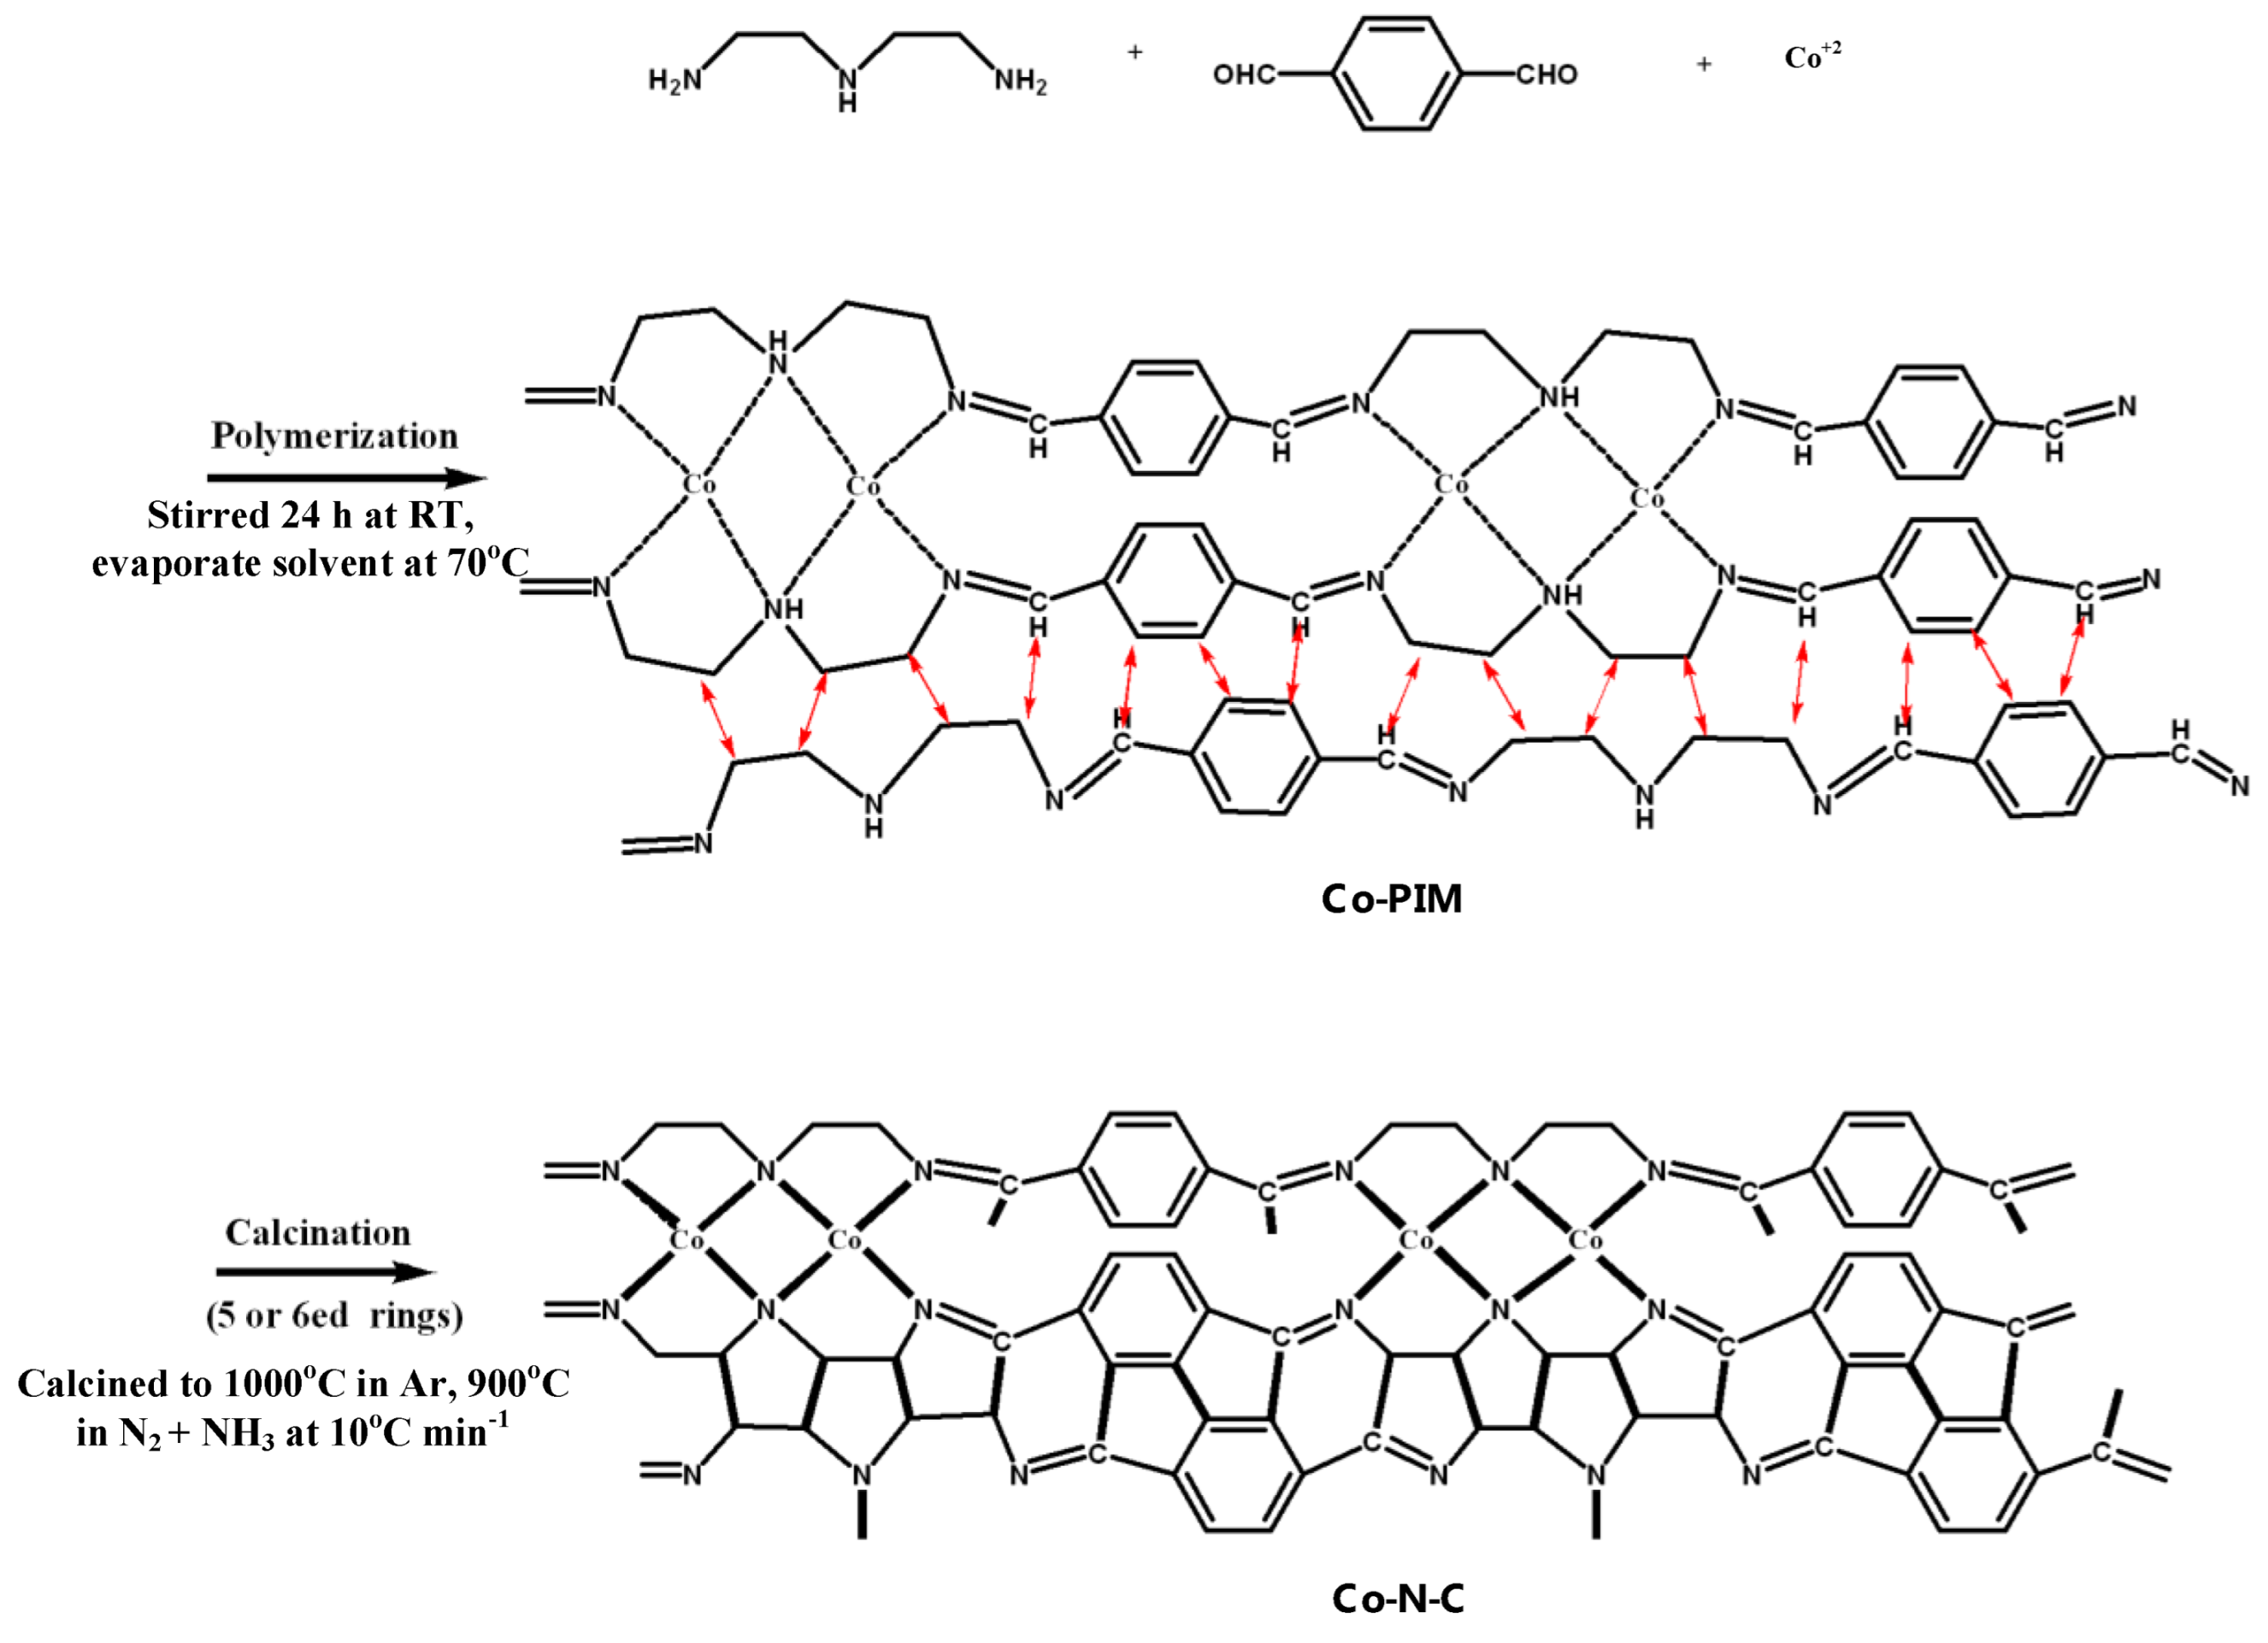
2.2. Preparation of Co-N-C Catalyst

For preparation of the Co-N-C Catalyst, 1.34 g of TPAl in 100 mL alcohol, 1.70 g of PDA in 80 mL alcohol, and 1.18 g of CoCl2.6H2O in 50 mL alcohol were mixed together into one solution. The reaction mixture was stirred at room temperature (RT) for 24 h before heating up to 70 °C and was held at the temperature until almost all alcohol evaporated, followed by slow cooling to RT. The sticky product was then transferred to a Petri dish and put in an oven controlled at 80 °C for 8 h before cooling back to RT and Co-PIM was obtained.
The dry, neat PIM without CoCl2.6H2O was prepared as well for infrared (IR) characterization. Dry Co-PIM, which is used to prepare Co-N-C catalyst, was calcined to 800 °C (800, 900, and 1000 °C) at 10 °C min1 and maintained for 30 min in an argon atmosphere before cooled back to RT. The products were dipped in 1 M H2SO4 (aq.) at 60 °C for 24 h to dissolve and remove the impurities and magnetic portion of either CoO or Co element, followed by filtration, and cleansed with deionized water and alcohol alternatively for several times before drying in a vacuum oven at 80 °C for 24 h. The acid-leached products were under second calcination at 700 °C (700, 800, and 900 °C) at 10 °C min1, and the purging argon was replaced with a mixture of N2 and NH3 gas. The secondly calcined products were dried again in a vacuum oven at 80 °C for 24 h. The eventual sample was named as CoNC-800A-700 (or -900A-800, and -1000A-900).

2.3. Characterization

2.3.1. Raman Spectroscopy

The Raman spectra of all samples were obtained by a Raman spectrometer (TRIAX 320, HOBRIA, Kyoto, Japan).

2.3.2. Wide-Angle X-ray Diffraction (WXRD)

A copper (Cu-Kα) Rigaku X-ray source (Rigaku, Tokyo, Japan) with a wavelength of 1.5402 Å was the target for X-ray diffraction. The scanning angle (2θ), ranging from 10° to 90° with a voltage of 40 kV and a current of 30 mA, was operated at 1° min−1.

2.3.3. Scanning Electronic Microscopy (SEM)

The morphologies of Co-N-C catalysts were obtained by SEM (field emission gun-scanning electron microscope, AURIGAFE, Zeiss, Oberkochen, Germany).

2.3.4. Transmission Electron Microscopy (TEM)

Photos of the samples were taken using an HR-AEM field emission transmission electron microscope (HITACHI FE-2000, Hitachi, Tokyo, Japan); the samples were first dispersed in acetone and were subsequently placed dropwise on carbonic-coated copper grids before being subjected to electron radiation.

2.3.5. Surface Area and Pore Size Measurement (BET Method)

Nitrogen adsorption–desorption isotherms (type IV) were obtained with an Autosorb IQ gas sorption analyzer (Micromeritics-ASAP2020, Norcross, GA, USA) at 25 °C. The samples were dried in vacuum at a temperature higher than 100 °C overnight. The surface area was calculated according to the BET equation when a linear BET plot with a positive C value was in the relative pressure range. Pore size distribution was determined by the quenched solid density functional theory (QSDFT) method based on a model of slit/cylinder pores. The total pore volumes were determined at P/P0 = 0.95.

2.4. Electrochemical Characterization

2.4.1. Current–Potential Polarization-Linear Scan Voltammetry (LSV)

Electrocatalyst support was implemented in a three-electrode system. A round working electrode with an area of 1.5 cm2 was prepared as follows: Ag/AgCl, carbon graphite, and a Pt strip were used as the reference, relative, and counter electrode, respectively. The electrochemical test was performed in a potentiostat/galvanostat (Autolab-PGSTAT 30 Eco Chemie, KM Utrecht, The Netherlands) in 0.1 M KOH(aq) solution, and C–V curves were obtained from 0 to 1 V at a scanning rate of 50 mV·s1. The catalyst ink was prepared by combining 2.9 mg Co-N-C catalyst powder with a mixture of 375 μL of ethanol and 375 μL of deionized water and stirring until uniform. Subsequently, 7.14 μL of 5% D-2020 Nafion solution (Merck, Darmstadt, Germany) was introduced into the mixture as a binder, the mixture was agitated in an ultrasonic sink for 1 h, and 5μL of the obtained ink was uniformly spray-coated on the carbon paper for C-V testing.
The current–potential polarization curves obtained from the LSVs of the various Co-N-C catalysts were measured using a rotating-disk electrode (RDE: Metrohm, Tampa, FL, USA) operating at 400, 600, 800, 1200, 1600 rpm, respectively, in O2-saturated 0.1 M KOH(aq). The reduction current densities of various Co-N-C catalysts, which were recorded at 1600 rpm with 5 mV s−1 scanning speed within the measured voltage range (0.0~1.2 V), were chosen for comparison.
The onset voltage (Vonset) and half-wave voltage (V1/2) were directly obtained from the LSV curves (1600 rpm). The kinetic current (Jk), which demonstrated in the first part of ORR in the LSV curve, was taken as logarithm (Log |JK|) vs. voltage (V) to construct the Tafel curves from which Tafel slopes were obtained. The limited reducing current density (Jred) was defined as the current density obtained at 0 V of the LSV curves at 1600 rpm.
The diffusion current density (JD) was obtained from the later stage of ORR in the LSV curve at various rotating speeds (ω) which were used to calculate the Koutecký–Levich (K–L) lines according to the K–L Equation (1). The K–L lines were then used to calculate the numbers of e-transferred (n) during ORR at different voltages.
J D = 0.62 × AnFD 2 / 3 η 1 / 6 C ω
A—the geometric area of the disk (cm2);
F—Faraday’s constant (C mol−1);
D—the diffusion coefficient of O2 in the electrolyte (cm2 s−1);
η—the kinematic viscosity of the electrolyte (cm2 s−1);
C—the concentration of O2 in the electrolyte (mol cm−3);
ω—the angular frequency of rotation (rad s−1);
n—the number of electrons involved in the reduction reaction.

2.4.2. MEA Preparation

An X37-50RT sheet (50 μm), purchased from Dioxide Materials, Boca Raton, FL, USA, was used as the hydroxyl ion-exchange membrane. To saturate the membranes with hydroxyl (OH) ions, the X37-50RT (2 × 2 cm) membrane was submerged in 1 M KOH(aq) solution for 24 h. Subsequently, the treated membranes were dipped in distilled water for 15 min and were then stored in 1 M KOH(aq) solution. The catalyst inks were prepared by mixing 18 mg of Co-N-C powders in 400 mg of methanol and 400 mg of deionized water, which were mechanically stirred until uniform, followed by the addition of 90 mg of 5% Sustainion® XB-7 alkaline ionomer ethanol solution (Dioxide Materials, Raton, FL, USA) before stirring again until uniform. Eventually, the catalyst mixture was ultrasonicated for 1 h, followed by dropwise coating on both sides of the treated X37-50RT sheet as the anode (20% Pt/C) and cathode electrodes (2 × 2 cm), respectively, and hot pressing at 140 °C with a pressure force of 70 kgf cm2 for 5 min to obtain the MEA.

2.4.3. Single-Cell Performance Testing

The MEA was installed in a fuel cell test station to measure the potentials and power densities of the assembled single cell at different current densities using a single-cell testing device (model FCED-P50; Asia Pacific Fuel Cell Technologies, Ltd., Miaoli, Taiwan). The active cell area was 2 × 2 cm. The temperatures of the anode, cell, cathode, and humidifying gas were maintained at about 60 °C. The fuel-flowing rates of the anode input H2 and the cathode input O2 were set at 30 and 60 mL·min1, respectively, based on stoichiometry.

3. Results and Discussion
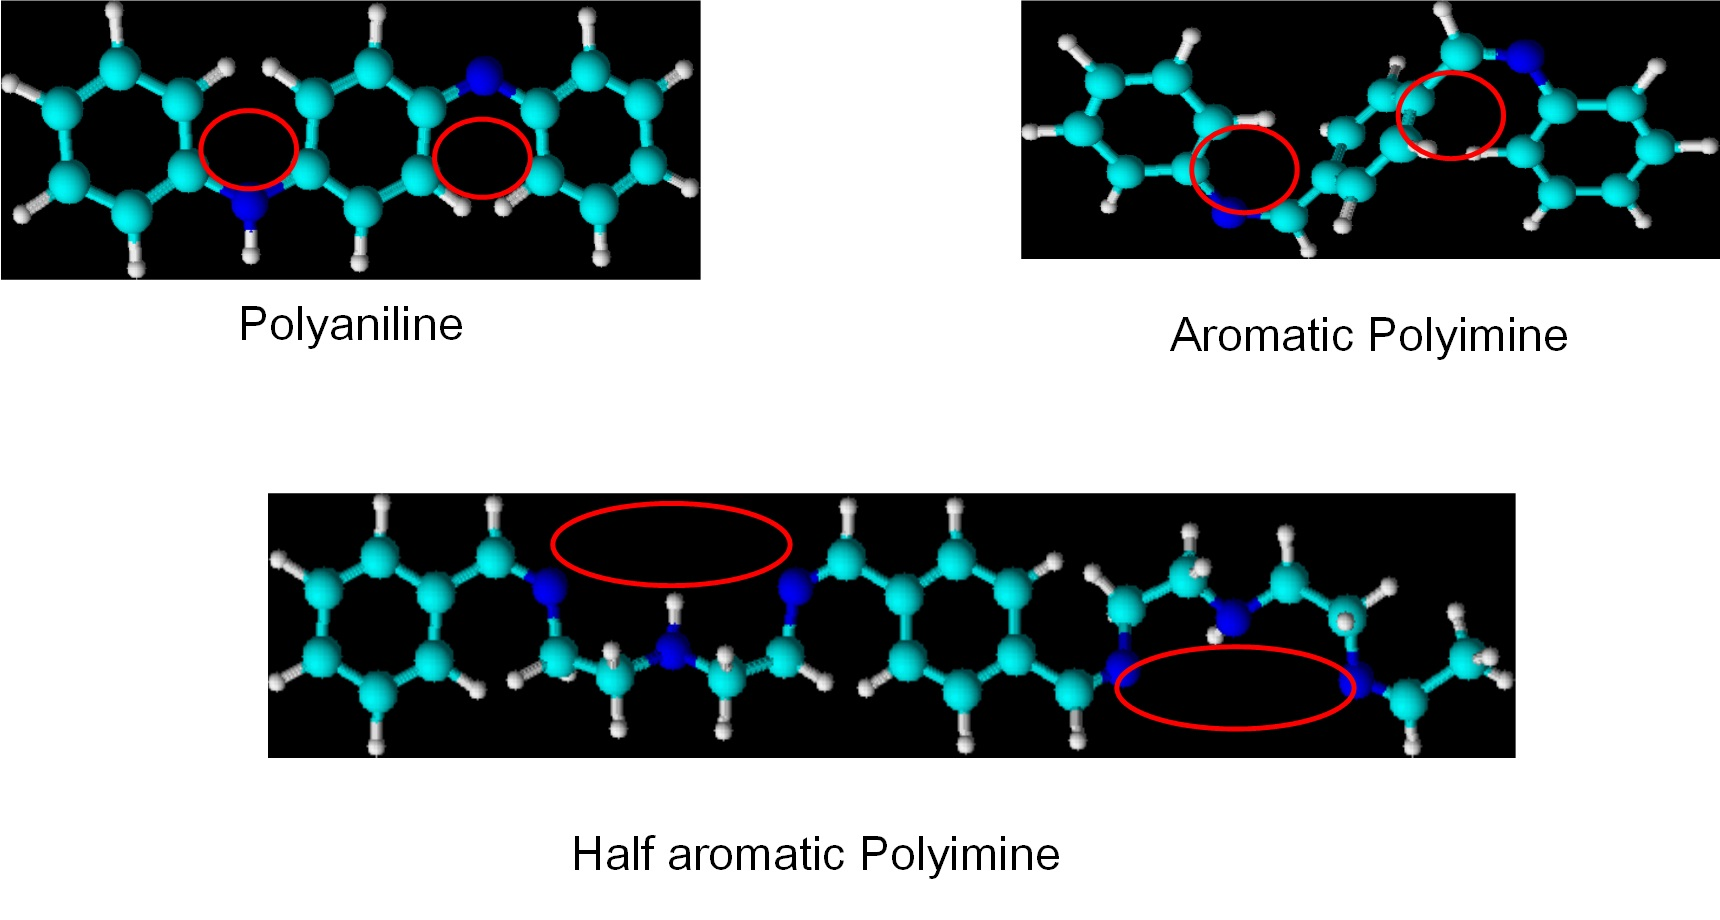
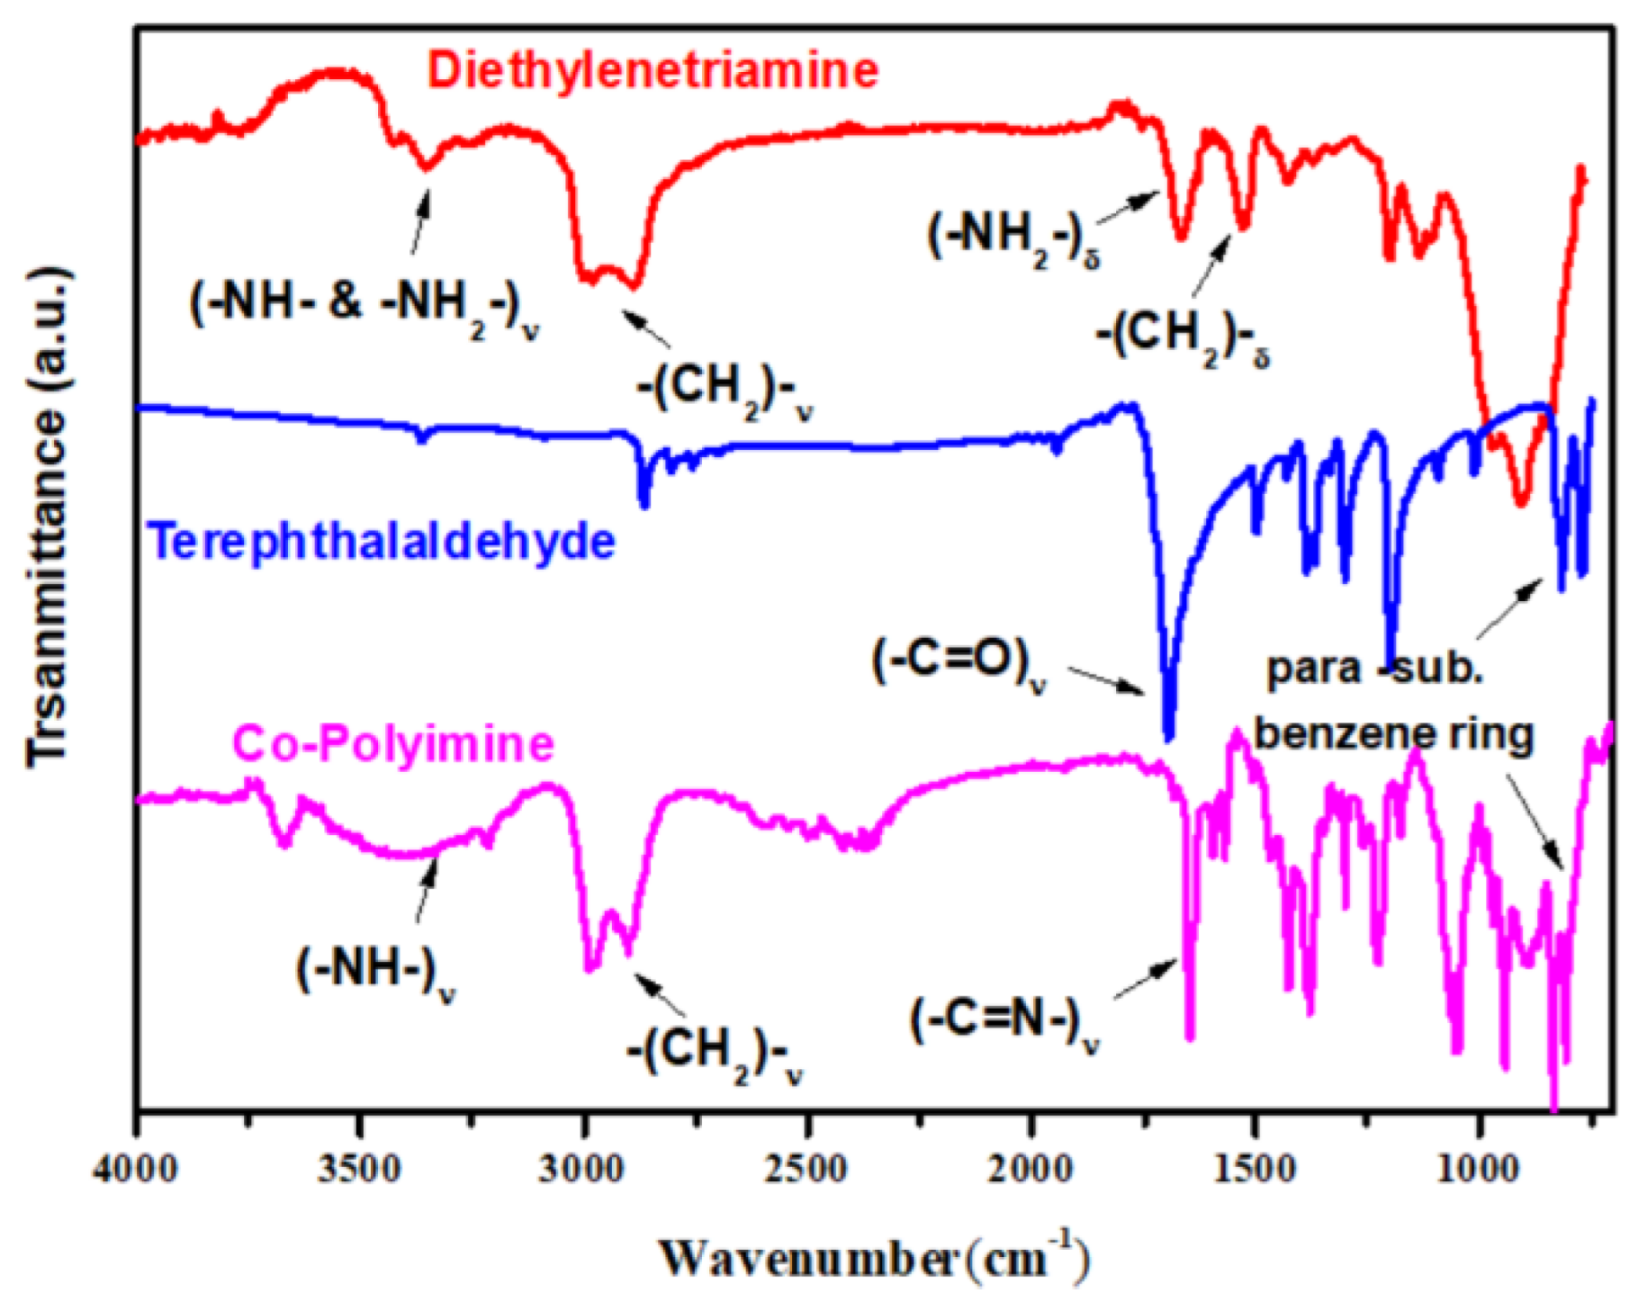
3.1. FTIR

Main functional group assignments of the prepared Co-PIM were based on the FTIR-spectrum demonstrated in Figure 1. The IR-spectra of each monomer (DETA and TPAl) were also obtained to compare with that of the resultant PIM in Figure 1. The stretching and bending modes of the amine and ethylene groups belonging to the DETA monomer are clearly seen in Figure 1. The amines convert to imine after condensating with TPAl, and its carbonyl group disappears as well after polymerization. The para-substituted benzene rings of TPAl and Co-PIM are found at around 819 cm−1. The symmetric and asymmetric stretch of the ethylene of DETA remains intact, whereas the primary amine of DETA disappears after polymerization. The wave numbers of each type of group are listed in Table 1.
An additional amine group contributed from DETA makes it more possible to cooperate with the rest of the nitrogens of imine to accommodate (complex with) more Co ions, as described in Scheme 1. The ethylene groups on the polyimine main chain introduced by the DETA are able to carry out inter-chain crosslinking since many of the five- or six-membered rings are able to form during calcination, which then develop into highly conducting Co, N co-doped (CoN4) carbonaceous networks of Co-N-C catalysts in accordance with the depiction in Scheme 1.

3.2. XRD

Both the Co crystalline and conjugated carbon matrix are able to develop during high-temperature calcination in the inert atmosphere, referring to Figure 2a. The intensity of (002) planes belong to either graphene (GF) or carbon nanotube (CNT) developed from conjugated carbons that grow gradually with a calcination temperature higher than 700 °C. Similarly, (111) and (200) planes of the FCC crystal of Co elements become more and more significant with temperature. It seems the Co-N-C catalysts do not experience significant oxidation in the argon atmosphere during calcination, according to the X-ray diffraction patterns demonstrated in Figure 2a. Most of the Co elements obtained in the first stage calcination in the argon, which also resulted in the magnetic attraction of Co-N-Cs that can be removed by acid-leaching, and the typical FCC planes either disappear or become insignificant compared to that of the C(002) plane in Figure 2b. However, Co crystalline was replaced with CoO gradually with increasing calcination temperatures in the second stage during which argon was replaced by N2 and NH3, as shown in Figure 2b. Even though some CoO crystalline were developed, they are less comparable to carbon crystalline in accordance with Figure 2b or Table 2. Not surprisingly, the oxygen composition rises again (Table 2) when second calcination is carried out at 900 °C. Eventually, the carbon matrix is the dominating component, which is confirmed in Table 2 and can be confirmed by the TEM images.

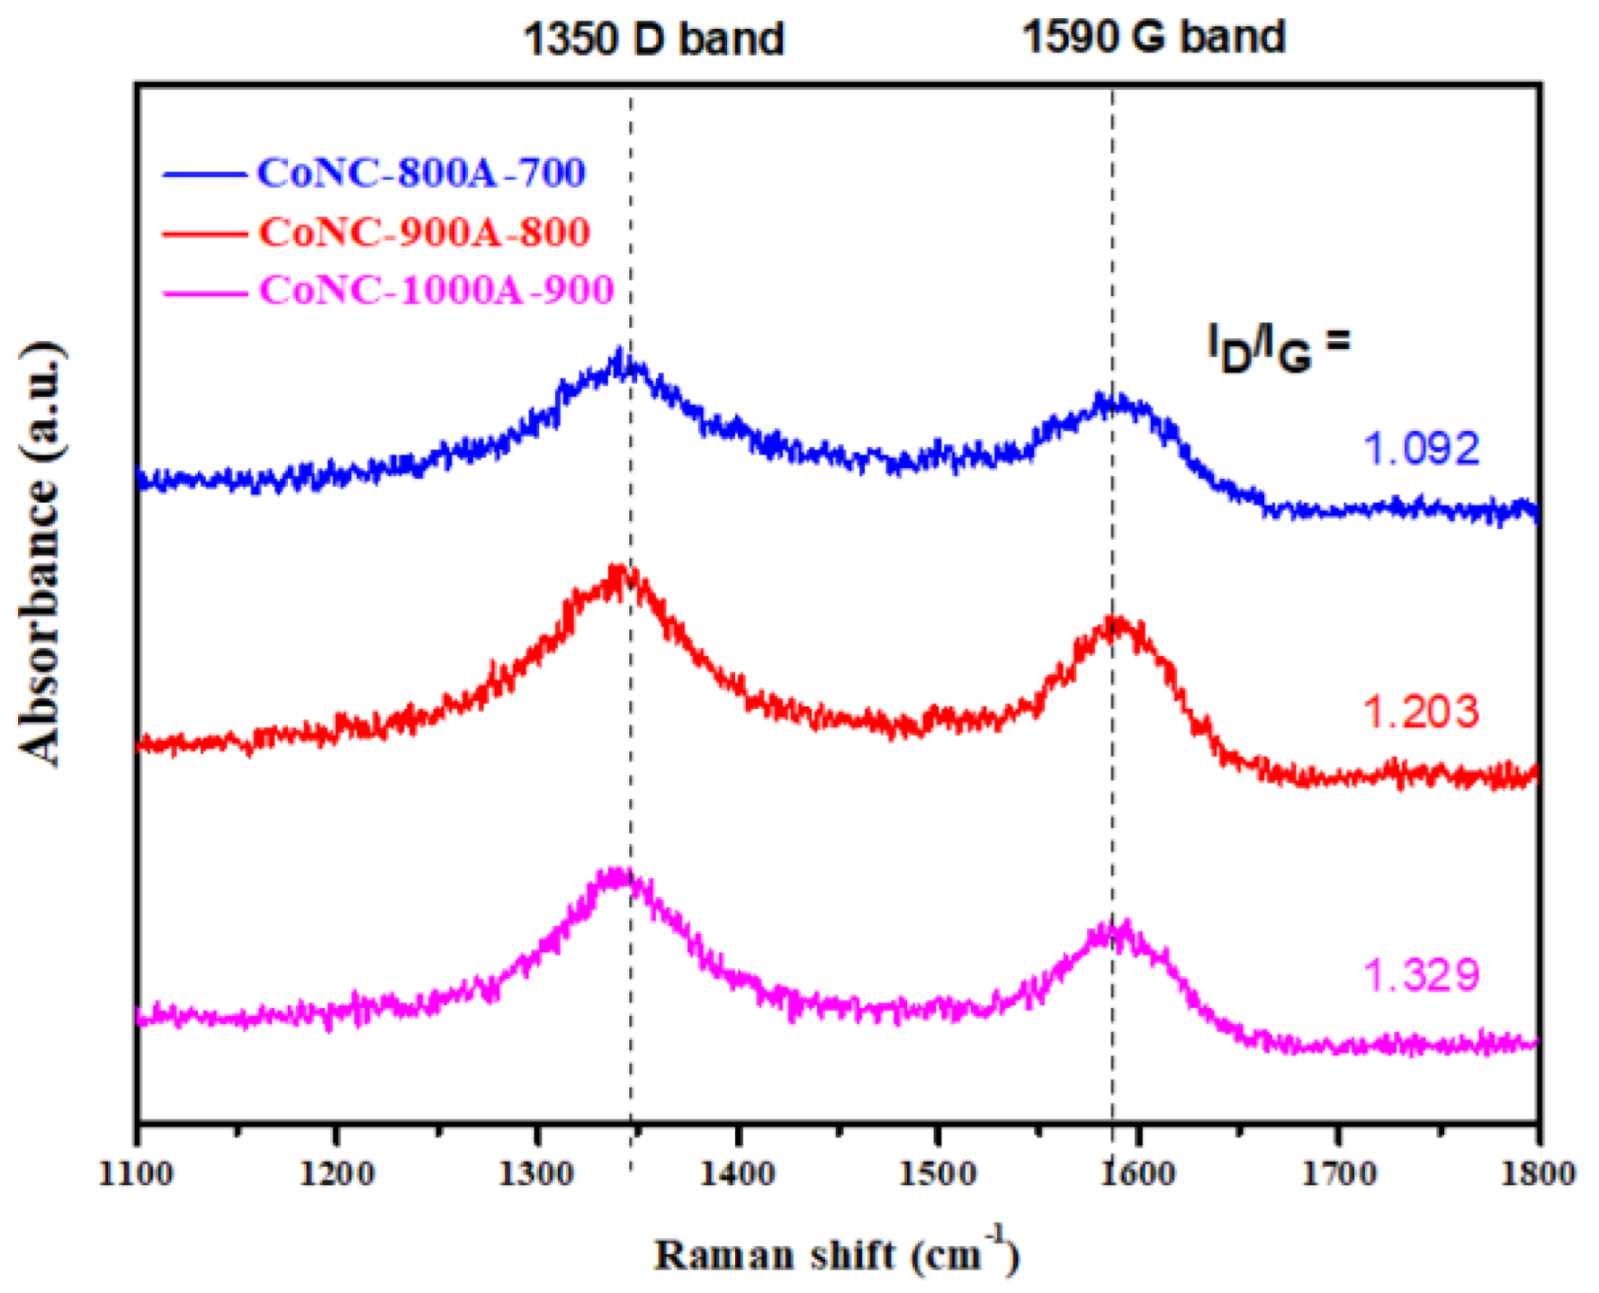
3.3. Raman Spectroscopy

During calcination, the Co-PIM carry out the carbonization process through intra- or inter-chain crosslinking and becomes a Co, N-doped network with some CoNx units present in the carbonaceous matrix, which also behave as the catalytic centers for ORR. Although Co elements and CoO developed during calcination, they can catalyze ORR as well. However, Co elements and CoO are either removed from the surface of networks by acid-leaching or embedded in the carbon matrix, losing their catalytic capability. The carbonization process also improves the formation of conjugated carbon bonding, resulting in a highly conducting carbon matrix composed of either GF or CNT. Consequently, the electrons can pass through the conducting Co-N-C matrix to perform the ORR in the CoNx centers. Conjugated bonds (Sp2 bonding) can be developed or degrade into non-conjugated ones (Sp3 bonding) during calcination, which can be monitored by the intensity ratio of the D-band (ID) and G-band(IG), obtained at 1350 and 1590 cm−1, respectively in Figure 3. We understand both D- and G-bands are present in the Co-N-C catalysts, and the unsaturated G-band lose to D-band when calcination temperature increases, and ID/IG ratio increases from 1.092 to 1.329 (Figure 3). In other words, the surface of the catalyst becomes less flat and less crystallized due to the loss of planar Sp2 bonding with increasing temperature, indicating more surface areas are created at higher temperature calcination. The replacement of phenylene diamine with aliphatic DETA significantly decreases the numbers of Sp2 bonding, and all the ID/IG ratios are higher than 1.000. BET measurements come to similar conclusions in the later discussion.

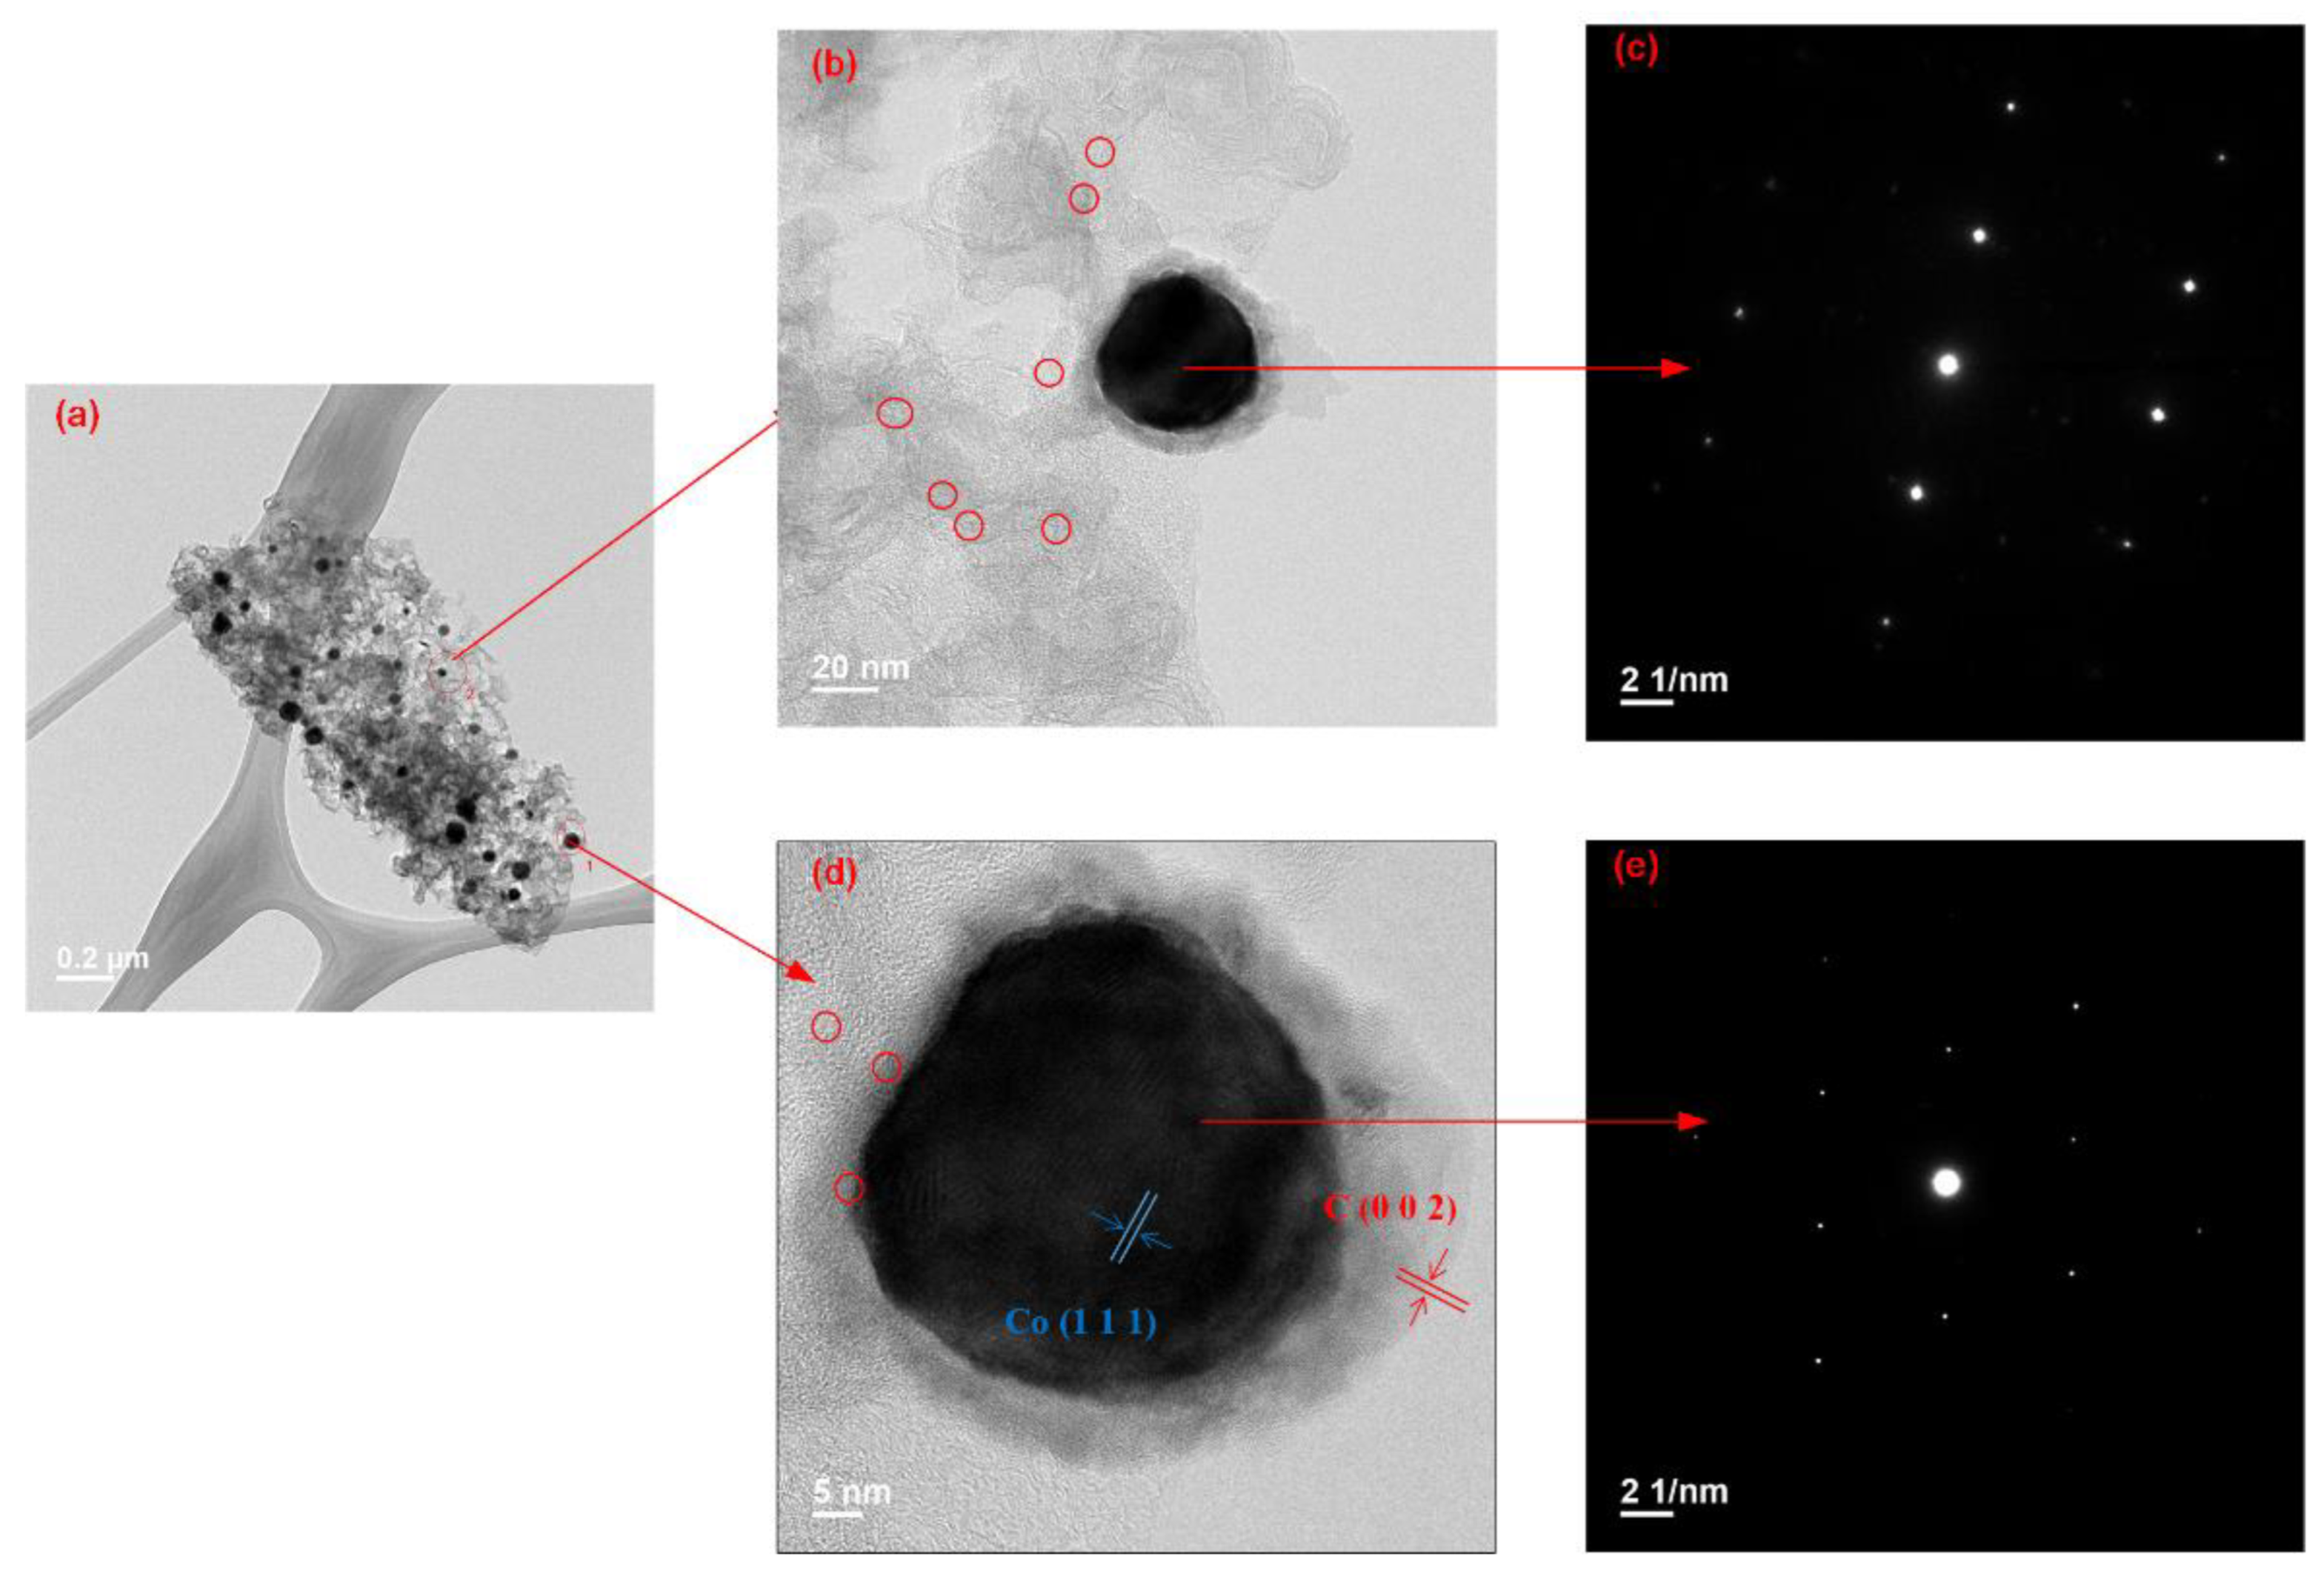
3.4. SEM and TEM Micrographs

The micro-size surface morphology related to the magnitude of surface area and catalytic ability of Co-N-C catalysts can be found in the SEM micrographs in Figure 4a,c,e. We can find dense surface morphologies with fewer micro- or meso-pores for CoNC-800A-700. For CoNC-900A-800 subjected to calcination temperature with 100 °C or higher, the dense structure collapsed, and more pores formed. This indicates that bombardment of NH3 gas on the catalyst surface cannot generate enough pores to achieve high-surface area unless it is performed at temperatures above 800 °C (Figure 4c,e). Consequently, the surface of the CoNC-1000A-900 is filled with micro or mesopores (Figure 4e), where more CoNx centers can be exposed to the incoming O2 to perform ORR.
From the diffraction patterns and spectra presented in Figure 2 and Figure 3, respectively, we understand the presence of a highly conjugated carbon matrix in the Co-N-C catalyst. TEM micrographs confirmed the formation of GFs and CNTs after calcination as well in Figure 4b,d,f. When the calcination temperature is lower (CoNC-800A-700), only folded, overlapping GF sheets can be seen in Figure 4b. Some carbon materials develop into curved CNTs using Co centers as the starting seeds [21,22,23] at higher temperatures and generate more micropores and mesopores, as shown in Figure 4d,f. The inset Figure 4g clearly illustrates the formation of curved CNTs from cup-to-cup stacking of carbons [24]. The embedded Co metal or CoO inside CoNC-1000A-900 can also be found in Figure 4f or Figure 4g.
To localize the single cobalt atom [23,24,25,26,27,28,29,30,31,32,33,34,35,36] which is expressed in CoNx bonding in the carbon matrix, HRTEM pictures taken from Figure 5a at two selected sites (sites 1 and 2) are shown in Figure 5b,d, respectively. Many CoNx dots are dispersed around Co crystalline in Figure 5b and the electron diffraction pattern which is also demonstrated in Figure 5c. From the HRTEM micrograph revealed in Figure 5d, the Co(111) and C(002) planes are identified, and the electron diffraction pattern of the Co crystalline is illustrated in Figure 5e.
The EDS mappings of the Co, N, C, and O elements were demonstrated in Figure 6 in accordance with ref [37]. The percentages of Co, obtained from the EDS spectra are listed in Table 2. Commonly, all Co-N-Cs demonstrate uniform distributions of these four types of elements, according to Figure 6. Not many Co elements are found for each Co-N-C due to the acid-leaching that removed most of Co in the form of CoO or Co metal. Only CoNx with Co covalent bonded in the catalyst network remains.

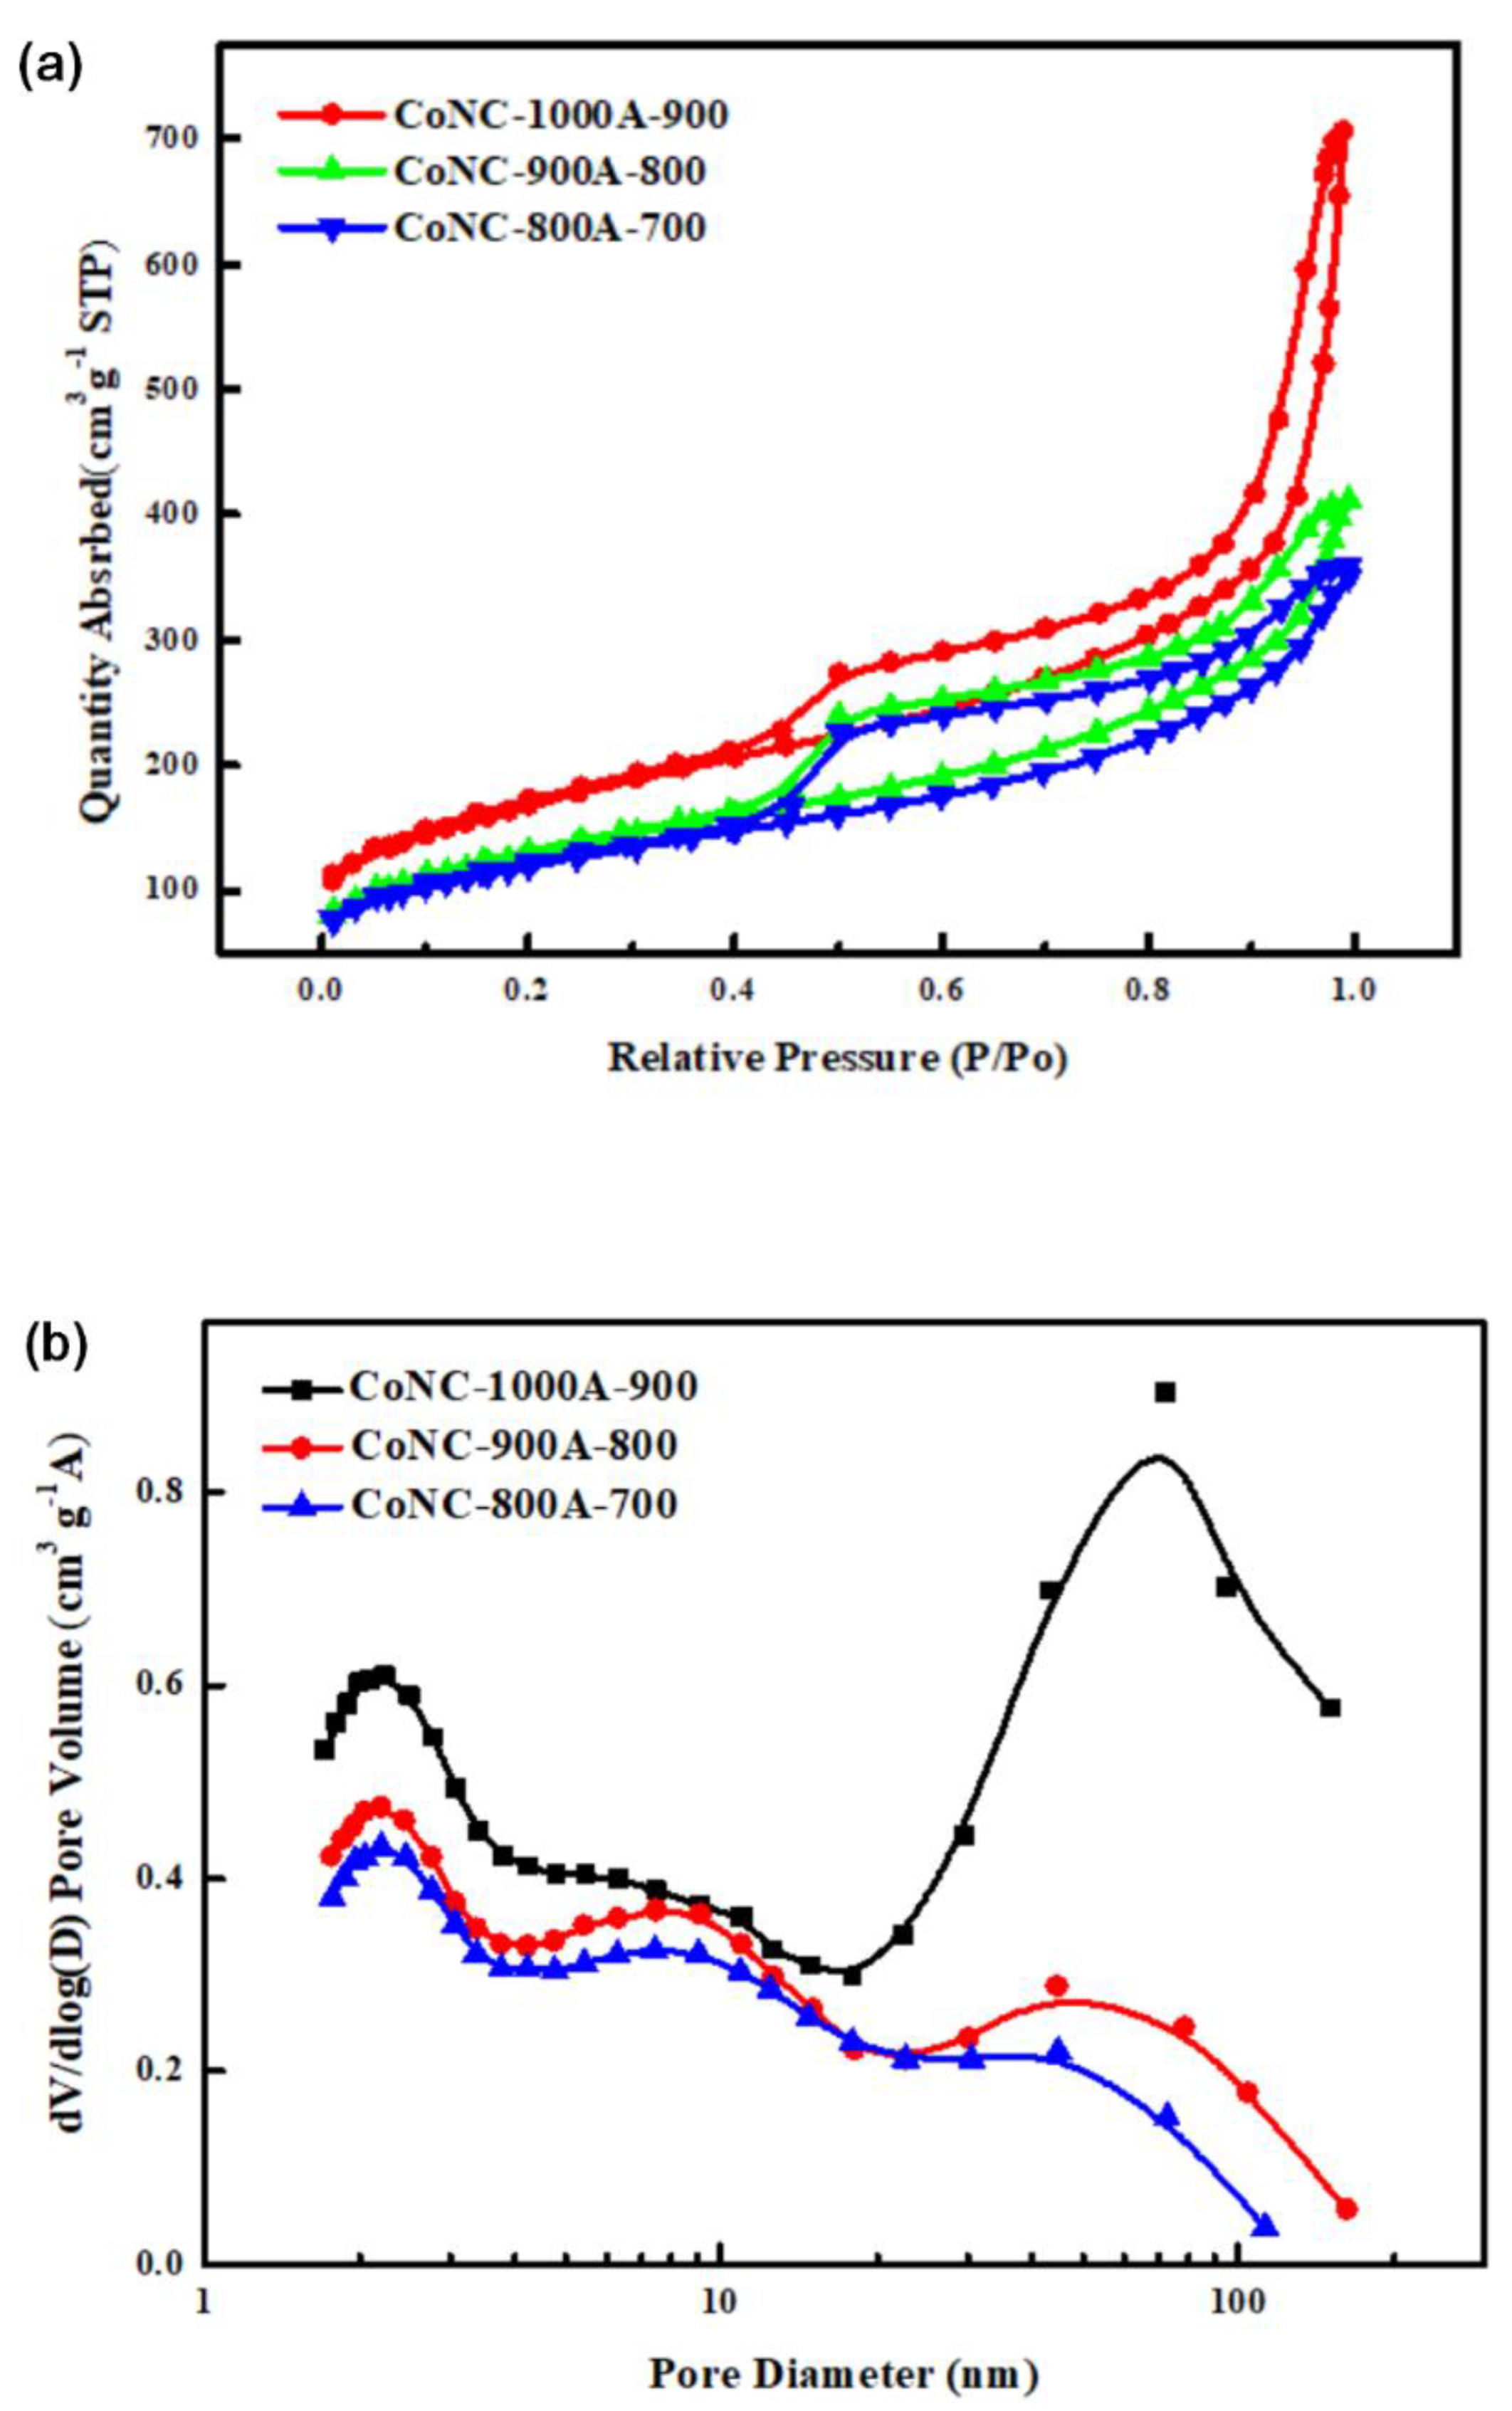
3.5. BET Surface Area and Pore Size Distribution

The morphologies seen in the SEM micrographs of Figure 5 clearly demonstrate surface area (SA) of the Co-N-C catalysts can increase with calcination temperature. We are able to obtain the quantitative SA (Table 3) from the BET isothermal adsorption and desorption curves seen in Figure 7a. All Co-N-Cs demonstrate BET SA ranged from 417 to 583 m2 g−1 (Table 3). The results listed in Table 3 also exhibit the same conclusion drawn from the observations on the SEM micrographs of Figure 5 that catalysts treated with higher temperatures can develop higher SA. The SA can even increase to be over 500 m2 g−1 (Table 3) after a second calcination at 900 °C for CoNC-1000A-900, which can contribute to the higher maximum power density of the MEA discussed in the electrochemical section. We understand the vast increase of SA for CoNC-1000A-900 comes from the formation of external (meso-) pores in accordance with Figure 7b and Table 3 due to the harsh etching capability of NH3 gas molecules at high temperatures. The total volume of CoNC-1000A-900 is almost twice as much as that of CoNC-800A-700 and all above 1 cm3, indicating more volume developing with increasing temperature. The contribution of the additional volume might result from the breaking of the aliphatic carbon single chain of DETA since the BET SA is below 400 m2 g−1, and total volume is always below 1 cm3 if Co, N-doped polyimine is prepared from an aromatic diamine monomer [15,16]. In other words, to replace phenylene diamine with DETA in the preparation of Co-PIM not only can chelate more Co ions by the additional amine but also provide catalysts with higher SA and volume after calcination, matching with the original purpose described in the introduction section.

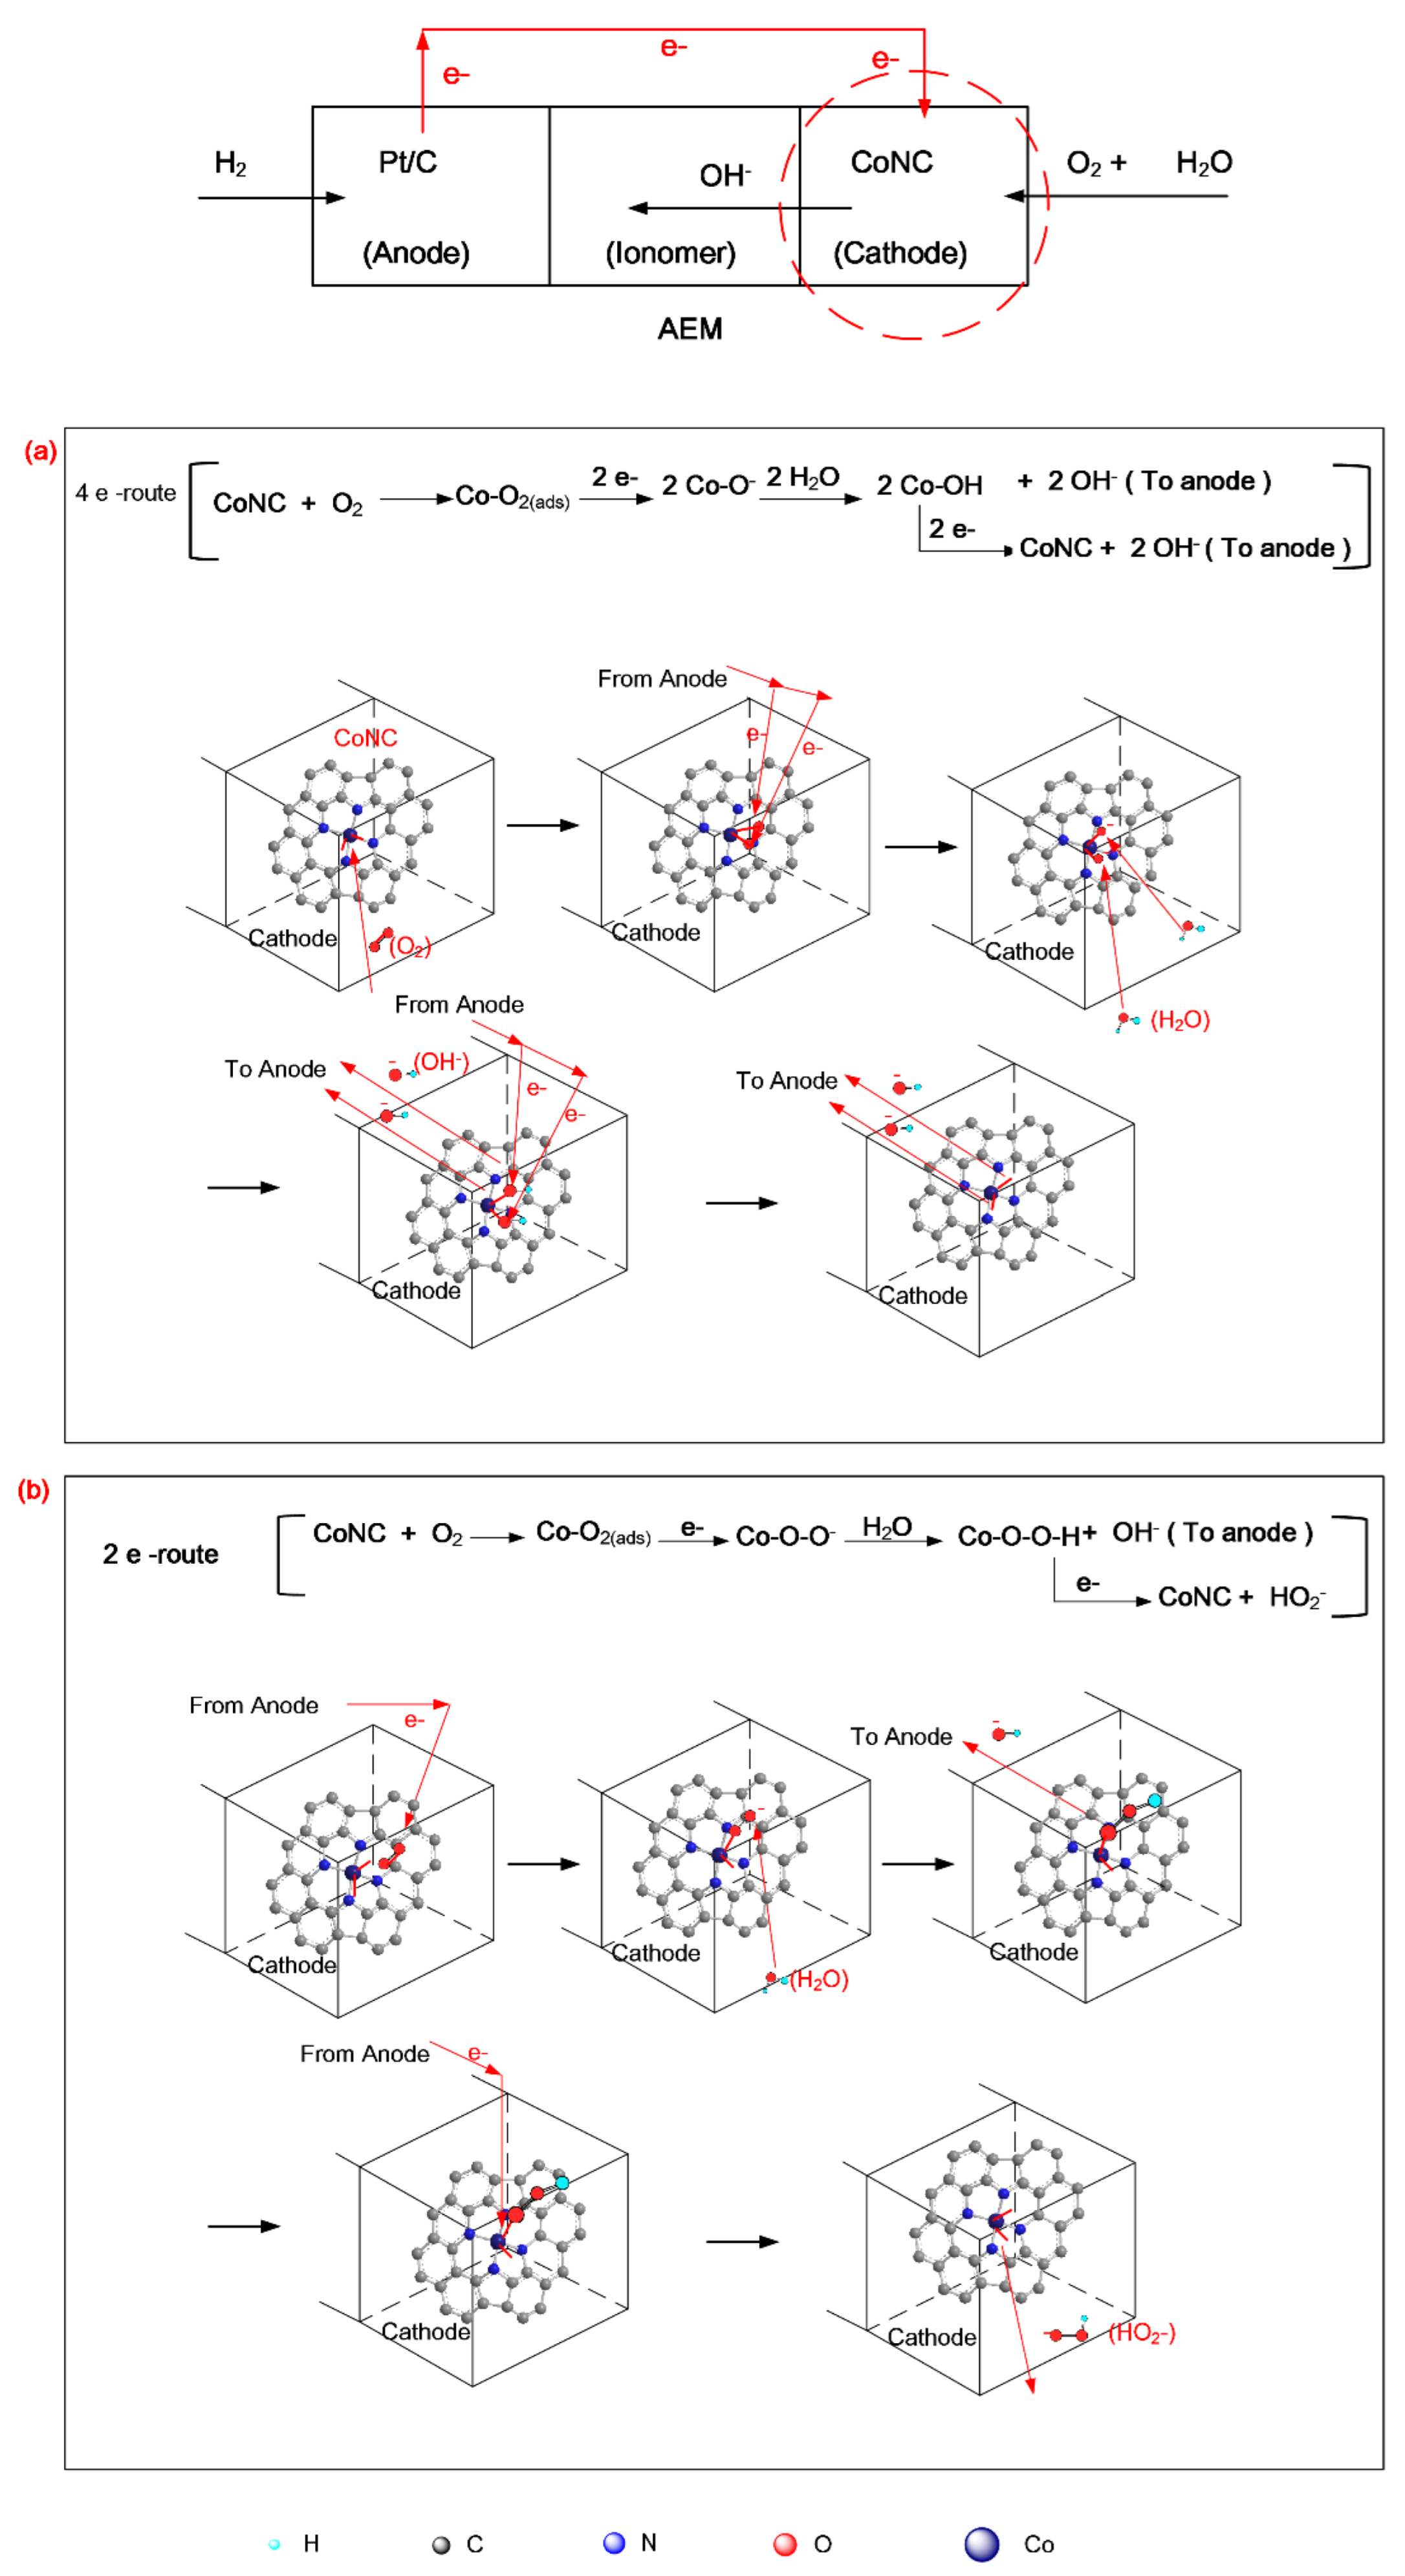
3.6. Possible Mechanism of ORR by Co-N-C Cathode Catalyst

A schematic diagram of an AEMFC is displayed on the upper part of Scheme 2, and the ORR catalytic mechanism of Co-N-Cs in the cathode is also illustrated in Scheme 2a,b, following the 4e and 2e routes, respectively.
In Scheme 2a, O2 is first adsorbed by the CoN4 active center, the π-bond of O2 is broken and covalent-bonded with the empty complex sites of CoN4. Peroxide formed after complexation is reduced and broken into two oxygen ions (-O) after obtaining the electrons donating from anode via external circuit. The strong base (negative oxygen ions) can extract the hydrogen from two water molecules and convert them to two hydroxyl ions (OH), transporting to anode via the anion exchange membrane electrolyte described in Scheme 2a. These two created hydroxyl groups connected to the CoN4 center would break away to become two additional OH after receiving two more electrons from the anode, and the CoN4 center returned to its original state, preparing for the next catalytic cycle. In total, four electrons are involved in ORR, named as the 4e route described in the attached reaction equation in Scheme 2a. The net reaction (4e route) catalyzed by Co-N-Cs in the cathode is:
O 2 + 2 H 2 O + 4 e = >   4   OH
A possible incomplete ORR can also occur when not enough electrons are coming from the anode through an external circuit or less O2 fuel is provided. The captured O2 will partially reduce to become a peroxide ion with only one electron supplied from the anode, depicted in Scheme 2b. Similarly, the strong bae (peroxide ion) can extract hydrogen from a single water molecule and becomes a hydrogen peroxide that is connected to a CoN4 center. The water molecule that loses one hydrogen to the peroxide ion becomes the first OH that can transport via an ionomer membrane to the anode, as described in Scheme 2b. A second electron coming from the anode can reduce the bonded hydrogen peroxide and separate into an ion (HO2) which allows the CoN4 center to return to the original state in Scheme 2b. In total, only two electrons are involved and one OH− is produced in this type of ORR, named as 2eroute. The net reaction (2e route) catalyzed by Co-N-Cs in the cathode is:
O 2 + H 2 O + 2 e = >   OH + HO 2
where OH is not the only product after ORR.
Certainly, HO2 can go on to a further reduction once an additional two electrons and one water are provided:
HO 2 + H 2 O + 2 e = >   3 OH
The actual ORR in the cathode follows both 4e and 2e routes, which mean we always have the by-product, HO2, present in the cathode, and the numbers of e- transferred (n) during ORR ranges from 2 to 4, depending on the degree of ORR into OH. The n-value calculated from the electrochemical data can evaluate the efficiency of the Co-N-C catalysts.
The following discussions will focus on measuring various electrochemical properties related to the performance of the Co-N-C cathode catalysts.

3.7. Electrochemical Properties

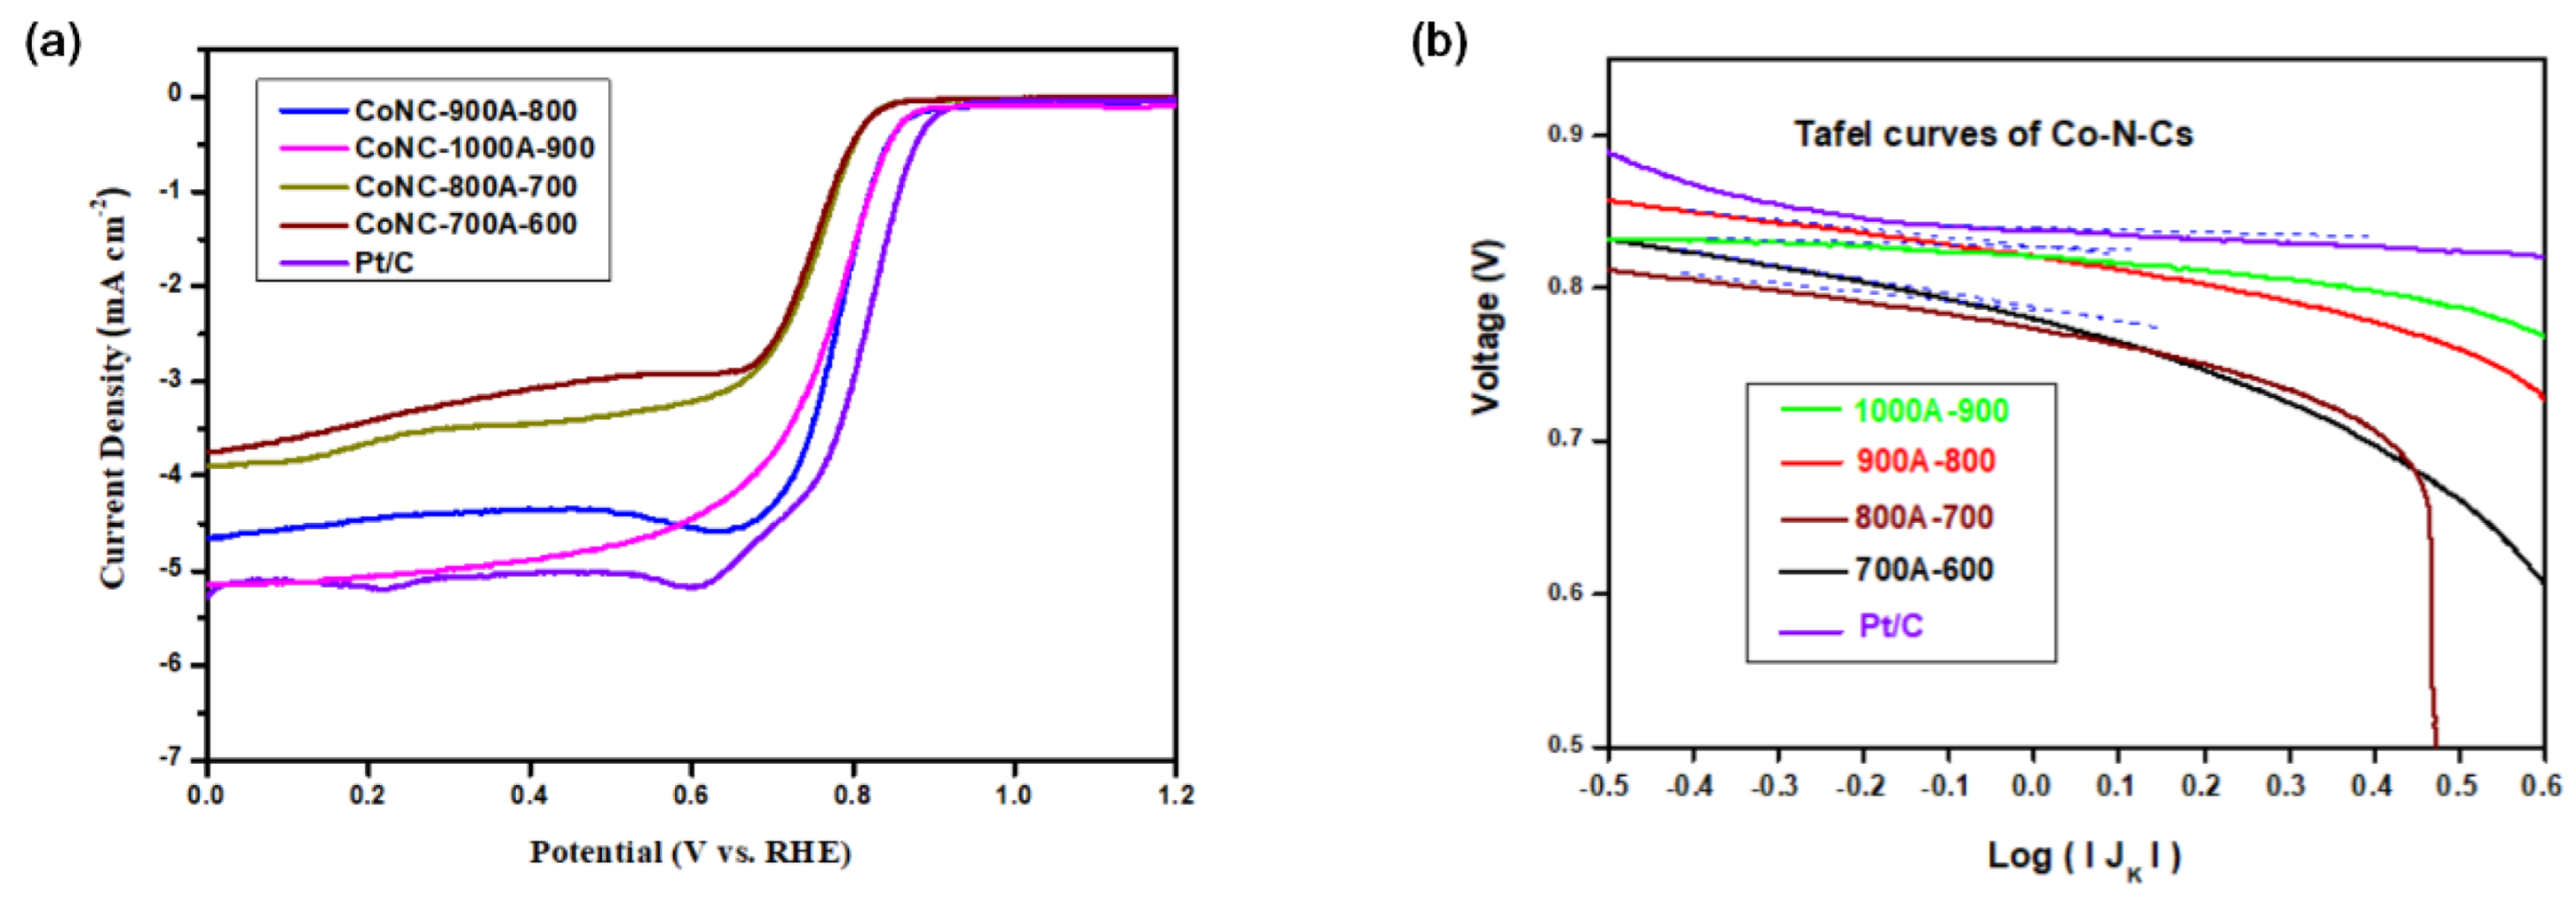
3.7.1. CV and LSV Measurements

The catalysis on the ORR by CoNC-1000A-900 demonstrates a sharp reduction peak in the polarization curve (CV curve) in the O2 atmosphere, which is not found in the N2 atmosphere in accordance with Figure 8a. The CV curve measured with a static electrode at a 50 mVs−1 scanning rate included both reduction and oxidation processes. It was then replaced with a rotating disk electrode (RDE) at various rpms, and only the reduction current density (Jred) was recorded with the linear scan voltammetry method (LSV) since we are studying only cathode catalysts for ORR [38]. All LSV curves of CoNC-1000A-900) illustrated in Figure 8b are measured at different rpms, producing a kinetic reduction current density (Jk) controlled by the concentration of O2 in the initial stage of ORR ranging from 1.2 to 0.6 V. Eventually, the ORR was controlled by the diffusion of O2 gas, and the measured current is called the diffusion current density (JD). Based on the JD obtained at various rotating speeds (Figure 8b), we are able to construct K–L lines (Figure 8c) and n-values (Figure 8d), according to the description in Section 2.4.1. The n-value measured at different voltages are all above 3.5, and the averaged n-value obtained from Figure 8d is about 3.73, very close to 4 when all ORRs followed the 4eroute described in Scheme 2a.
We measured LSV curves of various Co-N-C and Pt/C catalysts at 1600 rpm and illustrated them in Figure 9a from which the onset (Vonset), half-wave (V1/2) potentials, and limited reduction current (Jred) were obtained and listed in Table 4. The Tafel reduction curves obtained from the Jk are demonstrated in Figure 9b from which the Tafel slopes are measured. Surprisingly, CoNC-1000A-900 demonstrate Jred (5.14 mAcm−2) comparable to that of Pt/C (5.27 mAcm−2) and its Tafel slope (78.4 mVdec−1) which is equivalent to resistance (R = V/Log(l Jk l)) and is the lowest as well, indicating the little resistance that was encountered during ORR. Not surprisingly, the AEM single cell that made of MEA based on CoNC-1000A-900 even demonstrates higher Pmax (361 mWcm−2) than that of commercial Pt/C (284 mWcm−2), in accordance with Table 4, which will be discussed in the following section.

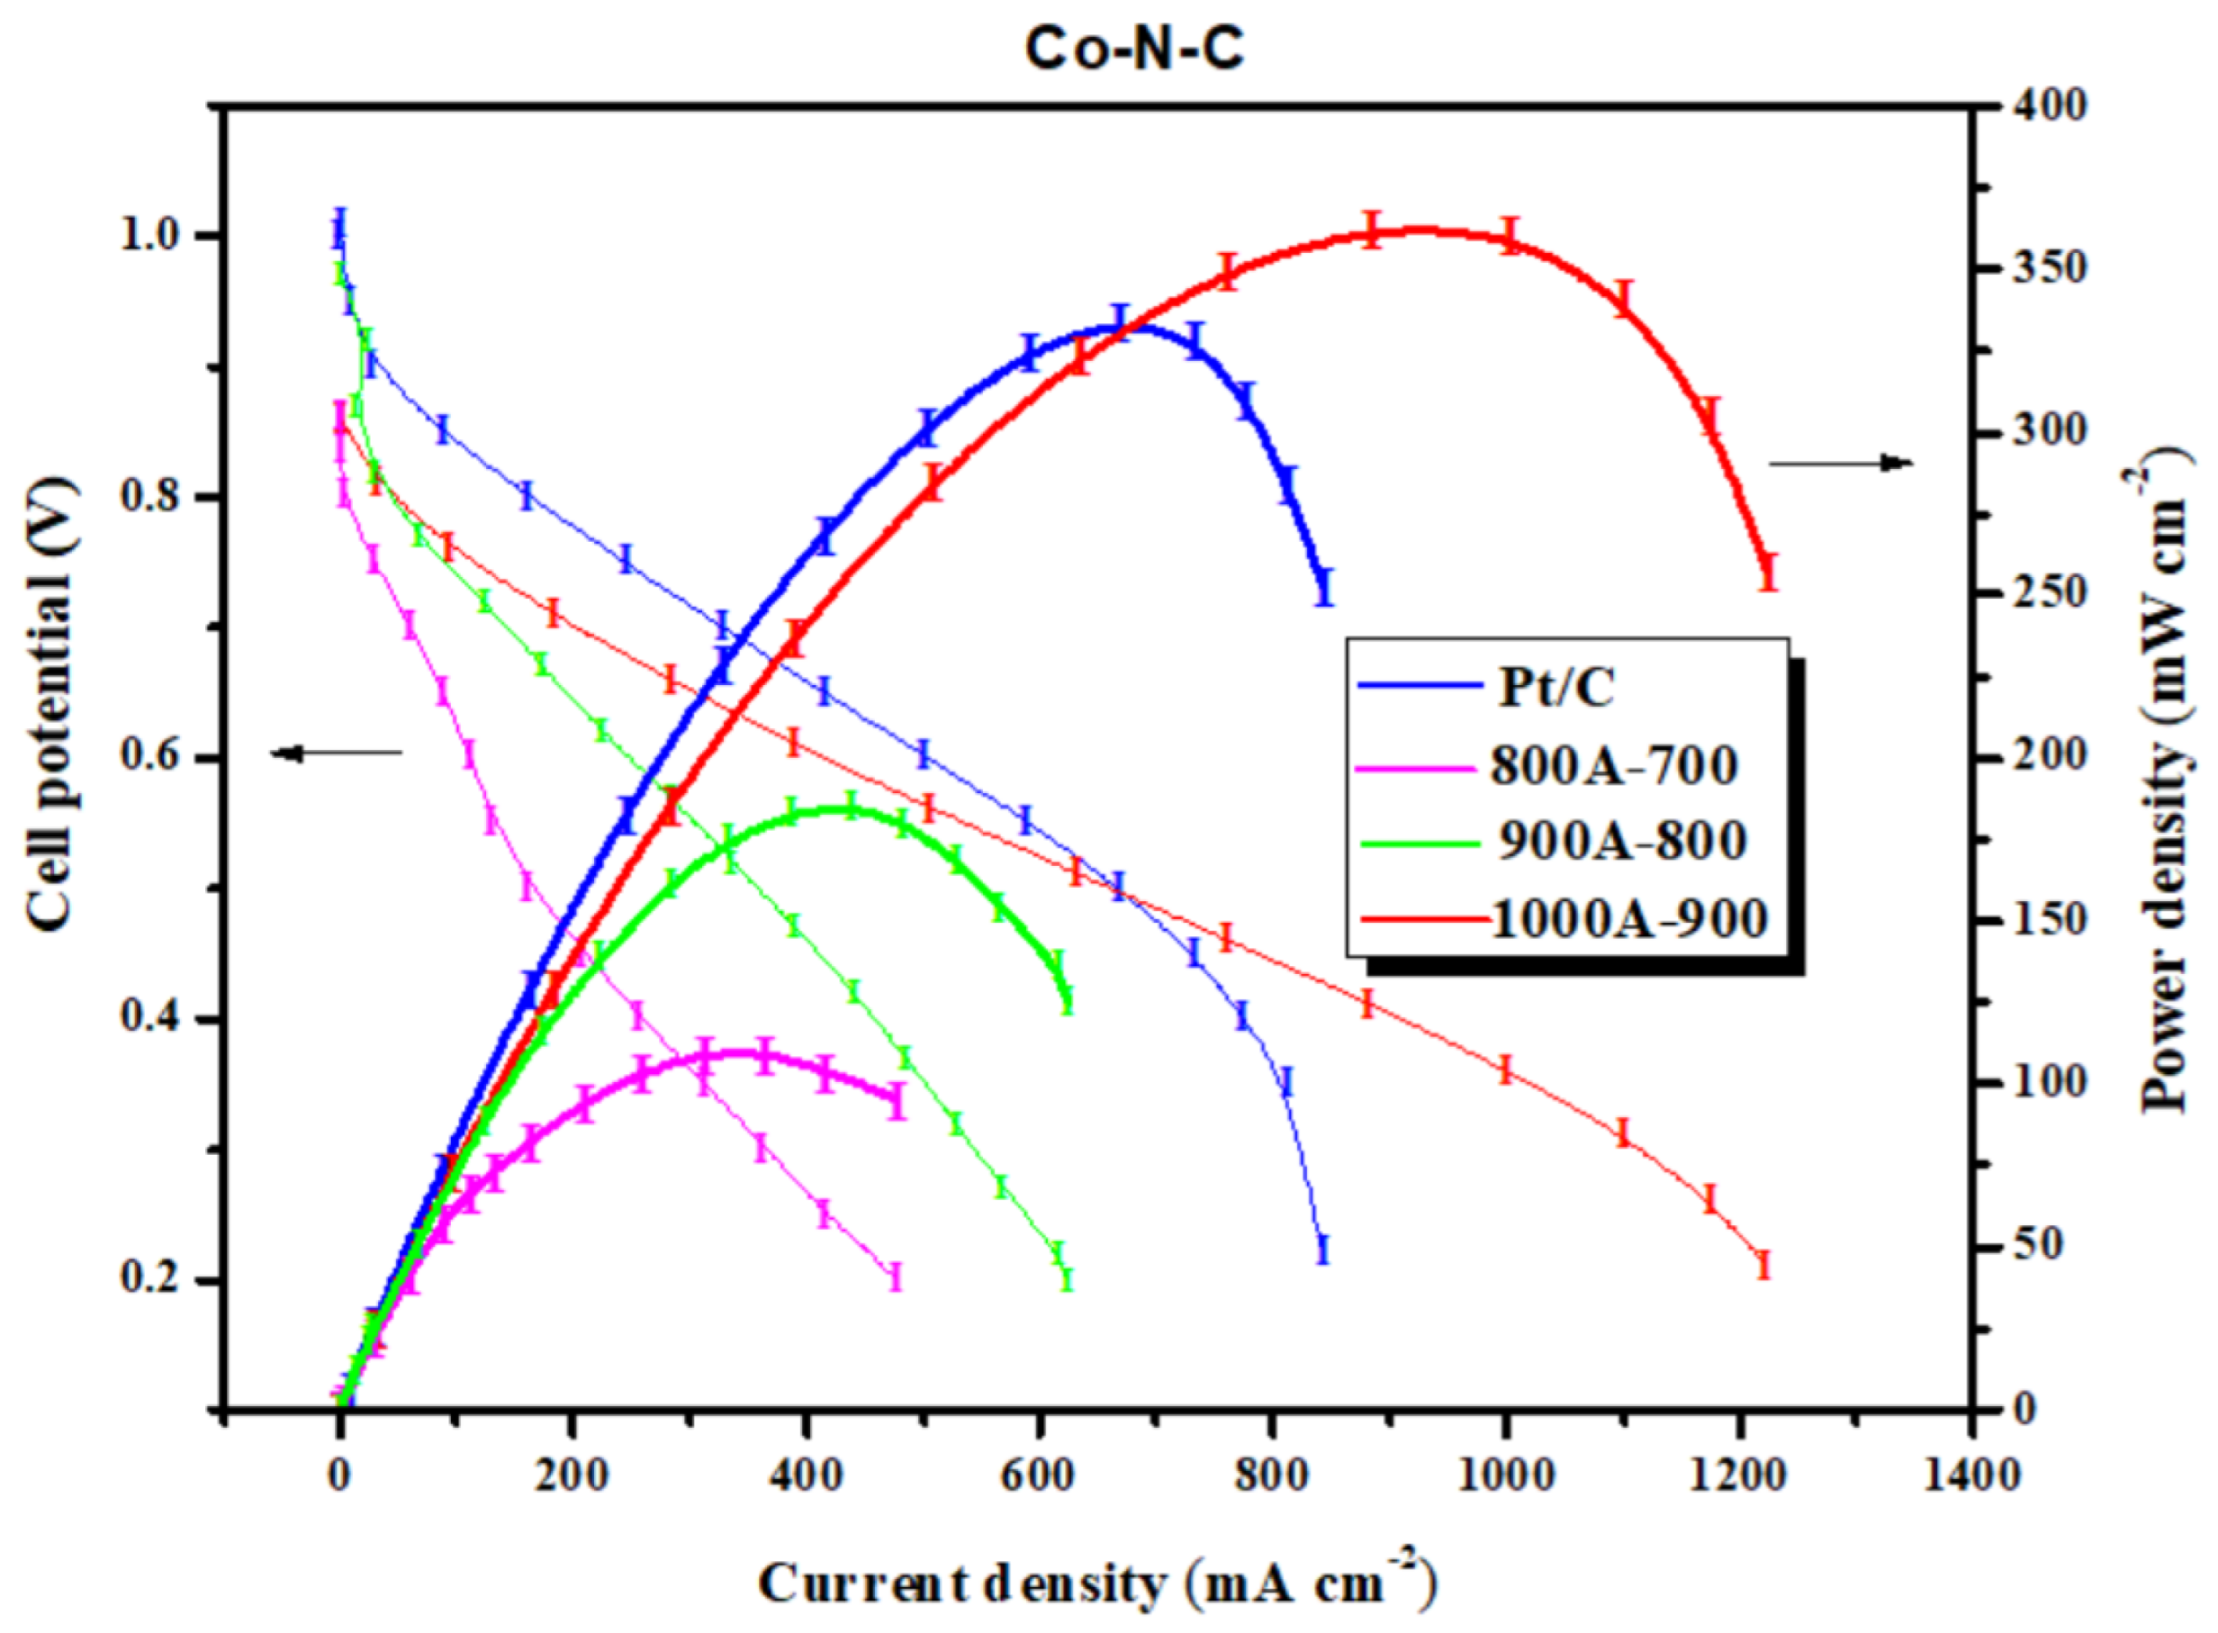
3.7.2. MEA and Single Cell Testing

The discussions in paragraph of CV and LSV measurements are focused on the electrochemical behaviors of the cathode catalyst itself. However, a cathode catalyst is only part of an MEA of a fuel cell, and there are boundaries present between the electrode and electrolyte created when it is assembled into an MEA. In other words, catalysts with better electrochemical properties do not mean higher power density when assembled into a fuel cell. Certainly, we still need these measurements to find out the possible candidate catalysts for preparing MEAs. Consequently, catalyst inks were prepared and coated on both sides of the AEM (ionomers) to become an MEA for single-cell testing.
MEAs with a Pt/C anode and Co-N-Cs as the cathode catalysts were assembled for single-cell testing. An MEA was prepared with both electrodes made of Pt/C for comparison.
The cell potential and power density of the single cell made of Co-N-C and Pt/C cathode catalysts are measured with the current density and demonstrated in Figure 10. Commonly, cells prepared with Co-N-C cathode catalysts do not demonstrate high open circuit voltage such as that prepared with Pt/C. However, the Pmax of the cells prepared with CoNC-900A-800 and -800A-700 are all over 100 mW cm−2, which are comparable to other AEMFC with the same Pt wt% (20 wt%) in the Pt/C anode [39]. Surprisingly, the single cell made CoNC-1000A-900 cathode catalyst which was proven to own SA of 583.58 m2 g−1 and Jred of 5.14 mA cm−2, is able to contribute a higher Pmax (361 mW cm−2) than that of Pt/C (333 mW cm−2), as shown in Figure 10 and Table 4. Additionally, its current density can be extended to be over 1200 mA cm−2 and that of Pt/C decay below 900 mA cm−2. It seems the two-stage calcination in different gases plus the acid-leach on the Co,N –co-dopes polyimine is able to build a network material with many CoN4 catalyst centers (most of the surface Co and CoO that are also able to catalyze ORR are already removed by strong acid-leaching). Each CoN4 center behaves like a single-cobalt-atom catalyst that can effectively catalyze ORR in the cathode following the 4eroute.
The performances of various non-precious metal catalysts are listed in Table 5. [15,16,39,40,41,42,43,44,45,46,47,48,49,50] Obviously, the Pmax values depend on the weights of the catalysts in both electrodes and types of anode catalysts as well. This work demonstrates high Pmax with only 20% Pt/C in the anode, compared to those using expensive Ru-Pt/C.

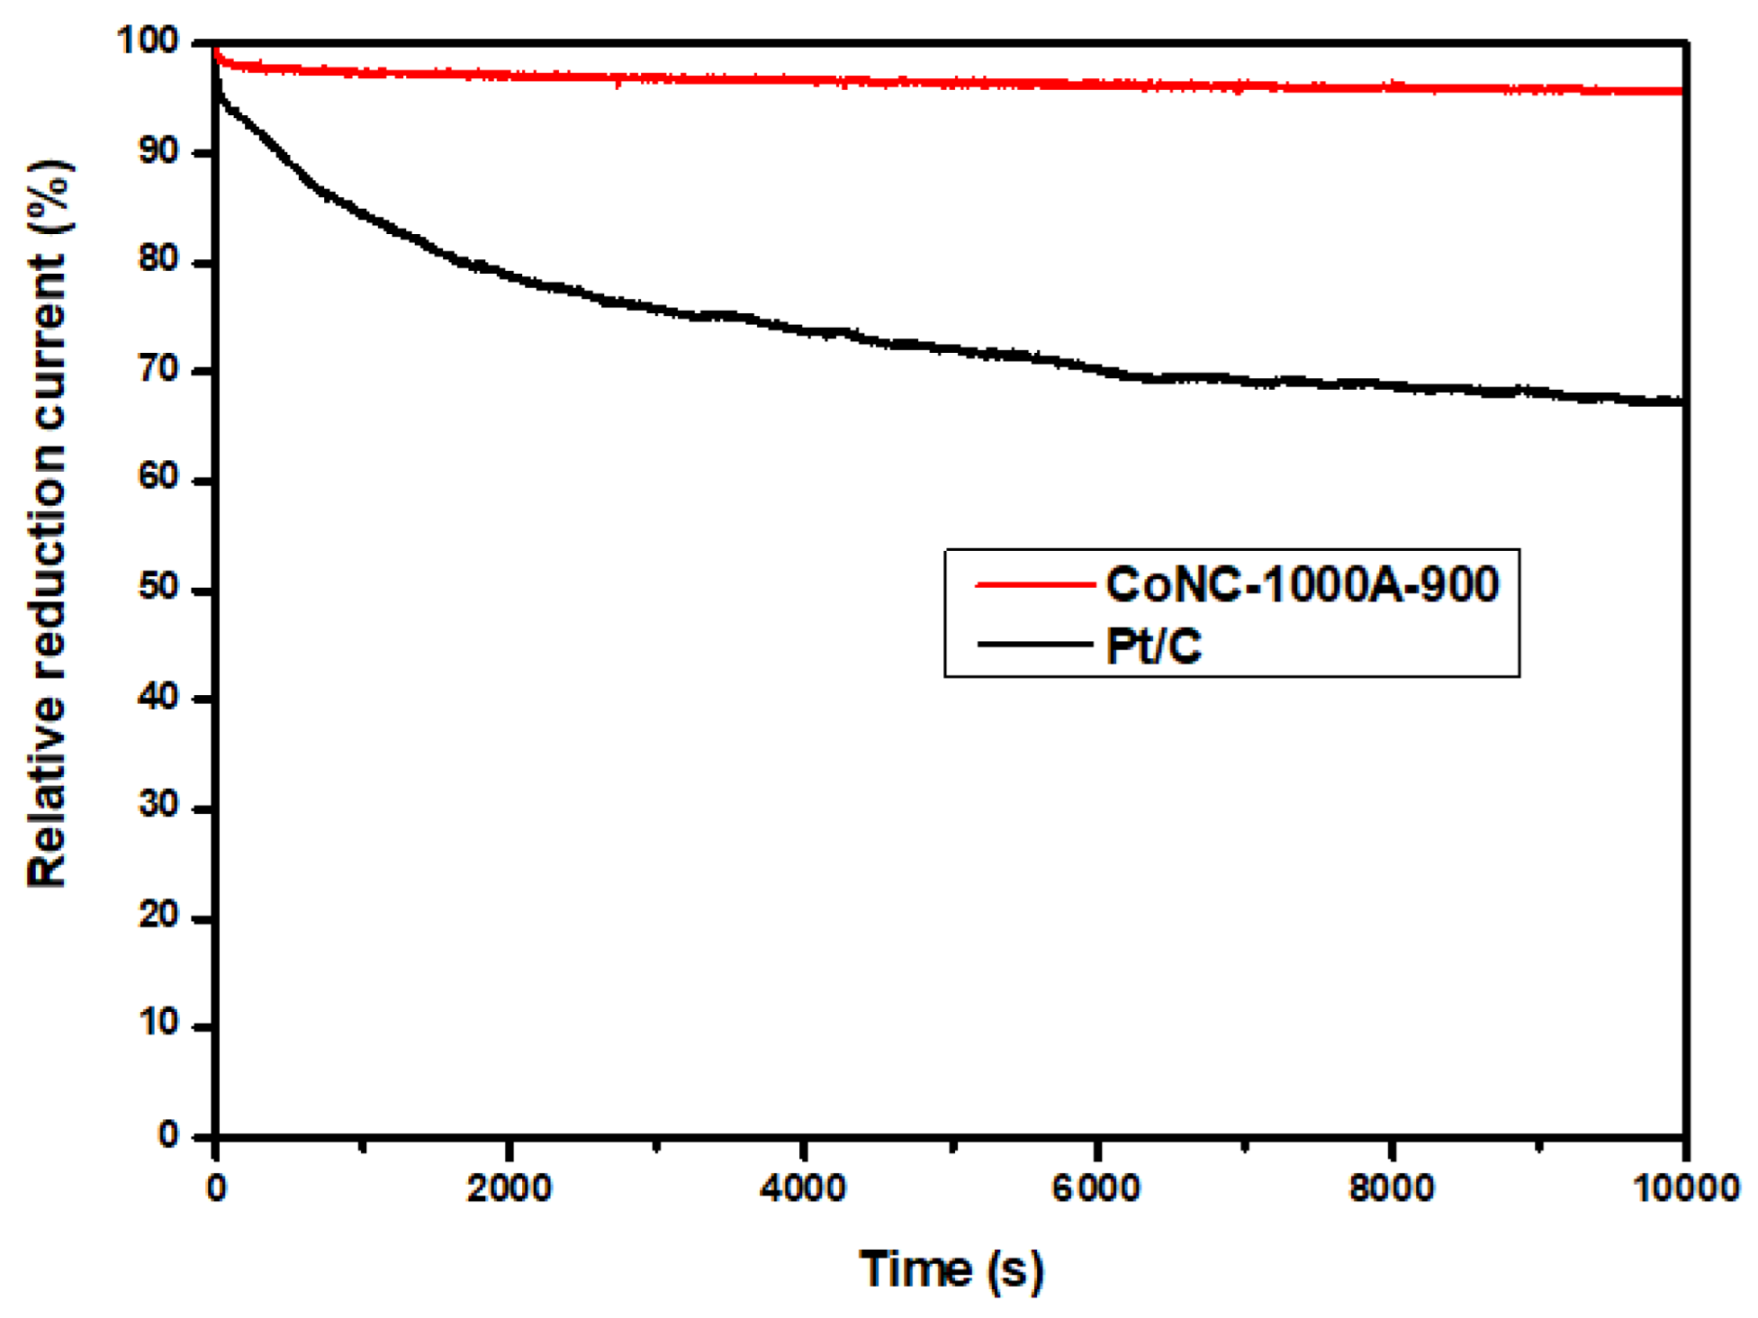
3.7.3. Durability and Stability Test of Cathode Catalyst

The durability and stability results demonstrated in Figure 11 were performed at the constant voltage of −0.2 V by measuring the decadence of reduction current with time at 1600 rpm. The initial reduction current was considered as 100%, and the relative current ratio was calculated by dividing with the initial current. The current decays to be 67.2% for Pt/C, while it decays only 4% for CoNC-1000A-900 (95.9%) after being treated with −0.2 V for 10,000 s as shown in Figure 11. The Co-N-C catalysts that experienced high-temperature calcination are believed to have higher durability and stability compared to Pt/C.

4. Conclusions

To chelate more Co ions, an additional nitrogen was introduced in the Co-N, co-doped polyimine (Co-PIM) by replacing aromatic diamine with diethylene triamine (DETA). The Co-N-C based cathode catalysts obtained from the calcination of Co-PIM exhibit remarkably high-surface area upon two-stage calcination with temperatures ranging from 700 to 1000 °C; more surface areas are created at higher temperatures. Many CoNx catalytic centers were found implanted on the Co-N-C catalyst surfaces in accordance with SEM and TEM images, which mainly contribute to the ORR in the cathode. For CoNC-100A-900, it demonstrated a comparable limited reduction current to that of commercial Pt/C. Its averaged number of electrons transferred during ORR approach the theoretical value of four, following 4eroute ORR with negligible hydrogen peroxide ions (HO2) formed in the cathode. The highly efficient ORR catalyzed by the Co-N-C cathode catalyst also renders the single cell prepared with CoNC-1000A-900 to generate a Pmax of 361 mW cm−2, higher than that of commercial Pt/C (284 mW cm−2). In the future, we are planning to use multi-amino amines to prepare Co, N-co-doped carbon catalysts to illustrate the exact roles that the amines play in the preparation of efficient Co, N-co-doped cathode catalysts of AEMFC.

Author Contributions

Conceptualization, K.-S.H.; funding acquisition, Y.-Z.W.; formal analysis, T.-H.H. All authors have read and agreed to the published version of the manuscript.

Funding

This research received funding from MOST 108-2221-E-992-037 and MOST 109-2221-E-992-083 through the Minister of Science and Technology, Taiwan, ROC.

Institutional Review Board Statement

Not applicable.

Informed Consent Statement

Not applicable.

Data Availability Statement

The data presented in this study are available upon request from the corresponding author.

Acknowledgments

Appreciation is expressed for the use of soft-matter TEM equipment belonging to the Core Facility Center, Micro/Nano Technology Division of National Cheng Kung University (NCKU), Ministry of Science and Technology, Taiwan, ROC.

Conflicts of Interest

The authors declare no conflict of interest.

References

  1. He, D.; Zeng, C.; Xu, C.; Cheng, N.; Li, H.; Mu, S.; Pan, M. Polyaniline-functionalized carbon nanotube supported platinum catalysts. Langmuir 2011, 27, 5582–5588. [Google Scholar] [CrossRef] [PubMed]
  2. Michel, M.; Ettingshausen, F.; Scheiba, F.; Wolz, A.; Roth, C. Using layer-by-layer assembly of polyaniline fibers in the fast preparation of high performance fuel cell nanostructured membrane electrodes. Phys. Chem. Chem. Phys. 2008, 10, 3796–3801. [Google Scholar] [CrossRef] [PubMed]
  3. Kinoshita, K. Carbon: Electrochemical and Physicochemical Properties; Wiley: New York, NY, USA, 1988; pp. 5–10. [Google Scholar]
  4. Kinoshita, K.; Bett, J.A.S. Potentiodynamic analysis of surface oxides on carbon blacks. Carbon 1973, 11, 403–411. [Google Scholar] [CrossRef]
  5. Yang, Z.; Wang, M.; Liu, G.; Chen, M.; Ye, F.; Zhang, W.; Yang, W.; Wang, X. Octahedral Pt-Ni nanoparticles prepared by pulse-like hydrothermal method for oxygen reduction reaction. Ionics 2019, 26, 293–300. [Google Scholar] [CrossRef]
  6. Wu, R.-H.; Tsai, M.-J.; Ho, K.-S.; Wei, T.-E.; Hsieh, T.-H.; Han, Y.-K.; Kuo, C.-W.; Tseng, P.-H.; Wang, Y.-Z. Sulfonated polyaniline nanofiber as Pt-catalyst conducting support for proton exchange membrane fuel cell. Polymer 2014, 55, 2035–2043. [Google Scholar] [CrossRef]
  7. Wang, Y.-Z.; Chang, K.-J.; Hung, L.-F.; Ho, K.-S.; Chen, J.-P.; Hsieh, T.-H.; Chao, L. Carboxylated carbonized polyaniline nanofibers as Pt-catalyst conducting support for proton exchange membrane fuel cell. Synth. Met. 2014, 188, 21–29. [Google Scholar] [CrossRef]
  8. Wang, Y.-Z.; Ko, T.-H.; Huang, W.-Y.; Hsieh, T.-H.; Ho, K.-S.; Chen, Y.-Y.; Hsieh, S.-J. Preparation of Pt-Catalyst by Poly (p-phenylenediamine) Nanocomposites Assisted by Microwave Radiation for Proton Exchange Membrane Fuel Cell. Polymer 2018, 10, 1388. [Google Scholar] [CrossRef] [Green Version]
  9. Tsai, M.-J.; Hsieh, T.-H.; Wang, Y.-Z.; Ho, K.-S.; Chang, C.-Y. Microwave Assisted Reduction of Pt-Catalyst by N-Phenyl-p-Phenylenediamine for Proton Exchange Membrane Fuel Cells. Polymer 2017, 9, 104. [Google Scholar] [CrossRef] [Green Version]
  10. Huang, W.-Y.; Chang, M.-Y.; Wang, Y.-Z.; Huang, Y.-C.; Ho, K.-S.; Hsieh, T.-H.; Kuo, Y.-C. Polyaniline Based Pt-Electrocatalyst for a Proton Exchanged Membrane Fuel Cell. Polymer 2020, 12, 617. [Google Scholar] [CrossRef] [Green Version]
  11. Bai, L.; Hsu, C.-S.; Alexander, D.T.L.; Chen, H.M.; Hu, X. A Cobalt–Iron Double-Atom Catalyst for the Oxygen Evolution Reaction. J. Am. Chem. Soc. 2019, 141, 14190–14199. [Google Scholar] [CrossRef]
  12. Liang, X.; Li, Z.; Xiao, H.; Zhang, T.; Xu, P.; Zhang, H.; Gao, Q.; Zheng, L. Two Types of Single-Atom FeN4 and FeN5 Electrocatalytic Active Centers on N-Doped Carbon Driving High Performance of the SA-Fe-NC Oxygen Reduction Reaction Catalyst. Chem. Mater. 2021, 33, 5542–5555. [Google Scholar] [CrossRef]
  13. Lei, H.-Y.; Piao, J.-H.; Brouzgou, A.; Gorbova, E.; Tsiakaras, P.; Liang, Z.-X. Synthesis of nitrogen-doped mesoporous carbon nanosheets for oxygen reduction electrocatalytic activity enhancement in acid and alkaline media. Int. J. Hydrogen Energy 2019, 44, 4423–4431. [Google Scholar] [CrossRef]
  14. Wang, Y.; Yang, Y.; Jia, S.; Wang, X.; Lyu, K.; Peng, Y.; Zheng, H.; Wei, X.; Ren, H.; Xiao, L.; et al. Synergistic Mn-Co catalyst outperforms Pt on high-rate oxygen reduction for alkaline polymer electrolyte fuel cells. Nat. Commun. 2019, 10, 1506. [Google Scholar] [CrossRef] [PubMed] [Green Version]
  15. Cheng, Y.W.; Hsieh, T.H.; Huang, Y.C.; Tseng, P.H.; Wang, Y.Z.; Ho, K.S.; Huang, Y.J. Calcined Co(II)-Chelated Polyazomethine as Cathode Catalyst of Anion Exchange Membrane Fuel Cells. Polymer 2022, 14, 1784. [Google Scholar] [CrossRef]
  16. Hsieh, T.H.; Chen, S.N.; Wang, Y.Z.; Ho, K.S.; Chuang, J.K.; Ho, L.C. Cobalt-Doped Carbon Nitride Frameworks Obtained from Calcined Aromatic Polyimines as Cathode Catalyst of Anion Exchange Membrane Fuel Cells. Membranes 2022, 12, 74. [Google Scholar] [CrossRef]
  17. Cheng, Y.W.; Huang, W.Y.; Ho, K.S.; Hsieh, T.H.; Jheng, L.C.; Kuo, Y.M. Fe, N-Doped Metal Organic Framework Prepared by the Calcination of Iron Chelated Polyimines as the Cathode-Catalyst of Proton Exchange Membrane Fuel Cells. Polymer 2021, 13, 3850. [Google Scholar] [CrossRef]
  18. Huang, W.Y.; Jheng, L.C.; Hsieh, T.H.; Ho, K.S.; Wang, Y.Z.; Gao, Y.J.; Tseng, P.H. Calcined Co(II)-Triethylenetetramine, Co(II)- Polyaniline-Thiourea as the Cathode Catalyst of Proton Exchanged Membrane Fuel Cell. Polymer 2020, 12, 3070. [Google Scholar] [CrossRef]
  19. Zhang, H.-J.; Zhang, X.; Li, H.; Zhang, W.; Ma, Z.-F.; Yang, J. Improve the electrocatalytic performance of non-precious metal CoDETA/C catalyst for oxygen reduction reaction by post-treatment. Int. J. Hydrogen Energy 2017, 42, 14115–14123. [Google Scholar] [CrossRef]
  20. Zhang, H.-J.; Li, H.; Li, X.; Qiu, H.; Yuan, X.; Zhao, B.; Ma, Z.-F.; Yang, J. Pyrolyzing cobalt diethylenetriamine chelate on carbon (CoDETA/C) as a family of non-precious metal oxygen reduction catalyst. Int. J. Hydrogen Energy 2014, 39, 267–276. [Google Scholar] [CrossRef]
  21. Huh, Y.; Green, M.L.H.; Kim, Y.H.; Lee, J.Y.; Lee, C.J. Control of carbon nanotube growth using cobalt nanoparticles as catalyst. Appl. Surf. Sci. 2005, 249, 145–150. [Google Scholar] [CrossRef]
  22. Zhang, Y.B.; Lau, S.P.; Li, H.F. Field emission from nanoforest carbon nanotubes grown on cobalt-containing amorphous carbon composite films. J. Appl. Phys. 2007, 101, 033524. [Google Scholar] [CrossRef]
  23. Wang, Y.; Qiu, L.; Zhang, L.; Tang, D.-M.; Ma, R.; Wang, Y.; Zhang, B.; Ding, F.; Liu, C.; Cheng, H.-M. Precise Identification of the Active Phase of Cobalt Catalyst for Carbon Nanotube Growth by In Situ Transmission Electron Microscopy. ACS Nano 2020, 14, 16823–16831. [Google Scholar] [CrossRef] [PubMed]
  24. Lin, M.; Tan, J.P.Y.; Boothroyd, C.; Loh, K.P.; Tok, E.S.; Foo, Y.-L. Dynamical Observation of Bamboo-like Carbon Nanotube Growth. Nano Lett. 2007, 7, 2234–2238. [Google Scholar] [CrossRef] [PubMed]
  25. Wang, A.; Li, J.; Zhang, T. Heterogeneous single-atom catalysis. Nat. Rev. Chem. 2018, 2, 65–81. [Google Scholar] [CrossRef]
  26. Zhang, L.; Ren, Y.; Liu, W.; Wang, A.; Zhang, T. Single-atom catalyst: A rising star for green synthesis of fine chemicals. Natl. Sci. Rev. 2018, 5, 653–672. [Google Scholar] [CrossRef] [Green Version]
  27. Cheng, N.; Zhang, L.; Doyle-Davis, K.; Sun, X. Single-Atom Catalysts: From Design to Application. Electrochem. Energy Rev. 2019, 2, 539–573. [Google Scholar] [CrossRef] [Green Version]
  28. Cui, L.; Cui, L.; Li, Z.; Zhang, J.; Wang, H.; Lu, S.; Xiang, Y. A copper single-atom catalyst towards efficient and durable oxygen reduction for fuel cells. J. Mater. Chem. A 2019, 7, 16690–16695. [Google Scholar] [CrossRef]
  29. Peng, X.; Omasta, T.J.; Magliocca, E.; Wang, L.G.; Varcoe, J.R.; Mustain, W.E. Nitrogen-doped Carbon–CoOx Nanohybrids: A Precious Metal Free Cathode that Exceeds 1.0 W cm−2 Peak Power and 100 h Life in Anion-Exchange Membrane Fuel Cells. Angew. Chem. 2019, 58, 1046–1051. [Google Scholar] [CrossRef] [Green Version]
  30. Yang, H.; Li, Z.; Kou, S.; Lu, G.; Liu, Z. A complex-sequestered strategy to fabricate Fe single-atom catalyst for efficient oxygen reduction in a broad pH-range. Appl. Catal. B Environ. 2020, 278, 119270. [Google Scholar] [CrossRef]
  31. Kaiser, S.K.; Chen, Z.; Akl, D.F.; Mitchell, S.; Perez-Ramirez, J. Single-Atom Catalysts across the Periodic Table. Chem. Rev. 2020, 120, 11703–11809. [Google Scholar] [CrossRef]
  32. Han, J.; Bian, J.; Sun, C. Recent Advances in Single-Atom Electrocatalysts for Oxygen Reduction Reaction. Research 2020, 2020, 9512763. [Google Scholar] [CrossRef] [PubMed]
  33. Zhong, L.; Li, S. Unconventional Oxygen Reduction Reaction Mechanism and Scaling Relation on Single-Atom Catalysts. ACS Catal. 2020, 10, 4313–4318. [Google Scholar] [CrossRef]
  34. Zhao, C.X.; Li, B.Q.; Liu, J.N.; Zhang, Q. Intrinsic Electrocatalytic Activity Regulation of M–N–C Single-Atom Catalysts for the Oxygen Reduction Reaction. Angew. Chem. Int. Ed. 2021, 60, 4448–4463. [Google Scholar] [CrossRef]
  35. Guo, J.; Li, B.; Zhang, Q.; Liu, Q.; Wang, Z.; Zhao, Y.; Shui, J.; Xiang, Z. Highly Accessible Atomically Dispersed Fe-N x Sites Electrocatalyst for Proton-Exchange Membrane Fuel Cell. Adv. Sci. 2021, 8, 2002249. [Google Scholar] [CrossRef]
  36. Zhang, A.; Zhou, M.; Liu, S.; Chai, M.; Jiang, S. Synthesis of Single-Atom Catalysts Through Top-Down Atomization Approaches. Front. Catal. 2021, 1, 11. [Google Scholar] [CrossRef]
  37. Logeshwaran, N.; Panneerselvam, I.R.; Ramakrishnan, S.; Kumar, R.S.; Kim, A.R.; Wang, Y.; Yoo, D.J. Quasihexagonal Platinum Nanodendrites Decorated over CoS2-N-Doped Reduced Graphene Oxide for Electro-Oxidation of C1-, C2-, and C3-Type Alcohols. Adv. Sci. 2022, 9, 2105344. [Google Scholar] [CrossRef]
  38. Logeshwaran, N.; Ramakrishnan, S.; Chandrasekaran, S.S.; Vinothkannan, M.; Kim, A.R.; Sengodan, S.; Velusamy, D.B.; Varadhan, P.; He, J.-H.; Yoo, D.J. An efficient and durable trifunctional electrocatalyst for zinc–air batteries driven overall water splitting. Appl. Catal. B Environ. 2021, 297, 120405. [Google Scholar] [CrossRef]
  39. Kisand, K.; Sarapuu, A.; Danilian, D.; Kikas, A.; Kisand, V.; Rahn, M.; Treshchalov, A.; Kaarik, M.; Merisalu, M.; Paiste, P.; et al. Transition metal-containing nitrogen-doped nanocarbon catalysts derived from 5-methylresorcinol for anion exchange membrane fuel cell application. J. Colloid Interface Sci. 2021, 584, 263–274. [Google Scholar] [CrossRef]
  40. Lilloja, J.; Kibena-Poldsepp, E.; Sarapuu, A.; Kikas, A.; Kisand, V.; Kaarik, M.; Merisalu, M.; Treshchalov, A.; Leis, J.; Sammelselg, V.; et al. Nitrogen-doped carbide-derived carbon/carbon nanotube composites as cathode catalysts for anion exchange membrane fuel cell application. Appl. Catal. B-Environ. 2020, 272, 119012. [Google Scholar] [CrossRef]
  41. Zhang, J.F.; Zhu, W.K.; Pei, Y.B.; Liu, Y.; Qin, Y.Z.; Zhang, X.W.; Wang, Q.F.; Yin, Y.; Guiver, M.D. Hierarchically Porous Co-N-C Cathode Catalyst Layers for Anion Exchange Membrane Fuel Cells. Chemsuschem 2019, 12, 4165–4169. [Google Scholar] [CrossRef]
  42. Truong, V.M.; Yang, M.K.; Yang, H. Functionalized Carbon Black Supported Silver (Ag/C) Catalysts in Cathode Electrode for Alkaline Anion Exchange Membrane Fuel Cells. Int. J. Precis. Eng. Manuf.-Green Technol. 2019, 6, 711–721. [Google Scholar] [CrossRef]
  43. Zhang, J.F.; Pei, Y.B.; Zhu, W.K.; Liu, Y.; Yin, Y.; Qin, Y.Z.; Guiver, M.D. Ionomer dispersion solvent influence on the microstructure of Co-N-C catalyst layers for anion exchange membrane fuel cell. J. Power Sources 2021, 484, 229259. [Google Scholar] [CrossRef]
  44. Peng, X.; Kashyap, V.; Ng, B.; Kurungot, S.; Wang, L.Q.; Varcoe, J.R.; Mustain, W.E. High-Performing PGM-Free AEMFC Cathodes from Carbon-Supported Cobalt Ferrite Nanoparticles. Catalysts 2019, 9, 264. [Google Scholar] [CrossRef] [Green Version]
  45. Lilloja, J.; Kibena-Poldsepp, E.; Sarapuu, A.; Kodali, M.; Chen, Y.C.; Asset, T.; Kaarik, M.; Merisalu, M.; Paiste, P.; Aruvali, J.; et al. Cathode Catalysts Based on Cobalt- and Nitrogen-Doped Nanocarbon Composites for Anion Exchange Membrane Fuel Cells. ACS Appl. Energy Mater. 2020, 3, 5375–5384. [Google Scholar] [CrossRef]
  46. Sibul, R.; Kibena-Poldsepp, E.; Ratso, S.; Kook, M.; Sougrati, M.T.; Kaarik, M.; Merisalu, M.; Aruvali, J.; Paiste, P.; Treshchalov, A.; et al. Iron- and Nitrogen-Doped Graphene-Based Catalysts for Fuel Cell Applications. Chemelectrochem 2020, 7, 1739–1747. [Google Scholar] [CrossRef]
  47. Piana, M.; Boccia, M.; Filpi, A.; Flammia, E.; Miller, H.A.; Orsini, M.; Salusti, F.; Santiccioli, S.; Ciardelli, F.; Pucci, A. H-2/air alkaline membrane fuel cell performance and durability, using novel ionomer and non-platinum group metal cathode catalyst. J. Power Sources 2010, 195, 5875–5881. [Google Scholar] [CrossRef]
  48. Li, X.G.; Popov, B.N.; Kawahara, T.; Yanagi, H. Non-precious metal catalysts synthesized from precursors of carbon, nitrogen, and transition metal for oxygen reduction in alkaline fuel cells. J. Power Sources 2011, 196, 1717–1722. [Google Scholar] [CrossRef]
  49. Wang, C.H.; Yang, C.W.; Lin, Y.C.; Chang, S.T.; Chang, S.L.Y. Cobalt-iron(II,III) oxide hybrid catalysis with enhanced catalytic activities for oxygen reduction in anion exchange membrane fuel cell. J. Power Sources 2015, 277, 147–154. [Google Scholar] [CrossRef]
  50. Palaniselvam, T.; Kashyap, V.; Bhange, S.N.; Baek, J.B.; Kurungot, S. Nanoporous Graphene Enriched with Fe/Co-N Active Sites as a Promising Oxygen Reduction Electrocatalyst for Anion Exchange Membrane Fuel Cells. Adv. Funct. Mater. 2016, 26, 2150–2162. [Google Scholar] [CrossRef]
Figure 1. FTIR-spectra of DETA, TPAl, and co-polyimine.
Membranes 12 00699 g001
Scheme 1. Schematic diagram of preparation of Co-PIM and Co-N-C.
Membranes 12 00699 sch001
Figure 2. X-ray diffraction patterns of various Co-N-Cs treated with (a) one-stage (b) two-stage calcinations.
Membranes 12 00699 g002
Figure 3. Raman spectra of various Co-N-C catalysts treated with two-stage calcinations.
Membranes 12 00699 g003
Figure 4. SEM and TEM micrographs of various CoNCs treated with two-stage calcinations, respectively, (a,b) of 800A-700; (c,d) of 900A-800; (e,f,g) of 1000A-900.
Membranes 12 00699 g004
Figure 5. HRTEM micrographs and electron diffraction patterns of CoNC-1000A-900. (a,b,d): images of CoNC-1000A-900. (c,e) electron diffraction patterns of CoNC-1000A-900.
Membranes 12 00699 g005
Figure 6. EDS mappings of Co, N, C, and O elements of (a) CoNC-800A-700, (b) CoNC-900A-800, and (c) CoNC-1000A-900.
Membranes 12 00699 g006
Figure 7. (a) BET isothermal adsorption and desorption curves; (b) pore volume vs. size of Co-N-Cs treated with different two-stage calcinations.
Membranes 12 00699 g007
Scheme 2. ORR mechanism catalyzed by Co-N-C cathode catalysts following (a) 4e and (b) 2eroute.
Membranes 12 00699 sch002
Figure 8. (a) CV-curves; (b) LSV curves obtained at various rpms; (c) K–L lines; (d) n-value vs. voltage of CoNC-1000A-900.
Membranes 12 00699 g008
Figure 9. (a) LSV curves of Co-N-Cs treated with two-stage calcinations and Pt/C catalysts; (b) Tafel curves obtained from Jk of LSV curves.
Membranes 12 00699 g009
Figure 10. Power density and potential vs. current density of various single cells with Co-N-Cs and Pt/C as cathode catalysts.
Membranes 12 00699 g010
Figure 11. Durability test of CoNC-1000A-900 and Pt/C catalysts.
Membranes 12 00699 g011
Table 1. Assignments of main functional groups of DETA, TPAl, and Co-PIM.
Functional GroupsAssigned Wave Numbers (cm−1)
-NH- & -NH2-  stretch3424, 3363
-CH2-CH2-        stretch2987, 2903
-C=O                  stretch1701
-C=N-                 stretch1640
-CH2-CH2-          bending1523
para-sub. benzene ring817
Table 2. Atomic ratios (%) of various Co-N-C catalysts, as determined from EDS spectra.
CoNC-CatalystsCNOCo
1000A-90092.21%4.59%3.57%0.64%
900A-80092.36%4.52%2.84%0.27%
800A-70084.73%8.74%5.95%0.84%
Table 3. Various surface areas (SA) and volumes (V) of Co-N-C catalysts.
Co-N-CsBET SA (m2/g)SAmicro (m2/g)SAext (m2/g)Vmicro (cm3)Vext (cm3)Vtot (cm3)
1000A-900583.5865.76517.820.241.922.18
900A-800452.5836.42416.160.101.121.27
800A-700417.4241.53375.890.111.001.11
Table 4. Comparison of various electrochemical properties of Co-N-C catalysts.
Co-N-C CatalystsJred a
(mAcm−2)
Vonset a
(V)
V1/2 a
(V)
Tafel Slope b
(mVdec−1)
Pmax c
(mWcm−2)
1000A-9005.141.350.7776.9361
900A-8004.651.260.7878.2184
800A-7003.891.250.7288.3109
700A-6003.751.190.7393.6-
Pt/C5.271.430.8078.9284
a: obtained from LSV curves in Figure 9a. b: obtained from curves in Figure 9b. c: obtained from curves in Figure 10.
Table 5. Performance of various non-precious metal cathode catalysts of AEMFC.
Cathode CatalystCathode Loading (mg/cm2)Anode CatalystPower Density (mW/cm2)Ref.
Co-N-C (PIM)0.820 wt% Pt/C361This work
Pt/C0.820 wt% Pt/C284This work
Co-N-C (aromatic PIM)0.820 wt% Pt/C275[15]
Co-N-C (aromatic PIM)0.820 wt% Pt/C374[16]
FeCoNC-at2Pt-Ru/C(wt% 50:25:25)415[39]
Co-N-CDC/CNT0.4Pt-Ru/C
(wt% 50/25/25)
577[40]
ZIF-CB-7000.460 wt% Pt/C122[41]
Ag/C0.840 wt% Pt/C,207[42]
Co–N–C0.460% Pt/C181[43]
CoFe2O4 on Vulcan XC-722.4Pt-Ru670[44]
N-doped CDC/
CNT
0.440 wt% Pt/C310[45]
Fe-N-Graphene0.6Pt-Ru/C243[46]
HypermecTM 4020
(FeCo-based)
0.840% Pt/C,
0.45 mgPt cm2
205[47]
CoFeN/C0.446% Pt/C177[48]
Co-Fe3O4/C0.8Pt/C114[49]
Fe/Co-NpGr2.540 wt% Pt/C,
0.80 mgPt cm2
35[50]
Publisher’s Note: MDPI stays neutral with regard to jurisdictional claims in published maps and institutional affiliations.

