
Biopolymer-Based Mixed Matrix Membranes (MMMs) for CO2/CH4 Separation: Experimental and Modeling Evaluation


Abstract
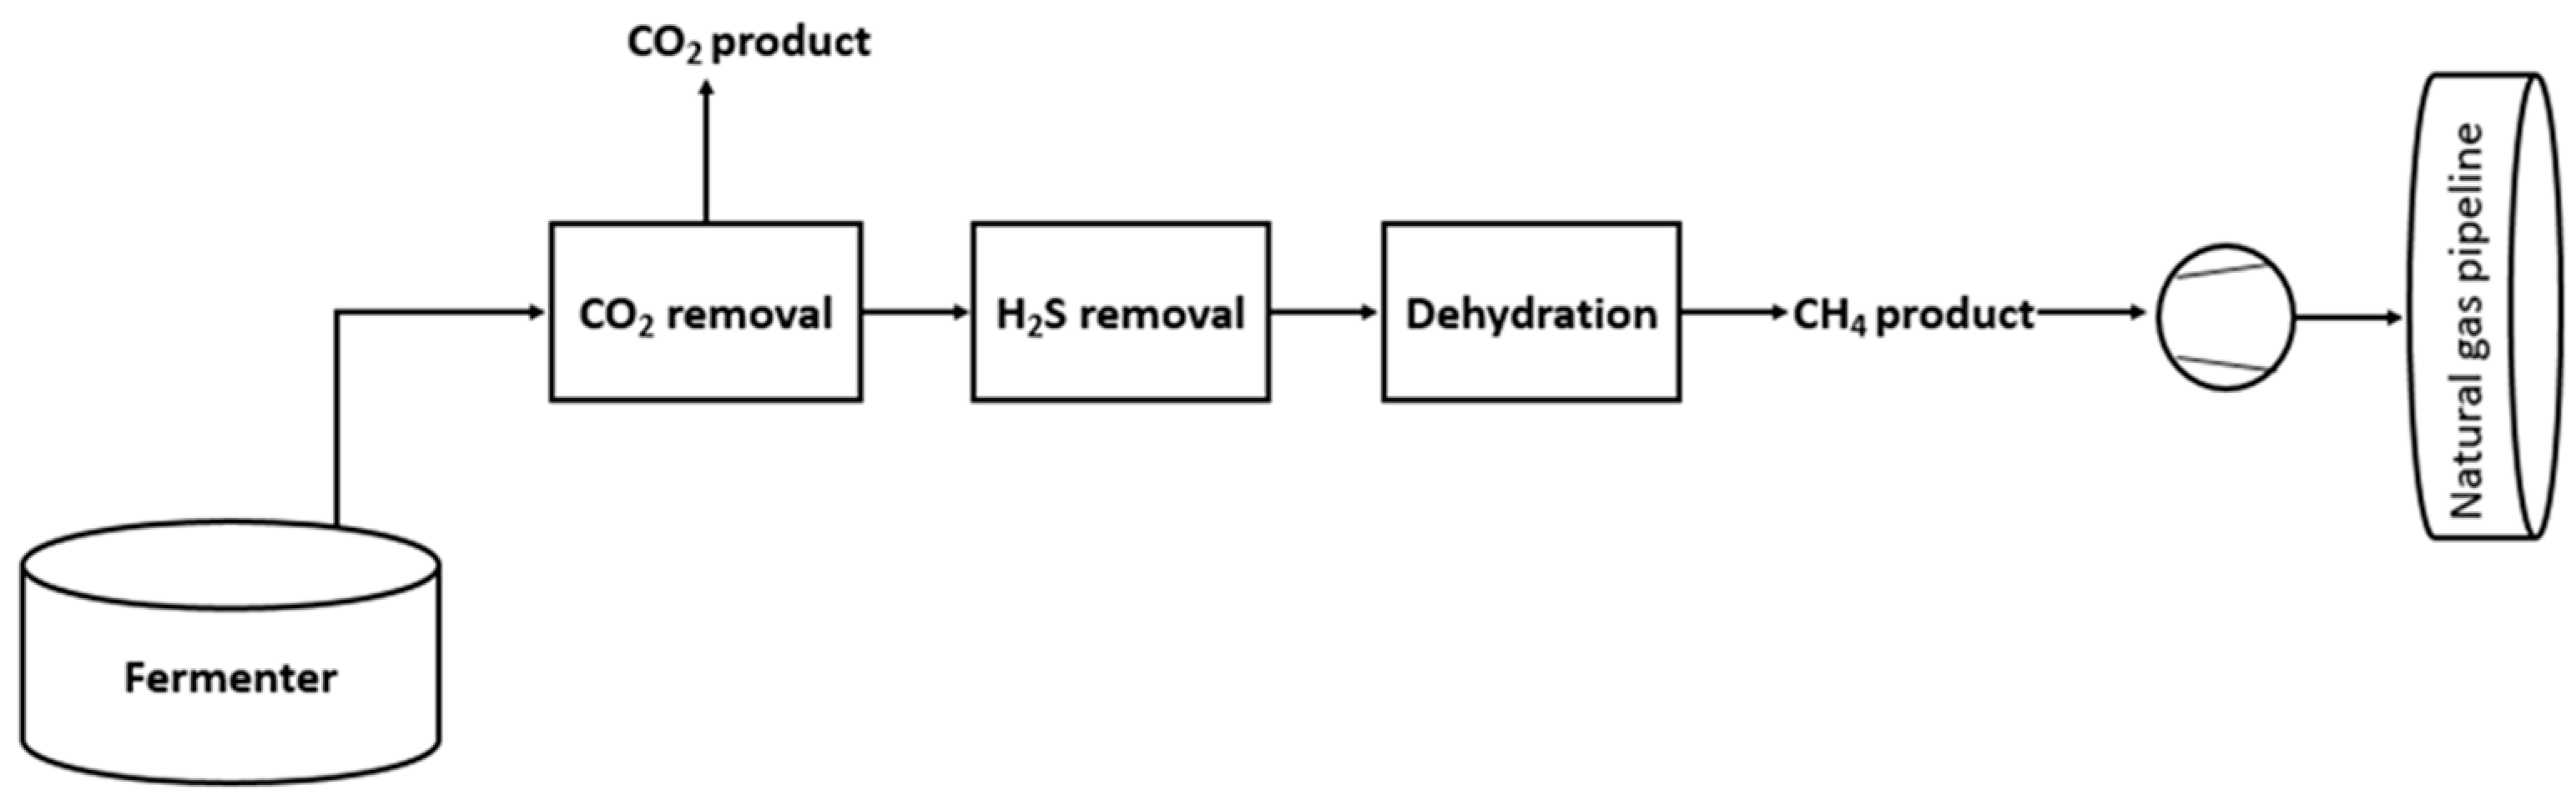
:1. Introduction
2. Materials and Methods
2.1. Membrane Preparation
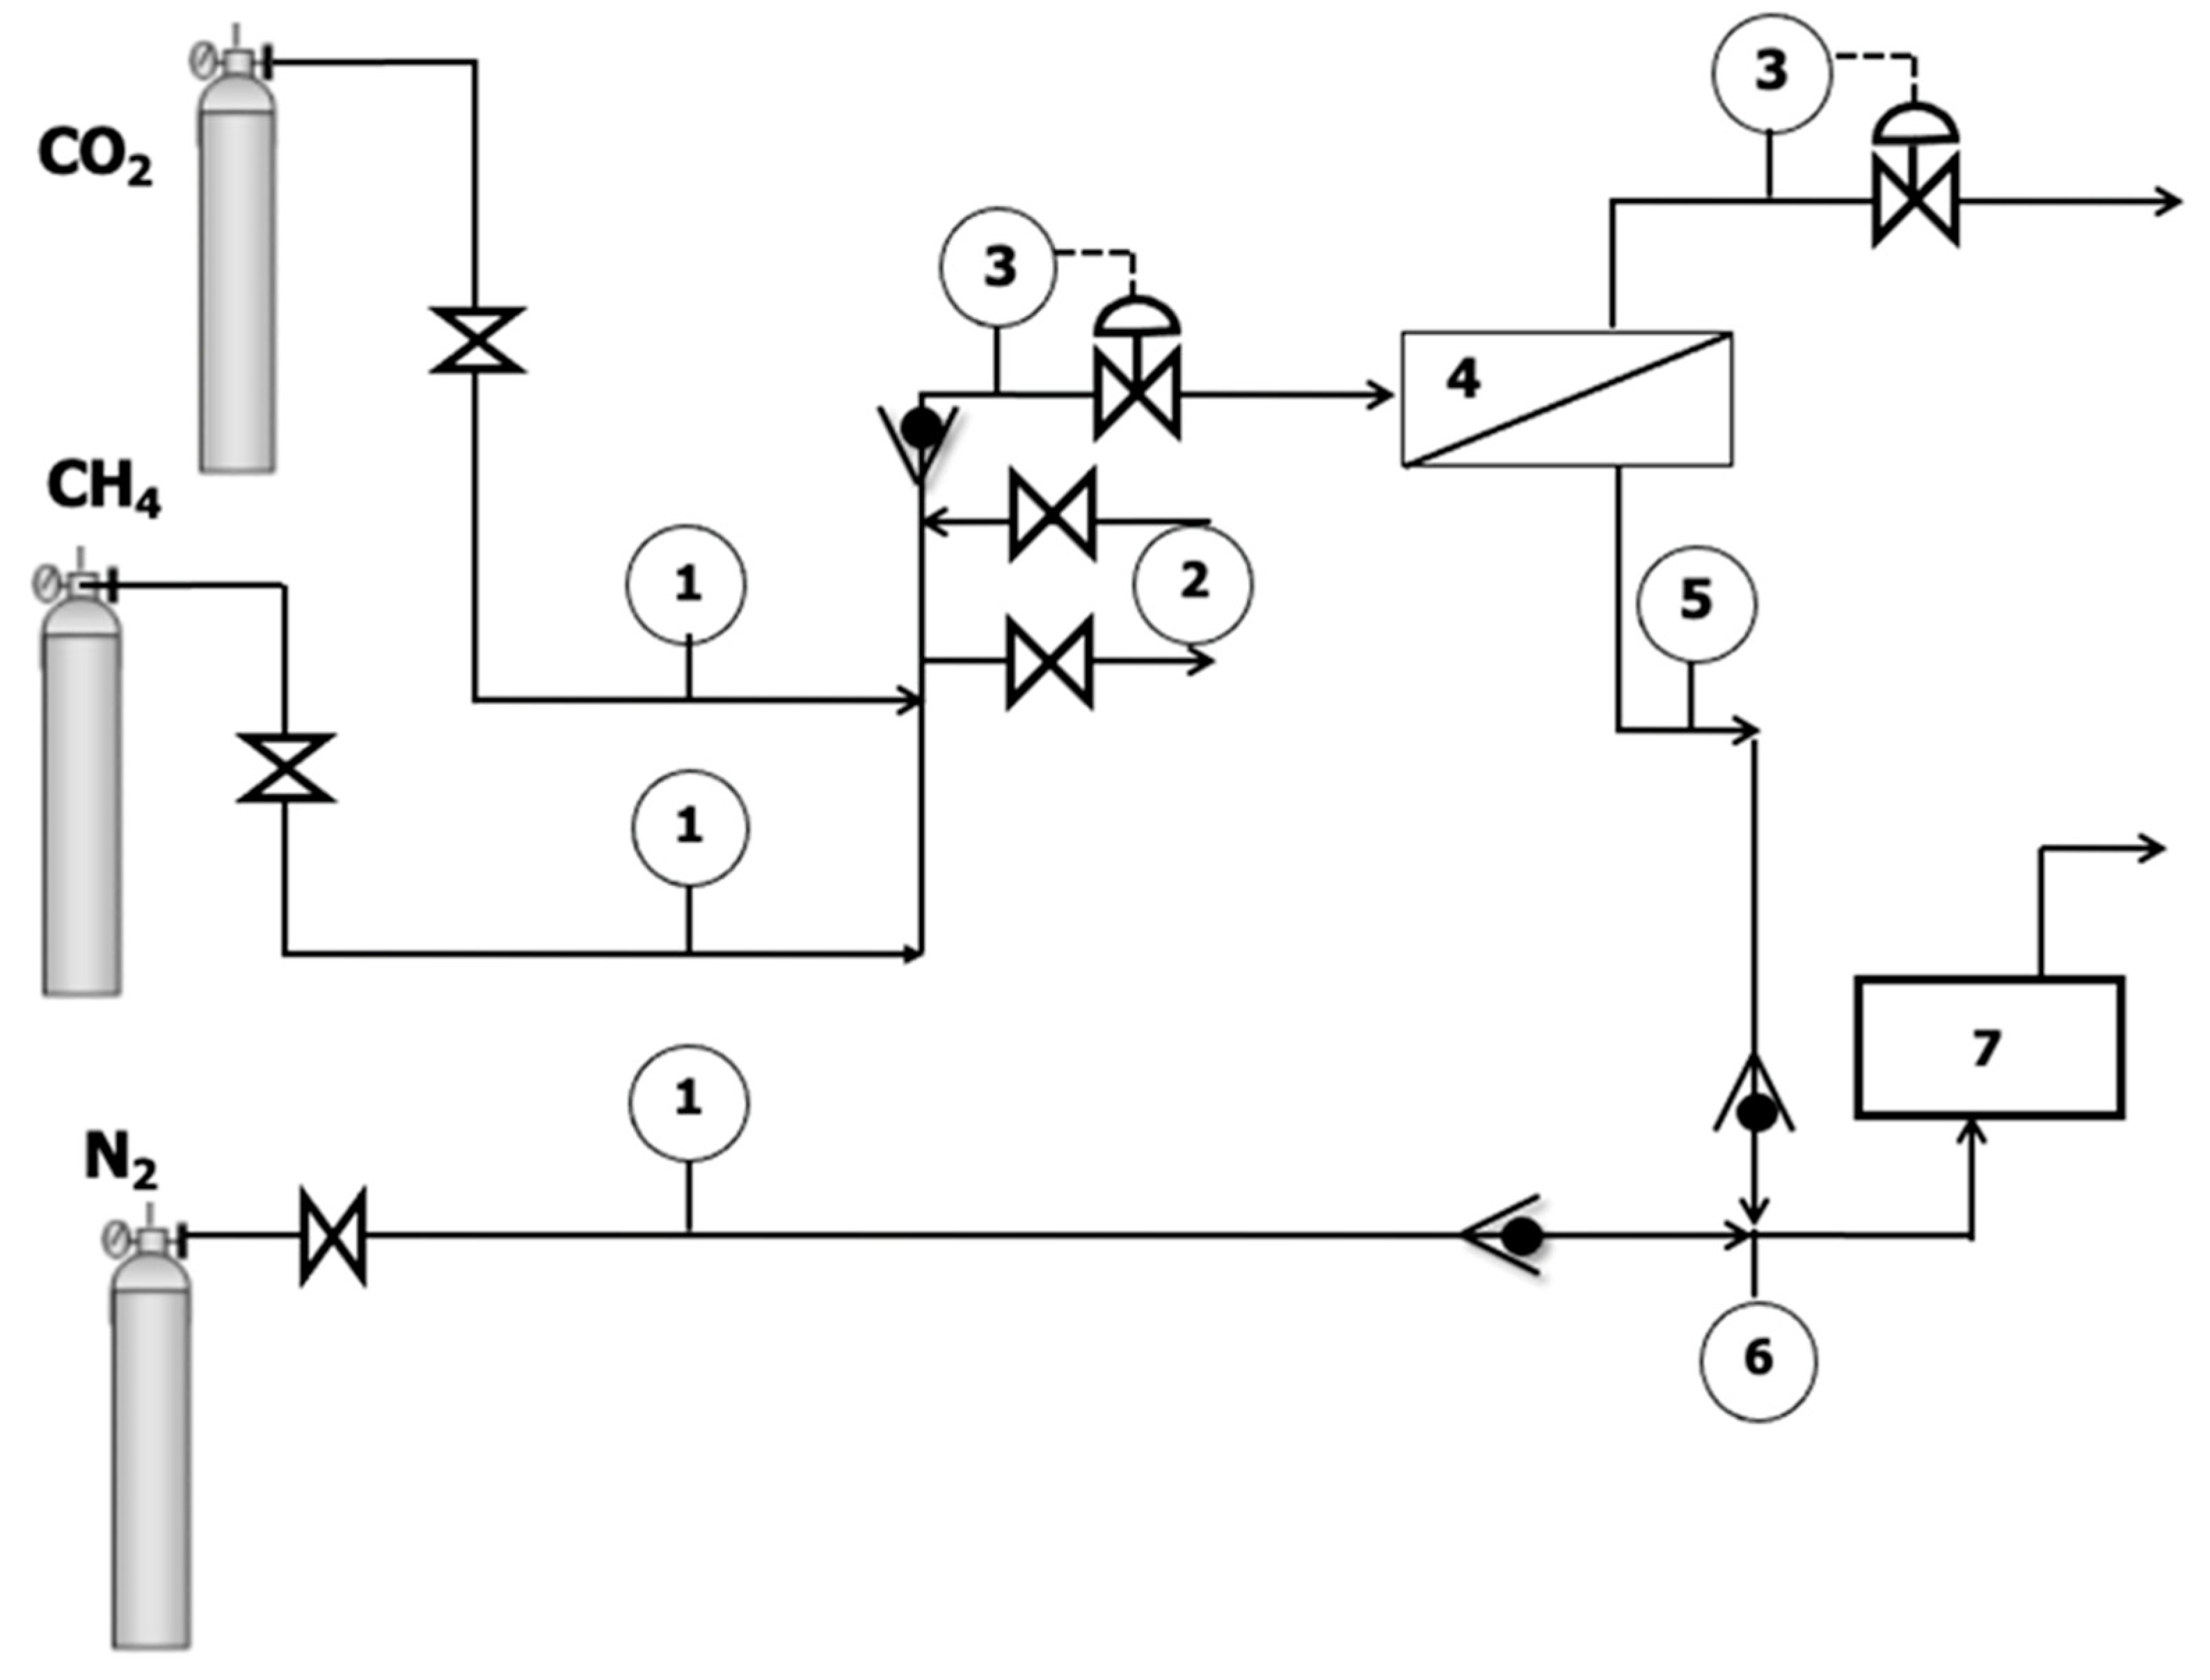
2.2. Gas Separation Experiments
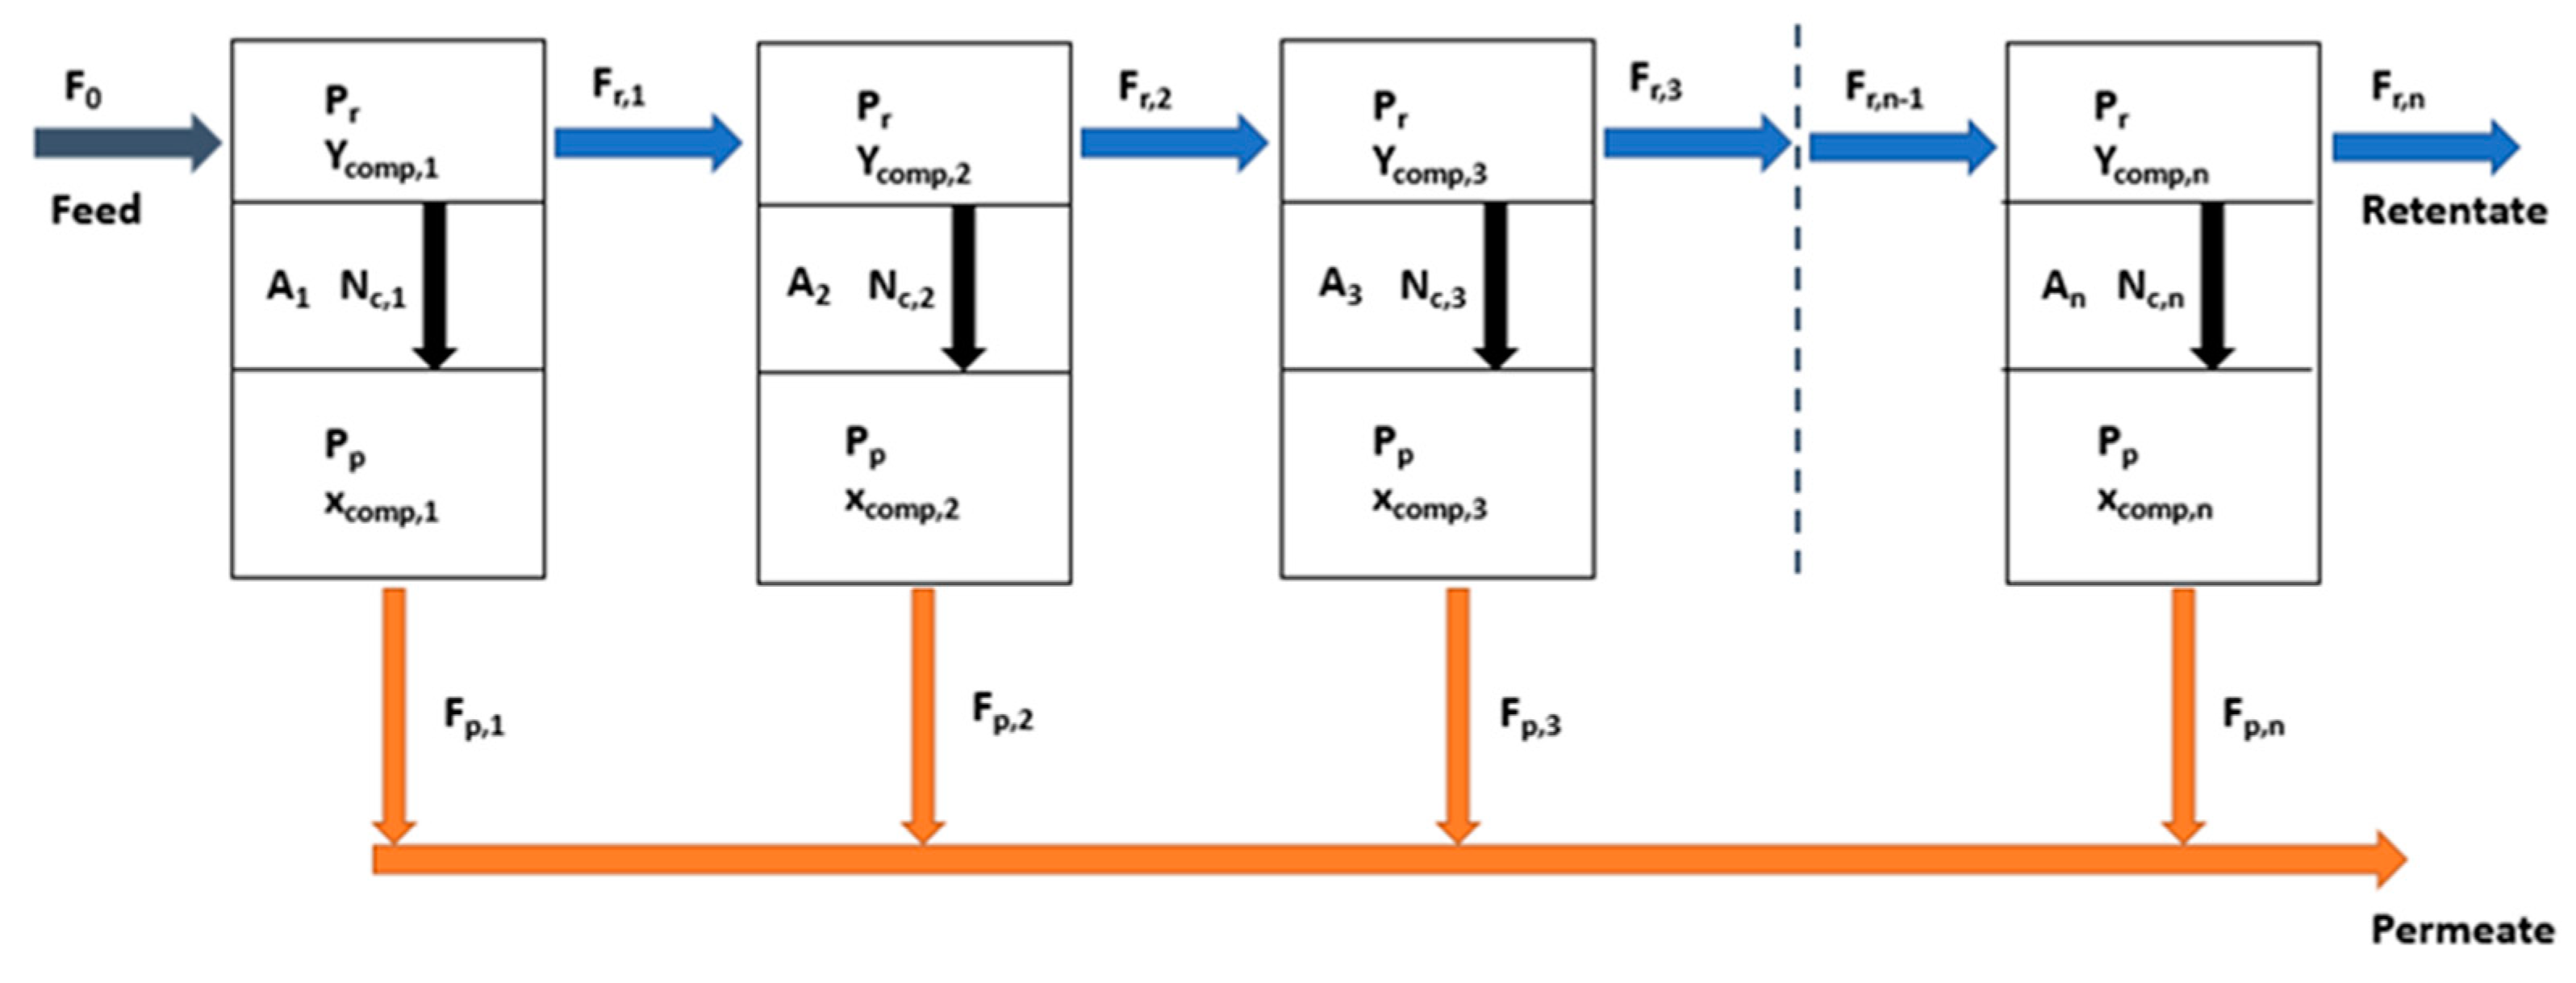
2.3. Process Simulation: Membrane Unit Model
- Ideal gas behavior.
- Isothermal and constant permeance.
- The pressure drop is negligible at each side of the membrane.
- The effect of concentration polarization is negligible.
- The permeance depends on the feed conditions and can be estimated based on correlations dependent on conditions, including pressure, flowrate, and composition.
3. Results
3.1. Pure Gas Permeation Experiments
3.2. Process Simulation and Sensitivity Analyses
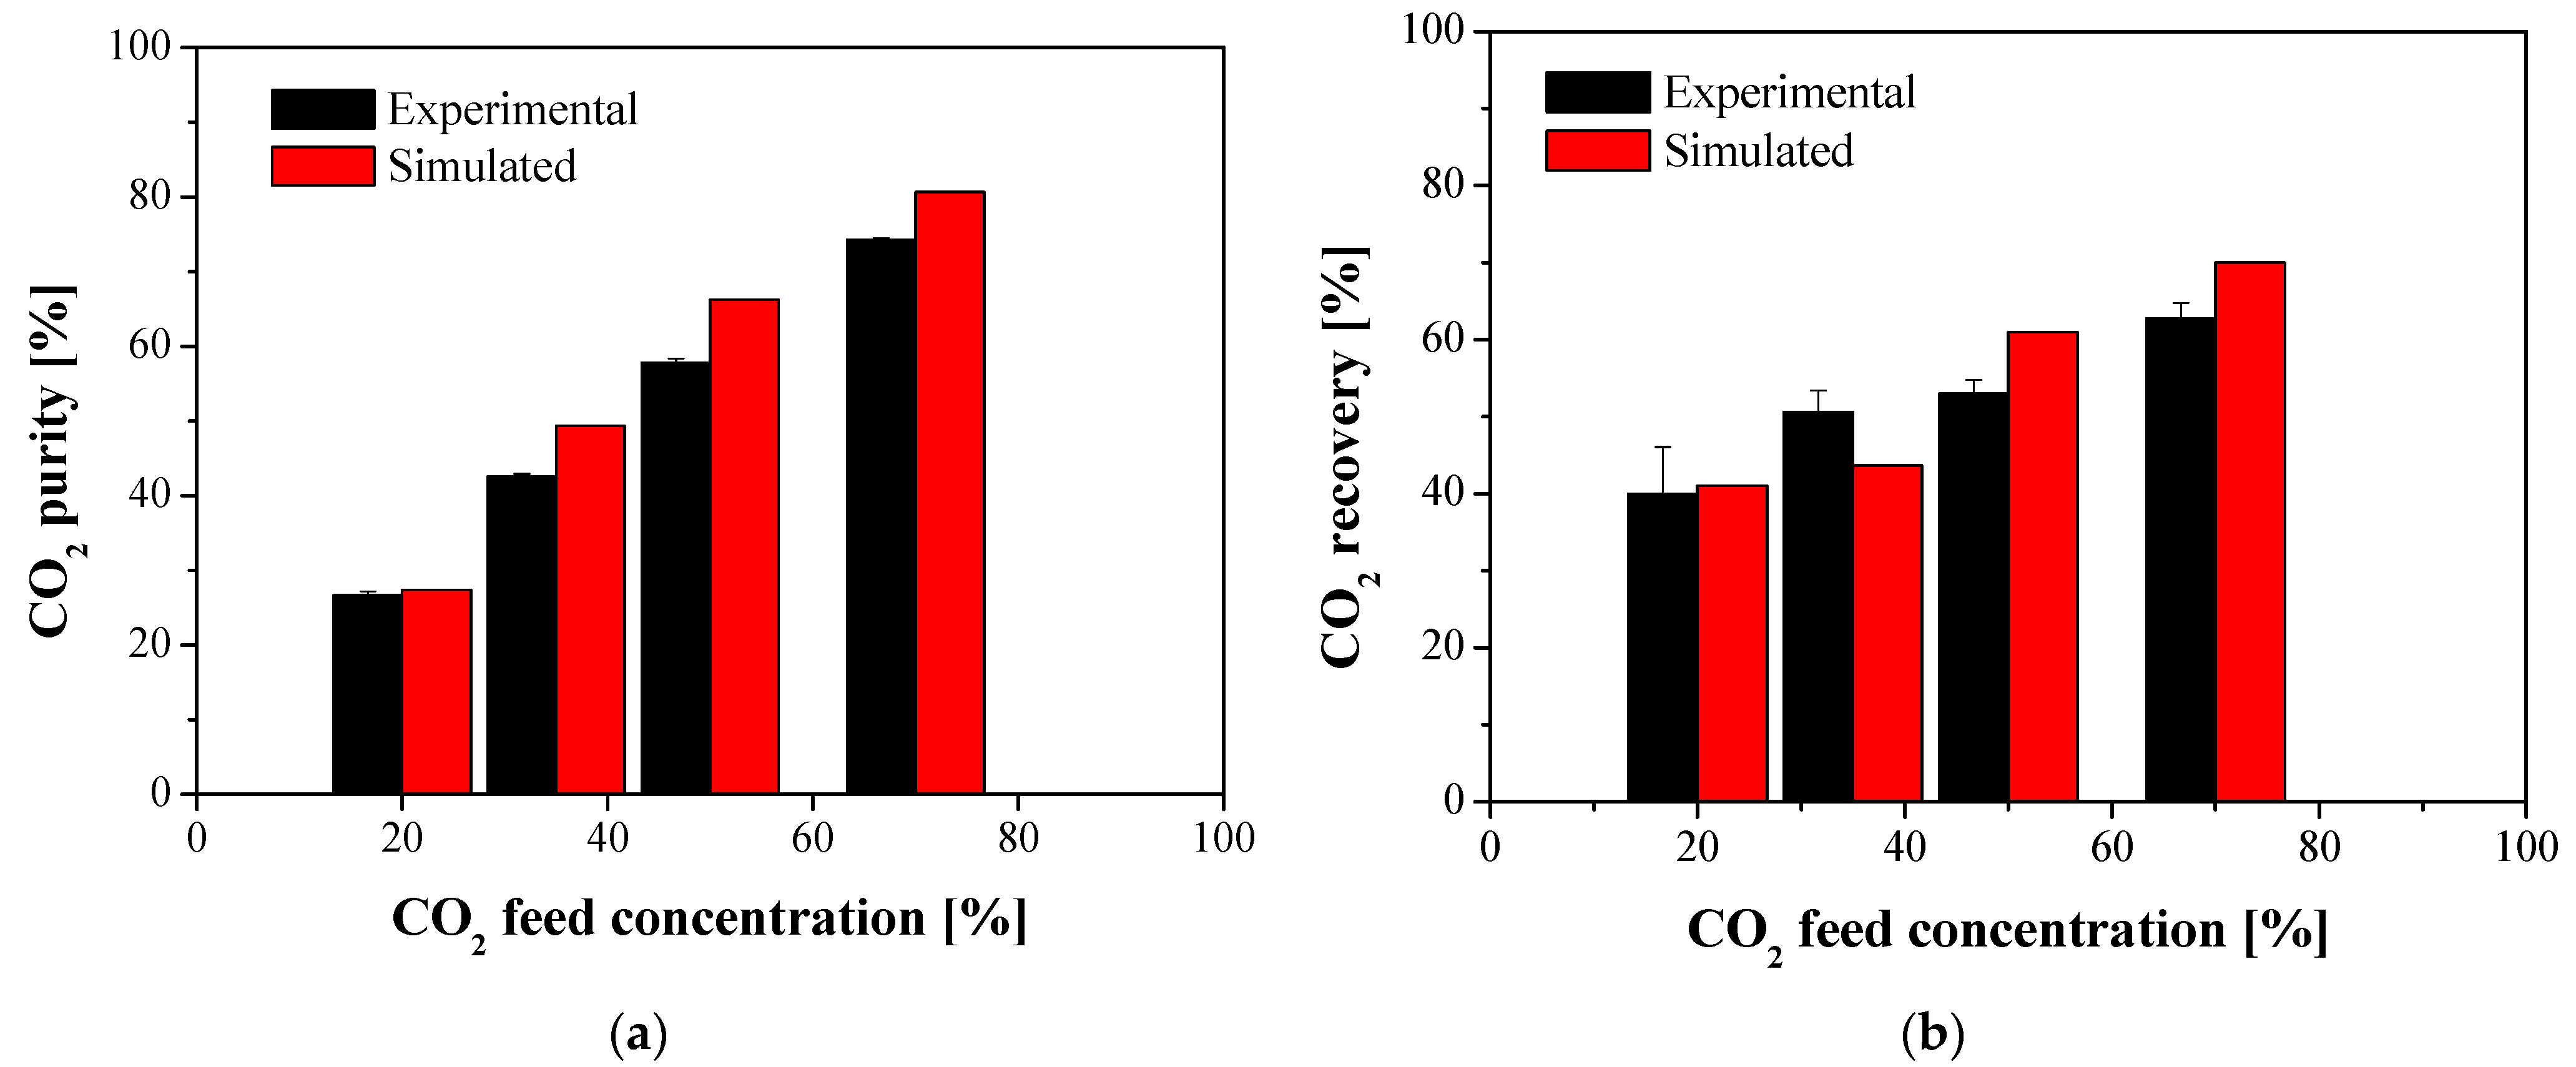
3.2.1. Model Validation
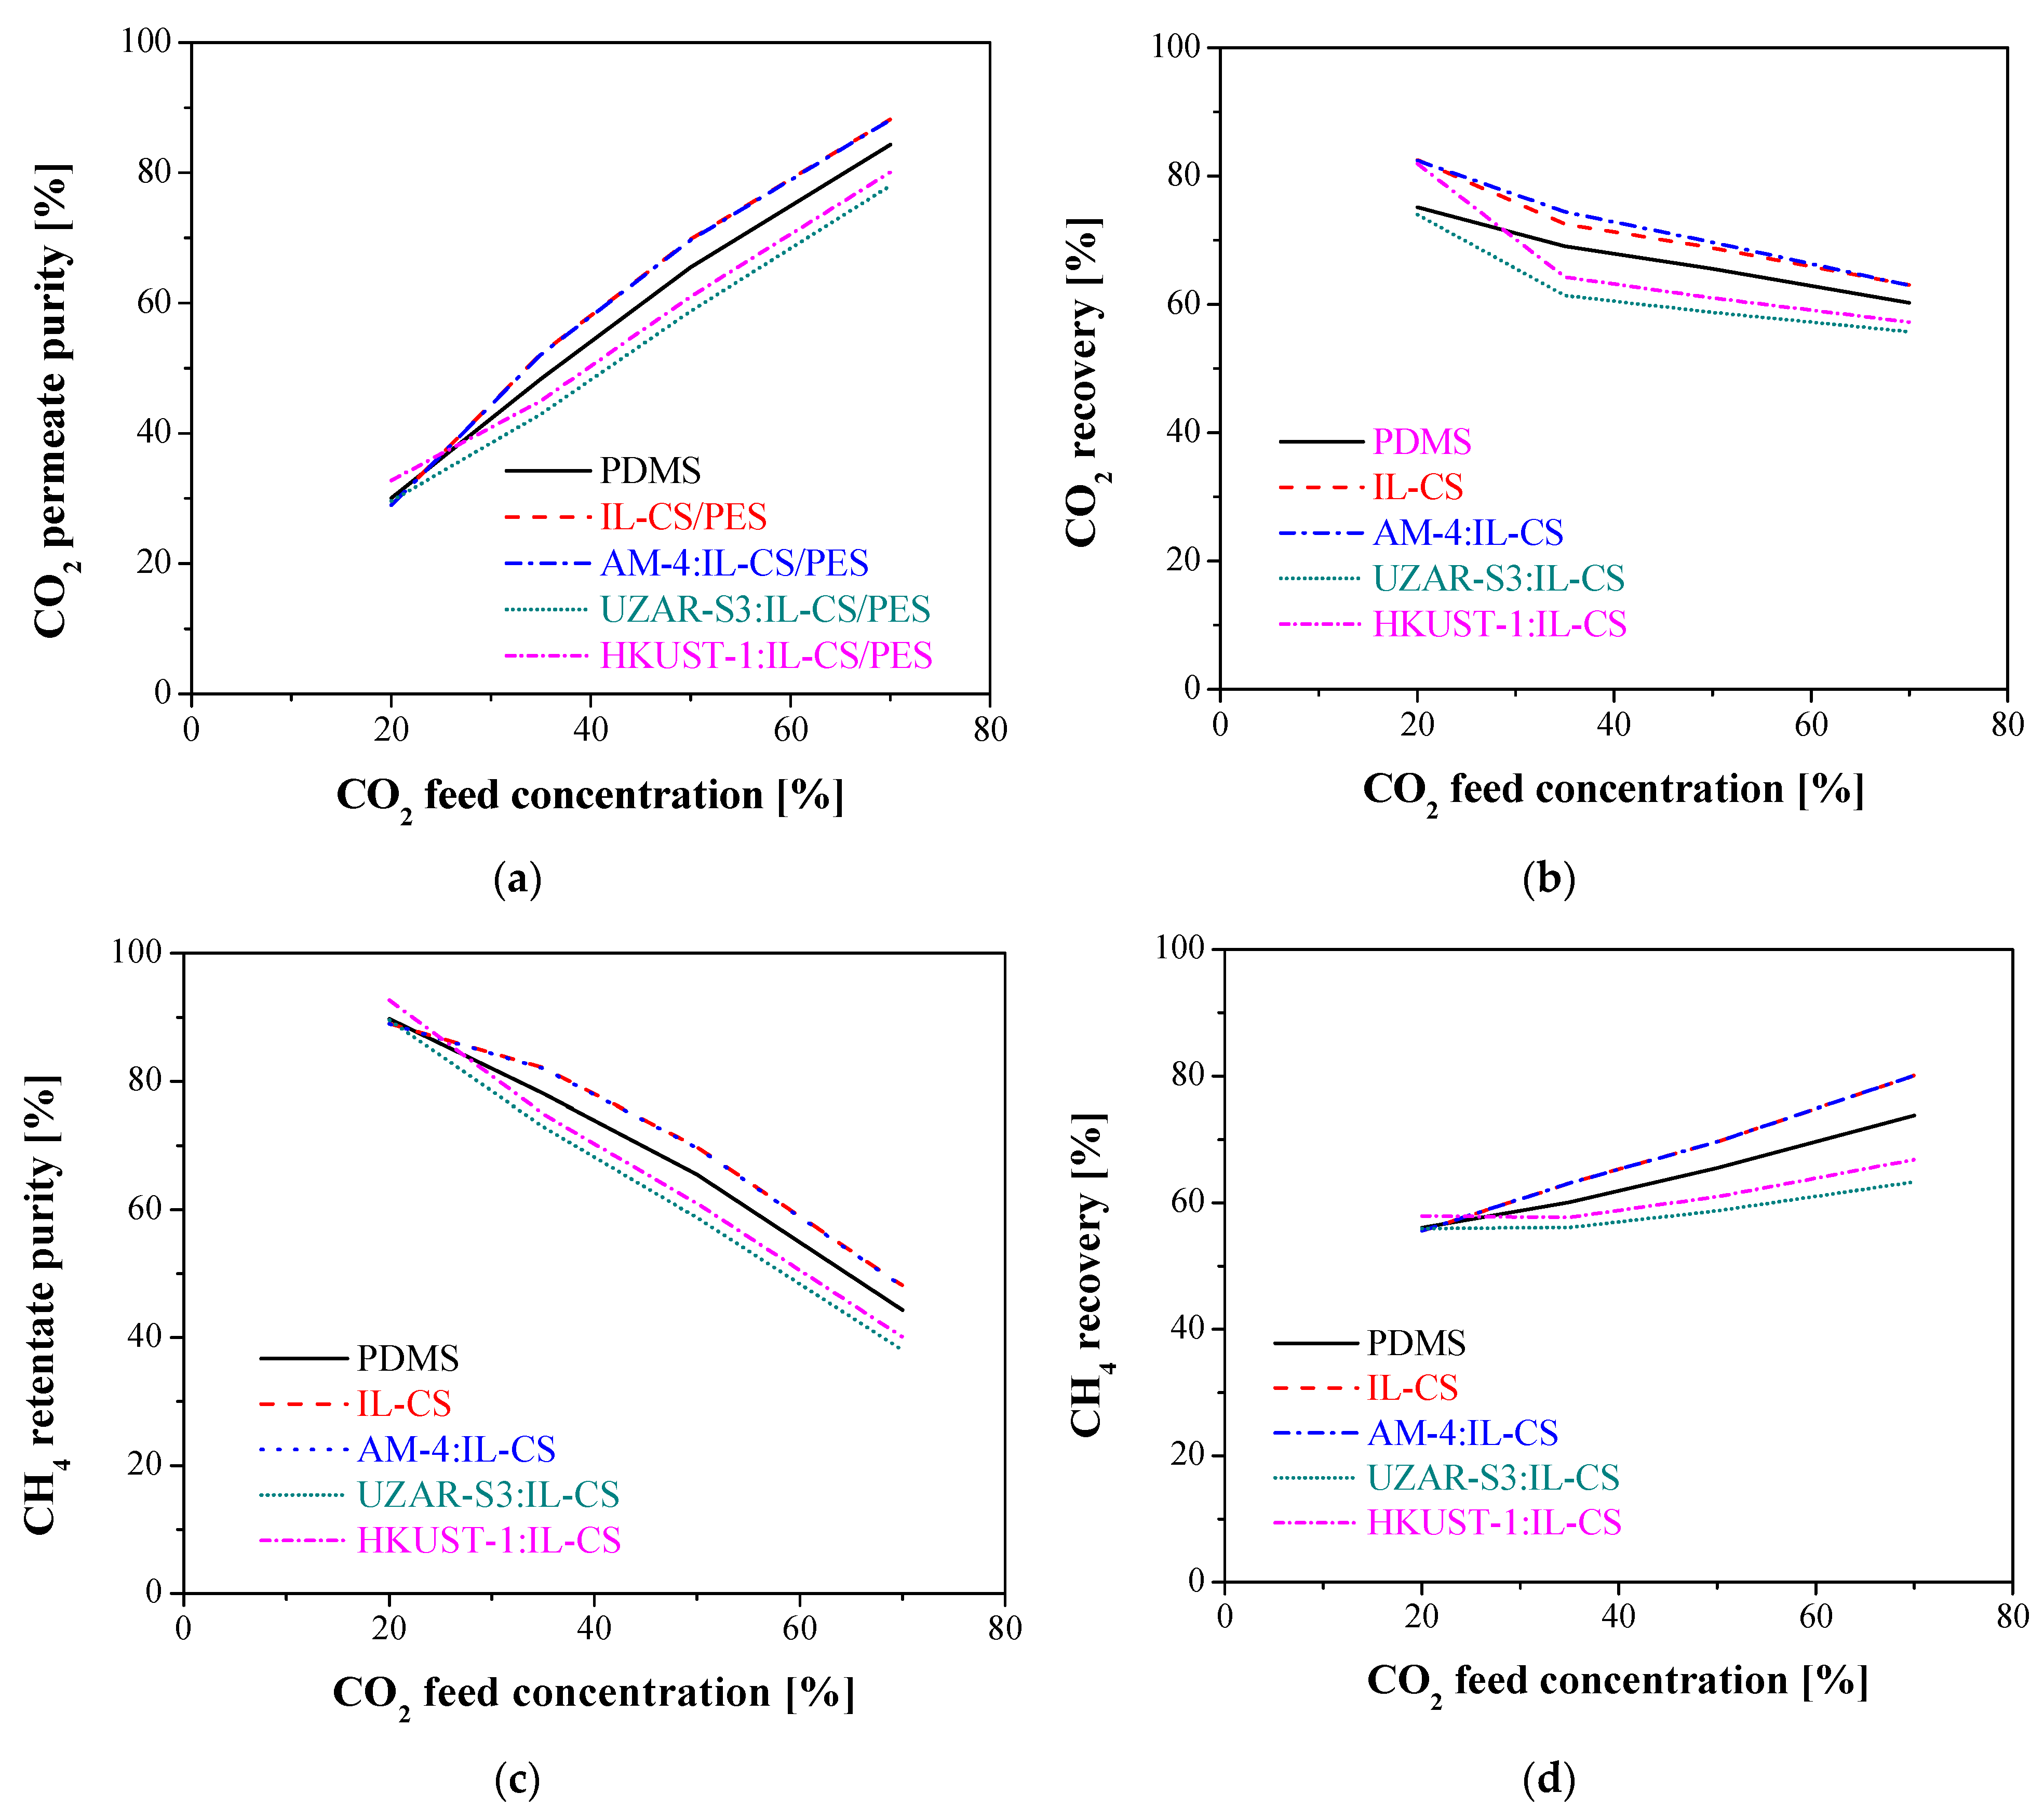
3.2.2. Influence of Feed Concentration
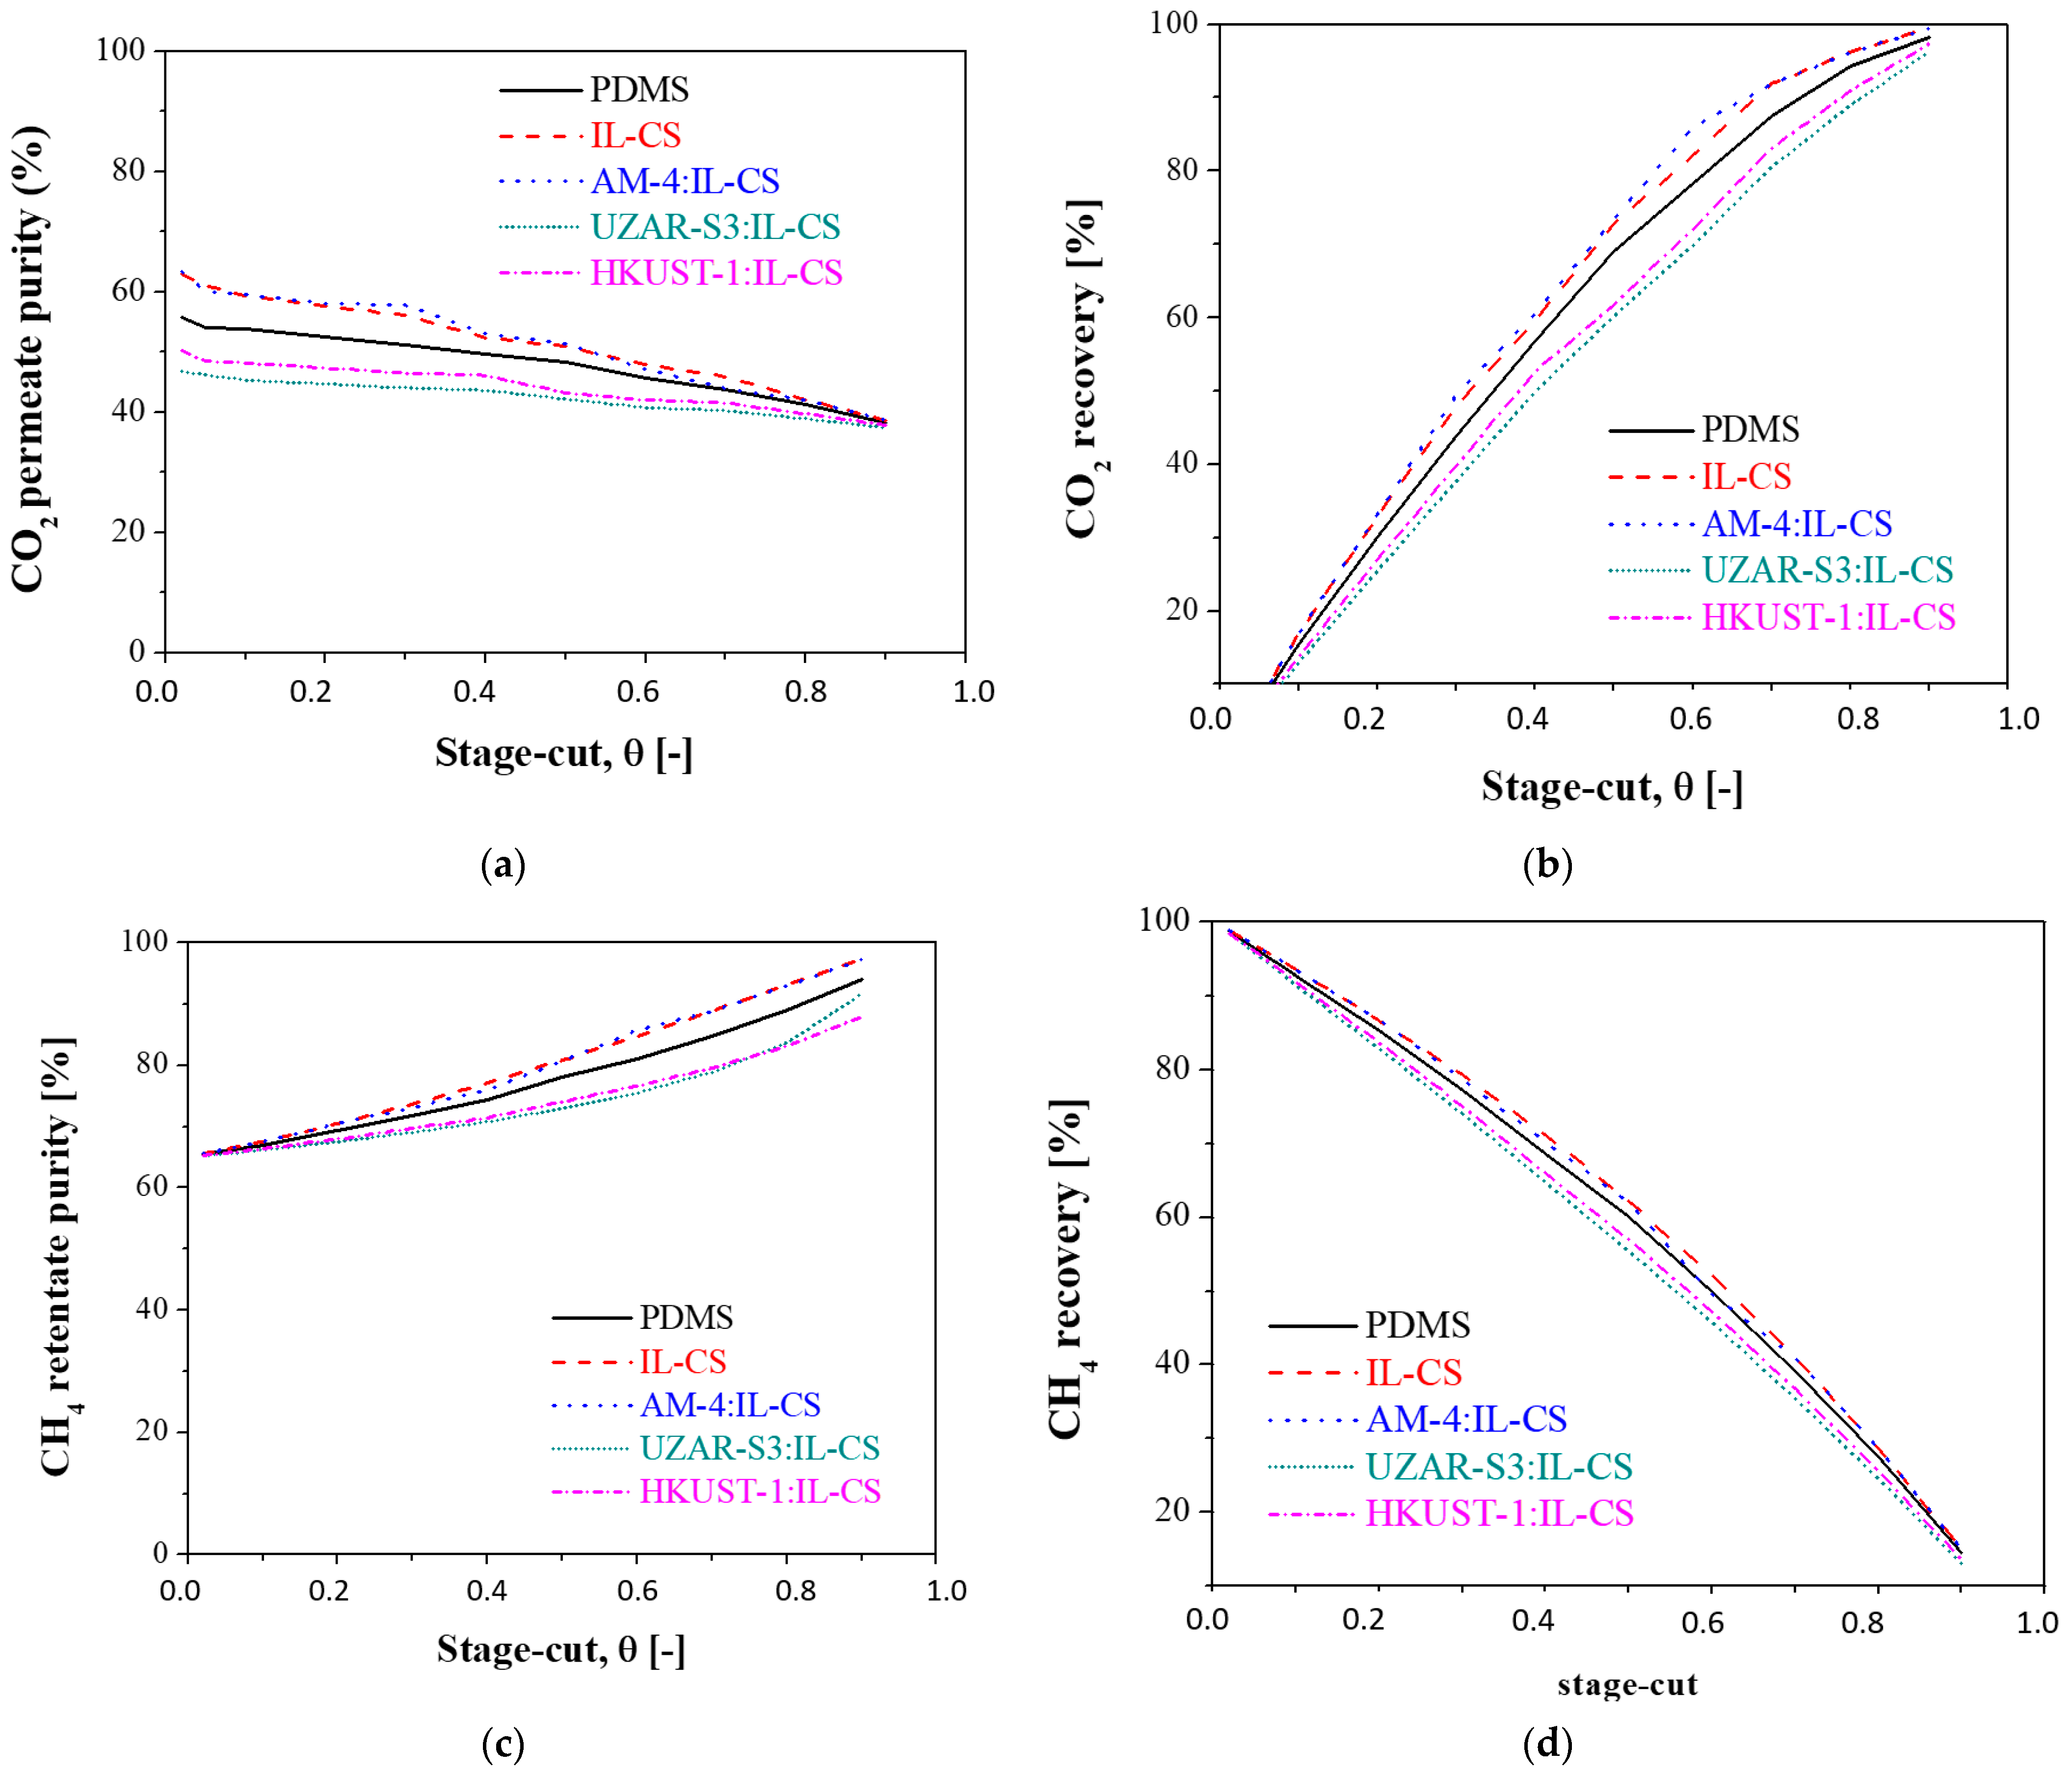
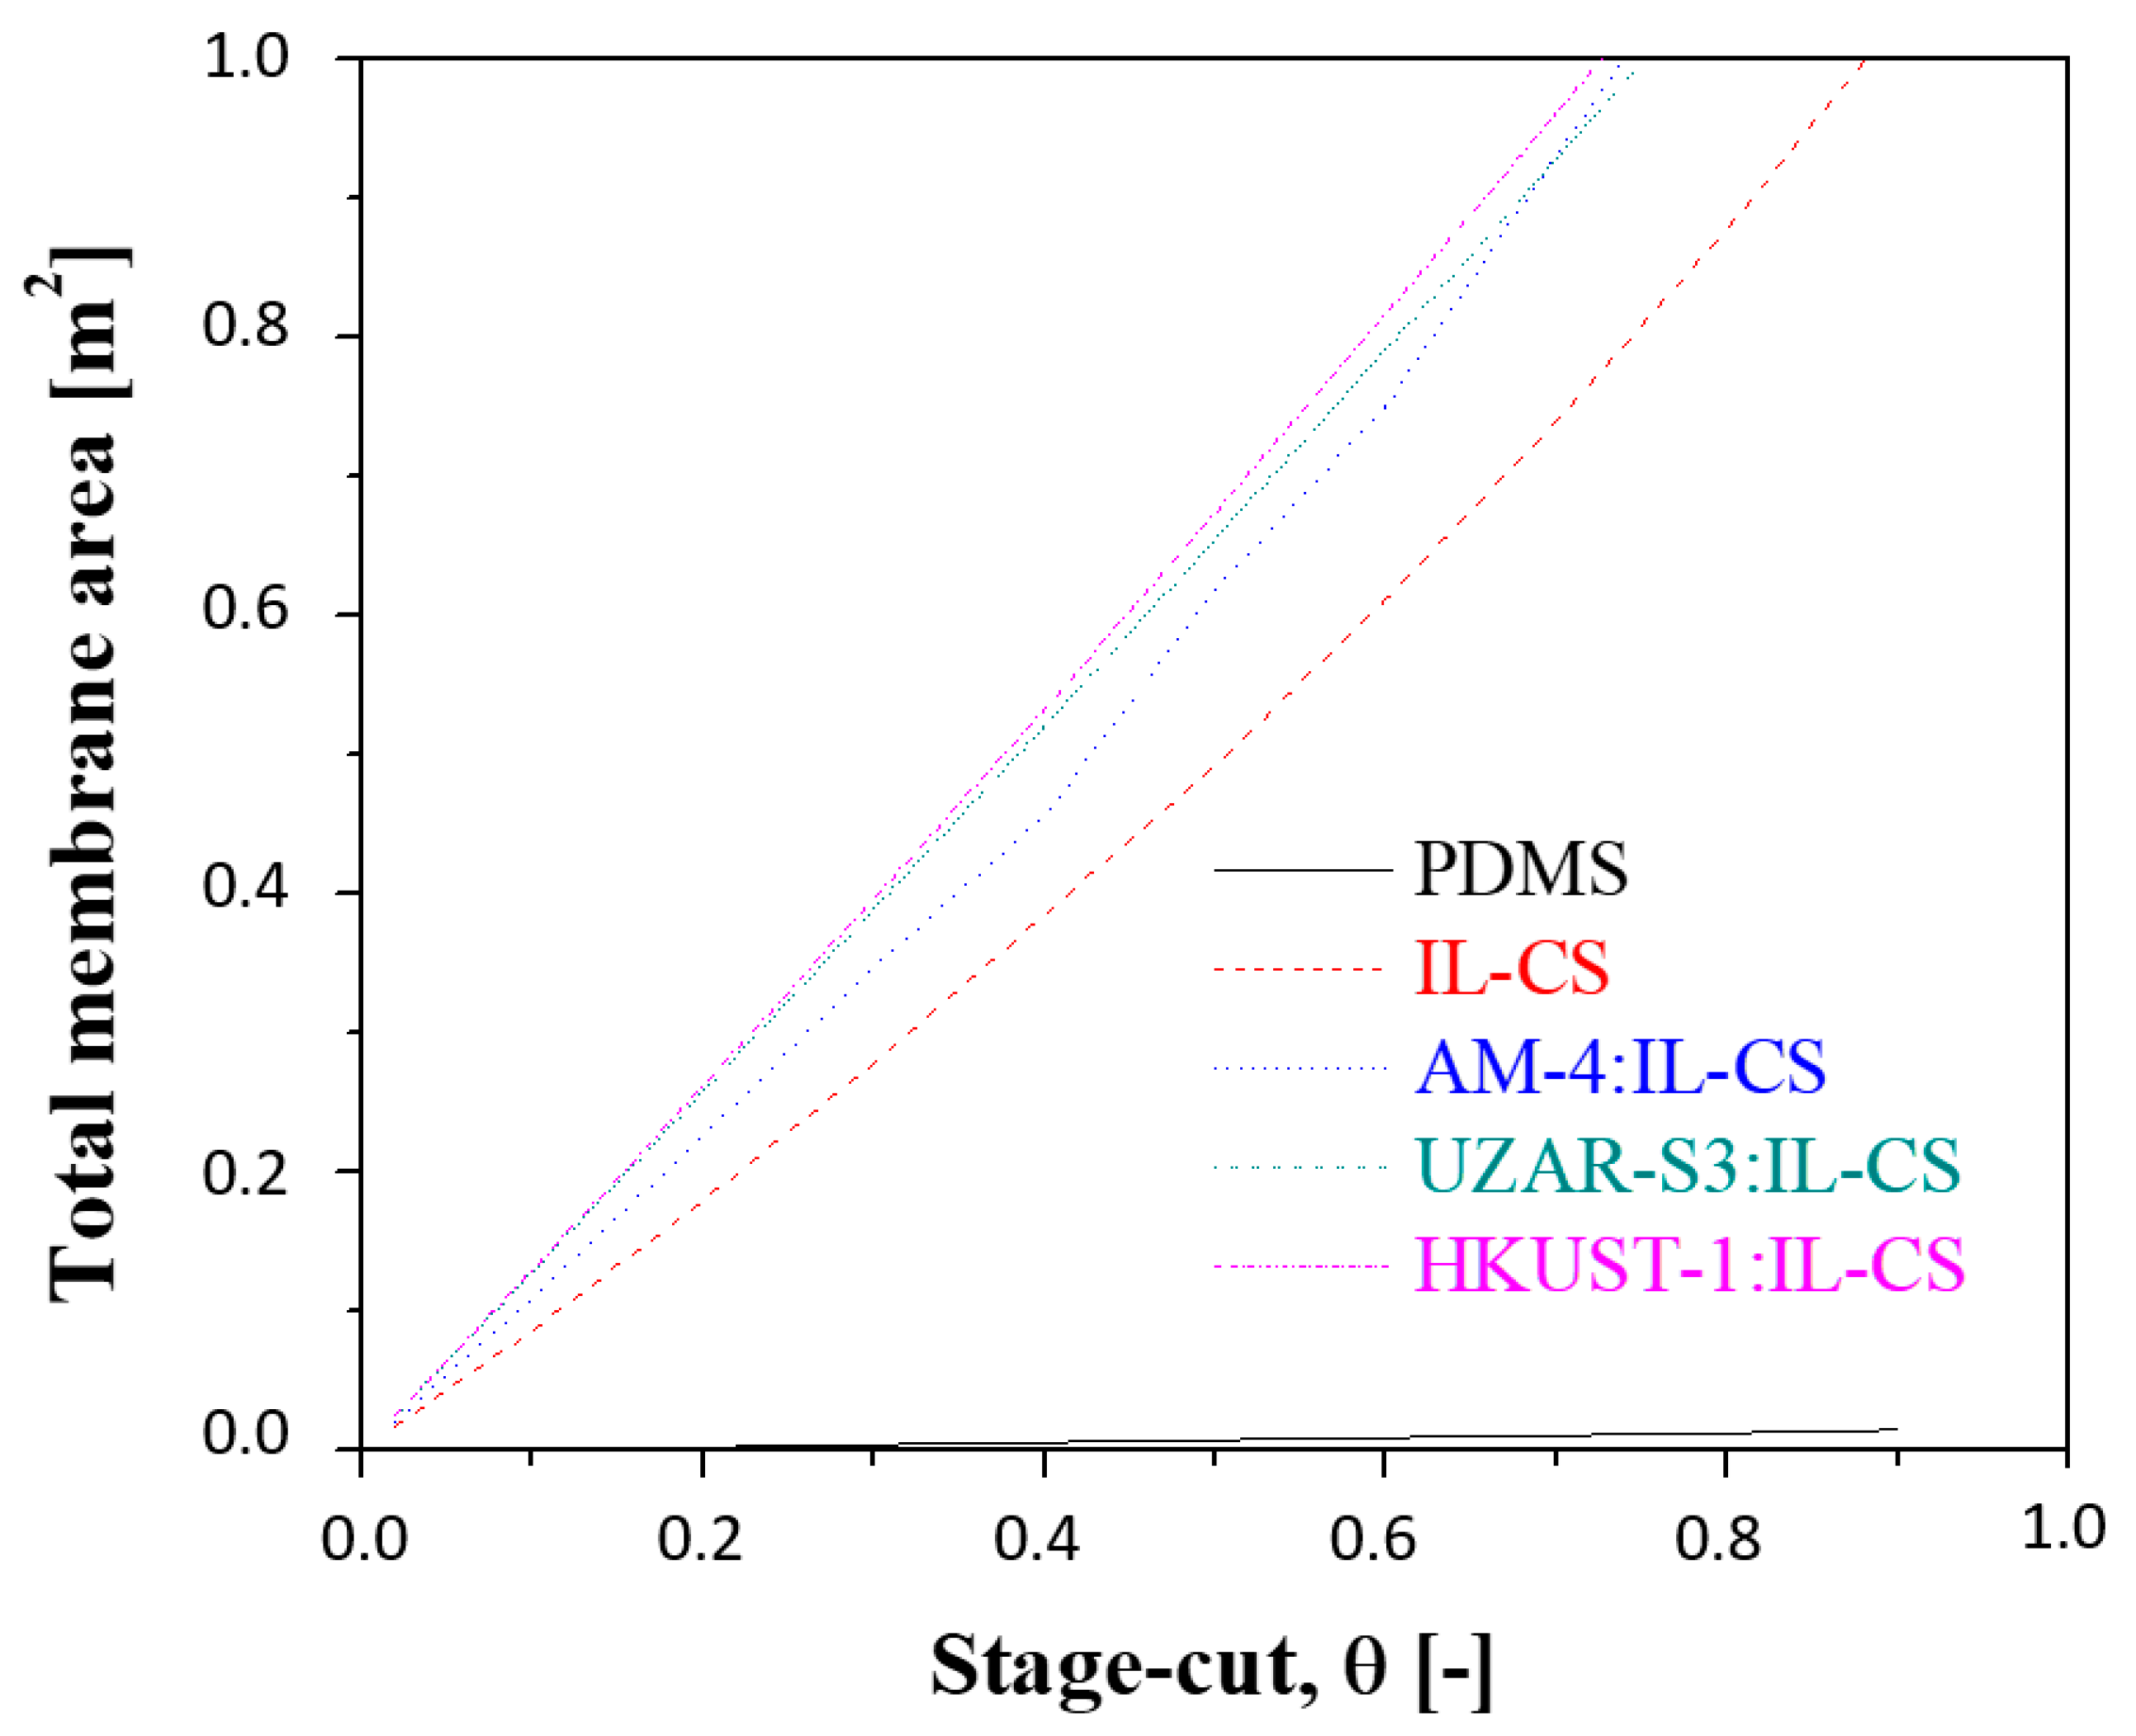
3.2.3. Influence of the Stage-Cut
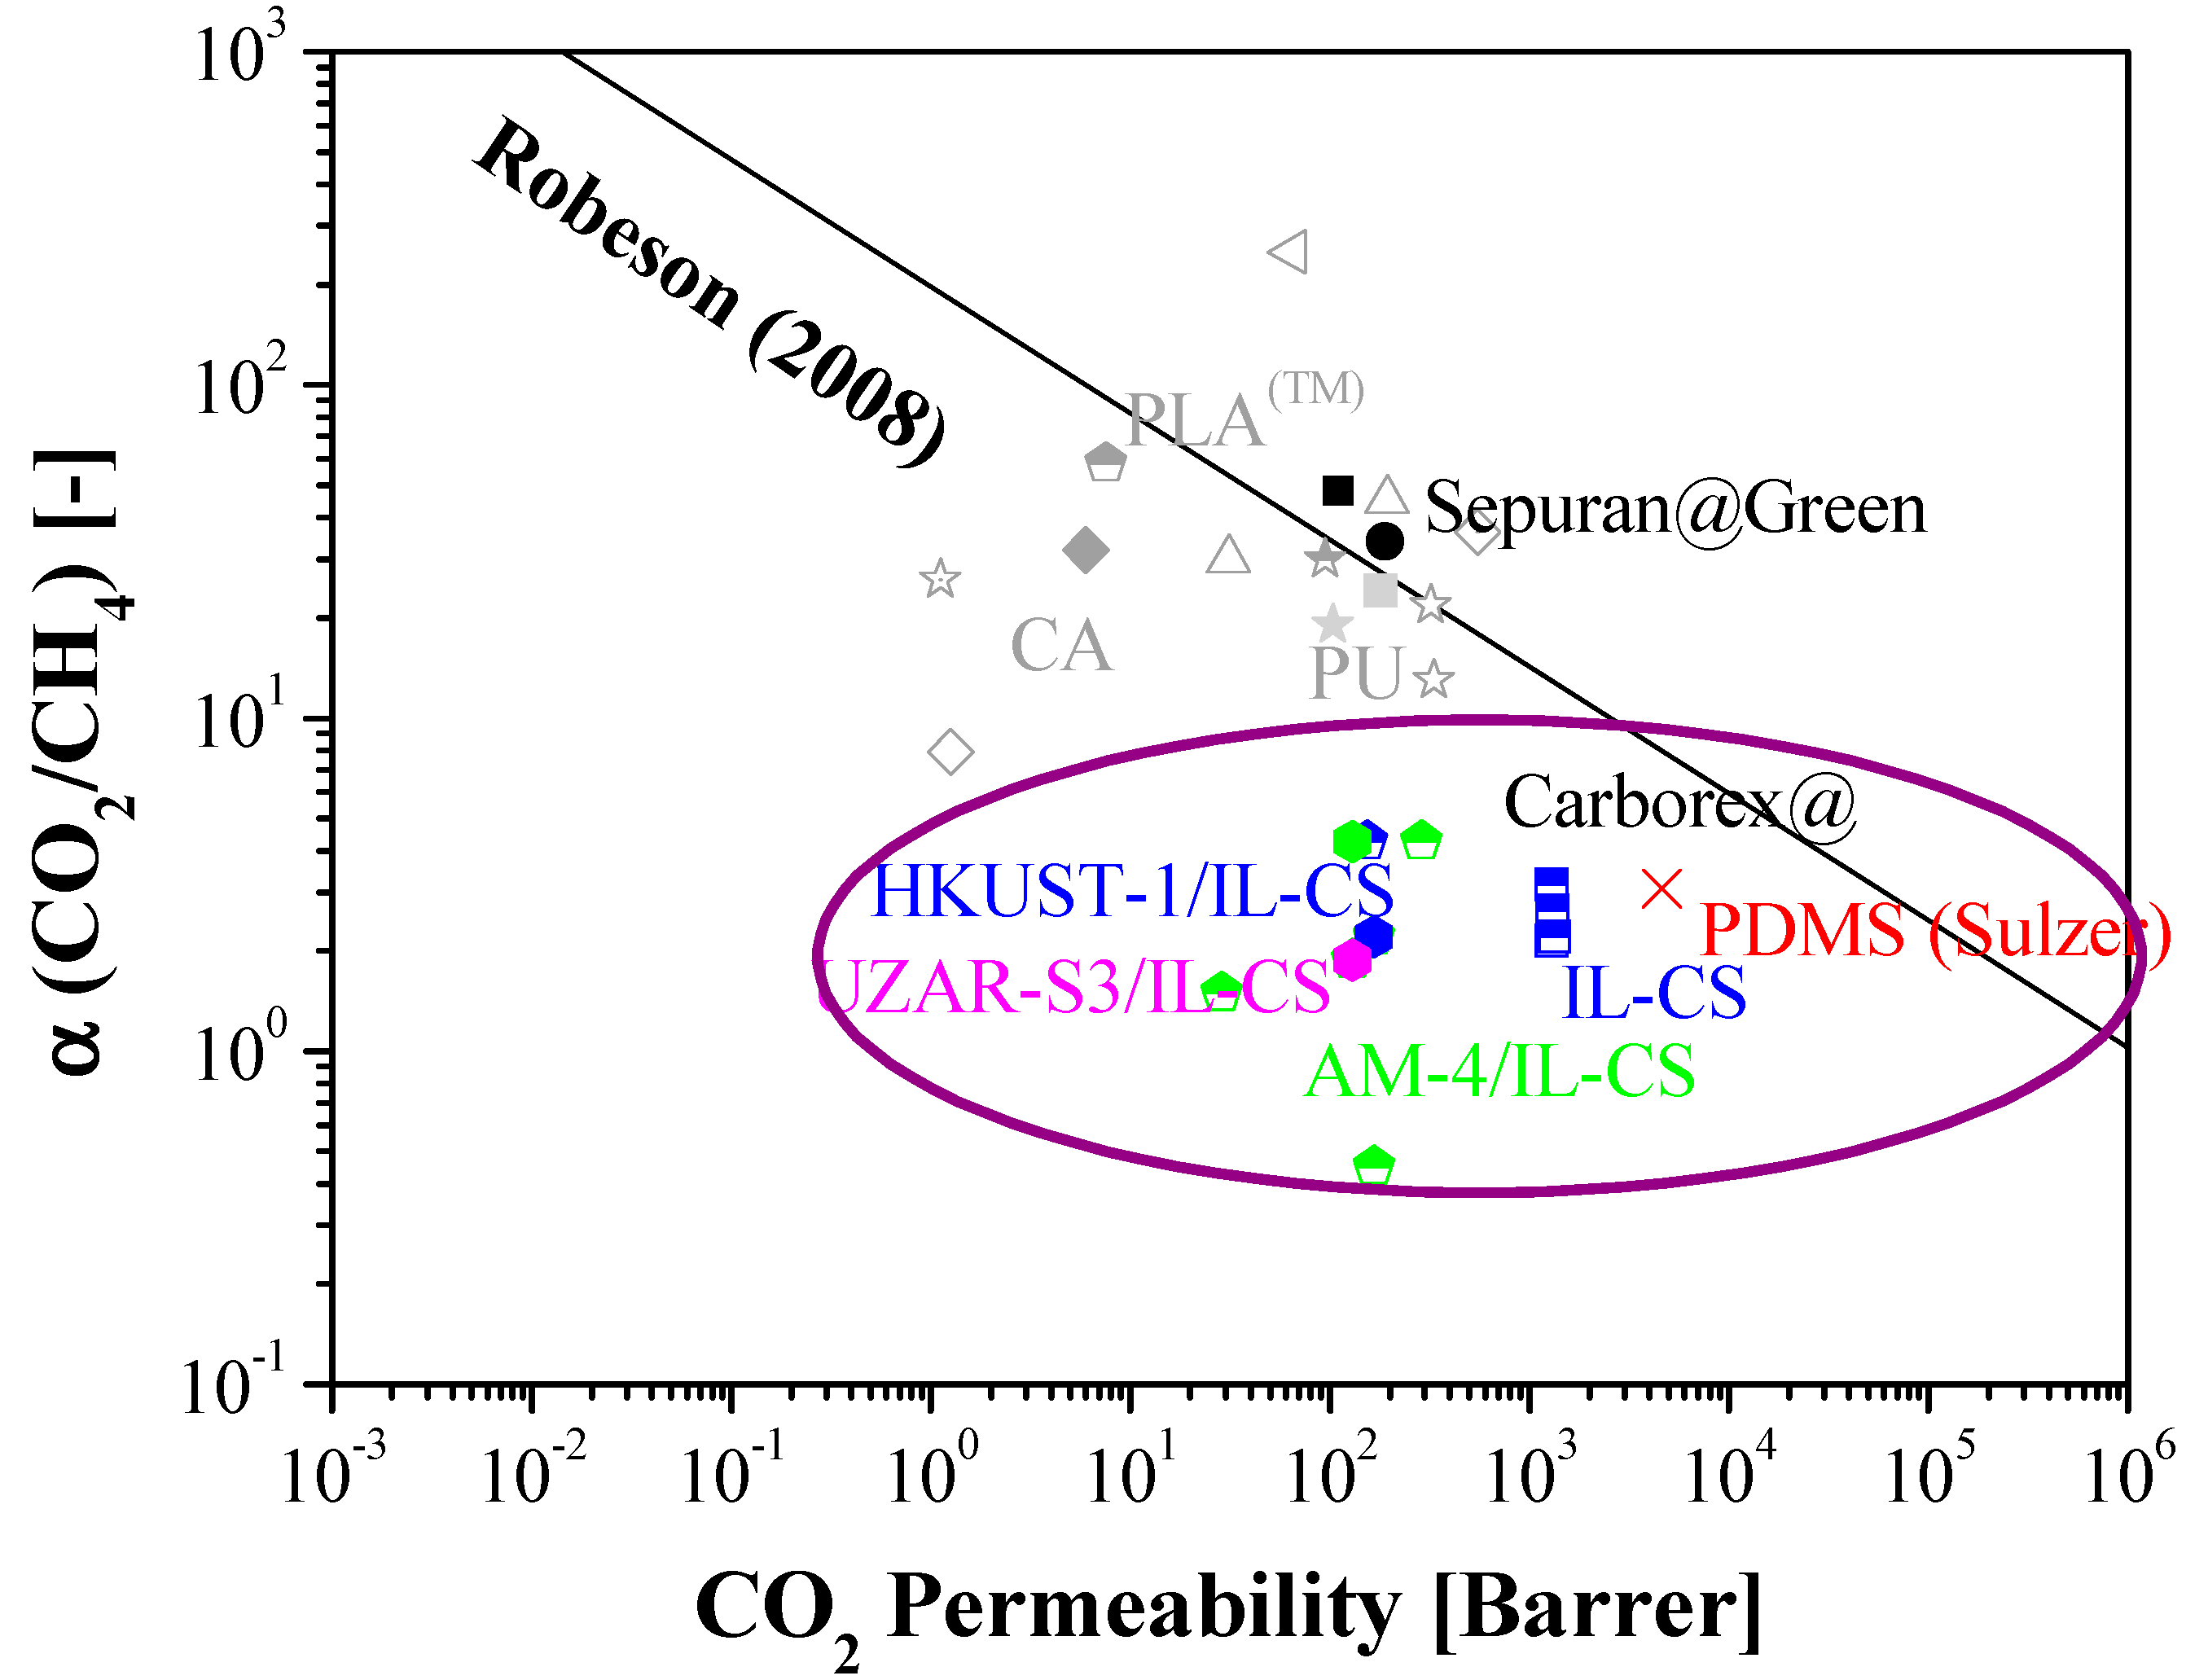
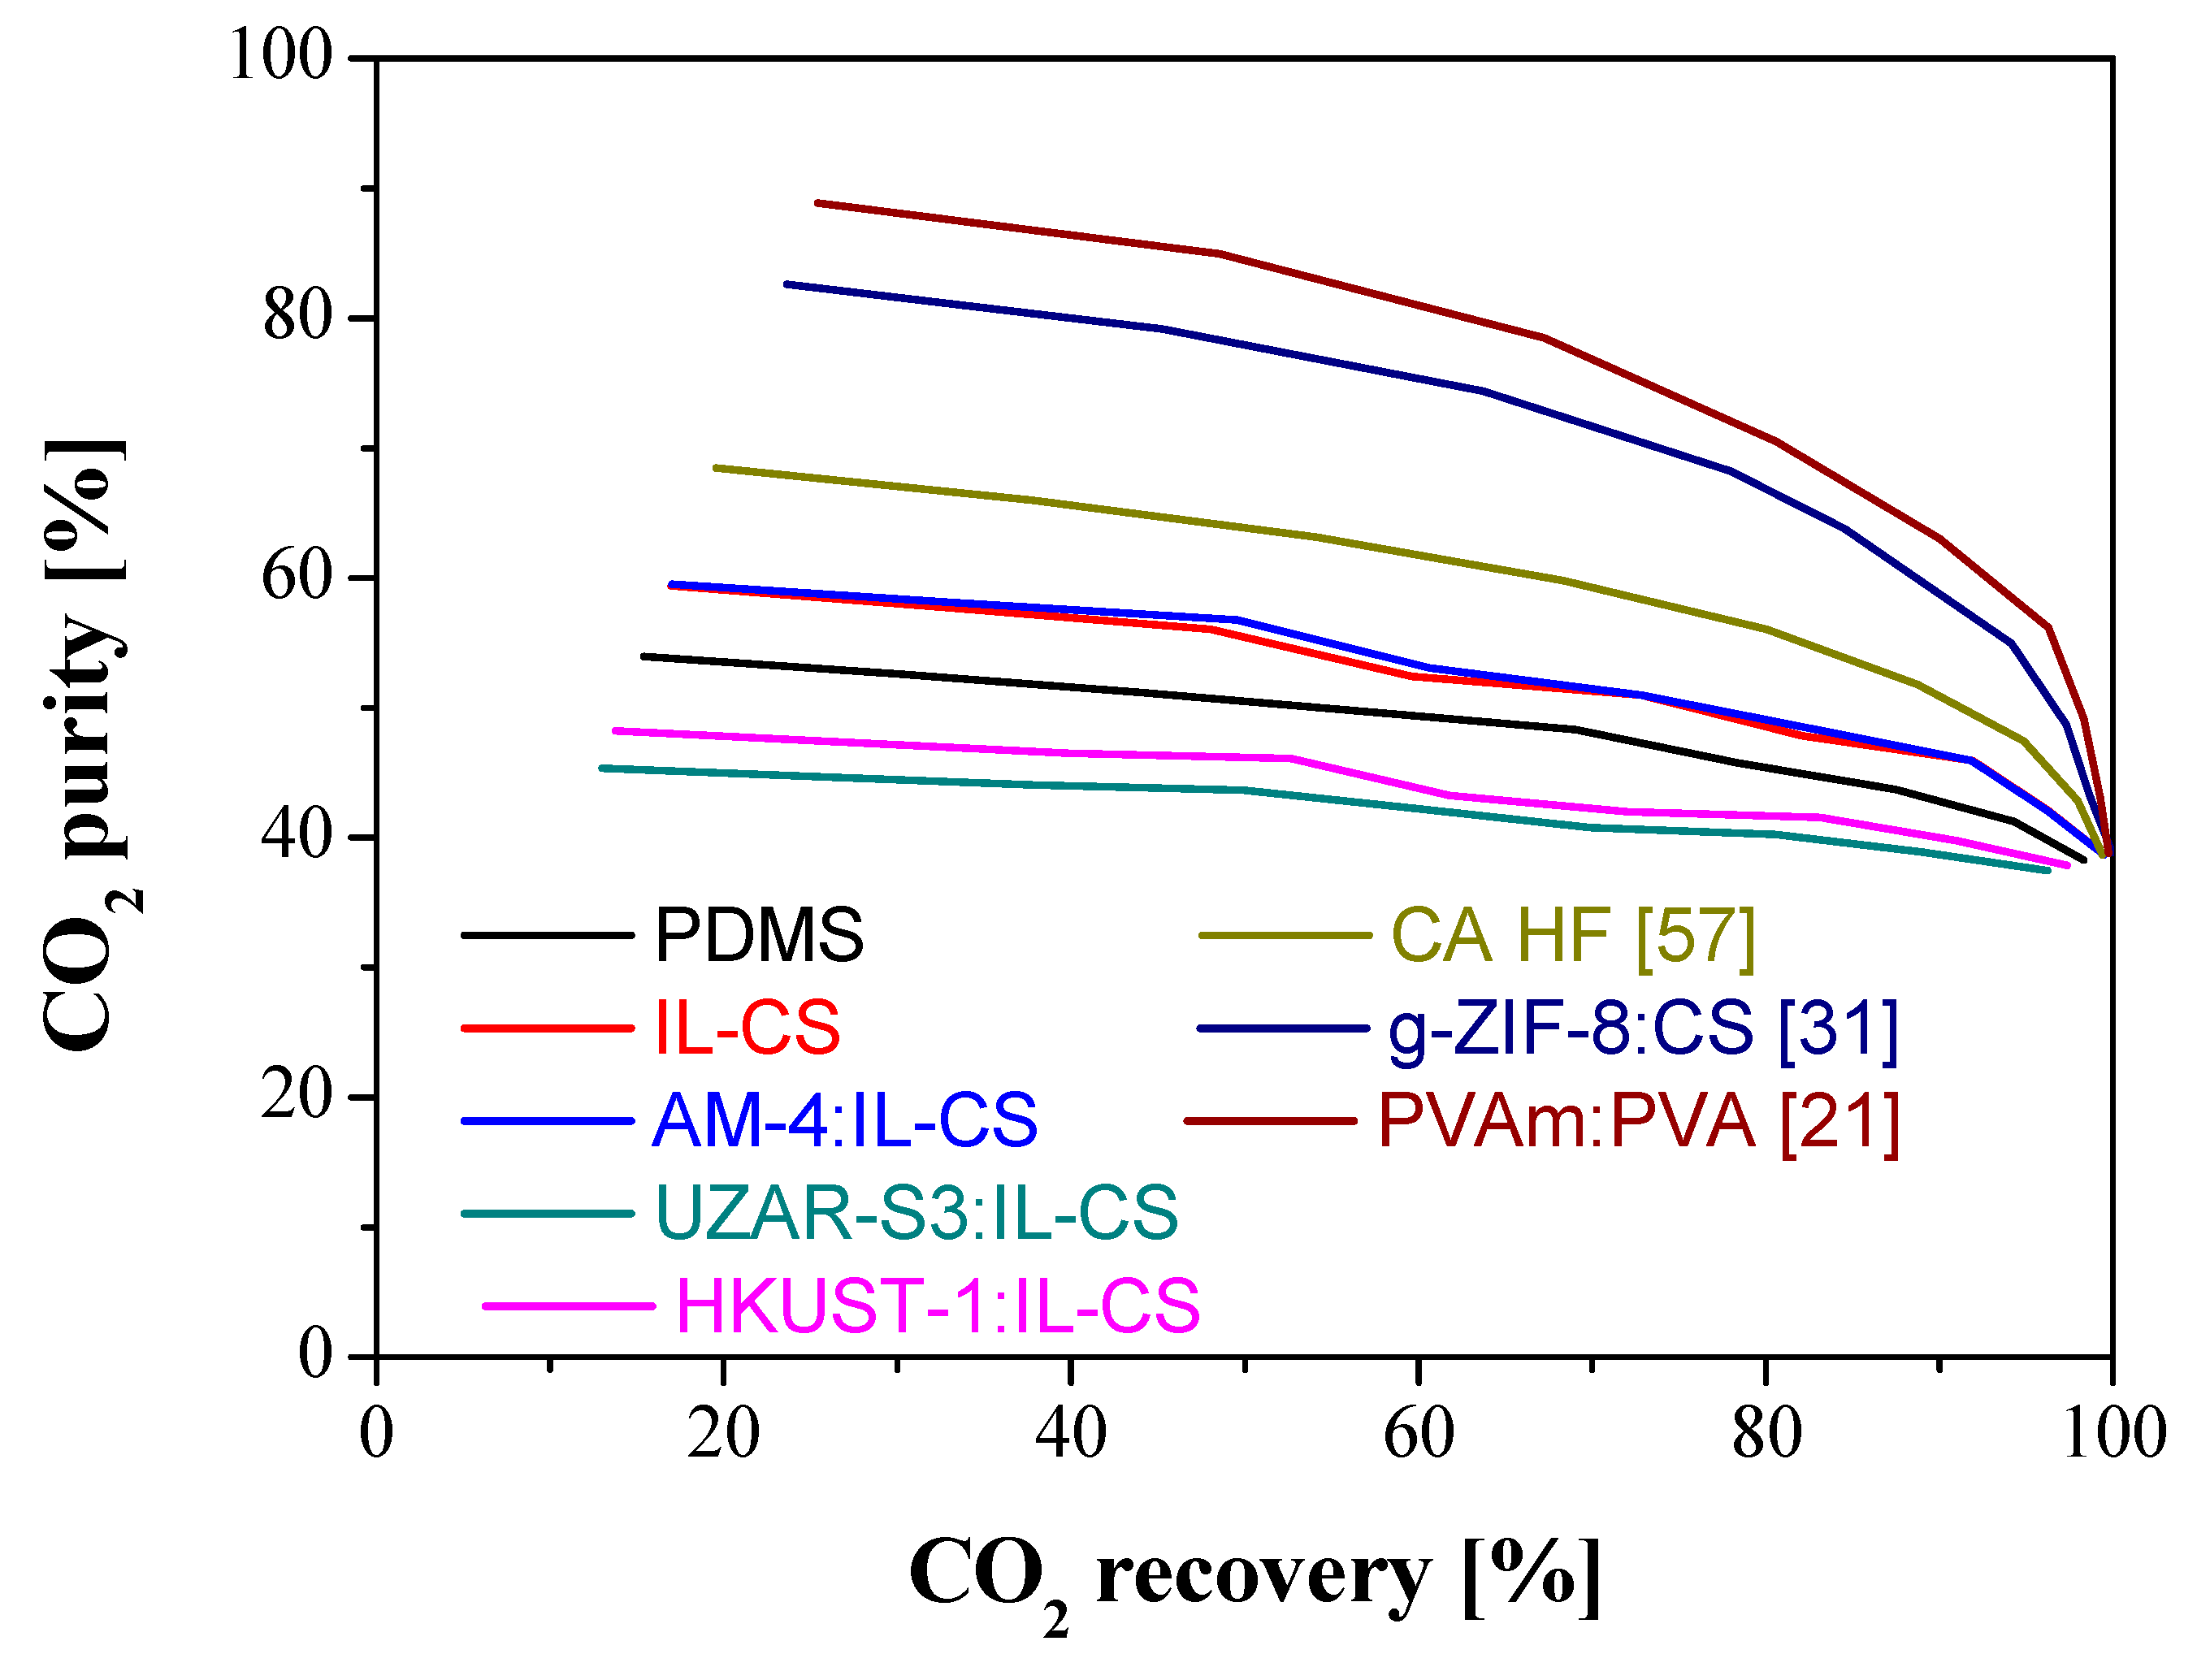
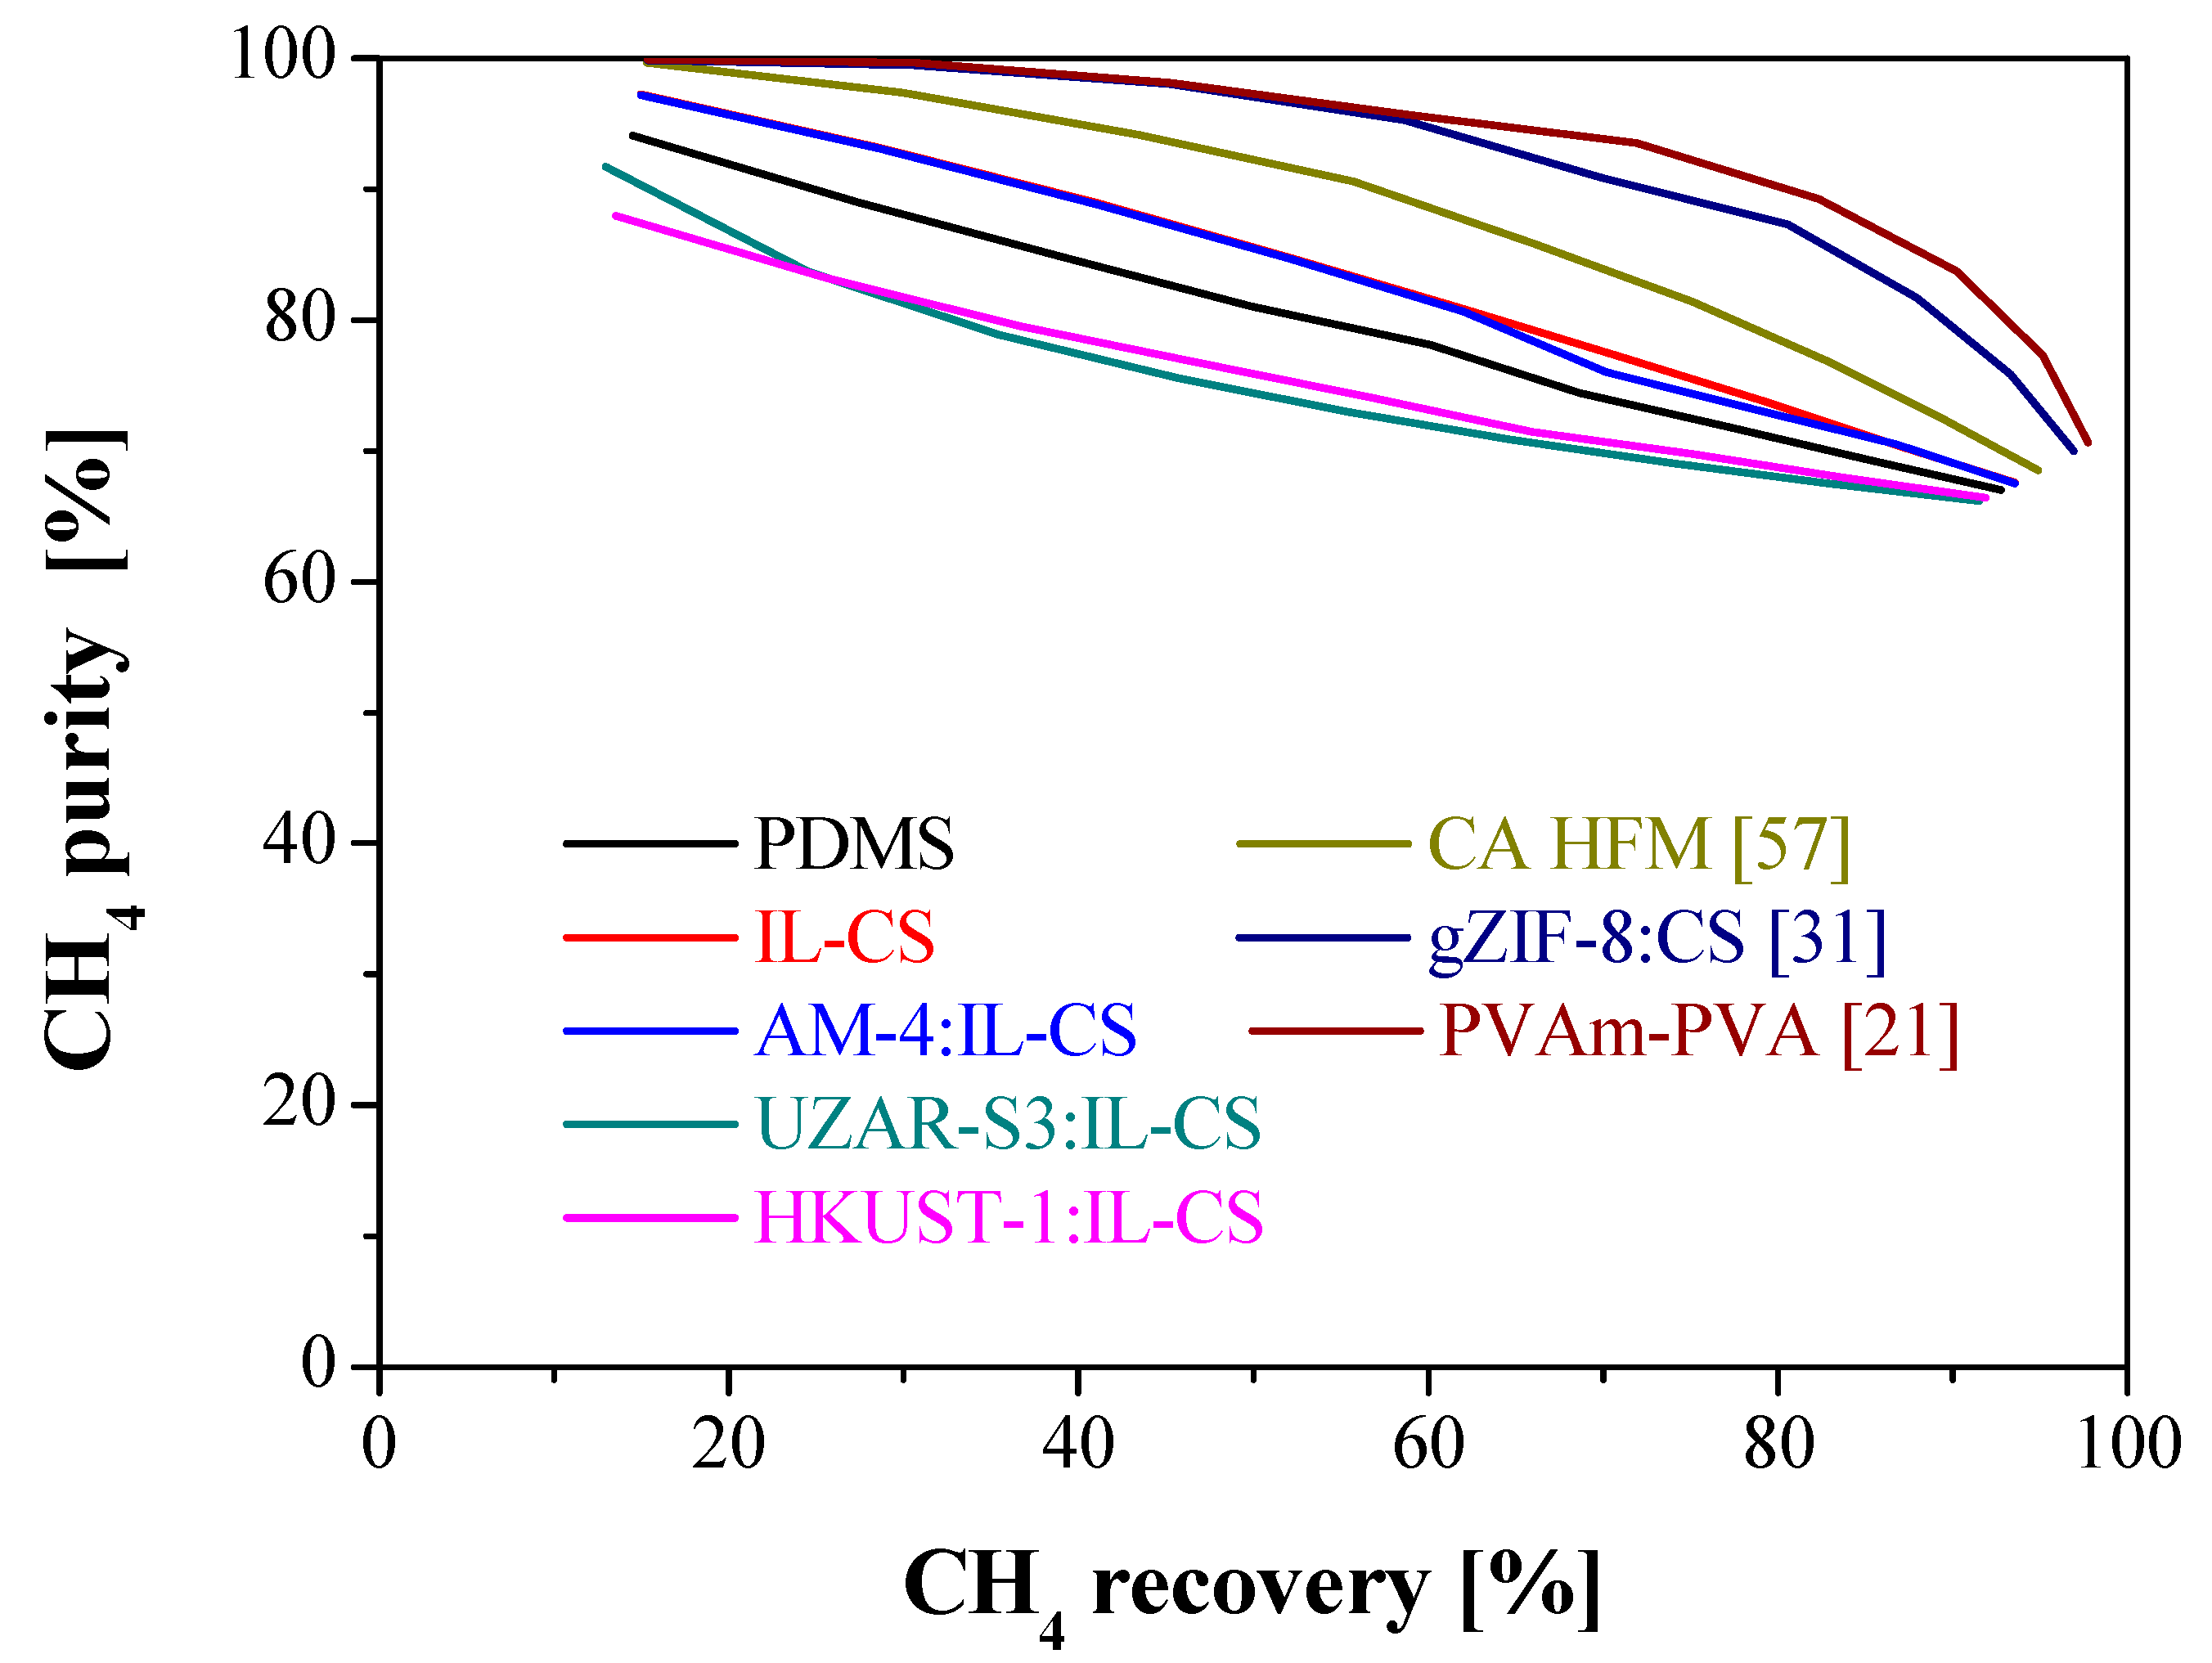
3.3. Comparison with Literature
4. Conclusions
Author Contributions
Funding
Institutional Review Board Statement
Data Availability Statement
Acknowledgments
Conflicts of Interest
Nomenclature
| Symbol | Description |
| AM-4 | Layered titanosilicate |
| A | Membrane area (cm2) |
| Barrer | Unit of permeability (1 barrer = 10−10 cm3 (STP) cm−1 s−1 cmHg−1) |
| CA | Cellulose acetate |
| CH4 | Methane |
| CNC | Crystalline nanocellulose |
| CNTs | Carbon nanotubes |
| CO2 | Carbon dioxide |
| CS | Chitosan |
| [emim][Ac] | 1-ethyl-3-methylimidazolium [emim][Ac] |
| Fr,k | Total molar flowrate of retentate (kmol h−1) in cell k |
| Fp,k | Total molar flowrate of permeate (kmol h−1) in cell k |
| GPU | Unit of permeance (1 GPU = 10−6 cm3 (STP) cm−2 s−1 cmHg−1) |
| HKUST-1 | Metal organic framework (MOF) |
| IL | Ionic liquid |
| l | Selective layer thickness for the separation (mm) |
| MMM | Mixed matrix membrane |
| Ncomp,k | Molar flowrate of each component permeating though the membrane cell k (kmol h−1) |
| NaOH | Sodium hydroxide |
| Na2SiO3 | Sodium silicate |
| Nps | Nanoparticles |
| P | Permeability of the selective membrane layer (Barrer) |
| pr | Retentate pressure (bar) |
| pp | Permeate pressure (bar) |
| PDMS | Polydimethyl siloxane |
| PEG | Polyethylene glycol |
| PES | Polyethersulfone |
| PSf | Polysulfone |
| PU | Polyurethane |
| PVA | Polyvinyl alcohol |
| PVAm | Polyvinyl amine |
| Qp | Permeate flow rate (cm3 (STP) s-1) |
| SnCl2 ·2H2O | Tin(II) chloride di-hydrated |
| TiO2 | Anatase |
| TMC | Trimesoyl chloride |
| UZAR-S3 | Layered stannosilicate |
| αi/j | Selectivity of component i over j |
| xcomp,k | Molar fraction of each component in the permeate |
| ycomp,k | Molar fraction of each component in the retentate |
Appendix A

| Membrane) 1 | Selective Layer Thickness [μm] | CO2 Permeability [Barrer] | CO2/CH4 Selectivity [–] | Reference |
|---|---|---|---|---|
| CA (18 wt%) HF | 50 | 1.26 | 7.9 | [66] |
| CNT (1 wt%)/CA (3 wt%) | 35 | 14.2 | 21.2 | [67] |
| NH2-MIL-53(Al) (15 wt%)/CA (10 wt%) | 52.6 | 28.7 | [68] | |
| PVAm-PVA blend | 0.6 | 31.2 | 30 | [29,65] |
| CNC/PVA | 0.8 | 86 | 43 | [31] |
| CNT (1 wt%)/PVAm-PVA | 1.5 | 129 | 45 | [30] |
| NiO (5 wt%)/PU (10 wt%) | 100 | 321 | 21.76 | [32] |
| IL-PEG-PU | 97.5 | 499 | 44 | [33] |
| SAPO-34 (20 wt%)/PU (3 wt%) | 65 | 28.71 | 25.63 | [35] |
| CS-gC3N4-ZIF-8/PES | 20 | 180 | 24.2 | [40] |
| IL-CS/PES | 14 | 1024 | 16 | [47] |
| HKUST-1(5 wt%)-IL-CS/PES | 67 | 26,872 | 30 | [47] |
| IL-CS/PES | 22.4 | 154 ± 18 | 4.26 | This work |
| AM-4:IL-CS/PES | 52.5 | 287 ± 132 | 4.25 | This work |
| UZAR-S3:IL-CS/PES | 42.5 | 129 ± 19 | 1.88 | This work |
| HKUST-1-IL-CS/PES | 50.4 | 167 ± 32 | 2.21 | This work |
| CO2 in Feed (v%) | Stage-Cut | CO2 Purity in Permeate (%) | CO2 Recovery (%) | AAREpurity (%) | AARErecovery (%) |
|---|---|---|---|---|---|
| 20 | 0.30 | 26.67 ± 0.5 | 39.98 ± 6.08 | 2.60 | 2.67 |
| 35 | 0.31 | 42.55 ± 0.36 | 50.60 ± 2.76 | 16.02 | 13.59 |
| 50 | 0.46 | 57.81 ± 0.52 | 52.99 ± 1.80 | 14.63 | 15.06 |
| 70 | 0.59 | 74.24 ± 0.24 | 62.76 ± 1.82 | 8.62 | 8.31 |
| CH4 in Feed (v%) | Stage-Cut | CH4 Purity in Permeate (%) | CH4 Recovery (%) | AAREpurity (%) | AARErecovery (%) |
|---|---|---|---|---|---|
| 30 | 0.59 | 25.75 ± 0.28 | 50.79 ± 1.47 | 24.84 | 25.05 |
| 50 | 0.46 | 42.19 ± 0.52 | 38.68 ± 1.65 | 20.05 | 19.77 |
| 65 | 0.31 | 57.44 ± 0.36 | 27.25 ± 1.49 | 11.87 | 12.86 |
| 80 | 0.30 | 72.64 ± 0.27 | 30.49 ± 4.39 | 0.95 | 10.67 |
| CO2 in Feed (v%) | Stage-Cut | CO2 Purity in Retentate (%) | CO2 Recovery (%) | AAREpurity (%) | AARErecovery (%) |
|---|---|---|---|---|---|
| 20 | 0.30 | 17.11 ± 0.63 | 60.02 ± 6.10 | 1.82 | 1.99 |
| 35 | 0.31 | 31.63 ± 0.31 | 62.51 ± 2.04 | 9.54 | 9.77 |
| 50 | 0.46 | 43.39 ± 0.50 | 47.01 ± 1.81 | 16.71 | 16.97 |
| 70 | 0.59 | 63.83 ± 0.24 | 37.24 ± 1.82 | 14.46 | 14.13 |
| CH4 in Feed (v%) | Stage-Cut | CH4 Purity in Retentate (%) | CH4 Recovery (%) | AAREpurity (%) | AARErecovery (%) |
|---|---|---|---|---|---|
| 30 | 0.59 | 36.17 ± 0.62 | 49.21 ± 1.47 | 25.52 | 26.07 |
| 50 | 0.46 | 56.61 ± 0.50 | 61.32 ± 1.65 | 12.81 | 12.47 |
| 65 | 0.31 | 68.37 ± 0.30 | 72.75 ± 1.49 | 4.41 | 4.00 |
| 80 | 0.30 | 82.88 ± 0.63 | 72.49 ± 4.39 | 0.38 | 0.41 |
References
- NOAA. Trends in Atmospheric Carbon Dioxide, (n.d.). 24 March 2022. Available online: https://gml.noaa.gov/ccgg/trends/data.html (accessed on 24 March 2022).
- Keairns, D.L.; Darton, R.C.; Irabien, A. The Energy-Water-Food nexus. Annu. Rev. Chem. Biomol. Eng. 2016, 7, 239–262. [Google Scholar] [CrossRef] [PubMed]
- He, Y.; Bagley, D.M.; Leung, K.T.; Liss, S.N.; Liao, B.Q. Recent advances in membrane technologies for biorefining and bioenergy production. Biotechnol. Adv. 2012, 30, 817–858. [Google Scholar] [CrossRef] [PubMed]
- Persson, M.; Jonsson, O.; Wellinger, A. Biogas Upgrading to Vehicle Fuel Standards and Grid. IEA Bioenergy 2007, 37, 1–32. [Google Scholar]
- Awe, O.W.; Zhao, Y.; Nzihou, A.; Minh, D.P.; Lyczko, N. A Review of Biogas Utilisation, Purification and Upgrading Technologies. Waste Biomass Valorization 2017, 8, 267–283. [Google Scholar] [CrossRef] [Green Version]
- Rasi, S.; Läntelä, J.; Rintala, J. Trace compounds affecting biogas energy utilization—A review. Energy Convers. Manag. 2011, 52, 3369–3375. [Google Scholar] [CrossRef]
- Baciocchi, R.; Carnevale, E.; Costa, G.; Gavasci, R.; Lombardi, L.; Olivieri, T.; Zanchi, L.; Zingaretti, D. Performance of a biogas upgrading process based on alkali absorption with regeneration using air pollution control residues. Waste Manag. 2013, 33, 2694–2705. [Google Scholar] [CrossRef]
- Scholz, M.; Melin, T.; Wessling, M. Transforming biogas into biomethane using membrane technology. Renew. Sustain. Energy Rev. 2013, 17, 199–212. [Google Scholar] [CrossRef]
- Merkel, T.C.; Lin, H.; Wei, X.; Baker, R. Power plant post-combustion carbon dioxide capture: An opportunity for membranes. J. Membr. Sci. 2010, 359, 126–139. [Google Scholar] [CrossRef]
- Lin, H.; Daniels, R.; Thompson, S.M.; Amo, K.D.; He, Z.; Merkel, T.C.; Wijmans, J.G. Membrane selective exchange process for dilute methane recovery. J. Membr. Sci. 2014, 469, 11–18. [Google Scholar] [CrossRef]
- Russo, F.; Galiano, F.; Iulianelli, A.; Basile, A.; Figoli, A. Biopolymers for sustainable membranes in CO2 separation: A review. Fuel Process. Technol. 2021, 213, 106643. [Google Scholar] [CrossRef]
- Jusoh, N.; Keng, L.K.; Shariff, A.M. Preparation and characterization of polysulfone membrane for gas separation. Adv. Mater. Res. 2014, 917, 307–316. [Google Scholar] [CrossRef]
- Wind, J.D.; Sirard, S.M.; Paul, D.R.; Green, P.F.; Johnston, K.P.; Koros, W.J. Carbon dioxide-induced plasticization of polyimide membranes: Pseudo-equilibrium relationships of diffusion, sorption, and swelling. Macromolecules 2003, 36, 6433–6441. [Google Scholar] [CrossRef]
- Vu, D.Q.; Koros, W.J.; Miller, S.J. Mixed matrix membranes using carbon molecular sieves I. Preparation and experimental results. J. Membr. Sci. 2003, 211, 311–334. [Google Scholar] [CrossRef]
- Larocca, N.M.; Pessan, L.A. Effect of antiplasticisation on the volumetric, gas sorption and transport properties of polyetherimide. J. Membr. Sci. 2003, 218, 69–92. [Google Scholar] [CrossRef]
- Iqbal, M.; Man, Z.; Mukhtar, H.; Dutta, B.K. Solvent effect on morphology and CO2/CH4 separation performance of asymmetric polycarbonate membranes. J. Membr. Sci. 2008, 318, 167–175. [Google Scholar] [CrossRef]
- Sridhar, S.; Aminabhavi, T.M.; Ramakrishna, M. Separation of binary mixtures of carbon dioxide and methane through sulfonated polycarbonate membranes. J. Appl. Polym. Sci. 2007, 105, 1749–1756. [Google Scholar] [CrossRef]
- Kamble, A.R.; Patel, C.M.; Murthy, Z.V.P. Polyethersulfone based MMMs with 2D materials and ionic liquid for CO2, N2 and CH4 separation. J. Environ. Manag. 2020, 262, 110256. [Google Scholar] [CrossRef]
- Bui, M.; Adjiman, C.S.; Bardow, A.; Anthony, E.J.; Boston, A.; Brown, S.; Fennell, P.S.; Fuss, S.; Galindo, A.; Hackett, L.A.; et al. Carbon capture and storage (CCS): The way forward. Energy Environ. Sci. 2018, 11, 1062–1176. [Google Scholar] [CrossRef] [Green Version]
- Gascon, J.; Kapteijn, F.; Zornoza, B.; Sebastián, V.; Casado, C.; Coronas, J. Practical approach to zeolitic membranes and coatings: State of the art, opportunities, barriers, and future perspectives. Chem. Mater. 2012, 24, 2829–2844. [Google Scholar] [CrossRef]
- Brinkmann, T.; Lillepärg, J.; Notzke, H.; Pohlmann, J.; Shishatskiy, S.; Wind, J.; Wolff, T. Development of CO2 selective poly(ethylene oxide)-based membranes: From laboratory to pilot plant scale. Engineering 2017, 3, 485–493. [Google Scholar] [CrossRef]
- Kai, T.; Kouketsu, T.; Duan, S.; Kazama, S.; Yamada, K. Development of commercial-sized dendrimer composite membrane modules for CO2 removal from flue gas. Sep. Purif. Technol. 2008, 63, 524–530. [Google Scholar] [CrossRef]
- Castro-Muñoz, R.; González-Valdez, J. New trends in biopolymer-based membranes for pervaporation. Molecules 2019, 24, 3584. [Google Scholar] [CrossRef] [PubMed] [Green Version]
- Borgohain, R.; Pattnaik, U.; Prasad, B.; Mandal, B. A review on chitosan-based membranes for sustainable CO2 separation applications: Mechanism, issues, and the way forward. Carbohydr. Polym. 2021, 267, 118178. [Google Scholar] [CrossRef]
- Moghadassi, A.R.; Rajabi, Z.; Hosseini, S.M.; Mohammadi, M. Fabrication and modification of cellulose acetate based mixed matrix membrane: Gas separation and physical properties. J. Ind. Eng. Chem. 2014, 20, 1050–1060. [Google Scholar] [CrossRef]
- Mubashir, M.; Yeong, Y.F.; Lau, K.K.; Chew, T.L.; Norwahyu, J. Efficient CO2/N2 and CO2/CH4 separation using NH2-MIL-53(Al)/cellulose acetate (CA) mixed matrix membranes. Sep. Purif. Technol. 2018, 199, 140–151. [Google Scholar] [CrossRef]
- Lai, C.L.; Chen, J.T.; Fu, Y.J.; Liu, W.R.; Zhong, Y.R.; Huang, S.H.; Hung, W.S.; Lue, S.J.; Hu, C.C.; Lee, K.R. Bio-inspired cross-linking with borate for enhancing gas-barrier properties of poly(vinyl alcohol)/graphene oxide composite films. Carbon 2015, 82, 513–522. [Google Scholar] [CrossRef]
- Alshahrani, A.A.; AlQahtani, M.; Almushaikeh, A.M.; Hassan, H.M.A.; Alzaid, M.; Alrashidi, A.N.; Alsohaimi, I.H. Synthesis, characterization, and heavy-ion rejection rate efficiency of PVA/MWCNTs and Triton X-100/MWCNTs Buckypaper membranes. J. Mater. Res. Technol. 2022, 18, 2310–2319. [Google Scholar] [CrossRef]
- Deng, L.; Hägg, M.B. Fabrication and evaluation of a blend facilitated transport membrane for CO2/CH4 separation. Ind. Eng. Chem. Res. 2015, 54, 11139–11150. [Google Scholar] [CrossRef]
- Deng, L.; Hägg, M.B. Carbon nanotube reinforced PVAm/PVA blend FSC nanocomposite membrane for CO2/CH4 separation. Int. J. Greenh. Gas Control 2014, 26, 127–134. [Google Scholar] [CrossRef]
- Jahan, Z.; Niazi, M.B.K.; Hägg, M.B.; Gregersen, Ø.W. Cellulose nanocrystal/PVA nanocomposite membranes for CO2/CH4 separation at high pressure. J. Membr. Sci. 2018, 554, 275–281. [Google Scholar] [CrossRef]
- Molki, B.; Aframehr, W.M.; Bagheri, R.; Salimi, J. Mixed matrix membranes of polyurethane with nickel oxide nanoparticles for CO2 gas separation. J. Membr. Sci. 2018, 549, 588–601. [Google Scholar] [CrossRef]
- Ghadimi, A.; Gharibi, R.; Yeganeh, H.; Sadatnia, B. Ionic liquid tethered PEG-based polyurethane-siloxane membranes for efficient CO2/CH4 separation. Mater. Sci. Eng. C 2019, 102, 524–535. [Google Scholar] [CrossRef] [PubMed]
- Deng, J.; Bai, L.; Zeng, S.; Zhang, X.; Nie, Y.; Deng, L.; Zhang, S. Ether-functionalized ionic liquid based composite membranes for carbon dioxide separation. RSC Adv. 2016, 6, 45184–45192. [Google Scholar] [CrossRef]
- Sodeifian, G.; Raji, M.; Asghari, M.; Rezakazemi, M.; Dashti, A. Polyurethane-SAPO-34 mixed matrix membrane for CO2/CH4 and CO2/N2 separation. Chin. J. Chem. Eng. 2019, 27, 322–334. [Google Scholar] [CrossRef]
- Casado-Coterillo, C.; Garea, A.; Irabien, Á. Effect of water and organic pollutant in CO2/CH4 separation using hydrophilic and hydrophobic composite membranes. Membranes 2020, 10, 405. [Google Scholar] [CrossRef]
- Prasad, B.; Mandal, B. Moisture responsive and CO2 selective biopolymer membrane containing silk fibroin as a green carrier for facilitated transport of CO2. J. Membr. Sci. 2018, 550, 416–426. [Google Scholar] [CrossRef]
- Saedi, S.; Madaeni, S.S.; Hassanzadeh, K.; Shamsabadi, A.A.; Laki, S. The effect of polyurethane on the structure and performance of PES membrane for separation of carbon dioxide from methane. J. Ind. Eng. Chem. 2014, 20, 1916–1929. [Google Scholar] [CrossRef]
- Iovane, P.; Nanna, F.; Ding, Y.; Bikson, B.; Molino, A. Experimental test with polymeric membrane for the biogas purification from CO2 and H2S. Fuel 2014, 135, 352–358. [Google Scholar] [CrossRef]
- Jomekian, A.; Bazooyar, B.; Esmaeilzadeh, J.; Behbahani, R.M. Highly CO2 selective chitosan/g-C3N4/ZIF-8 membrane on polyethersulfone microporous substrate. Sep. Purif. Technol. 2020, 236, 116307. [Google Scholar] [CrossRef]
- Santos, E.; Rodríguez-Fernández, E.; Casado-Coterillo, C.; Irabien, Á. Hybrid ionic liquid-chitosan membranes for CO2 separation: Mechanical and thermal behavior. Int. J. Chem. React. Eng. 2016, 14, 713–718. [Google Scholar] [CrossRef]
- Galizia, M.; Chi, W.S.; Smith, Z.P.; Merkel, T.C.; Baker, R.W.; Freeman, B.D. 50th anniversary perspective: Polymers and mixed matrix membranes for gas and vapor separation: A review and prospective opportunities. Macromolecules 2017, 50, 7809–7843. [Google Scholar] [CrossRef]
- Casado-Coterillo, C.; Del Mar López-Guerrero, M.; Irabien, Á. Synthesis and characterisation of ETS-10/acetate-based ionic liquid/chitosan mixed matrix membranes for CO2/N2 permeation. Membranes 2014, 4, 287–301. [Google Scholar] [CrossRef] [PubMed] [Green Version]
- Casado-Coterillo, C.; Fernández-Barquín, A.; Zornoza, B.; Téllez, C.; Coronas, J.; Irabien, Á. Synthesis and characterisation of MOF/ionic liquid/chitosan mixed matrix membranes for CO2/N2 separation. RSC Adv. 2015, 5, 102350–102361. [Google Scholar] [CrossRef] [Green Version]
- Bernardo, P.; Drioli, E.; Golemme, G. Membrane gas separation: A review/state of the art. Ind. Eng. Chem. Res. 2009, 48, 4638–4663. [Google Scholar] [CrossRef]
- Fernández-Barquín, A.; Casado-Coterillo, C.; Etxeberria-Benavides, M.; Zuñiga, J.; Irabien, A. Comparison of Flat and Hollow-Fiber Mixed-Matrix Composite Membranes for CO2 Separation with Temperature. Chem. Eng. Technol. 2017, 40, 997–1007. [Google Scholar] [CrossRef] [Green Version]
- Casado-Coterillo, C.; Fernández-Barquín, A.; Irabien, A. Effect of humidity on CO2/N2 and CO2/CH4 separation using novel robust mixed matrix composite hollow fiber membranes: Experimental and model evaluation. Membranes 2020, 10, 6. [Google Scholar] [CrossRef] [Green Version]
- Ahmadi, M.; Janakiram, S.; Dai, Z.; Ansaloni, L.; Deng, L. Performance of mixed matrix membranes containing porous two-dimensional (2D) and three-dimensional (3D) fillers for CO2 separation: A review. Membranes 2018, 8, 50. [Google Scholar] [CrossRef] [Green Version]
- Marcos-Madrazo, A.; Casado-Coterillo, C.; García-Cruz, L.; Iniesta, J.; Simonelli, L.; Sebastián, V.; Encabo-Berzosa, M.D.M.; Arruebo, M.; Irabien, Á. Preparation and identification of optimal synthesis conditions for a novel alkaline anion-exchange membrane. Polymers 2018, 10, 913. [Google Scholar] [CrossRef] [Green Version]
- Casado, C.; Ambroj, D.; Mayoral, Á.; Vispe, E.; Téllez, C.; Coronas, J. Synthesis, swelling, and exfoliation of microporous lamellar titanosilicate AM-4. Eur. J. Inorg. Chem. 2011, 4, 2247–2253. [Google Scholar] [CrossRef] [Green Version]
- Rubio, C.; Murillo, B.; Casado-Coterillo, C.; Mayoral, A.; Téllez, C.; Coronas, J.; Berenguer-Murcia, A.; Cazorla-Amoros, D. Development of exfoliated layered stannosilicate for hydrogen adsorption. Int. J. Hydrog. Energy 2014, 39, 13180–13188. [Google Scholar] [CrossRef] [Green Version]
- Tao, J.; Wang, J.; Zhu, L.; Chen, X. Integrated design of multi-stage membrane separation for landfill gas with uncertain feed. J. Membr. Sci. 2019, 590, 117260. [Google Scholar] [CrossRef]
- Hussain, A.; Nasir, H.; Ahsan, M. Process design analyses of CO2 capture from natural gas by polymer membrane. J. Chem. Soc. Pak. 2014, 36, 411–421. [Google Scholar]
- Wijmans, J.G.; Baker, R.W. The solution-diffusion model: A review. J. Membr. Sci. 1995, 107, 1–21. [Google Scholar] [CrossRef]
- Rezakazemi, M.; Heydari, I.; Zhang, Z. Hybrid systems: Combining membrane and absorption technologies leads to more efficient acid gases (CO2 and H2S) removal from natural gas. J. CO2 Util. 2017, 18, 362–369. [Google Scholar] [CrossRef]
- Abejon, R.; Casado-Coterillo, C.; Garea, A. Multiobjective Optimization Based on “Distance-to-Target” Approach of Membrane Units for Separation of CO2/CH4. Processes 2021, 9, 1871. [Google Scholar] [CrossRef]
- Robeson, L.M. The upper bound revisited. J. Membr. Sci. 2008, 320, 390–400. [Google Scholar] [CrossRef]
- Lin, H.; Yavari, M. Upper bound of polymeric membranes for mixed-gas CO2/CH4 separations. J. Membr. Sci. 2015, 475, 101–109. [Google Scholar] [CrossRef]
- Comesaña-Gándara, B.; Chen, J.; Bezzu, C.G.; Carta, M.; Rose, I.; Ferrari, M.C.; Esposito, E.; Fuoco, A.; Jansen, J.C.; McKeown, N.B. Redefining the Robeson upper bounds for CO2/CH4 and CO2/N2 separations using a series of ultrapermeable benzotriptycene-based polymers of intrinsic microporosity. Energy Environ. Sci. 2019, 12, 2733–2740. [Google Scholar] [CrossRef] [Green Version]
- Fernández-Barquín, A.; Rea, R.; Venturi, D.; Giacinti-Baschetti, M.; de Angelis, M.G.; Casado-Coterillo, C.; Irabien, Á. Effect of relative humidity on the gas transport properties of zeolite A/PTMSP mixed matrix membranes. RSC Adv. 2018, 8, 3536–3546. [Google Scholar] [CrossRef] [Green Version]
- Reijerkerk, S.R.; Jordana, R.; Nijmeijer, K.; Wessling, M. Highly hydrophilic, rubbery membranes for CO2 capture and dehydration of flue gas. Int. J. Greenh. Gas Control 2011, 5, 26–36. [Google Scholar] [CrossRef]
- Dai, Z.; Deng, J.; Yu, Q.; Helberg, R.M.L.; Janakiram, S.; Ansaloni, L.; Deng, L. Fabrication and evaluation of bio-based nanocomposite TFC hollow fiber membranes for enhanced CO2 capture. ACS Appl. Mater. Interfaces 2019, 11, 10874–10882. [Google Scholar] [CrossRef] [PubMed]
- López Guerrero, M.D.M.; Casado-Coterillo, C.; Irabien, A. Synergistic Effect of Combining Titanosilicate and 1-Ethyl-3-Methylimidazolium Acetate in Mixed Matrix Membranes for Efficient CO2 Separation. Eur. J. Sustain. Dev. 2015, 4, 103–112. [Google Scholar] [CrossRef] [Green Version]
- Nguyen, L.N.; Kumar, J.; Vu, M.T.; Mohammed, J.A.H.; Pathak, N.; Commault, A.S.; Sutherland, D.; Zdarta, J.; Tyagi, V.K.; Nghiem, L.D. Biomethane production from anaerobic co-digestion at wastewater treatment plants: A critical review on development and innovations in biogas upgrading techniques. Sci. Total Environ. 2021, 765, 142753. [Google Scholar] [CrossRef]
- Washim Uddin, M.; Hägg, M.B. Effect of monoethylene glycol and triethylene glycol contamination on CO2/CH4 separation of a facilitated transport membrane for natural gas sweetening. J. Membr. Sci. 2012, 423–424, 150–158. [Google Scholar] [CrossRef]
- Mubashir, M.; Yeong, Y.F.; Lau, K.K.; Chew, T.L. Effect of spinning conditions on the fabrication of cellulose acetate hollow fiber membrane for CO2 separation from N2 and CH4. Polym. Test. 2019, 73, 1–11. [Google Scholar] [CrossRef]
- Moghadassi, A.R.; Rajabi, Z.; Hosseini, S.M.; Mohammadi, M. Preparation and characterization of polycarbonate-blend-raw/functionalized multi-walled Carbon nano Tubes mixed matrix membrane for CO2 separation. Sep. Sci. Technol. 2013, 48, 1261–1271. [Google Scholar] [CrossRef]
- Mubashir, M.; Yeong, Y.F.; Chew, T.L.; Lau, K.K. Optimization of spinning parameters on the fabrication of NH2-MIL-53(Al)/cellulose acetate (CA) hollow fiber mixed matrix membrane for CO2 separation. Sep. Purif. Technol. 2019, 215, 32–43. [Google Scholar] [CrossRef]


| Membrane | Thickness (µm) | Weight (g) | WU (%) | SD (%) | ||
|---|---|---|---|---|---|---|
| Dry | Wet | Dry | Wet | |||
| PES | 132 | 0.072 | ||||
| IL:CS/PES (PDMS) a | 151 ± 10 | 215 ± 50 | 0.225 ± 0.06 | 0.349 ± 0.052 | 55 ± 17 | 42 ± 27 |
| IL:CS/PES (TMC) b | 144 ± 4.4 | 237 ± 42 | 0.229 ± 0.028 | 0.341 ± 0.047 | 49 ± 12 | 64 ± 28 |
| AM-4:IL-CS/PES | 173 ± 22 | 222 ± 15 | 0.137 ± 0.004 | 0.223 ± 0.015 | 63 ± 9.4 | 28 ± 9.1 |
| UZAR-S3:IL-CS/PES | 174 ± 0.1 | 194 ± 4.9 | 0.136 ± 0.002 | 0.209 ± 0.007 | 54 ± 2.8 | 11 ± 2.4 |
| HKUST-1:IL-CS/PES | 180 ± 2.8 | 214 ± 6.3 | 0.134 ± 0.007 | 0.256 ± 0.006 | 90 ± 5.3 | 19 ± 1.7 |
Publisher’s Note: MDPI stays neutral with regard to jurisdictional claims in published maps and institutional affiliations. |
© 2022 by the authors. Licensee MDPI, Basel, Switzerland. This article is an open access article distributed under the terms and conditions of the Creative Commons Attribution (CC BY) license (https://creativecommons.org/licenses/by/4.0/).
Share and Cite
Torre-Celeizabal, A.; Casado-Coterillo, C.; Garea, A. Biopolymer-Based Mixed Matrix Membranes (MMMs) for CO2/CH4 Separation: Experimental and Modeling Evaluation. Membranes 2022, 12, 561. https://doi.org/10.3390/membranes12060561
Torre-Celeizabal A, Casado-Coterillo C, Garea A. Biopolymer-Based Mixed Matrix Membranes (MMMs) for CO2/CH4 Separation: Experimental and Modeling Evaluation. Membranes. 2022; 12(6):561. https://doi.org/10.3390/membranes12060561
Chicago/Turabian StyleTorre-Celeizabal, Andrea, Clara Casado-Coterillo, and Aurora Garea. 2022. "Biopolymer-Based Mixed Matrix Membranes (MMMs) for CO2/CH4 Separation: Experimental and Modeling Evaluation" Membranes 12, no. 6: 561. https://doi.org/10.3390/membranes12060561