
PAC-UF Process Improving Surface Water Treatment: PAC Effects and Membrane Fouling Mechanism

 ,
, 
Abstract
:1. Introduction
2. Materials and Methodologies
2.1. PAC
2.2. Source Water
2.3. PAC-UF Experimental Setup
2.4. Membrane Cleaning Protocol
2.5. Analytical Methods
2.5.1. Extracellular Polymeric Substances (EPS)
2.5.2. Determination of Relative Molecular Weight Distribution
2.5.3. Three-Dimensional Excitation-Emission Matrix (EEM) Fluorescence Spectroscopy
2.5.4. Separation of Hydrophilic and Hydrophobic Components
3. Results and Discussion
3.1. Membrane Operating Conditions and Variations in Organic Matter
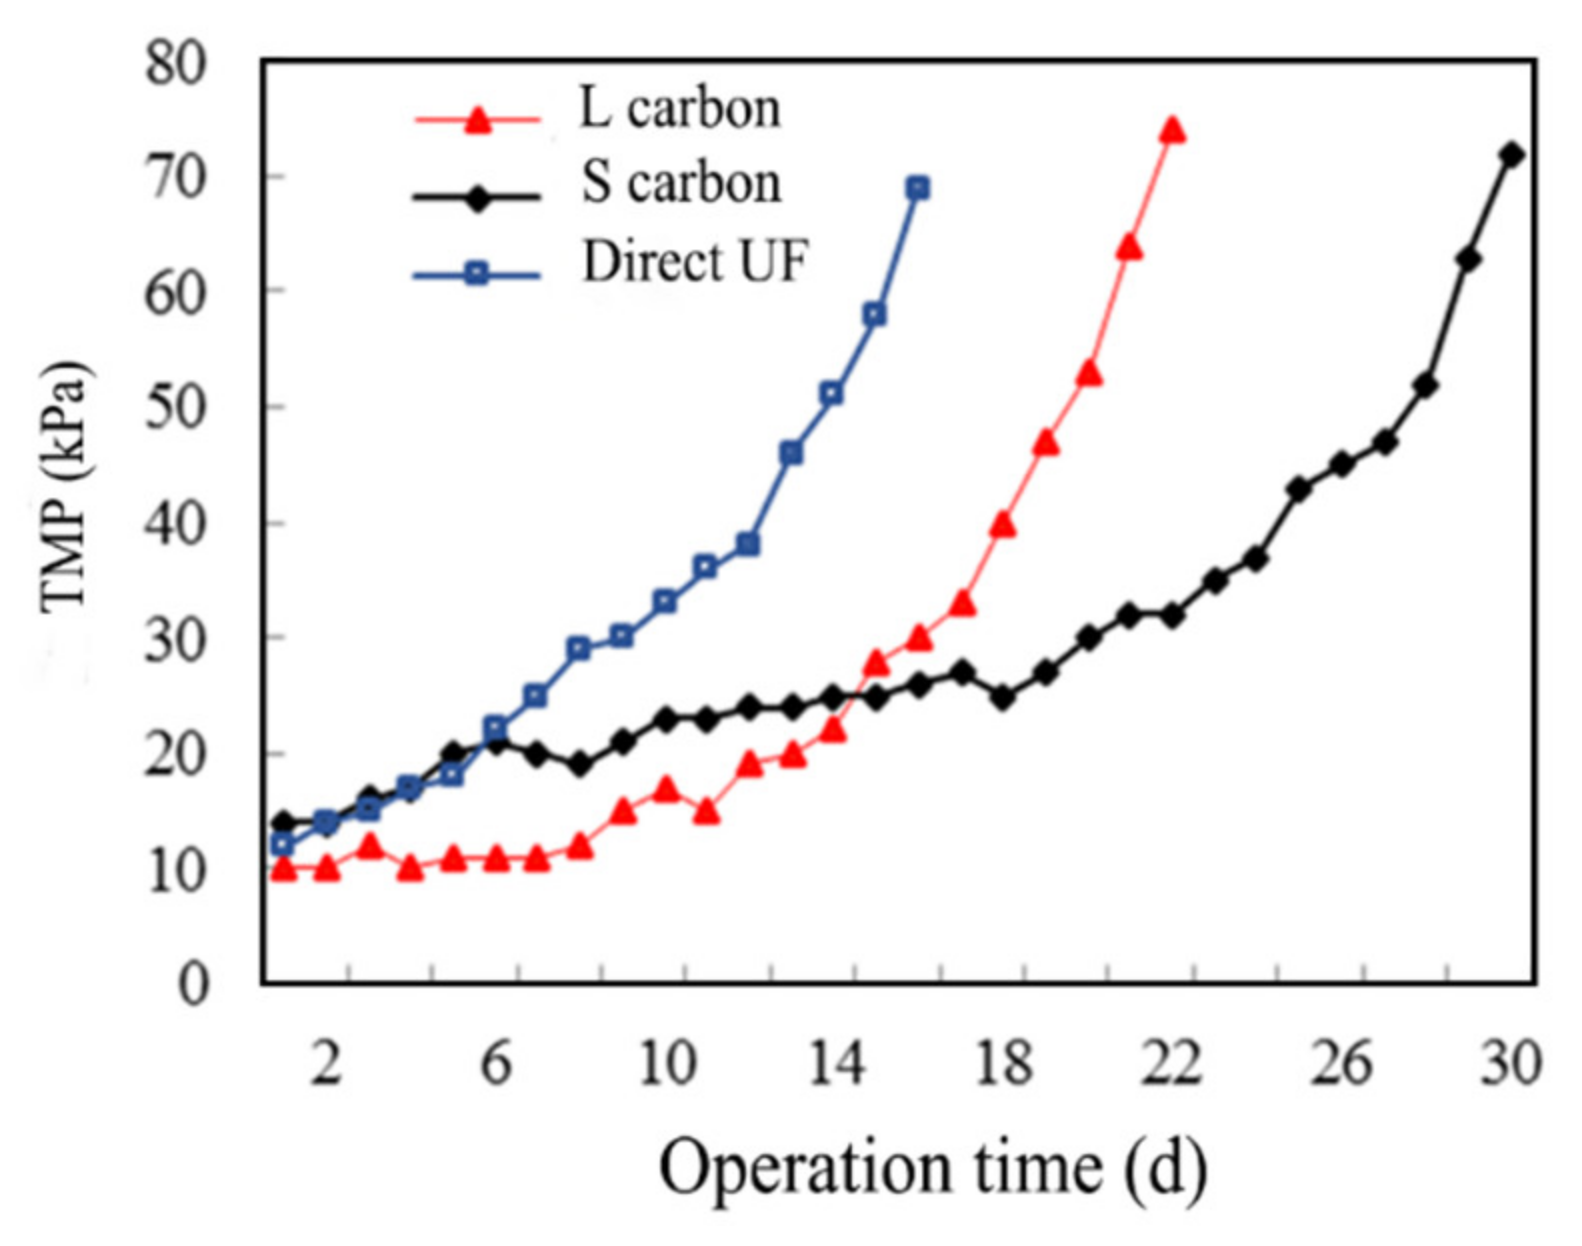
3.1.1. Effect of Filtration Performance and Variation in Organic Matter Removal
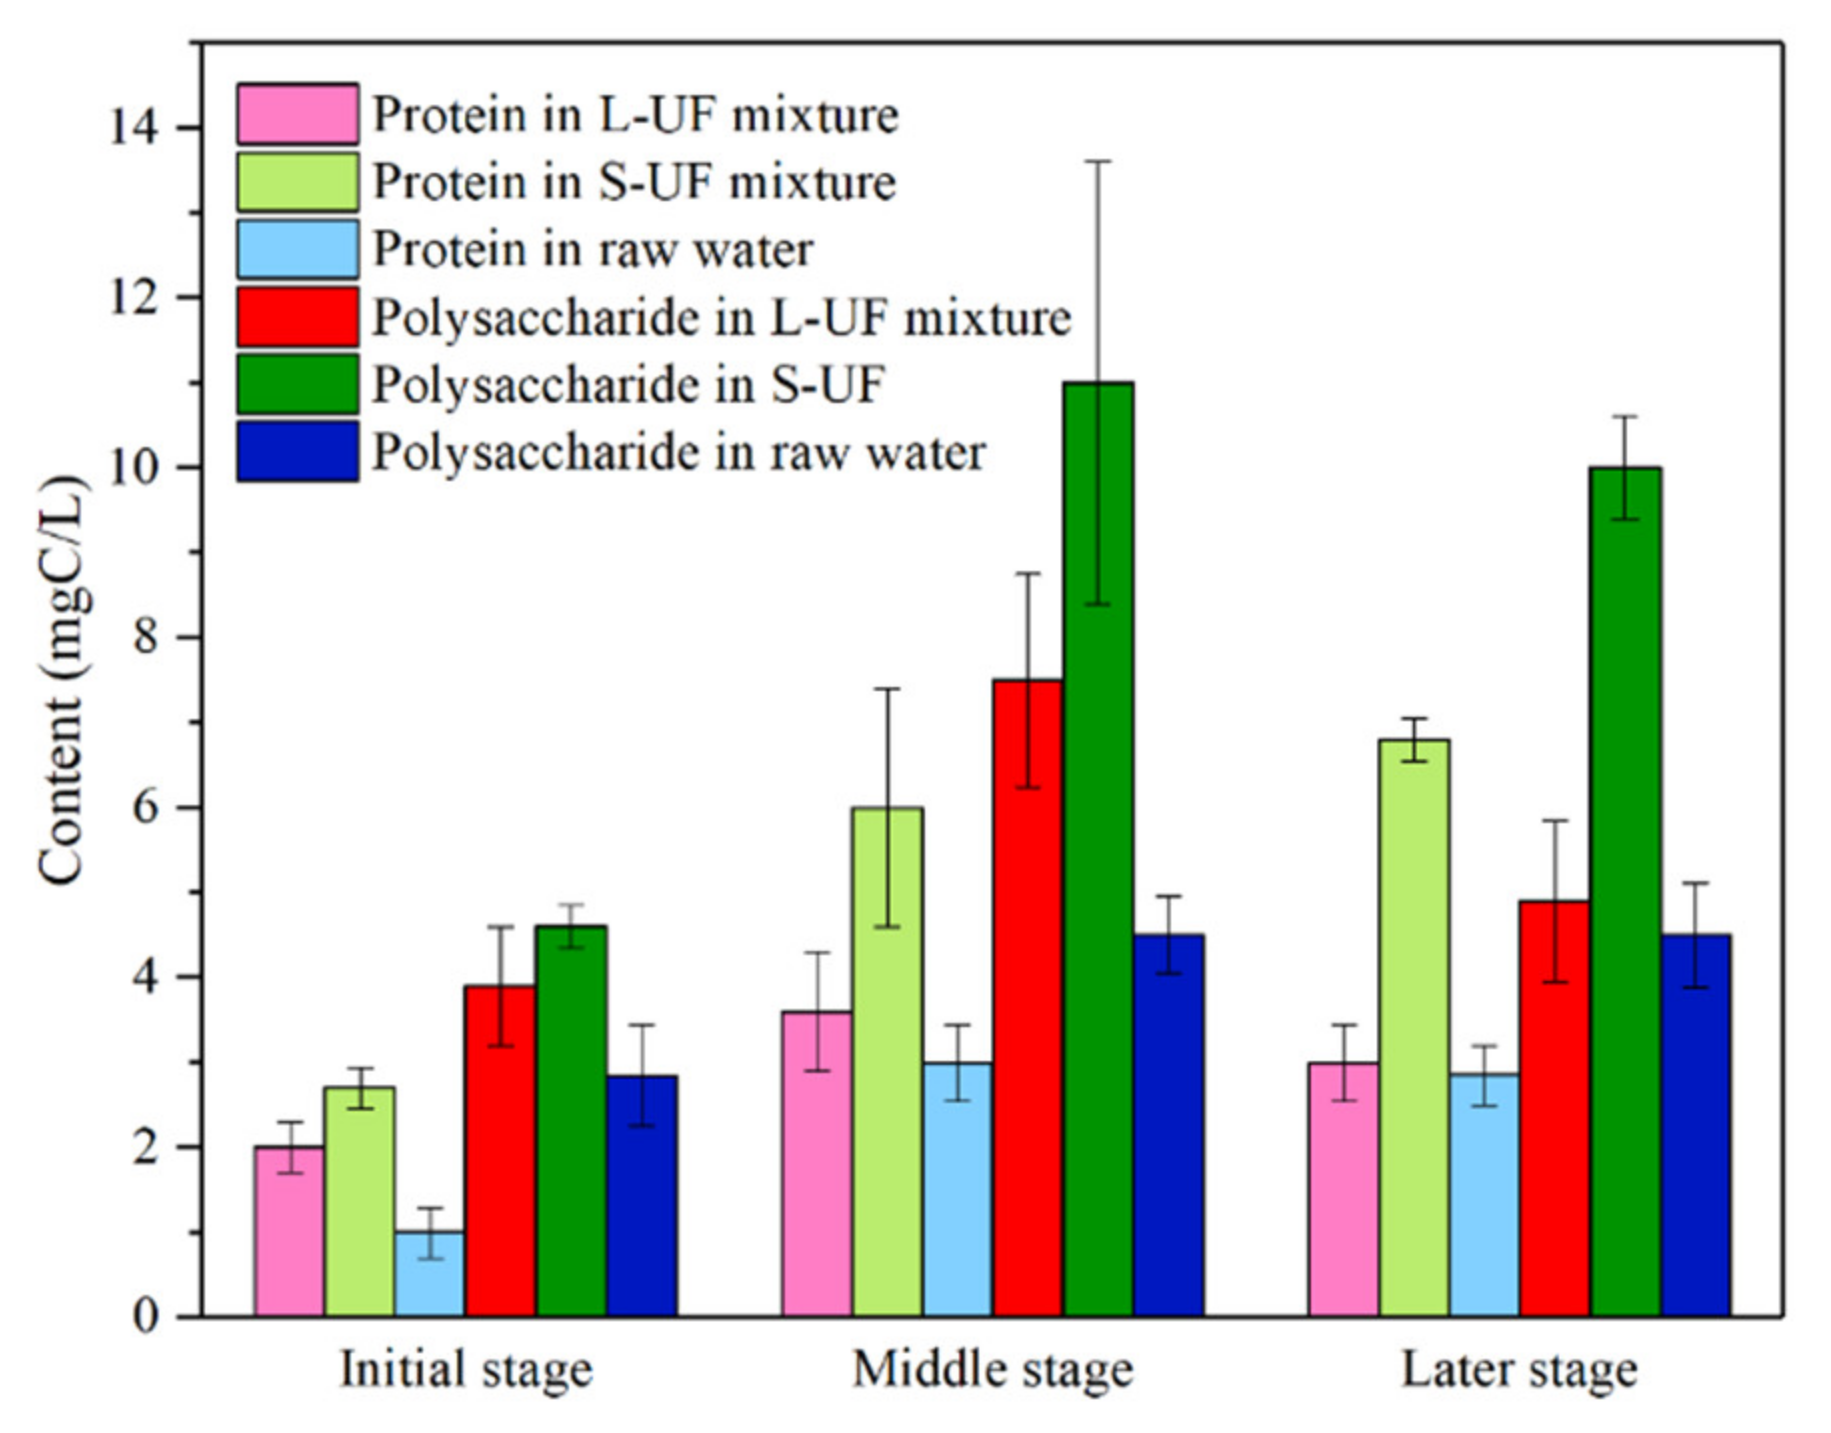
3.1.2. EPS Variation
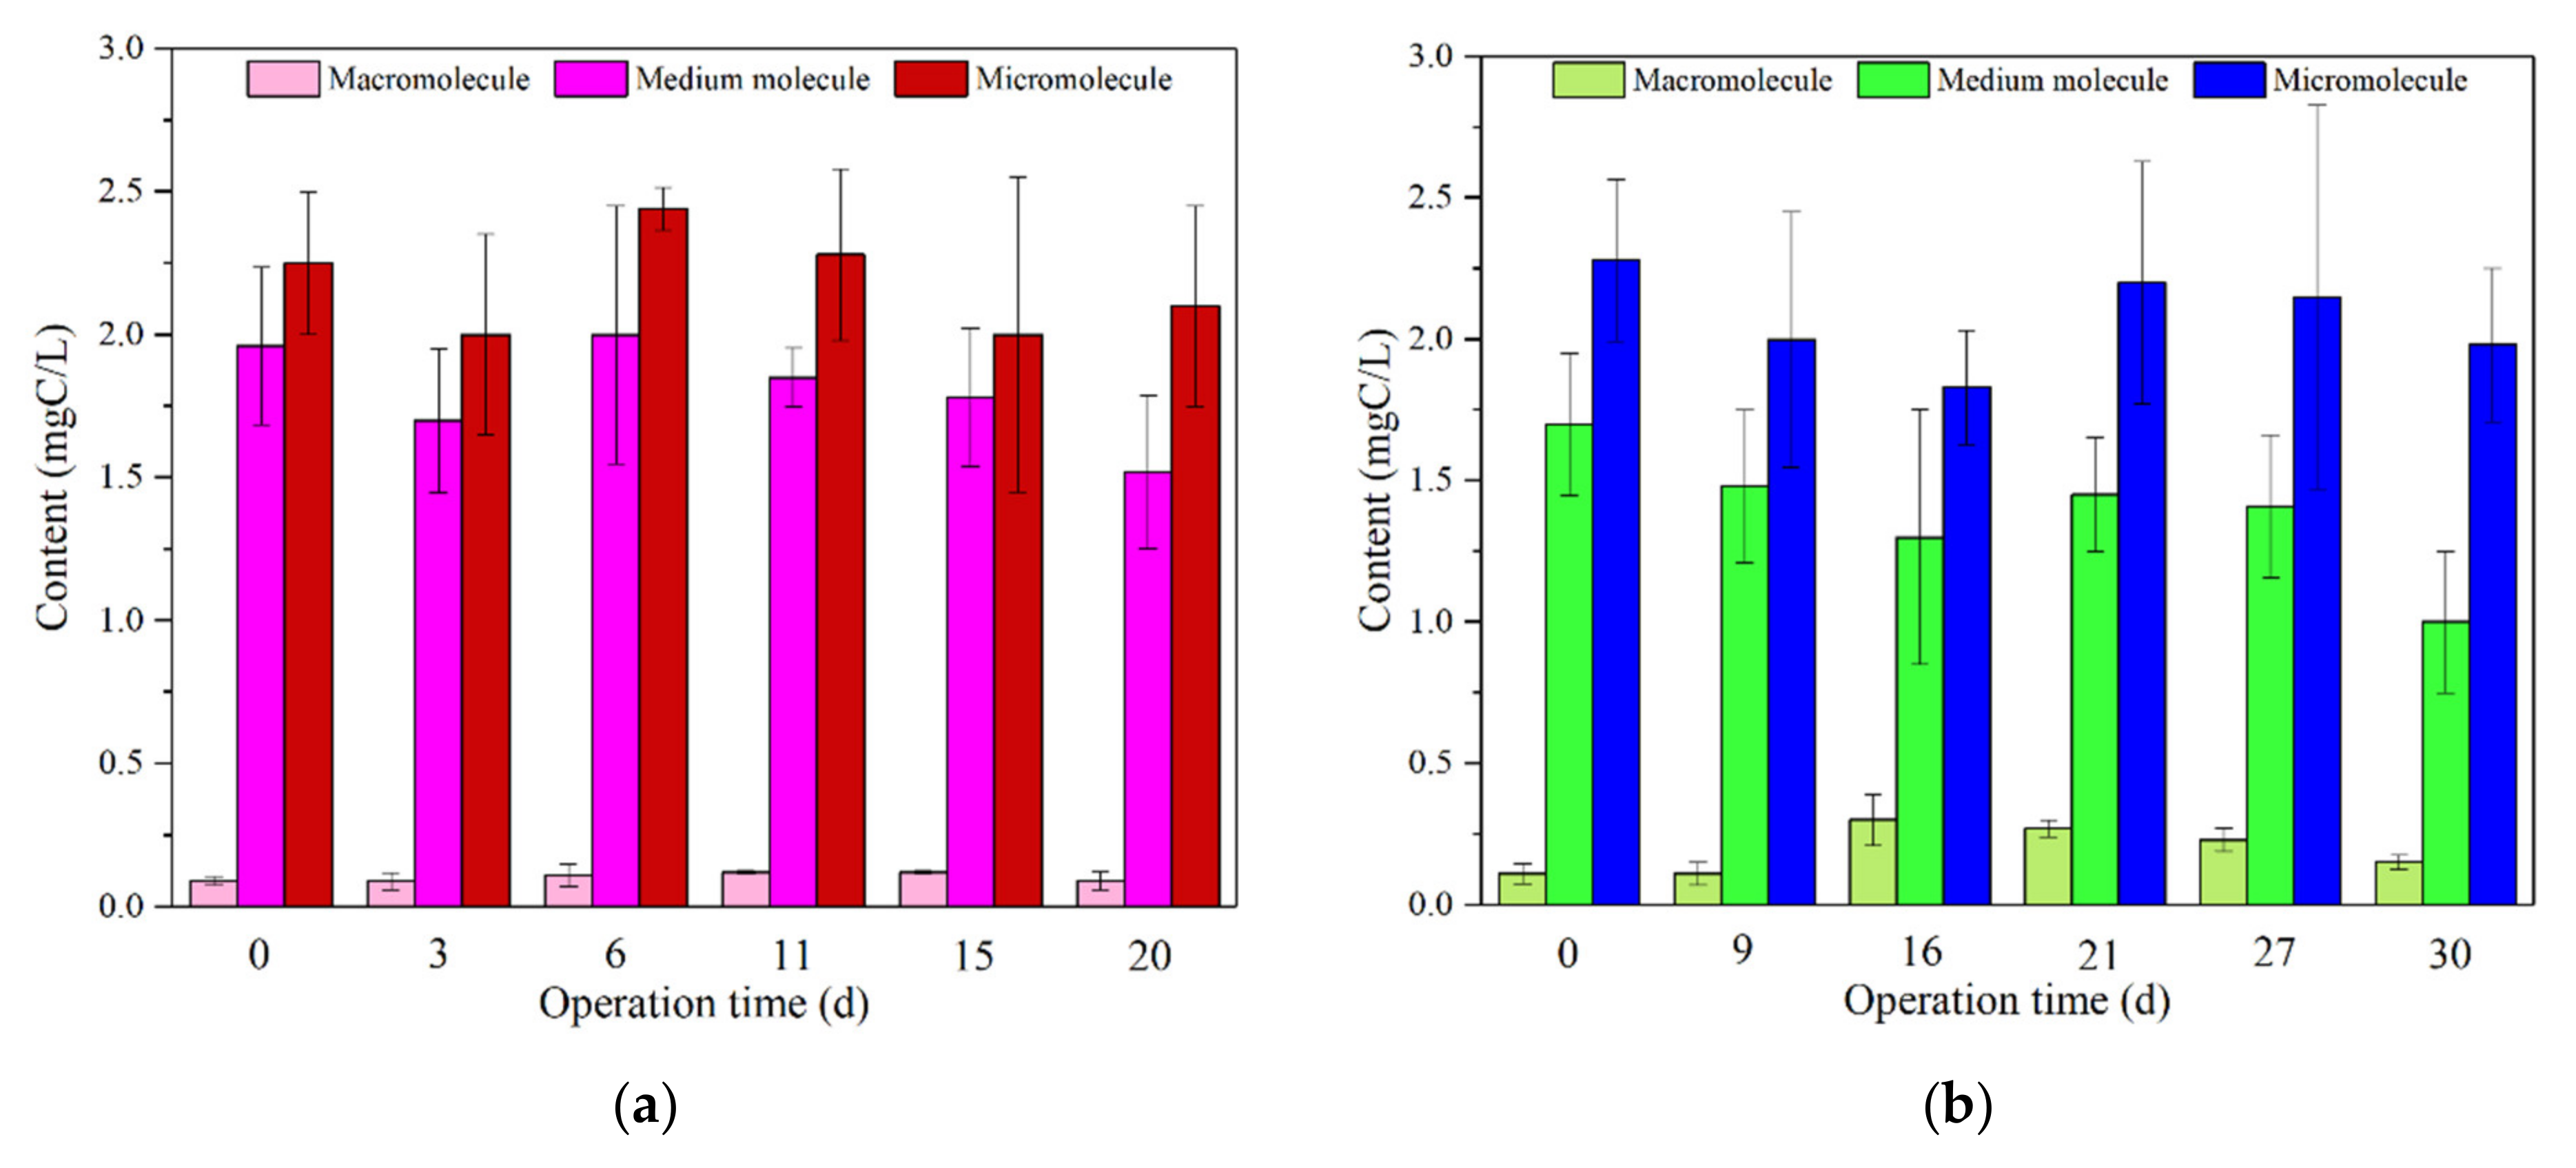
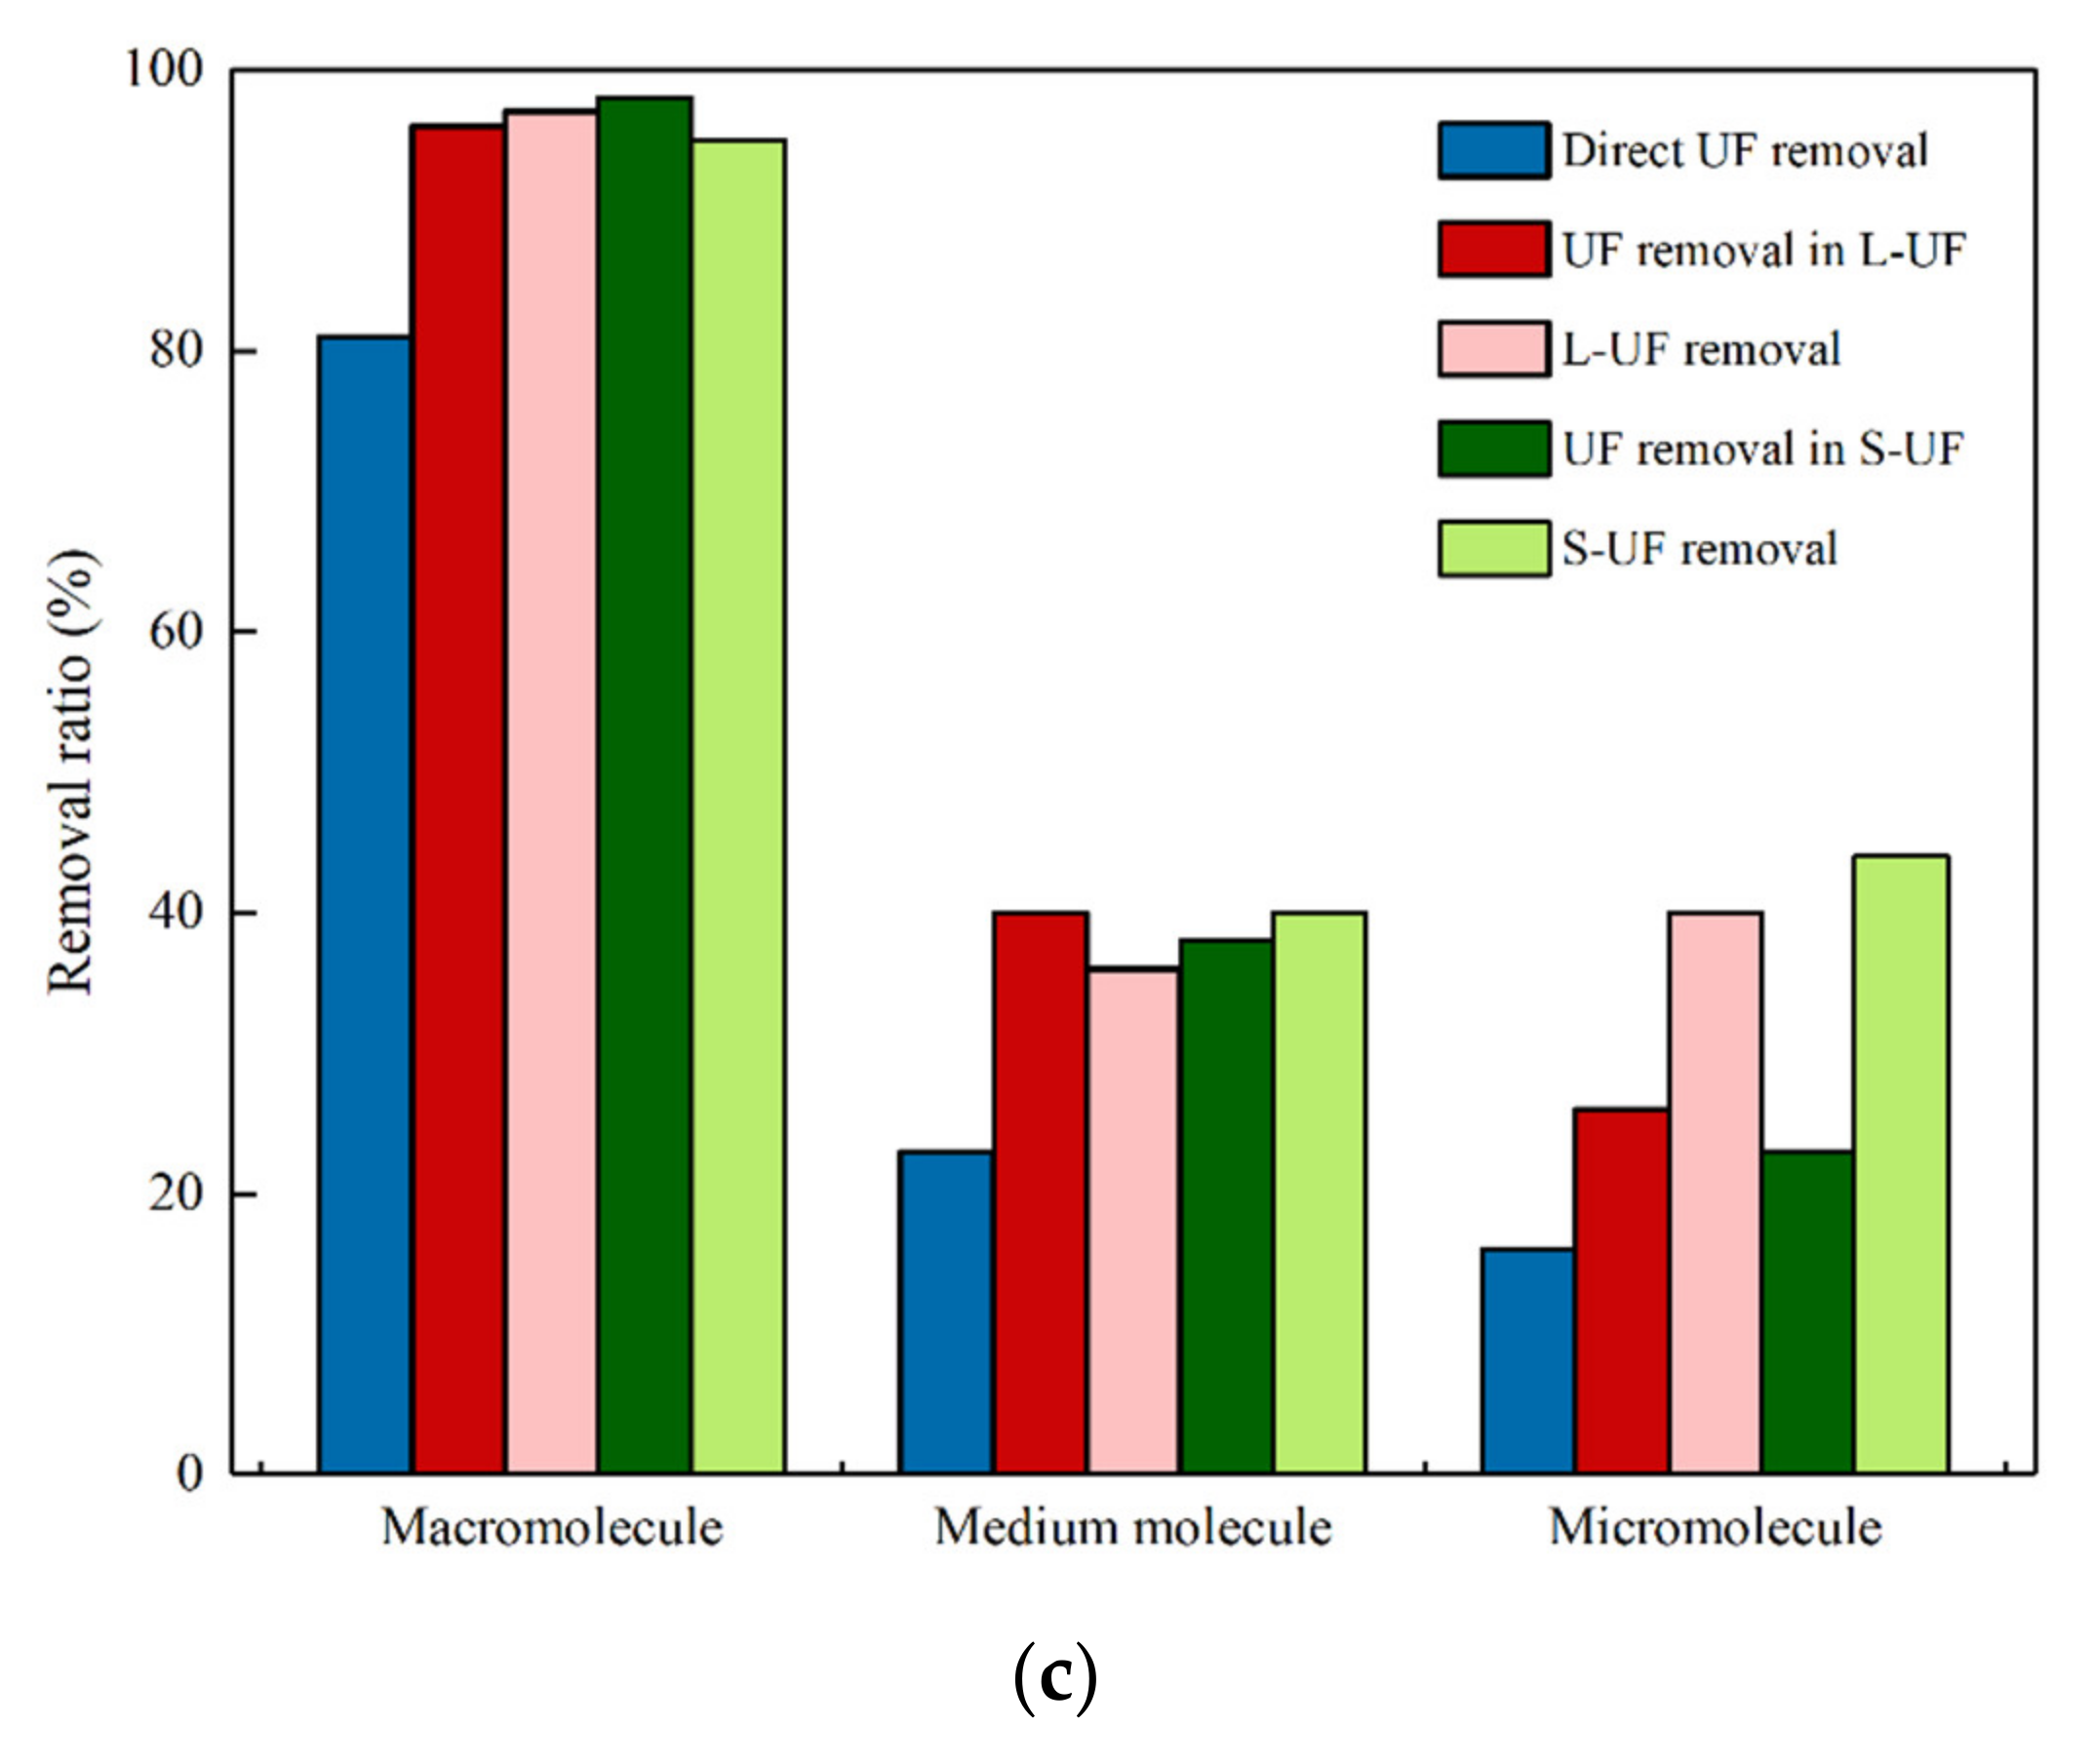
3.1.3. Molecular Weight (MW) Distribution
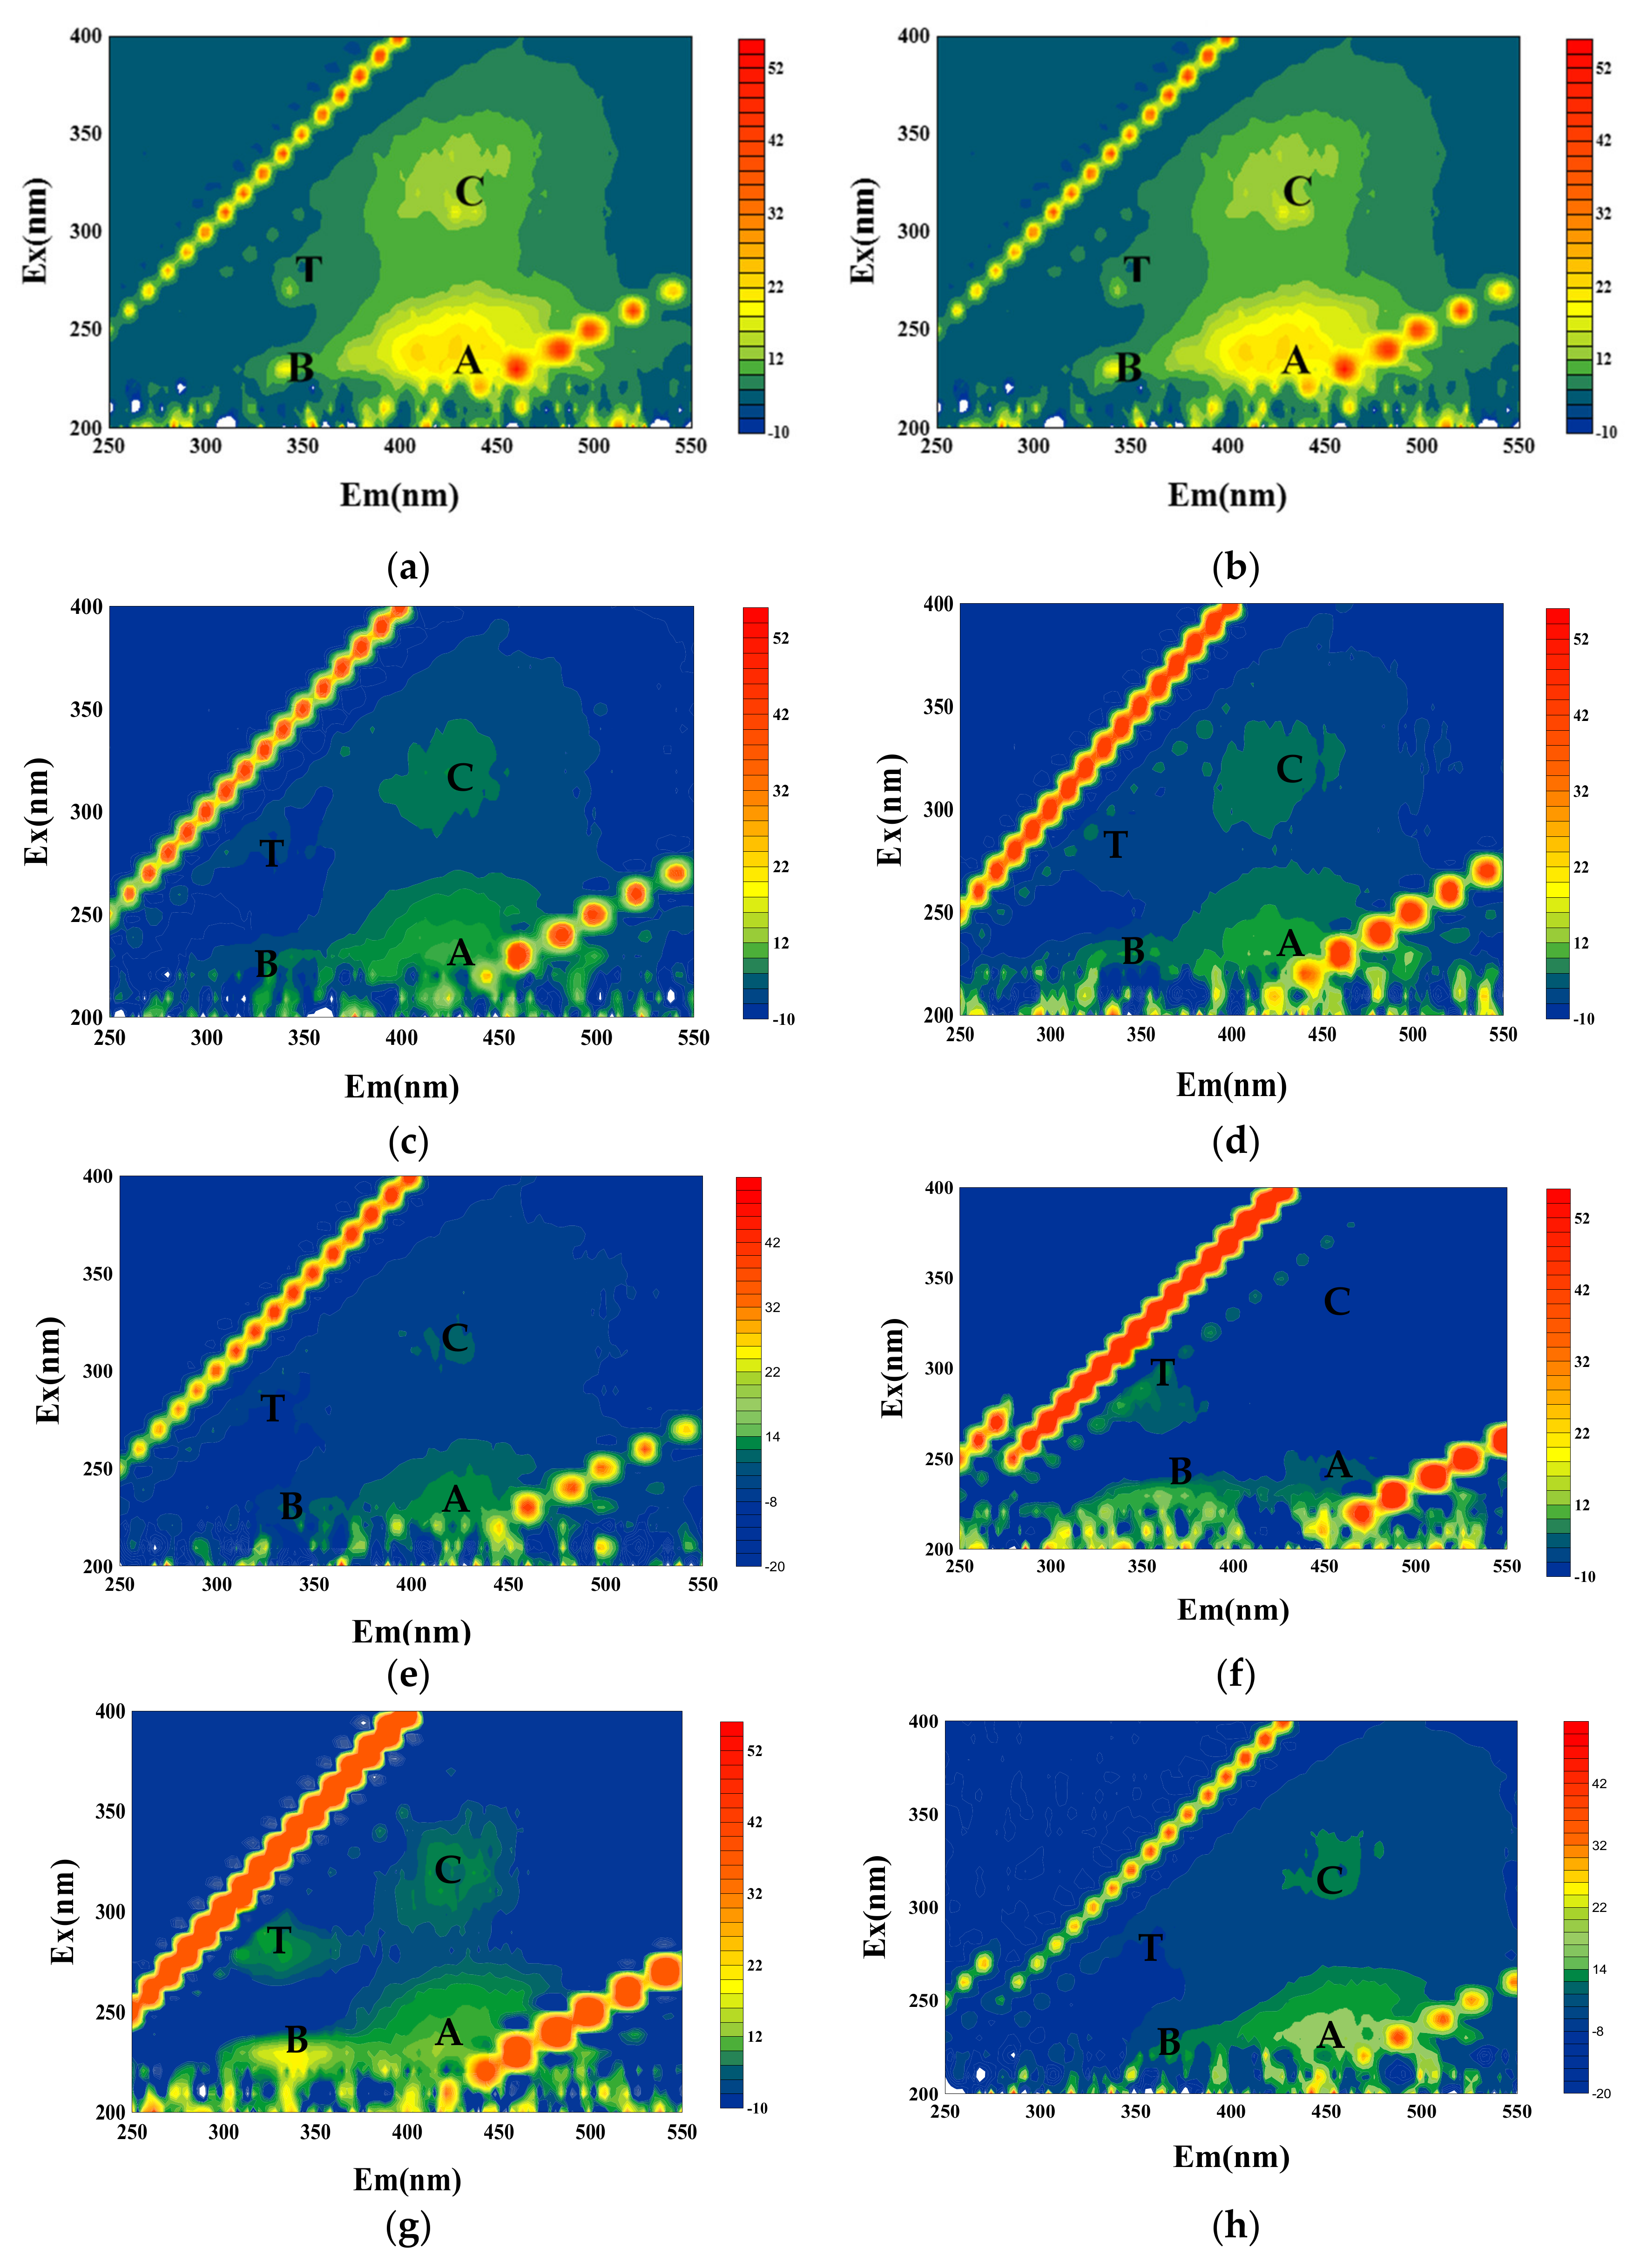
3.1.4. Three-Dimensional Fluorescence (EEM) Spectroscopy
3.2. Membrane Cleaning Characteristics under Different Conditions
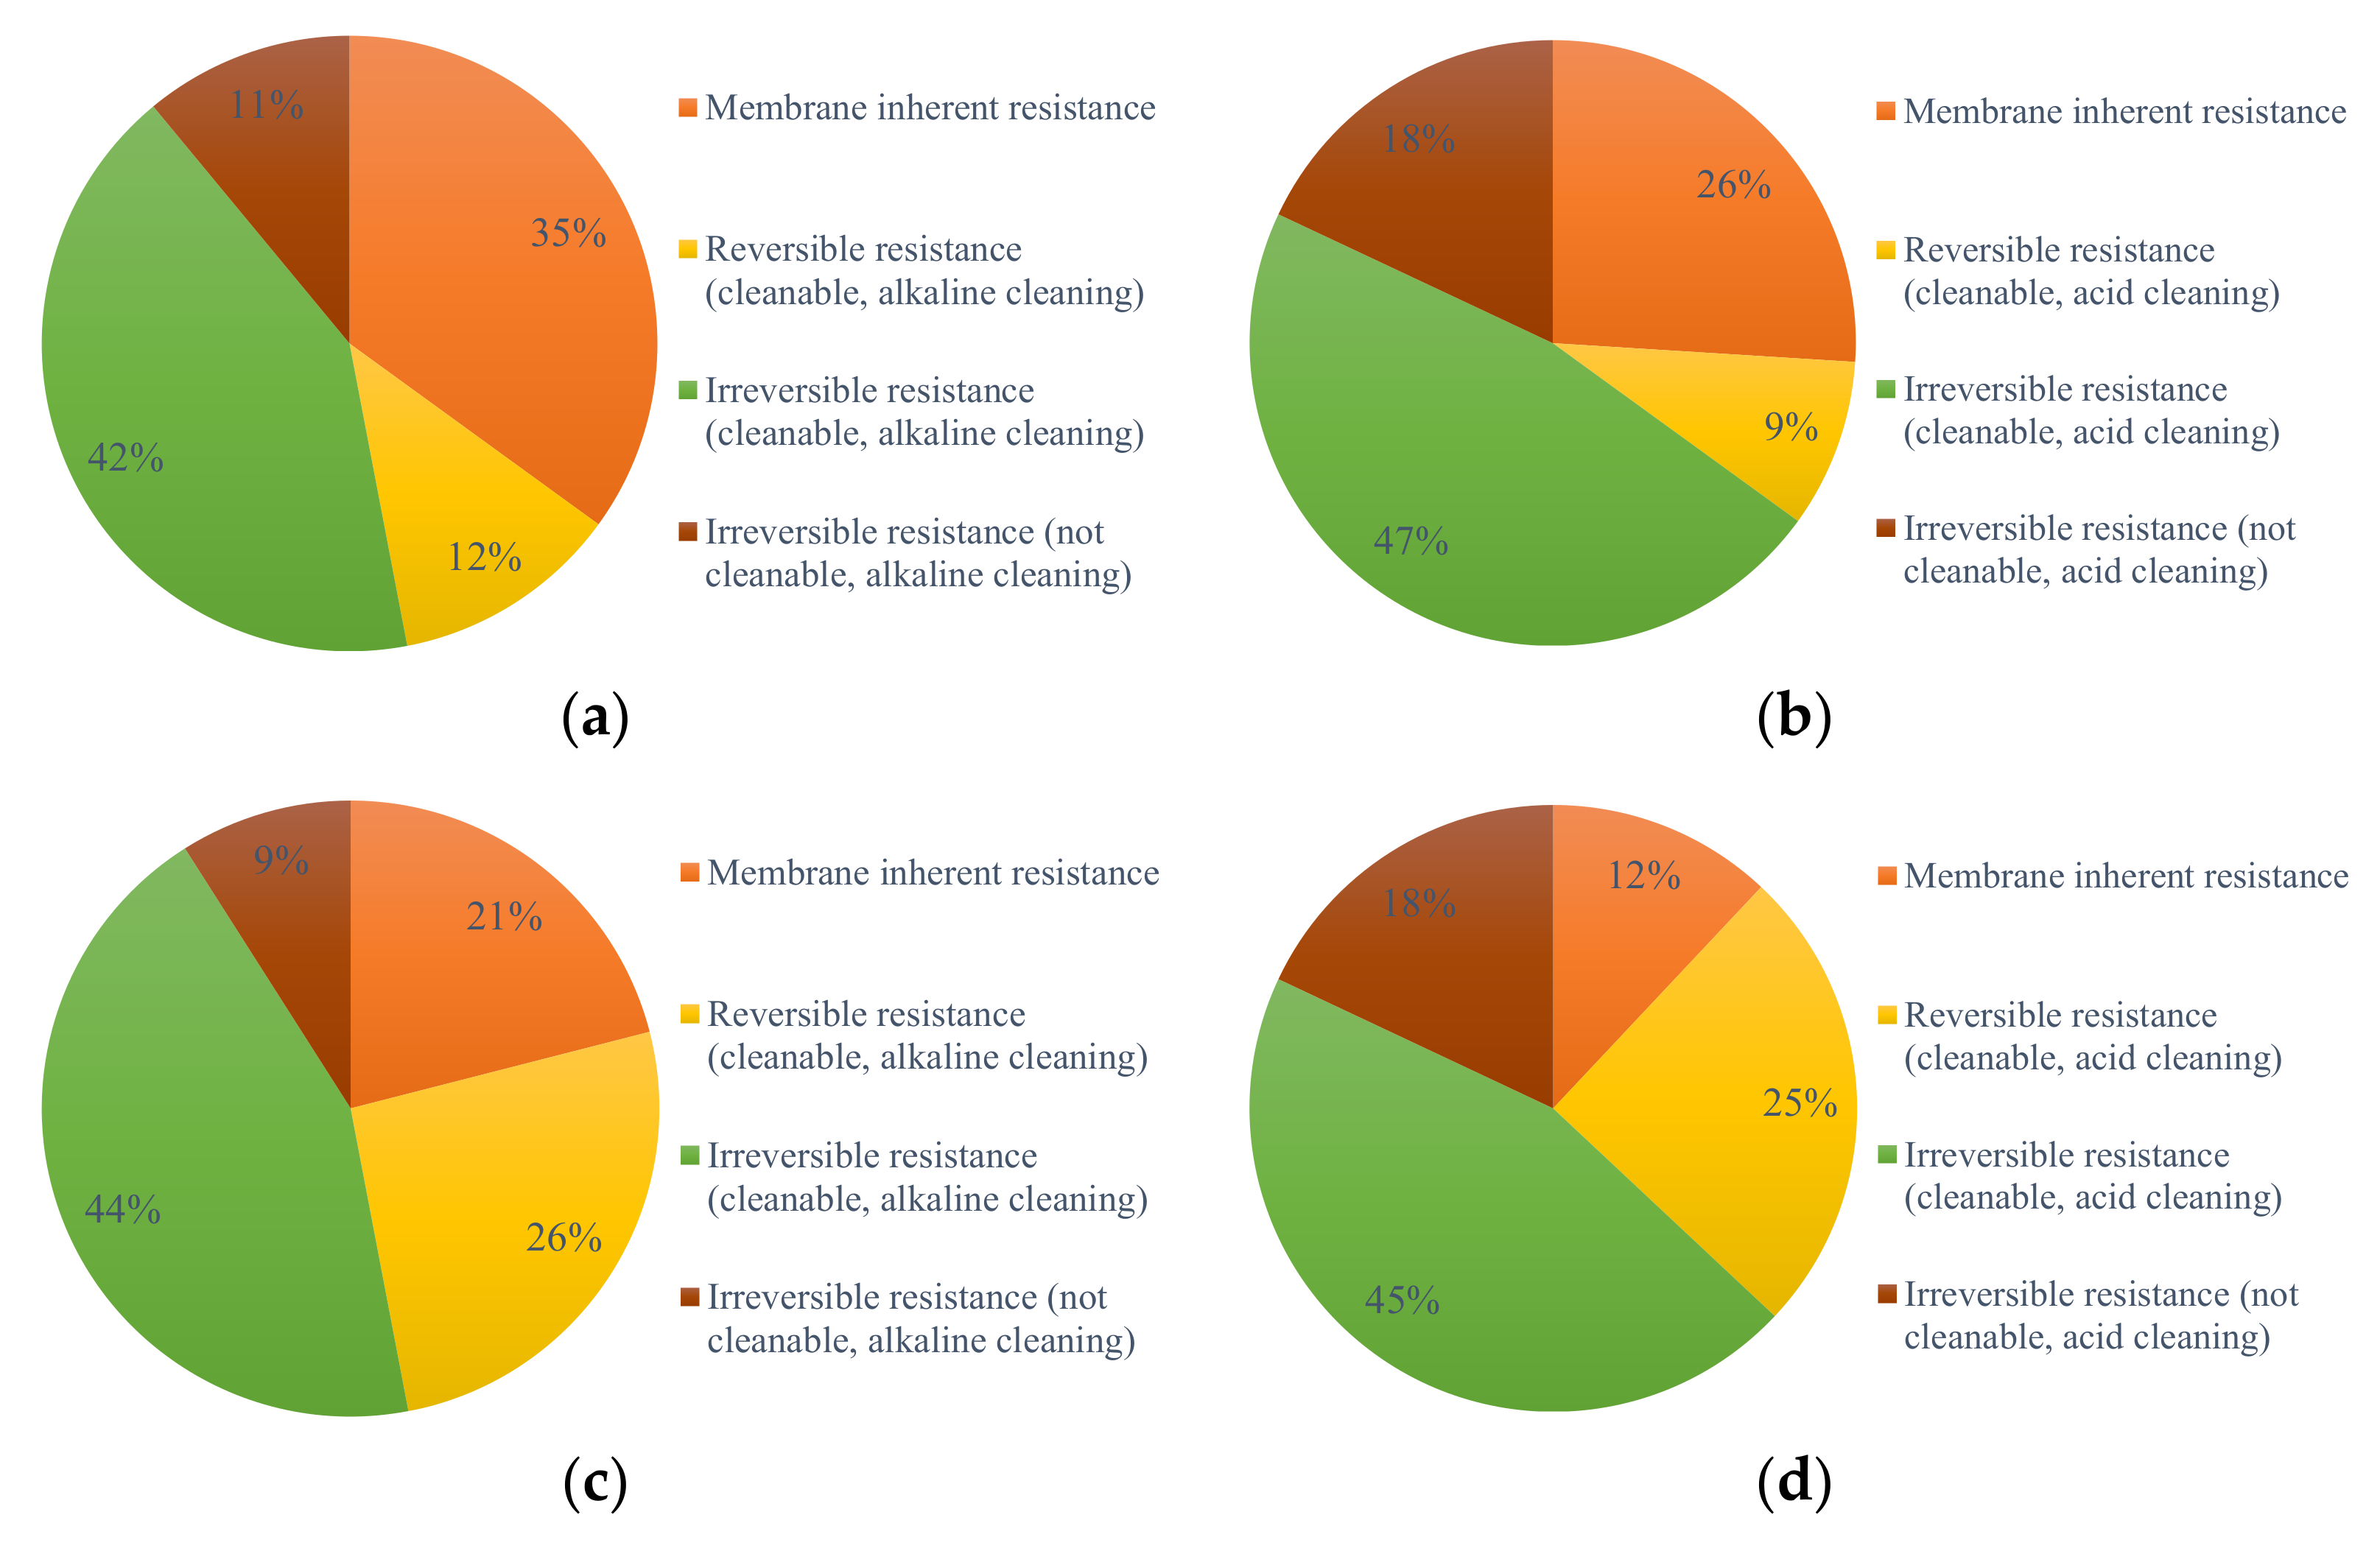
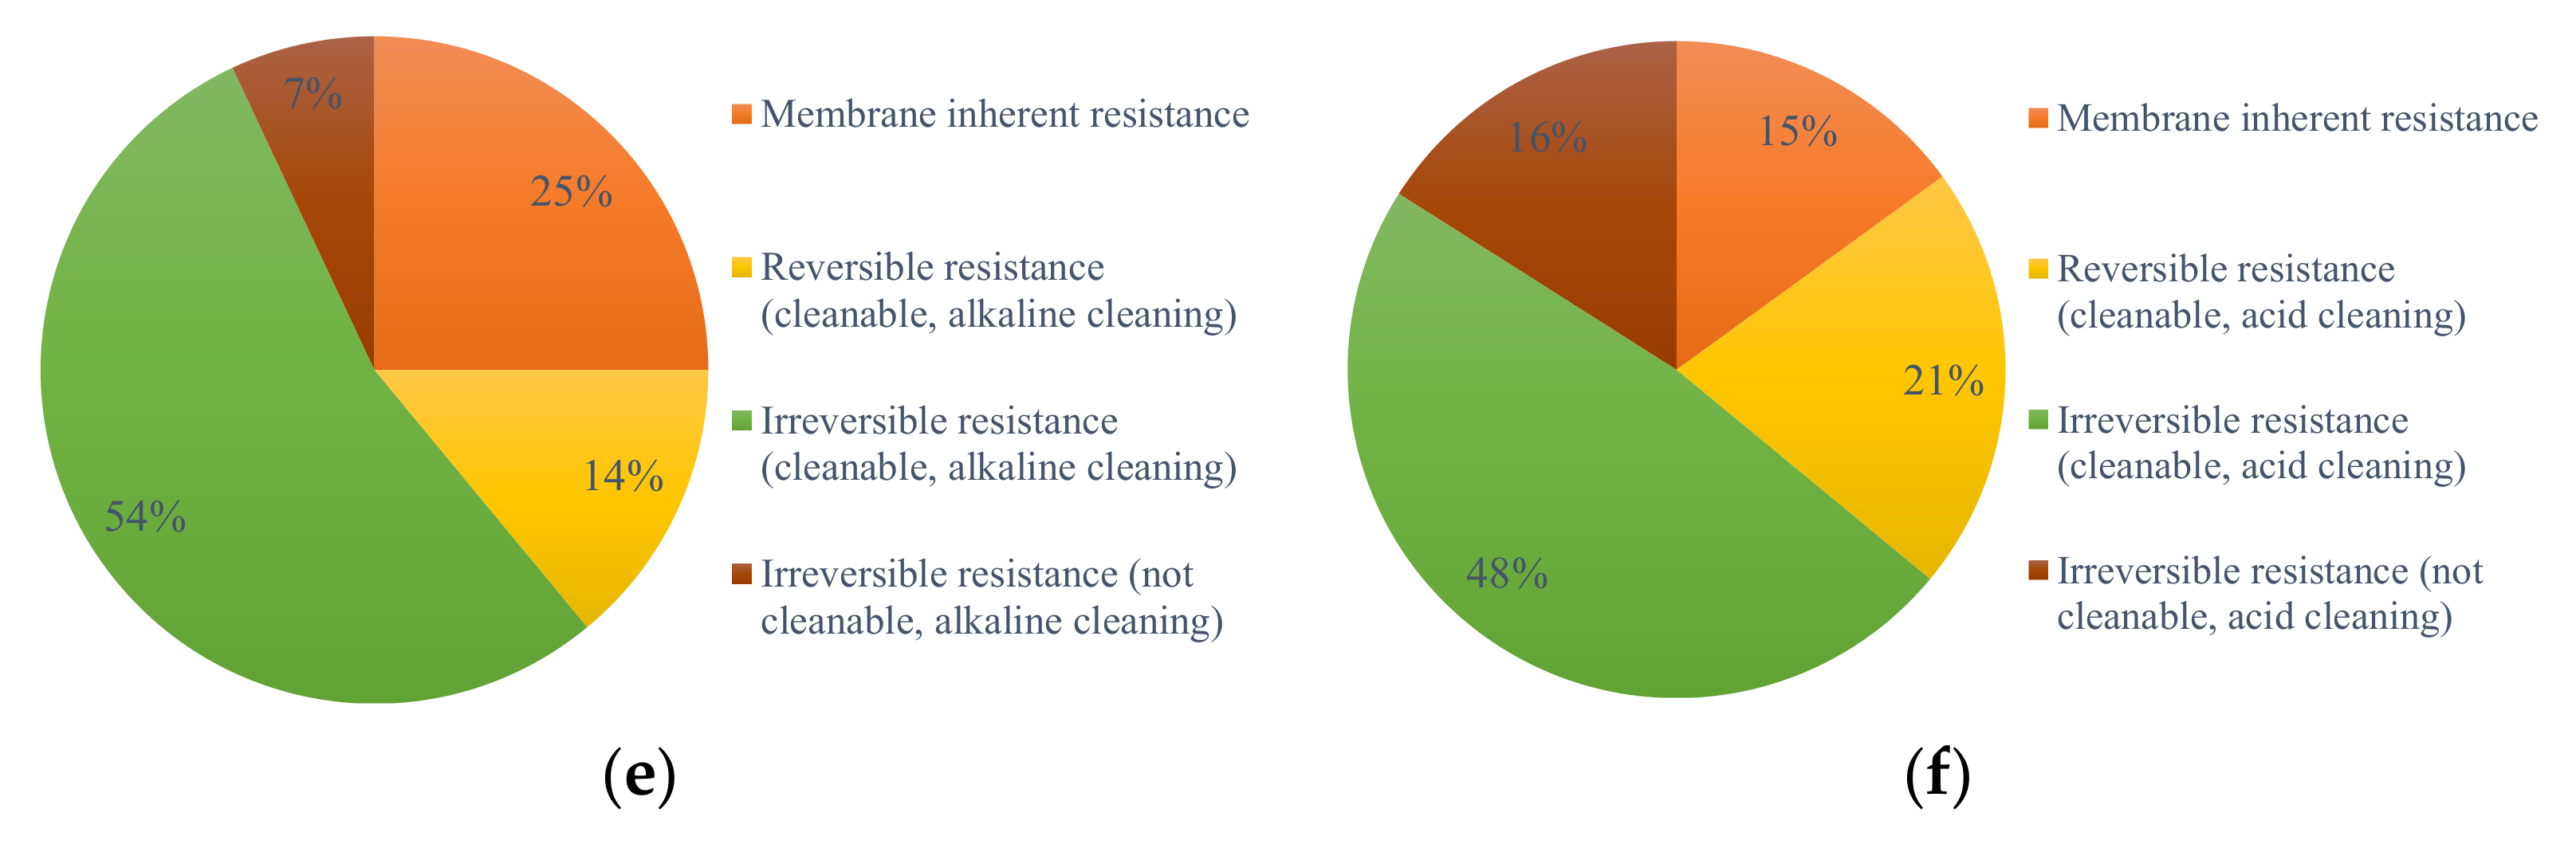
3.2.1. Variation of Membrane Resistance
3.2.2. Analysis of Membrane Contaminants
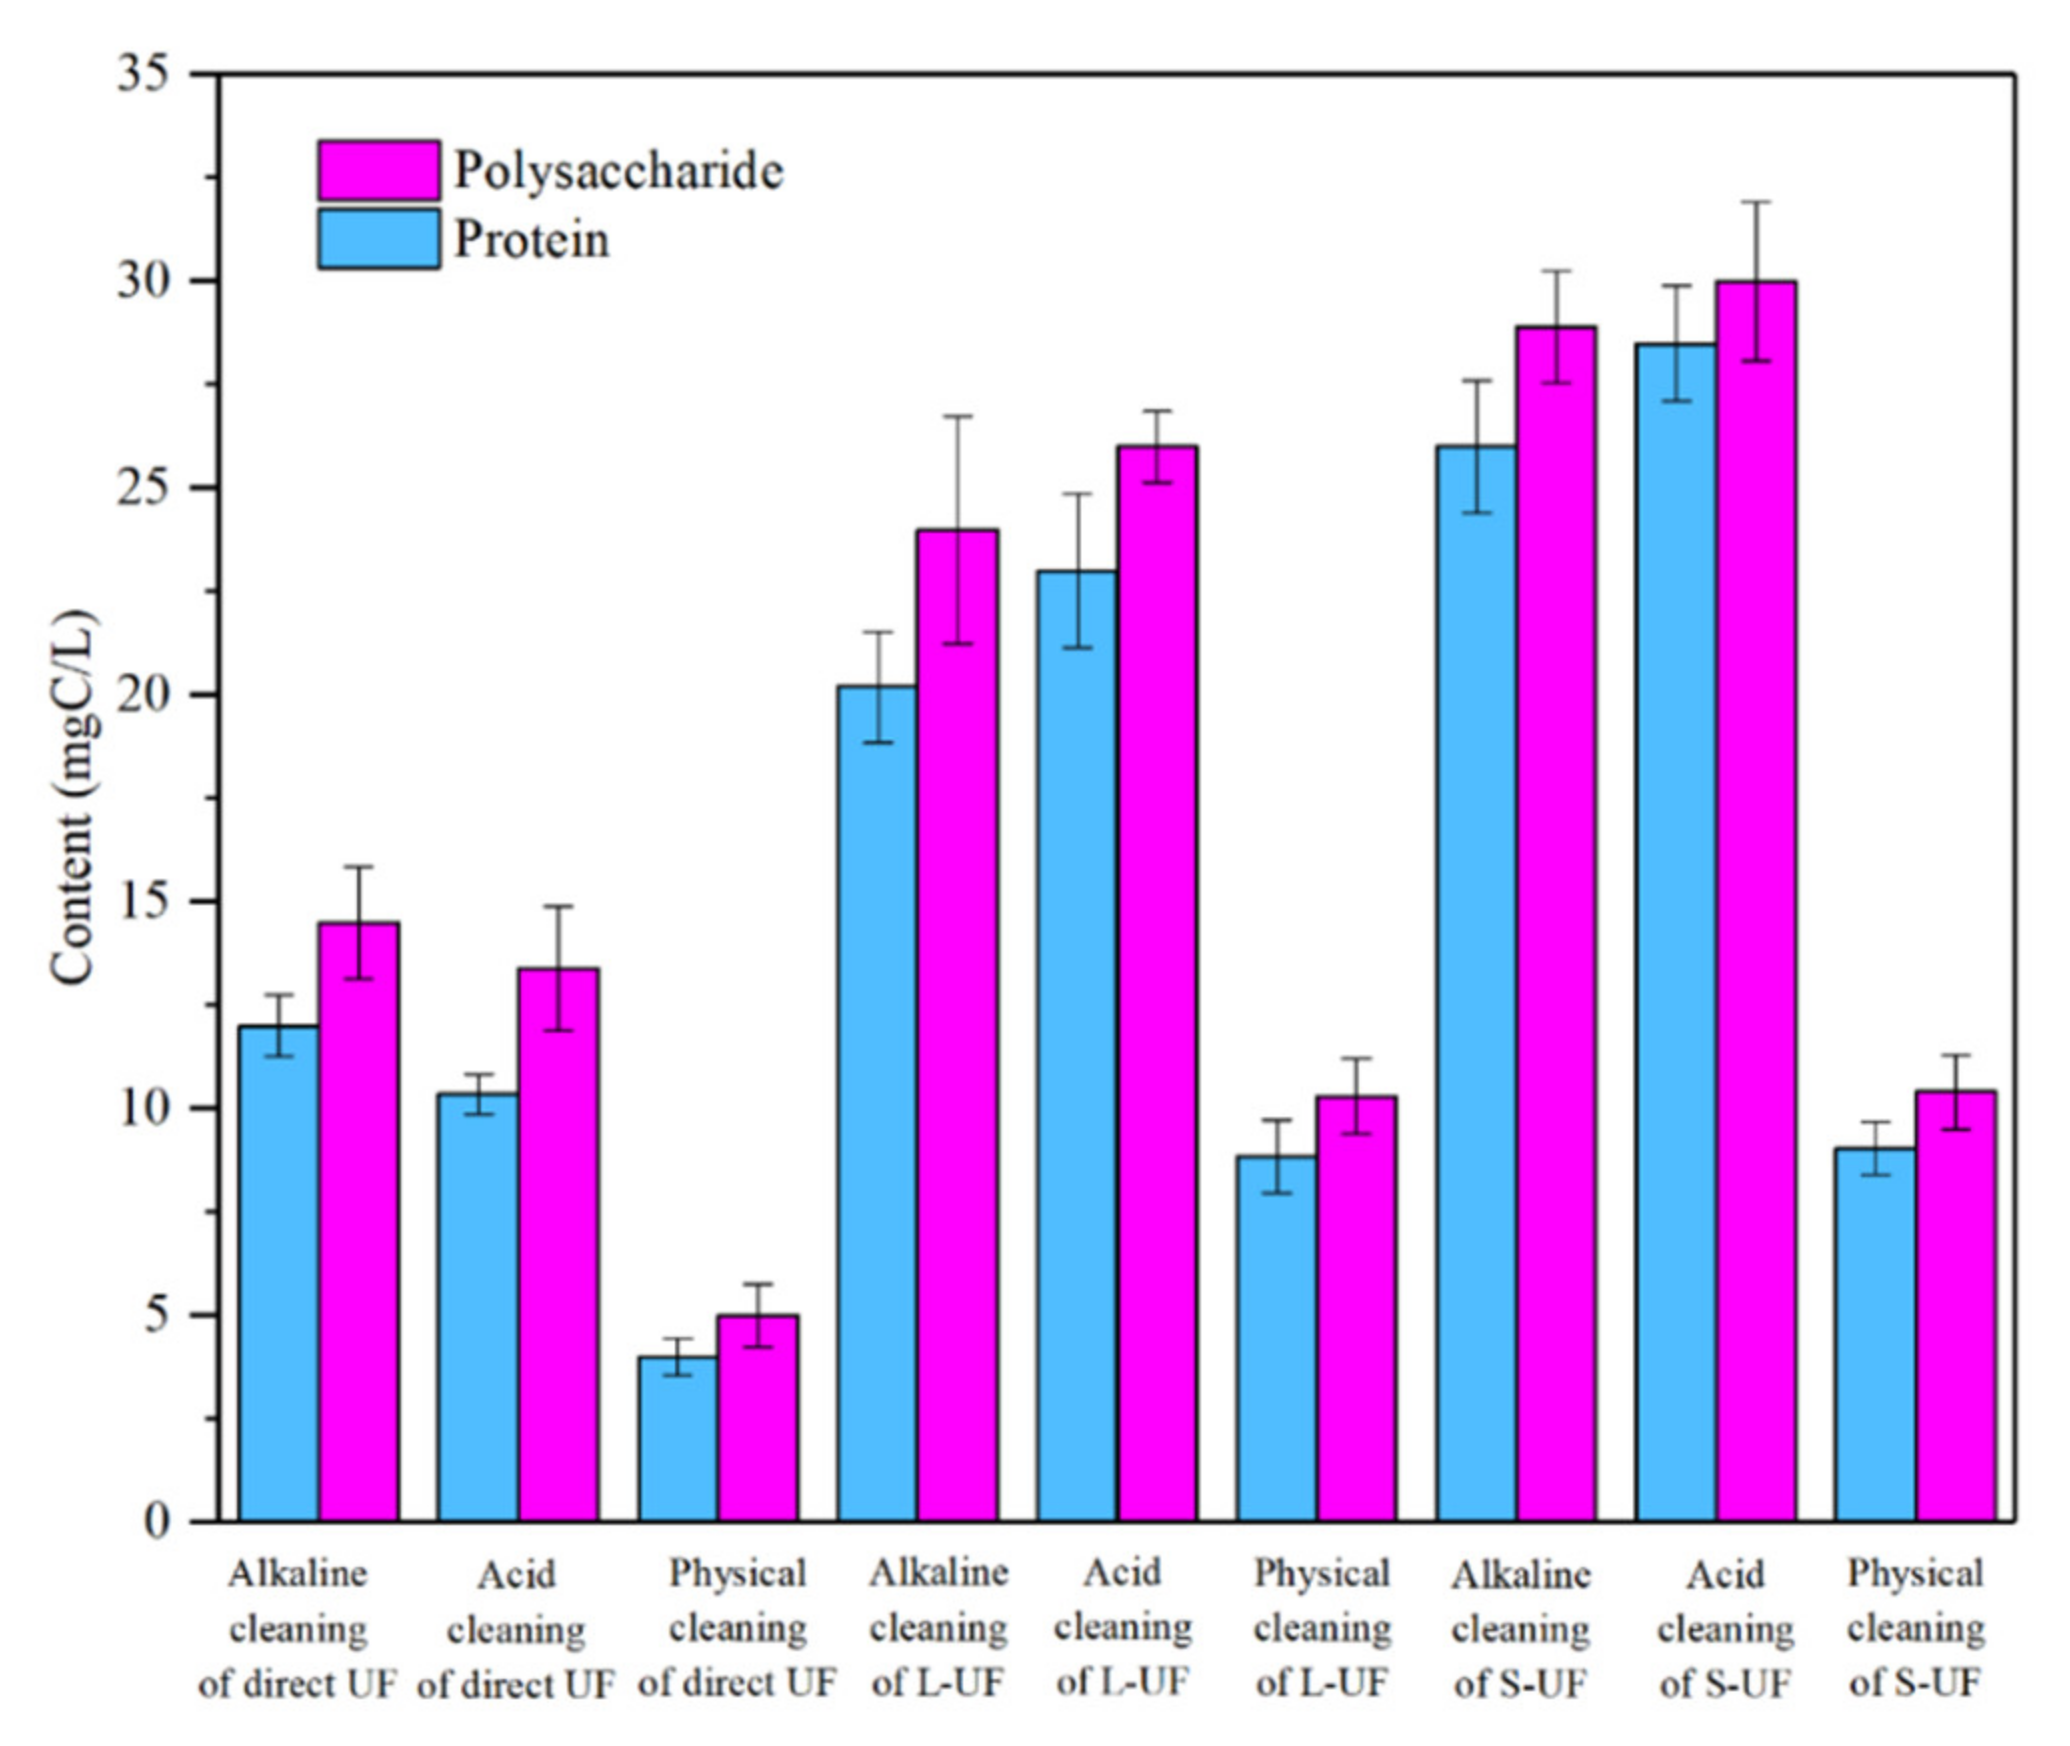
Content of Organic Matter in Membrane Elution
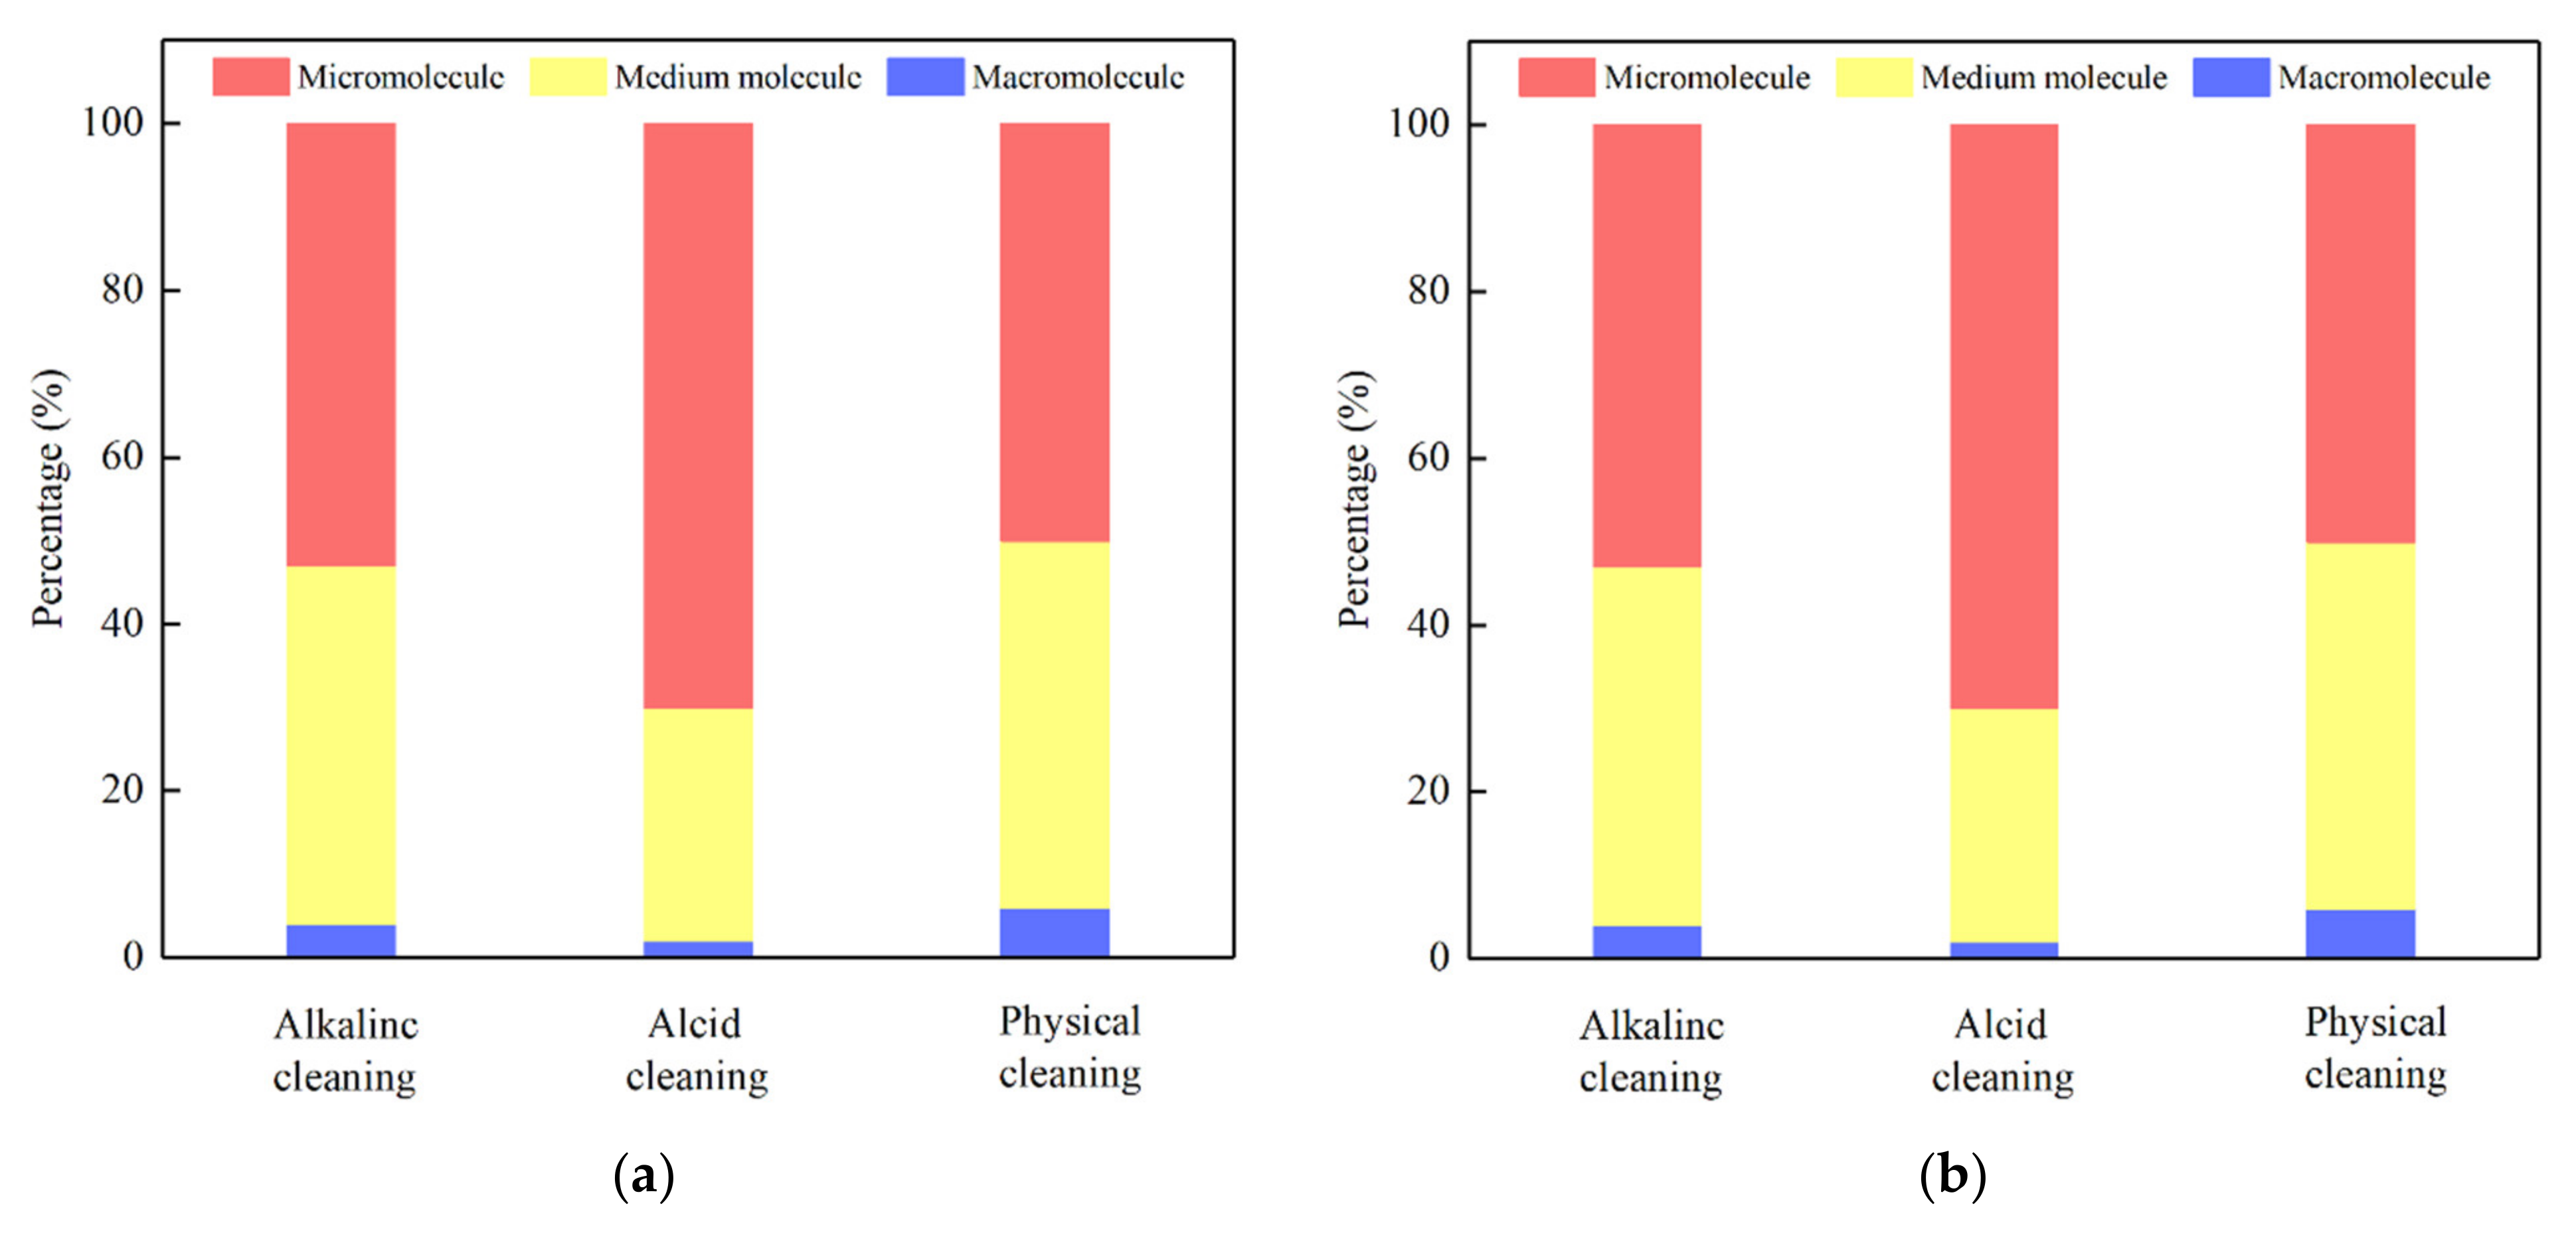
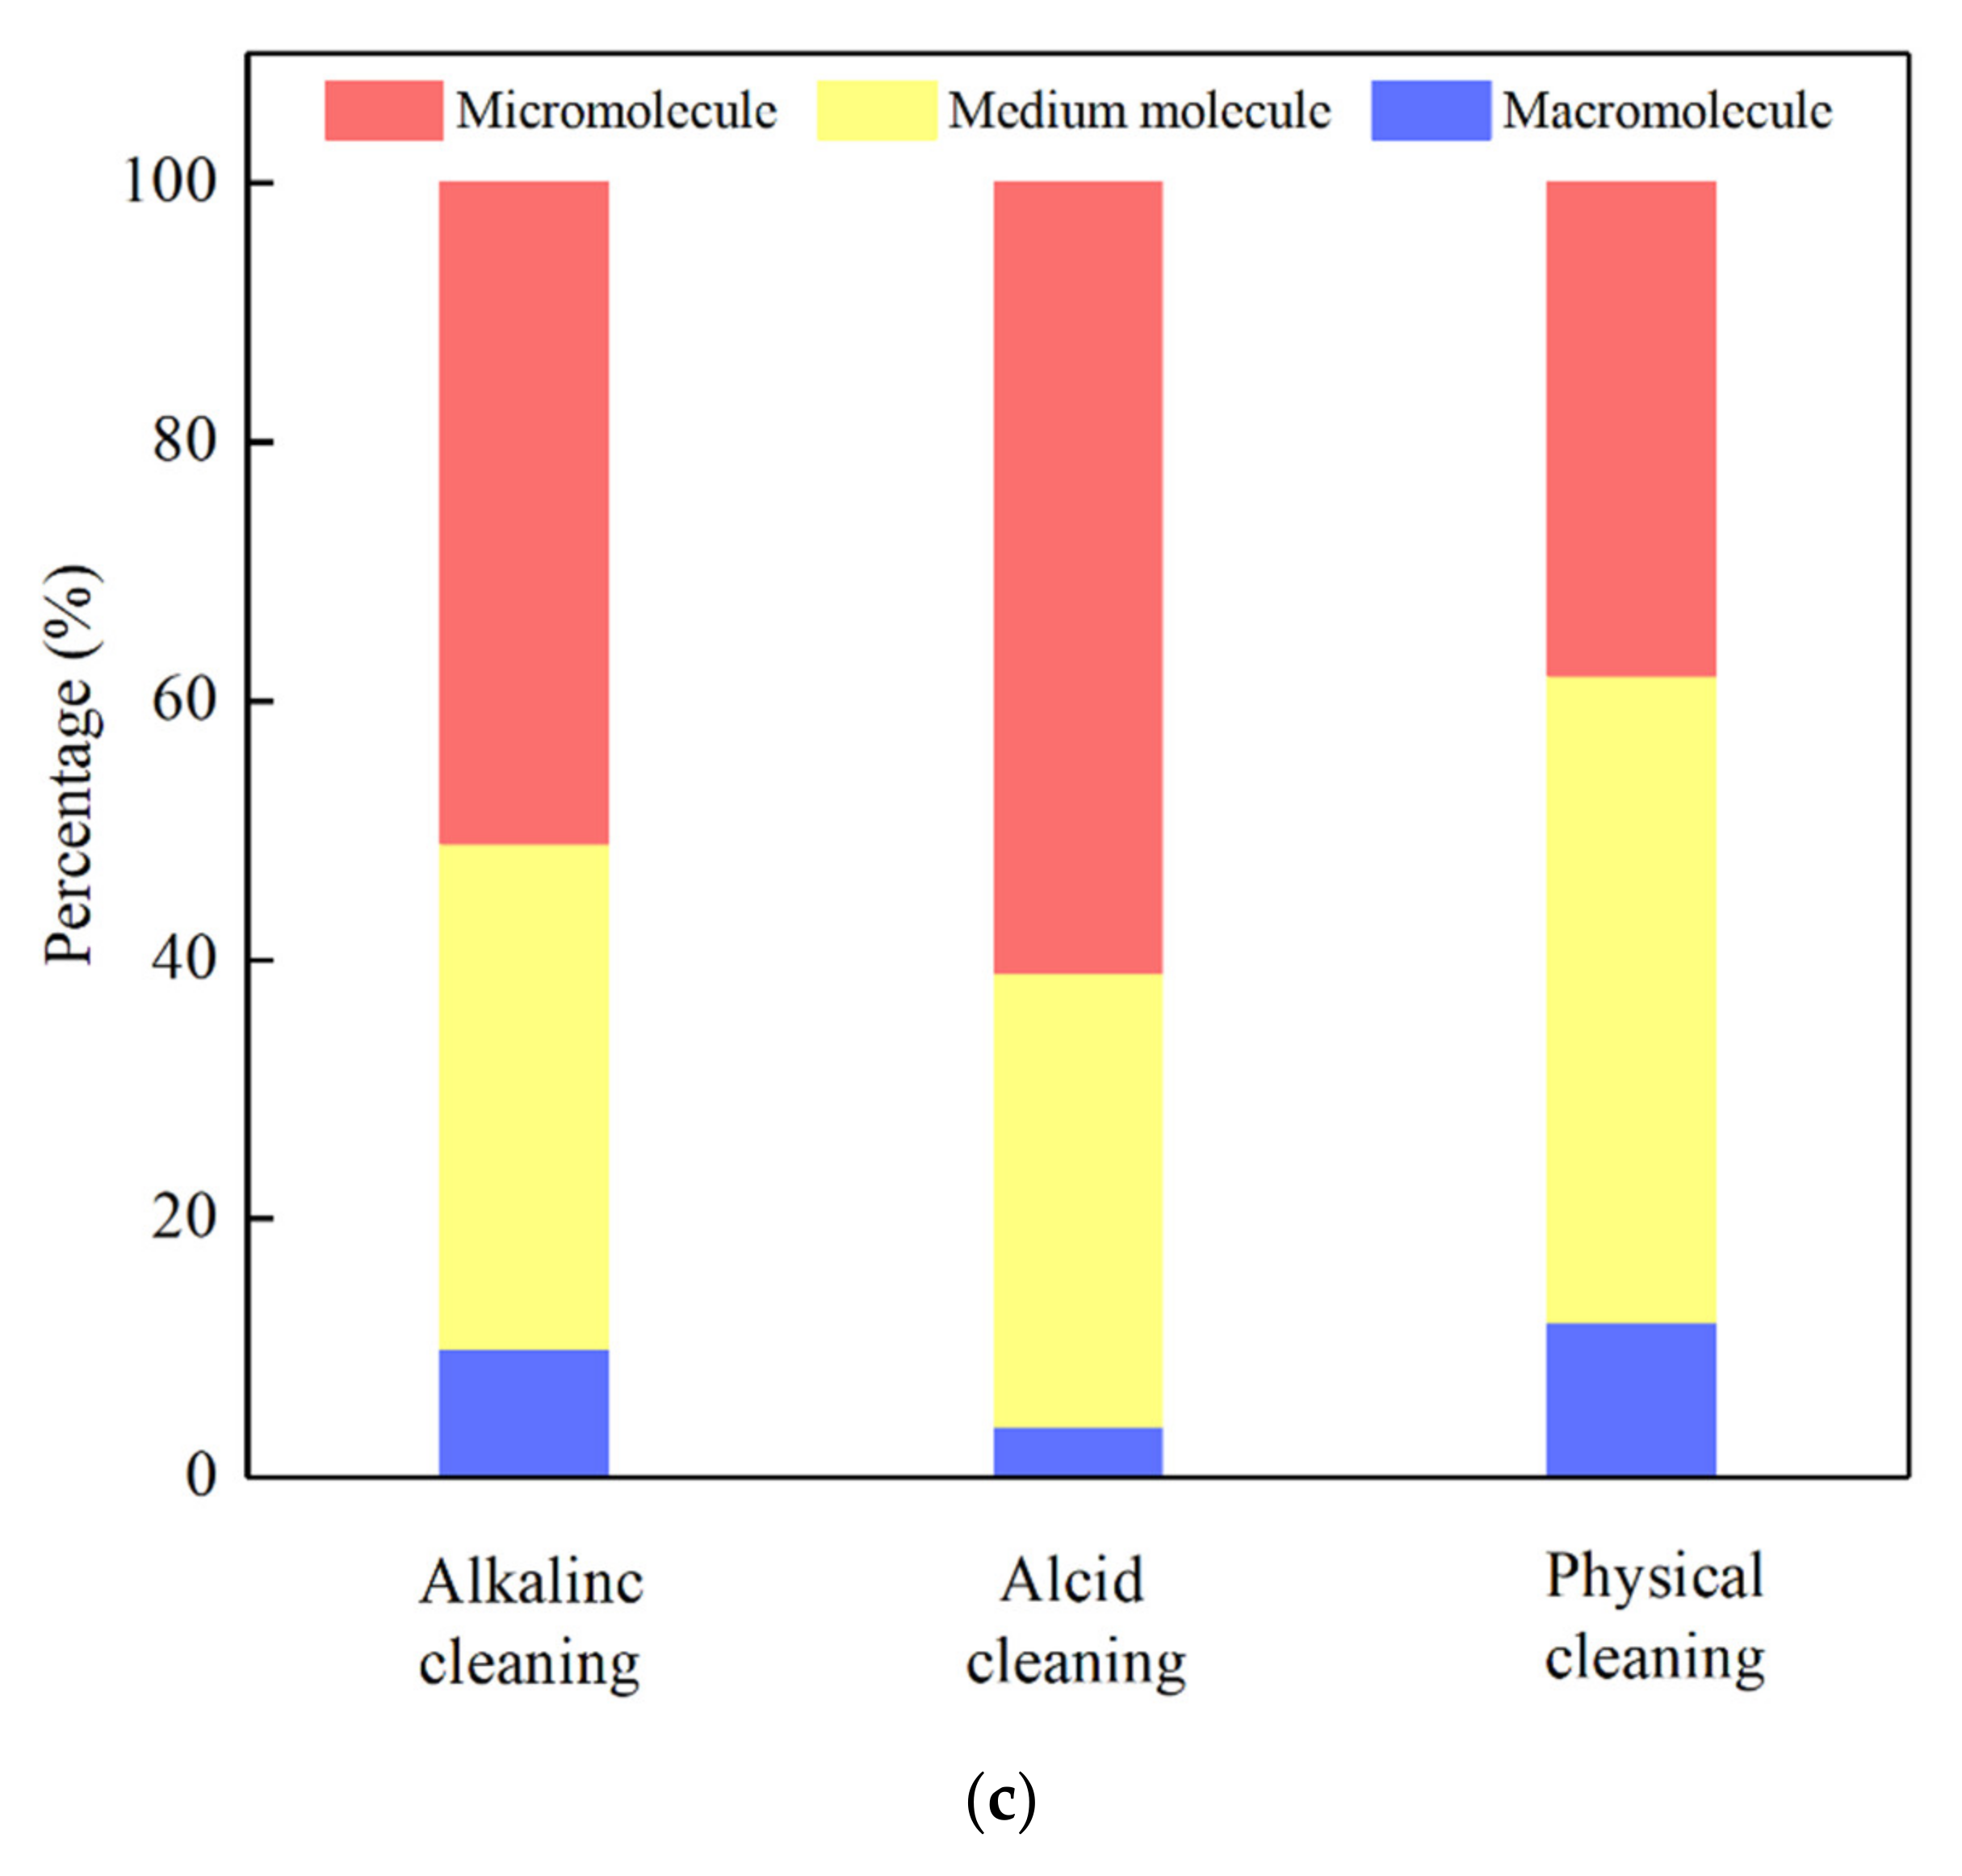
Molecular Weight Distribution
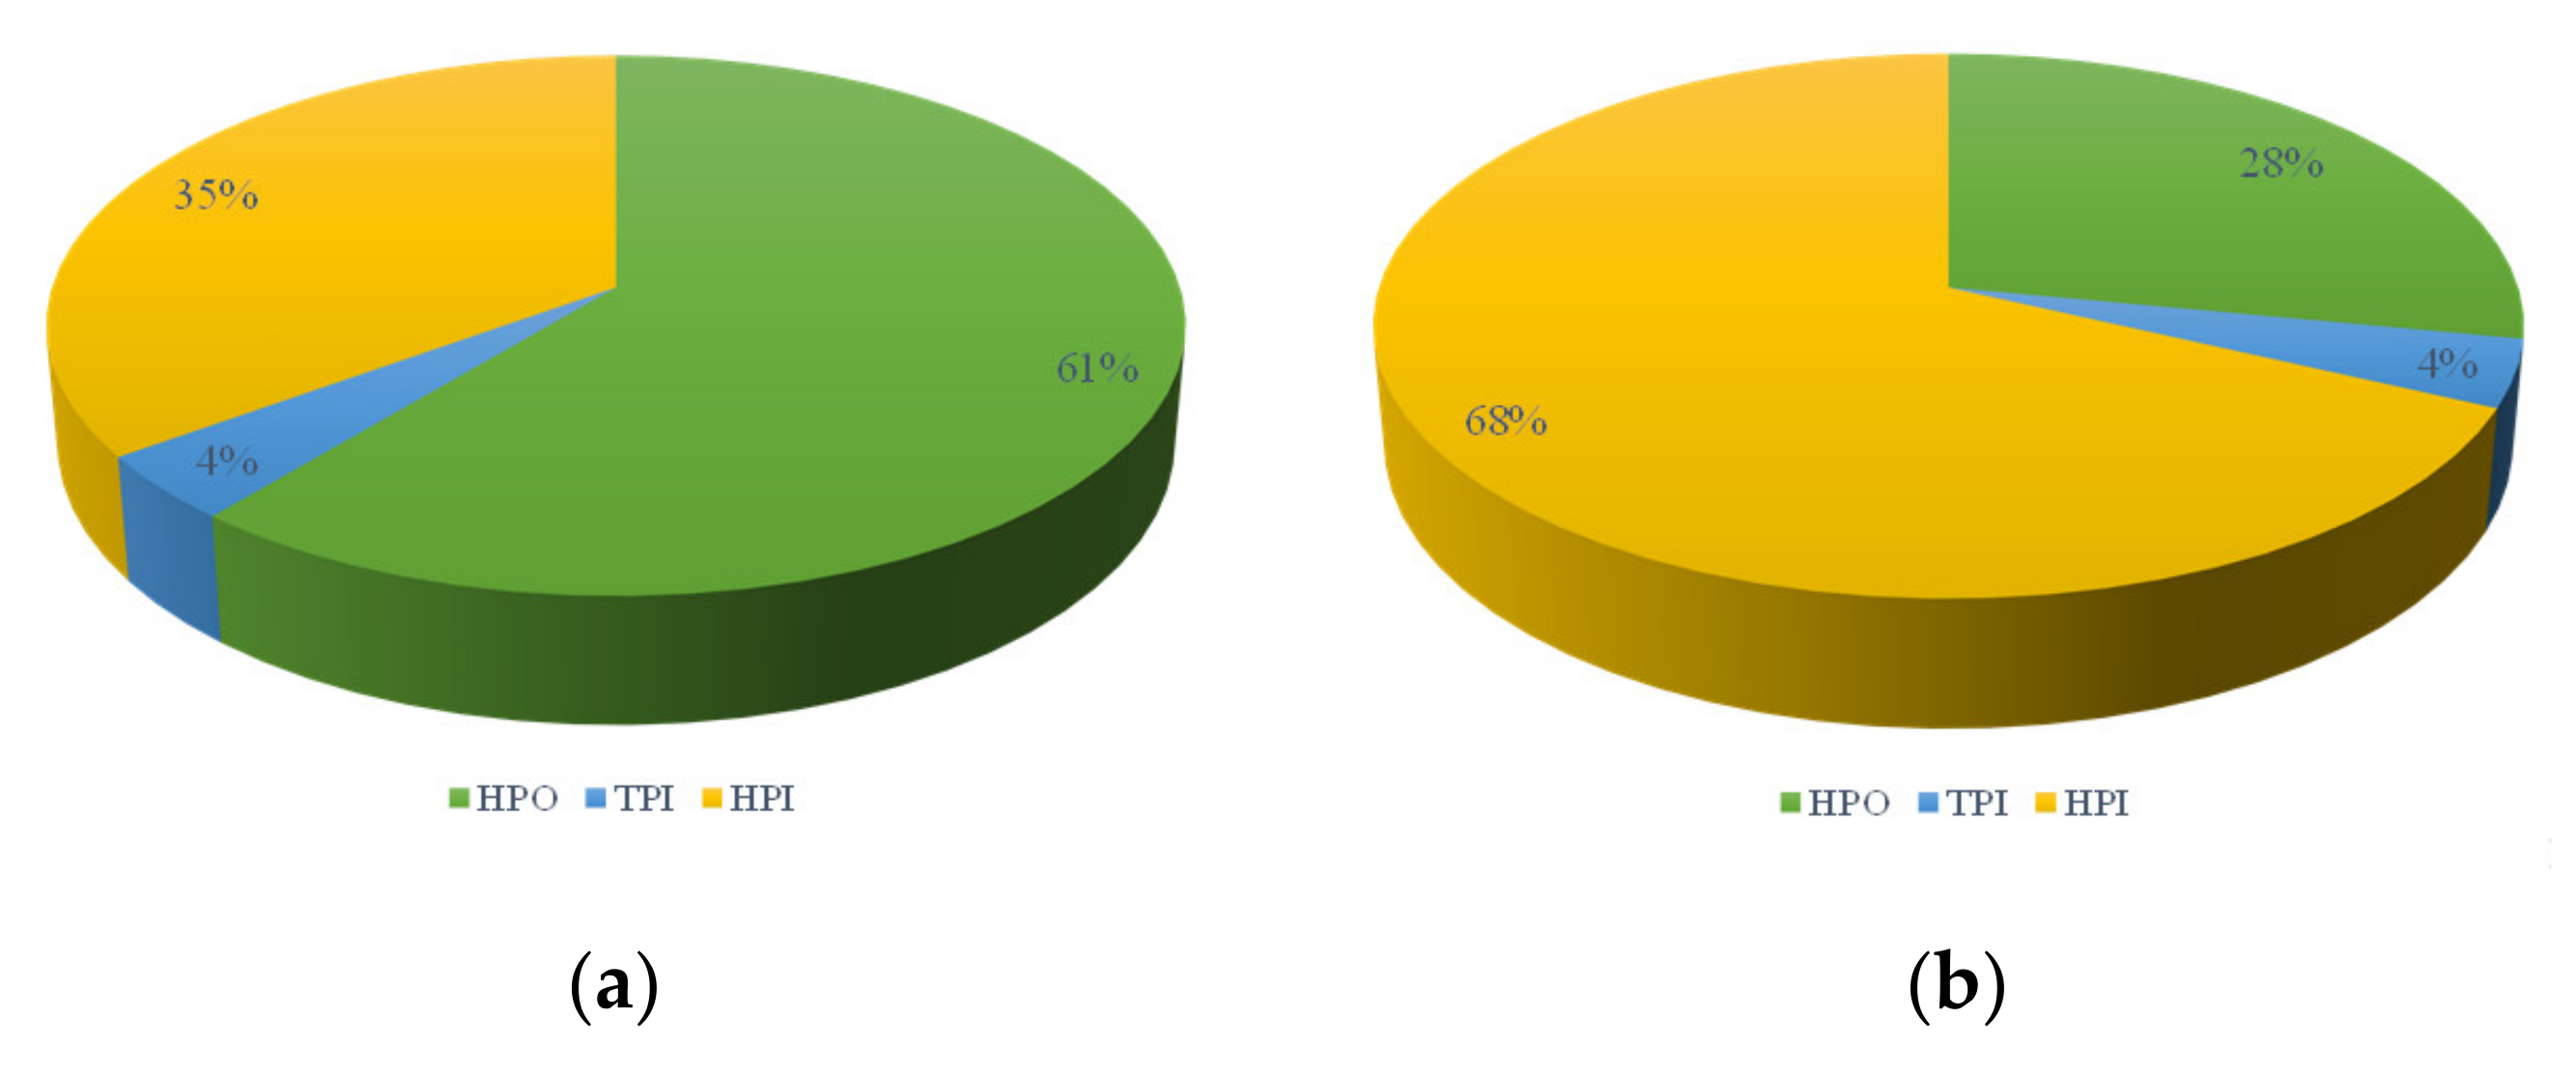
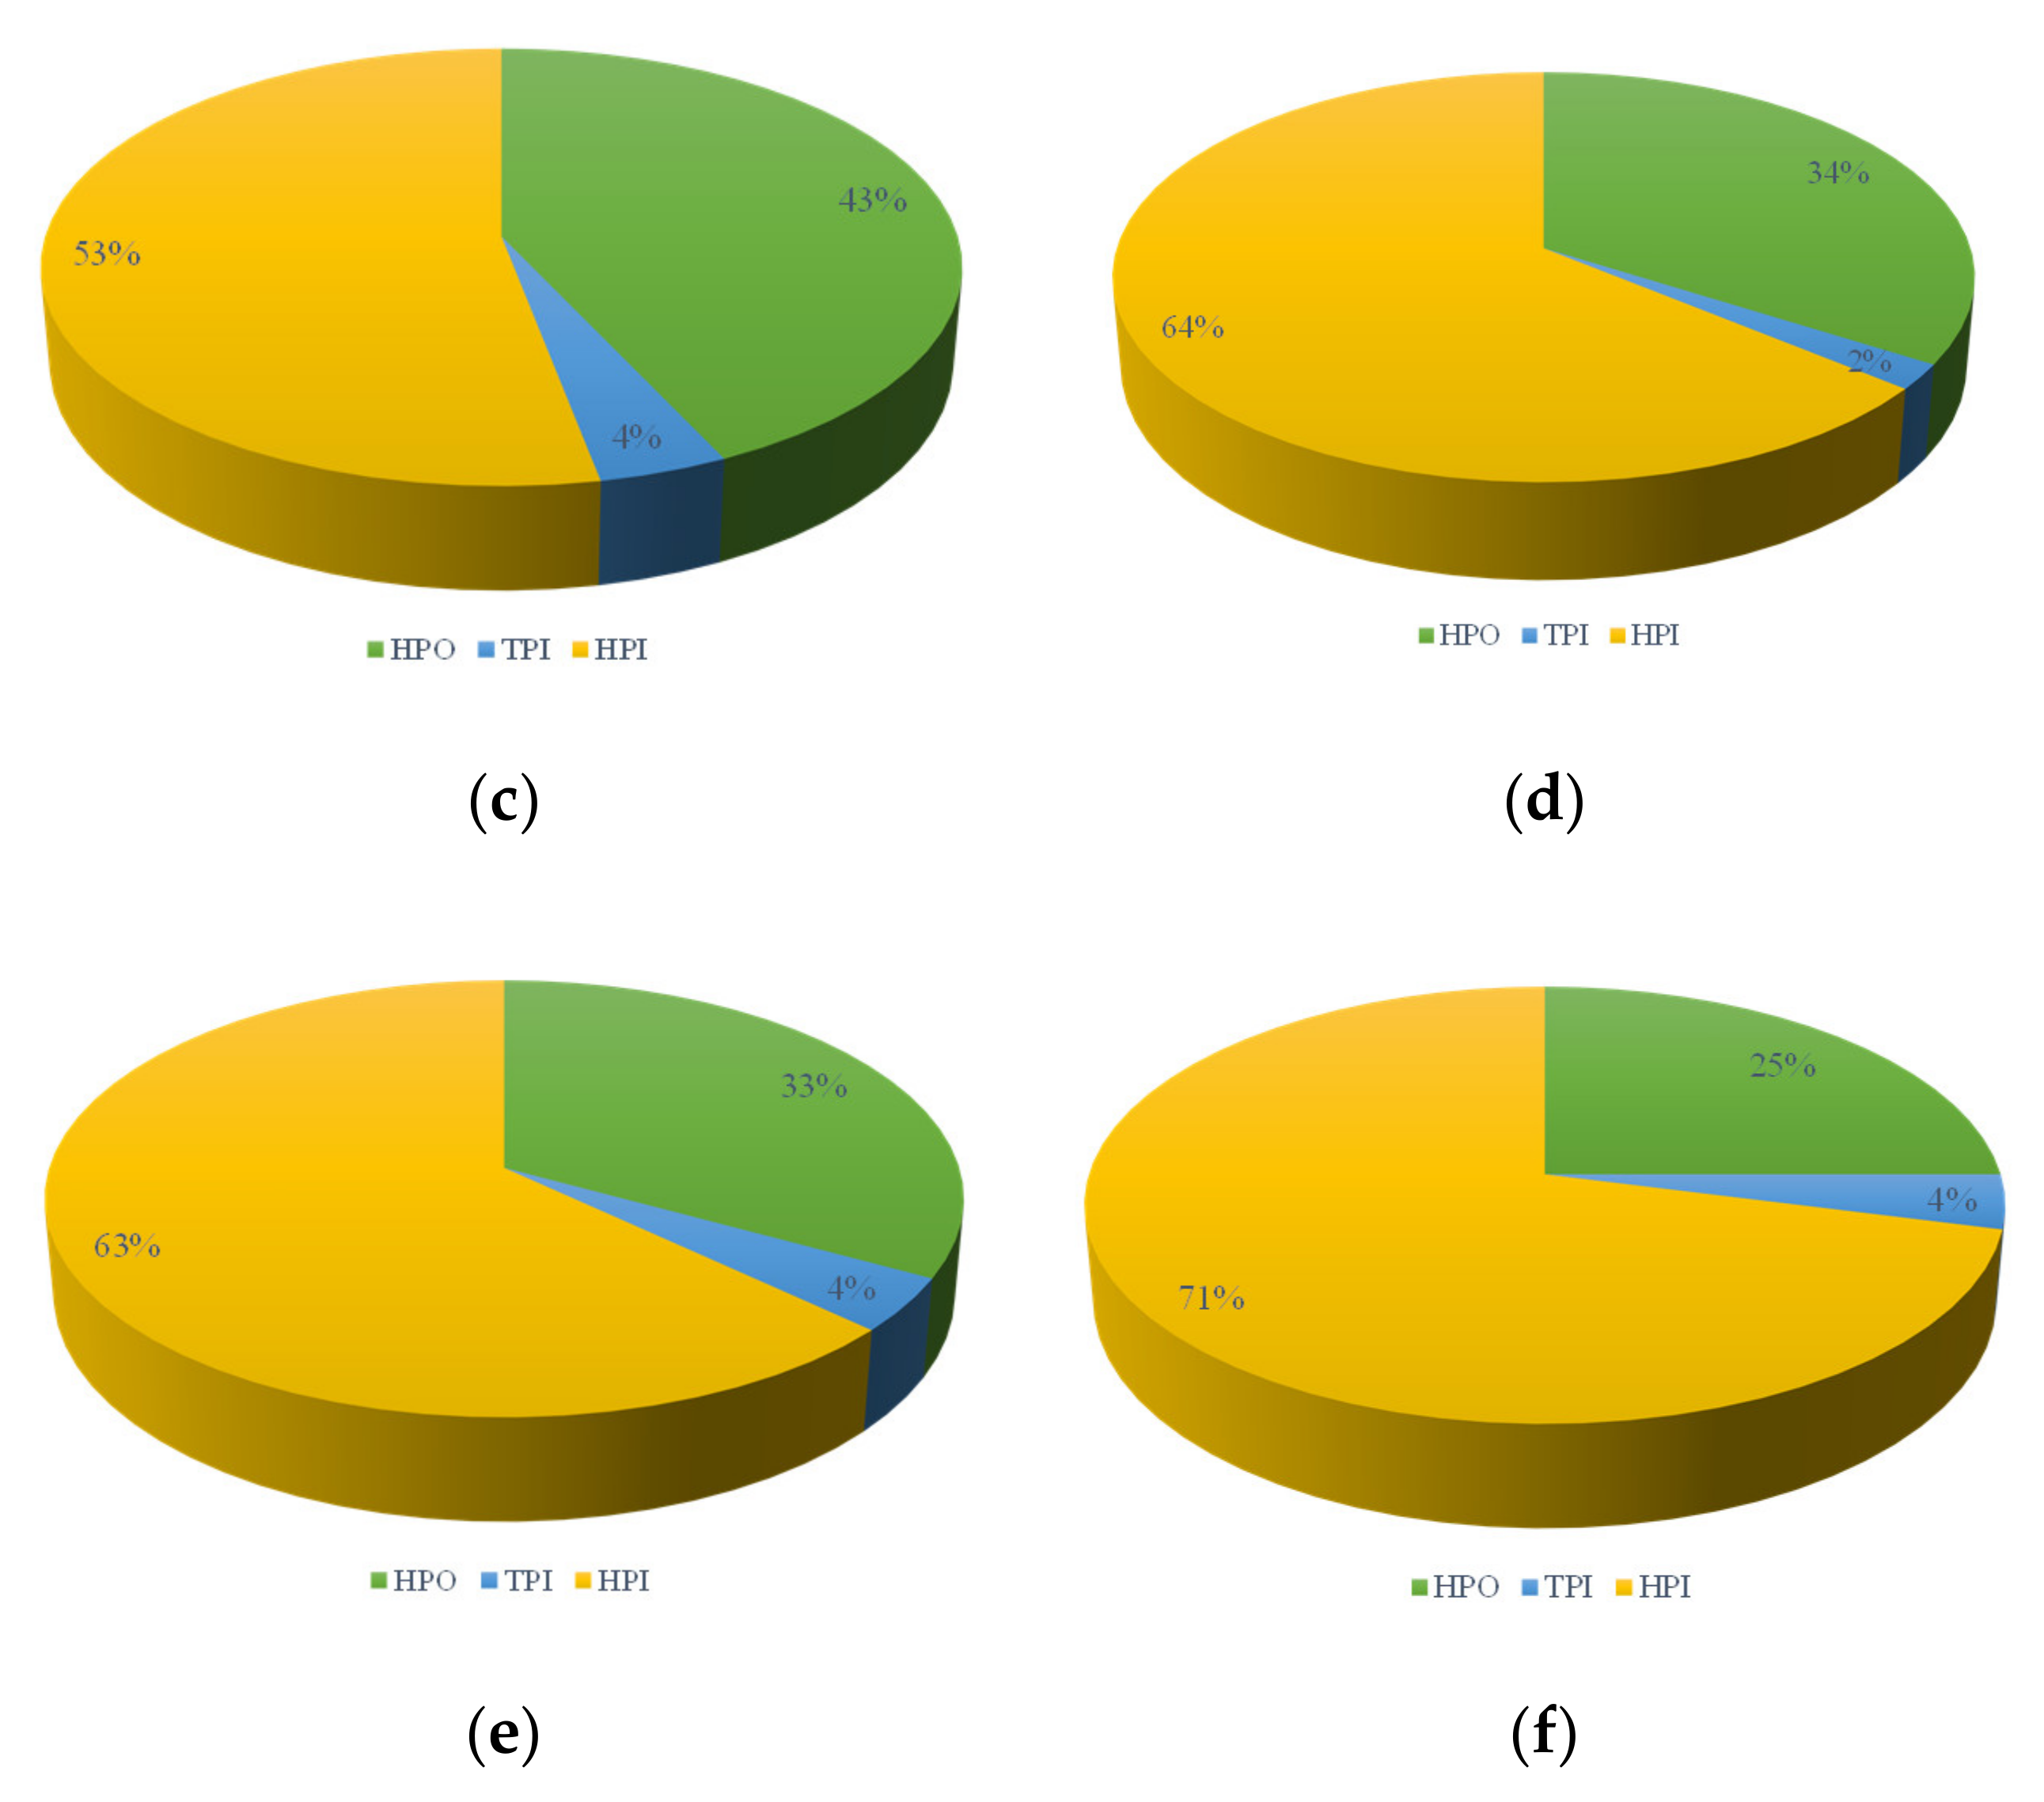
Hydrophilic-Hydrophobic Property Analysis of Membrane Elution
3.3. Mechanisms of Different PACs’ Effect on Membrane Filtration
4. Conclusions
Supplementary Materials
Author Contributions
Funding
Institutional Review Board Statement
Informed Consent Statement
Data Availability Statement
Acknowledgments
Conflicts of Interest
References
- Cheng, X.X.; Hou, C.S.; Li, P.J.; Luo, C.W.; Zhu, X.W.; Wu, D.J.; Zhang, X.Y.; Liang, H. The role of PAC adsorption-catalytic oxidation in the ultrafiltration performance for treating natural water: Efficiency improvement, fouling mitigation and mechanisms. Chemosphere 2021, 284, 131561. [Google Scholar] [CrossRef] [PubMed]
- Schwaller, C.; Hoffmann, G.; Hiller, C.X.; Helmreich, B.; Drewes, J.E. Inline dosing of powdered activated carbon and coagulant prior to ultrafiltration at pilot-scale-Effects on trace organic chemical removal and operational stability. Chem. Eng. J. 2021, 414, 128801. [Google Scholar] [CrossRef]
- Sun, L.H.; Zhu, J.Y.; Shi, P.F.; Ding, Y.; Feng, C.M. Preoxidation Combined with Powdered Activated Carbon and Ultrafiltration to Remove Antibiotic Resistance Genes in Secondary Effluent. Environ. Eng. Sci. 2021, 38, 822–831. [Google Scholar] [CrossRef]
- Sheng, C.; Nnanna, A.G.A.; Liu, Y.; Vargo, J.D. Removal of Trace Pharmaceuticals from Water using coagulation and powdered activated carbon as pretreatment to ultrafiltration membrane system. Sci. Total Environ. 2016, 550, 1075–1083. [Google Scholar] [CrossRef]
- Yu, H.K.; Li, X.; Chang, H.Q.; Zhou, Z.W.; Zhang, T.T.; Yang, Y.L.; Li, G.B.; Ji, H.J.; Cai, C.Y.; Liang, H. Performance of hollow fiber ultrafiltration membrane in a full-scale drinking water treatment plant in China: A systematic evaluation during 7-year operation. J. Membr. Sci. 2020, 613, 118469. [Google Scholar] [CrossRef]
- Gao, K.; Li, T.; Zhao, Q.Q.; Liu, W.; Liu, J.X.; Song, Y.L.; Chu, H.Q.; Dong, B.Z. UF fouling behavior of allelopathy of extracellular organic matter produced by mixed algae co-cultures. Sep. Purif. Technol. 2021, 261, 118297. [Google Scholar] [CrossRef]
- Peters, C.D.; Rantissi, T.; Gitis, V.; Hankins, N.P. Retention of natural organic matter by ultrafiltration and the mitigation of membrane fouling through pre-treatment, membrane enhancement, and cleaning-A review. J. Water Process. Eng. 2021, 44, 102374. [Google Scholar] [CrossRef]
- Pourbozorg, M.; Li, T.; Law, A.W.K. Effect of turbulence on fouling control of submerged hollow fibre membrane filtration. Water Res. 2016, 99, 101–111. [Google Scholar] [CrossRef]
- Wu, S.Q.; Hua, X.; Ma, B.W.; Fan, H.W.; Miao, R.; Ulbricht, M.; Hu, C.Z.; Qu, J.H. Three-Dimensional Analysis of the Natural-Organic-Matter Distribution in the Cake Layer to Precisely Reveal Ultrafiltration Fouling Mechanisms. Environ. Sci. Technol. 2021, 55, 5442–5452. [Google Scholar] [CrossRef]
- Meng, S.; Wang, R.; Zhang, K.; Meng, X.; Xue, W.; Liu, H.; Liang, D.; Zhao, Q.; Liu, Y. Transparent exopolymer particles (TEPs)-associated protobiofilm: A neglected contributor to biofouling during membrane filtration. Front. Environ. Sci. Eng. 2021, 15, 64. [Google Scholar] [CrossRef]
- Huang, W.; Wang, L.; Zhou, W.; Lv, W.; Hu, M.; Chu, H.; Dong, B. Effects of combined ozone and PAC pretreatment on ultrafiltration membrane fouling control and mechanisms. J. Membr. Sci. 2017, 533, 378–389. [Google Scholar] [CrossRef]
- Liu, J.; Tian, J.; Wang, Z.; Zhao, D.; Jia, F.; Dong, B. Mechanism analysis of powdered activated carbon controlling microfiltration membrane fouling in surface water treatment. Colloid. Surf. A 2017, 517, 45–51. [Google Scholar] [CrossRef]
- Campinas, M.; Rosa, M.J. Assessing PAC contribution to the NOM fouling control in PAC/UF systems. Water Res. 2010, 44, 1636–1644. [Google Scholar] [CrossRef] [PubMed]
- Khan, M.M.; Takizawa, S.; Lewandowski, Z.; Habibur Rahman, M.; Komatsu, K.; Nelson, S.E.; Kurisu, F.; Camper, A.K.; Katayama, H.; Ohgaki, S. Combined effects of EPS and HRT enhanced biofouling on a submerged and hybrid PAC-MF membrane bioreactor. Water Res. 2013, 47, 747–757. [Google Scholar] [CrossRef] [Green Version]
- Konieczny, K.; Klomfas, G. Using activated carbon to improve natural water treatment by porous membranes. Desalination 2002, 147, 109–116. [Google Scholar] [CrossRef]
- Parameshwaran, K.; Fane, A.G.; Cho, B.D.; Kim, K.J. Analysis of microfiltration performance with constant flux processing of secondary effluent. Water Res. 2001, 35, 4349–4358. [Google Scholar] [CrossRef]
- Matsui, Y.; Sanogawa, T.; Aoki, N.; Mima, S.; Matsushita, T. Evaluating submicron-sized activated carbon adsorption for microfiltration pretreatment. Water Treat. 2006, 6, 149–155. [Google Scholar] [CrossRef]
- Meier, J. Mechanical influence of PAC particles on membrane processes. J. Membr. Sci. 2010, 360, 404–409. [Google Scholar] [CrossRef]
- Yiantsios, S.G.; Karabelas, A. An experimental study of humid acid and powdered activated carbon deposition on UF membranes and their removal by backwashing. Desalination 2001, 140, 195–209. [Google Scholar] [CrossRef]
- Shao, S.; Qu, F.; Liang, H.; Chang, H.; Yu, H.; Li, G. Characterization of membrane foulants in a pilot-scale powdered activated carbon–membrane bioreactor for drinking water treatment. Process Biochem. 2014, 49, 1741–1746. [Google Scholar] [CrossRef]
- Mozia, S.; Tomaszewska, M.; Morawski, A.W. Studies on the effect of humic acids and phenol on adsorption-ultrafiltration process performance. Water Res. 2005, 39, 501–509. [Google Scholar] [CrossRef] [PubMed]
- Shi, X.; Tal, G.; Hankins, N.P.; Gitis, V. Fouling and cleaning of ultrafiltration membranes: A review. J. Water Process Eng. 2014, 1, 121–138. [Google Scholar] [CrossRef]
- Li, T.; Law, A.W.K.; Jiang, Y.S.; Harijanto, A.K.; Fane, A.G. Fouling control of submerged hollow fibre membrane bioreactor with transverse vibration. J. Membr. Sci. 2016, 505, 216–224. [Google Scholar] [CrossRef]
- Zhao, F.C.; Zhang, Y.L.; Chu, H.Q.; Jiang, S.H.; Yu, Z.J.; Wang, M.; Zhou, X.F.; Zhao, J.F. A uniform shearing vibration membrane system reducing membrane fouling in algae harvesting. J. Clean. Prod. 2018, 196, 1026–1033. [Google Scholar] [CrossRef]
- Her, N.; Amy, G.; McKnight, D.; Sohn, J.; Yoon, Y. Characterization of DOM as a function of MW by fluorescence EEM and HPLC-SEC using UVA, DOC, and fluorescence detection. Water Res. 2003, 37, 4295–4303. [Google Scholar] [CrossRef]
- Sim, L.N.; Chong, T.H.; Taheri, A.H.; Sim, S.T.V.; Lai, L.; Krantz, W.B.; Fane, A.G. A review of fouling indices and monitoring techniques for reverse osmosis. Desalination 2018, 434, 169–188. [Google Scholar] [CrossRef]
- Wang, H.; Qu, F.; Ding, A.; Liang, H.; Jia, R.; Li, K.; Bai, L.; Chang, H.; Li, G. Combined effects of PAC adsorption and in situ chlorination on membrane fouling in a pilot-scale coagulation and ultrafiltration process. Chem. Eng. J. 2016, 283, 1374–1383. [Google Scholar] [CrossRef]
- Gao, W.; Liang, H.; Ma, J.; Han, M.; Chen, Z.-L.; Han, Z.-S.; Li, G.-B. Membrane fouling control in ultrafiltration technology for drinking water production: A review. Desalination 2011, 272, 1–8. [Google Scholar] [CrossRef]
- Davini, P. Adsorption and Desorption of So2 on Active-Carbon-the Effect of Surface Basic Groups. Carbon 1990, 28, 565–571. [Google Scholar] [CrossRef]
- Chew, C.M.; Aroua, M.K.; Hussain, M.A. Advanced process control for ultrafiltration membrane water treatment system. J. Clean. Prod. 2018, 179, 63–80. [Google Scholar] [CrossRef]
- Ozkaya, B.; Kaksonen, A.H.; Sahinkaya, E.; Puhakka, J.A. Fluidized bed bioreactor for multiple environmental engineering solutions. Water Res. 2019, 150, 452–465. [Google Scholar] [CrossRef] [PubMed]
- Tan, L.C.; Lens, P.N.L. Addition of granular activated carbon during anaerobic oleate degradation overcomes inhibition and promotes methanogenic activity. Environ. Sci.-Water Res. 2021, 7, 762–774. [Google Scholar] [CrossRef]
- Thongmak, N.; Sridang, P.; Puetpaiboon, U.; Héran, M.; Lesage, G.; Grasmick, A. Performances of a submerged anaerobic membrane bioreactor (AnMBR) for latex serum treatment. Desalin. Water Treat. 2015, 57, 20694–20706. [Google Scholar] [CrossRef]
- Zhao, F.; Chu, H.; Yu, Z.; Jiang, S.; Zhao, X.; Zhou, X.; Zhang, Y. The filtration and fouling performance of membranes with different pore sizes in algae harvesting. Sci. Total Environ. 2017, 587–588, 87–93. [Google Scholar] [CrossRef] [PubMed]
- Xing, L.; Fabris, R.; Chow, C.W.K.; van Leeuwen, J.; Drikas, M.; Wang, D. Prediction of DOM removal of low specific UV absorbance surface waters using HPSEC combined with peak fitting. J. Environ. Sci. 2012, 24, 1174–1180. [Google Scholar] [CrossRef]
- Zularisam, A.W.; Ismail, A.F.; Salim, R. Behaviours of natural organic matter in membrane filtration for surface water treatment—A review. Desalination 2006, 194, 211–231. [Google Scholar] [CrossRef] [Green Version]


Publisher’s Note: MDPI stays neutral with regard to jurisdictional claims in published maps and institutional affiliations. |
© 2022 by the authors. Licensee MDPI, Basel, Switzerland. This article is an open access article distributed under the terms and conditions of the Creative Commons Attribution (CC BY) license (https://creativecommons.org/licenses/by/4.0/).
Share and Cite
Li, T.; Yu, H.; Tian, J.; Liu, J.; Yuan, T.; Xiao, S.; Chu, H.; Dong, B. PAC-UF Process Improving Surface Water Treatment: PAC Effects and Membrane Fouling Mechanism. Membranes 2022, 12, 487. https://doi.org/10.3390/membranes12050487
Li T, Yu H, Tian J, Liu J, Yuan T, Xiao S, Chu H, Dong B. PAC-UF Process Improving Surface Water Treatment: PAC Effects and Membrane Fouling Mechanism. Membranes. 2022; 12(5):487. https://doi.org/10.3390/membranes12050487
Chicago/Turabian StyleLi, Tian, Hongjian Yu, Jing Tian, Junxia Liu, Tonghao Yuan, Shaoze Xiao, Huaqiang Chu, and Bingzhi Dong. 2022. "PAC-UF Process Improving Surface Water Treatment: PAC Effects and Membrane Fouling Mechanism" Membranes 12, no. 5: 487. https://doi.org/10.3390/membranes12050487