Article

Separation and Concentration of Nitrogen and Phosphorus in a Bipolar Membrane Electrodialysis System

1
School of Safety and Environment, Fujian Chuanzheng Communications College, Fuzhou 350007, China
2
College of Environmental and Resource Sciences, College of Carbon Neutral Modern Industry, Fujian Key Laboratory of Pollution Control & Resource Reuse, Fujian Normal University, Fuzhou 350007, China
3
Key Laboratory of Urban Pollutant Conversion, Institute of Urban Environment, Chinese Academy of Sciences, Xiamen 361021, China
4
Department of Chemical Engineering, ProcESS—Process Engineering for Sustainable System, KU Leuven, Celestijnenlaan 200F, B-3001 Leuven, Belgium
5
Faculty of Engineering and the Built Environment, Tshwane University of Technology, Private Bag X680, Pretoria 0001, South Africa
*
Authors to whom correspondence should be addressed.
Membranes 2022, 12(11), 1116; https://doi.org/10.3390/membranes12111116
Submission received: 10 October 2022 / Revised: 30 October 2022 / Accepted: 4 November 2022 / Published: 8 November 2022

Abstract

:
Struvite crystallization is a successful technique for simultaneously recovering PO43− and NH4+ from wastewater. However, recovering PO43− and NH4+ from low-concentration solutions is challenging. In this study, PO43−, NH4+, and NO3 were separated and concentrated from wastewater using bipolar membrane electrodialysis, PO43− and NH4+ can then be recovered as struvite. The separation and concentration of PO43− and NH4+ are clearly impacted by current density, according to experimental findings. The extent of separation and migration rate increased with increasing current density. The chemical oxygen demand of the feedwater has no discernible impact on the separation and recovery of ions. The migration of PO43−, NH4+, and NO3 fits zero-order migration kinetics. The concentrated concentration of NH4+ and PO43− reached 805 mg/L and 339 mg/L, respectively, which demonstrates that BMED is capable of effectively concentrating and separating PO43− and NH4+. Therefore, BMED can be considered as a pretreatment method for recovering PO43− and NH4+ in the form of struvite from wastewater.

1. Introduction

Phosphorous and nitrogen are extensively used in industrial and agricultural operations as a result of the growth of the global economy, and their subsequent release into the environment has led to environmental issues such as eutrophication and red tides [1]. Phosphorous and nitrogen are vital constituents of fertilizers in agricultural production [2]. The primary sources of phosphorus are phosphate rocks [3], from which more than 90% of phosphorus used in commercial fertilizers and animal feed is obtained [4]. However, high-quality phosphate rocks have become increasingly scarce and expensive, yet they are abundant in some nations [5]. By the end of the 21st century, the known worldwide phosphate rock reserves are anticipated to run out [6]. This has led to widespread concerns about the health of the ecosystem, future phosphorus supplies, and food production. As a result, some nations have recently started making efforts to recover phosphorus from wastewater rather than its removal [7], especially in nations with limited to no phosphate rock resources [8]. In contrast to phosphorus, nitrogen resources are plentiful and have not been shown to be in short supply globally. They can also form a closed-circuit cycle in the natural environment. However, the usage of nitrogen fertilizer and its subsequent loss in agriculture has created a significant imbalance in the global nitrogen cycle. Each year, some 100 million tons of synthetic ammonia are produced from chemical fertilizers, and the majority of this ammonia is not taken up by plants, leaving many areas with surplus nitrogen. Therefore, it is essential to minimize phosphorus and nitrogen discharge and optimize their recovery from wastewater in accordance to the environmental protection and “circular economy” strategies being followed.
An effective technique for concentrating anions and cations from salty wastewater is electrodialysis [9]. A bipolar membrane (BPM) allows to split water into H+ and OH in the presence of an electrical field [10]. Bipolar membrane electrodialysis (BMED), which combines electrodialysis with a bipolar membrane to treat saline wastewater and convert anions and cations to the equivalent acid and base, has attracted increasing attention in recent years [11]. In prior work [12,13], BMED was employed to successfully recover HCl and NH3∙H2O from simulated NH4Cl. BMED has not been for explored PO43− recovery, while nanofiltration and forward osmosis are frequently used to separate and concentrate PO43− from wastewater [14]. In order to separate the enriched anions into monovalent and multivalent ions, as well as to increase the purity of the recovered anions, a combined system of the monovalent selective anion exchange membranes (MVA) and selectrodialysis (SED) was developed. A selectrodialysis system was utilized to concentrate PO43− in water and achieve the separation of PO43− and Cl, significantly enhancing the purity of recovered PO43− [15].
This work explores a selective BMED (SBMED) that integrates BMED and MVA to separate and concentrate PO43−, NH4+, and NO3 from wastewater, while also separating PO43− and NO3. This system can obtain high-purity PO43−, which may be utilized as a pretreatment system for recovering NH4+ and PO43− in the form of struvite, in addition to recovering NH4+ from wastewater in the form of NH3·H2O. How do variables like current density and organic matter content impact the effectiveness of NH4+ and PO43− separation and concentration? What are the factors that affect its migration rate? How effectively does MVA separate NO3 and PO43−? What are the kinetics of NH4+ and PO43− removal? These questions remain unanswered.
Due to the fact that the electrolyte concentration has a substantial impact on energy consumption, the influence of the electrolyte concentration on cell voltage was initially examined in this study. Second, the impact of current density on the separation rate, concentration, and migration rate of PO43−, NH4+, and NO3 was examined. Third, the kinetics of PO43−, NH4+, and NO3 migration were studied. Fourth, the relationship between the concentration of organic matter and the rates of separation and concentration of PO43−, NH4+, and NO3 was examined. Finally, the concentration capacity of the SBMED for PO43− and NH4+ was examined.

2. Materials and Methods

2.1. Materials and Agents

All the analytical grade chemical reagents utilized in this study were sourced from Sinopharm Chemical Reagent Co. (Shanghai, China). Table S1 provides a complete listing of the membranes employed in this study(see Supplementary Materials). Pure water produced by a water-purification system (Purelab® Pulse 2, Elga, High Wycombe, England) was used throughout the experimentation. The solution containing PO43− (200 mg/L), NH4+ (100 mg/L), and NO3 (20 mg/L) was prepared by dissolving NH4Cl, Na3PO4, and NaNO3 in pure water.

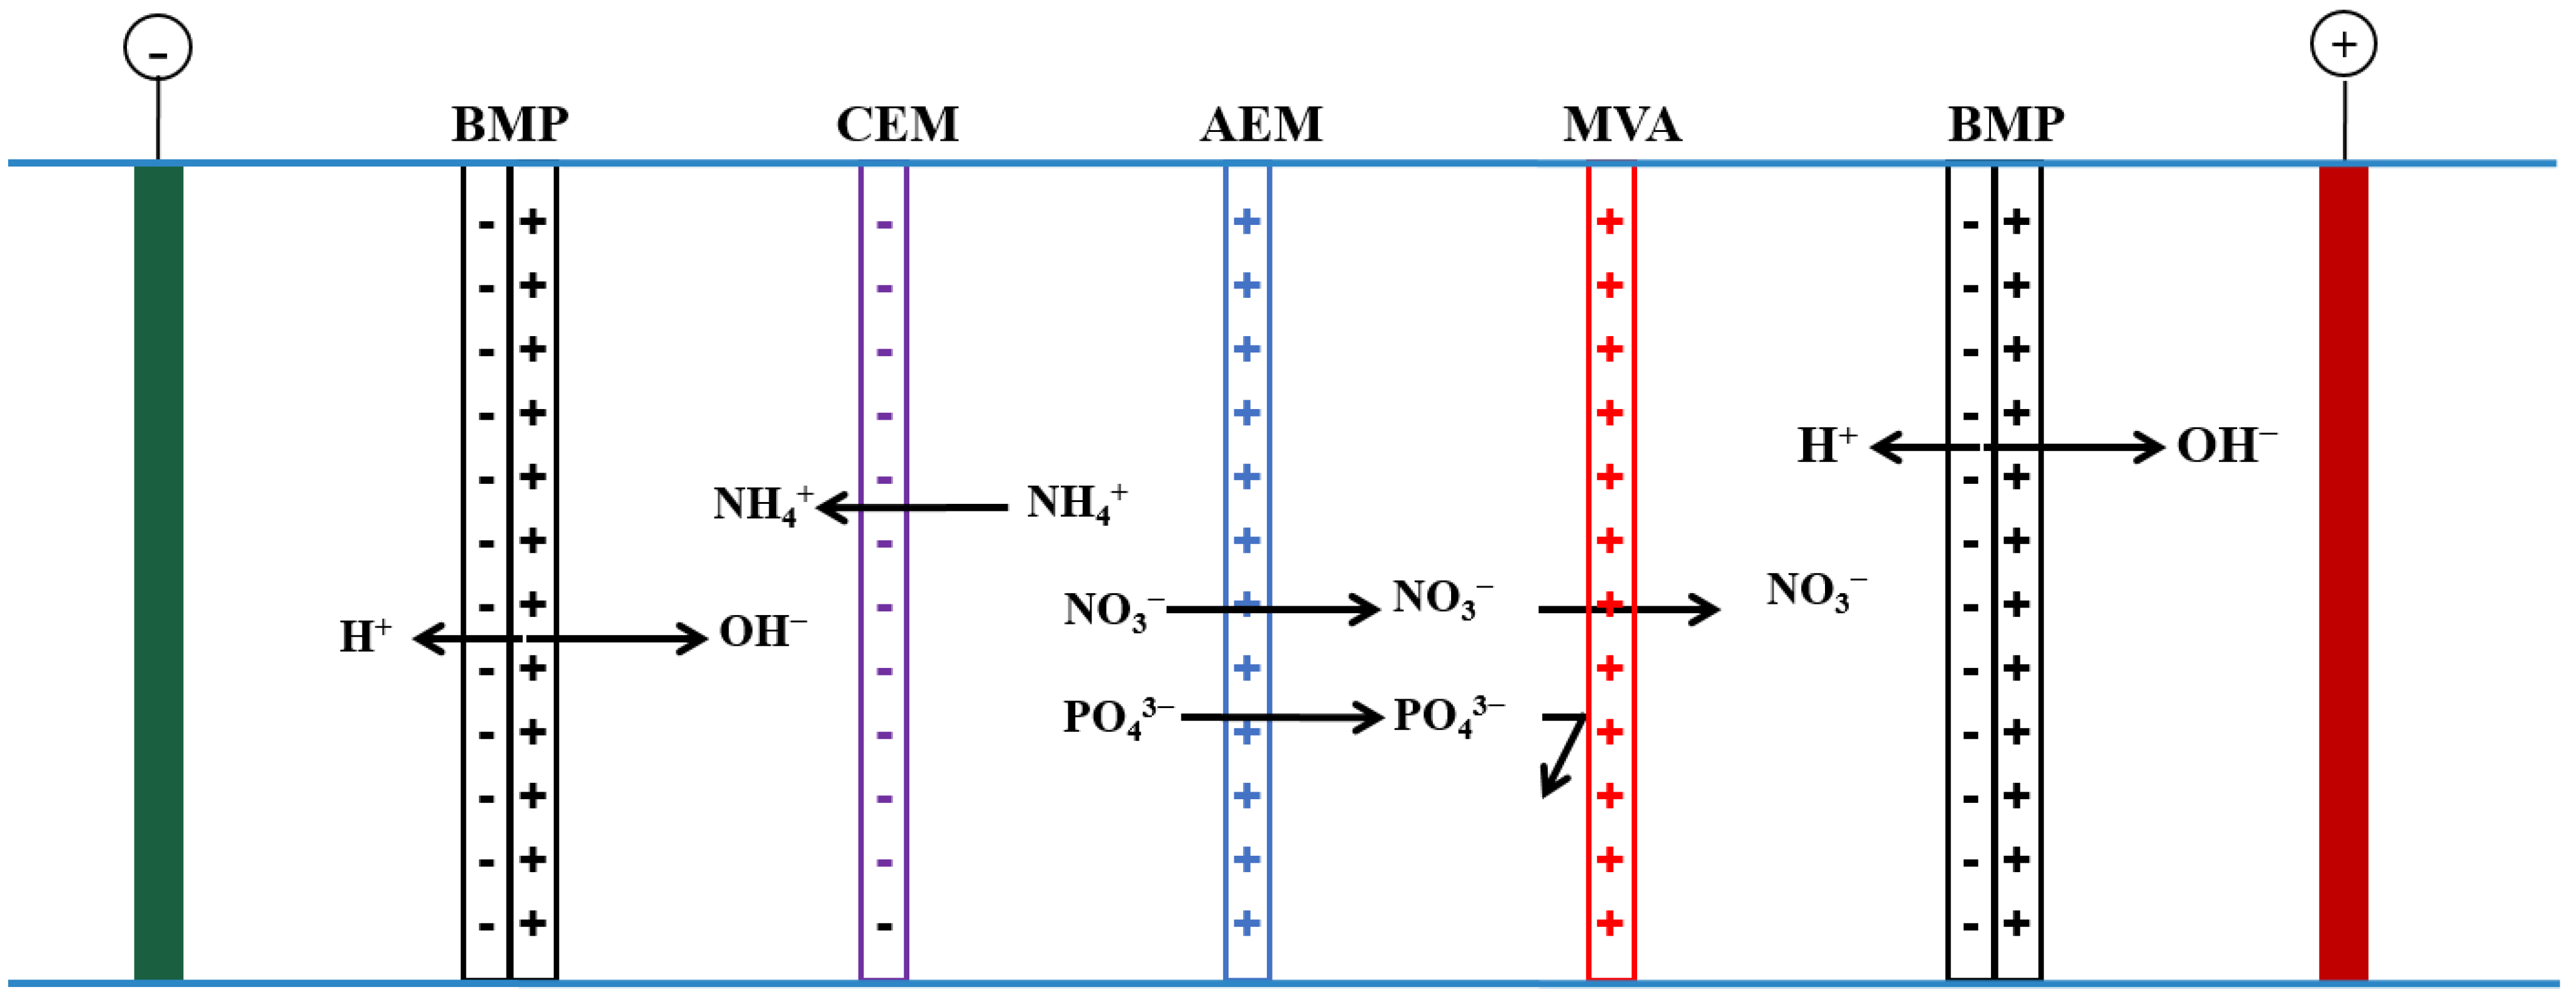
2.2. Experimental Setup

The experimental setup is depicted in Figure 1. Two titanium plates were employed as the anode and cathode, respectively, and the BPM, cation exchange membrane (CEM), anion exchange membrane (AEM), and MVA were all placed into the BMED. From left to right, the device consists of a cathode compartment (CC), an ammonia water compartment (AWC), a wastewater compartment (WWC), a phosphate compartment (PC), a nitric acid compartment (NAC), and an anode compartment (AC). Each compartment had an effective volume of 45 mL, and the membrane’s effective area was 12 cm2. A sodium sulfate (Na2SO4) solution with a 0.8 mol/L concentration was utilized as the electrolyte during the experiment. Every 10 min, the voltage value was recorded. A current density of 0.5, 1.0, 2.0, 3.0, and 4.0 mA/cm2 was used during the experiments according to a previous study [16]. At pre-determined intervals of 10, 20, 30, 40, 60, 80, 100, and 120 min, water samples were taken.
Under the influence of the electric field, during the experiment, NH4+ in the WWC migrates into the AWC to form NH3·H2O with the OH generated by the bipolar membrane, and PO43− and NO3 migrate to PC via the AEM, NO3 then migrates to the NAC to form HNO3 with H+ generated by the bipolar membrane. MVA achieves the separation and concentration of NO3 and PO43− by retaining PO43− in the PC.

2.3. Calculation Methods

According to the Chinese standard procedure, a UV-vis spectrophotometer was used to measure PO43−, NH4+, and NO3 [17]. The separation and concentration rates of PO43-, NH4+, and NO3 were determined through Equations (1) and (2). Furthermore, Equations (3) and (4) were used to compute the energy consumption and current efficiency for the separation and enrichment of PO43−, NH4+, and NO3, respectively [18], and Equation (5) was used to calculate the ion migration rate.
Separation   rate   ( % ) = C o C t C o × 100
Concentration   rate   ( % ) = C r C o × 100
Specific   energy   consumption   ( SEC ,   kW · h / g ) = U I d t ( C o C t ) V × 10 3
Current   efficiency   η   ( % ) = ( C o C t ) V F n 60 I t M × 100
Ions   migration   rate   ( g / h / m 2 ) = 60 ( C o C t ) V S t
where Co is the initial concentration of PO43−, NH4+, and NO3 in the WWC at the initial time, g/L; Ct is the concentration of PO43−, NH4+, and NO3 at time t, g/L; Cr is the concentration of PO43−, NH4+, and NO3 in PC, AWC, and NAC at time t, g/L; V is wastewater volume, L; t is the experimental time, min; U is the BMED voltage, V; I is the current, A; F is Faraday’s constant, 96,500 C/mol; M is the molar mass of PO43−, NH4+, and NO3, g/mol; n is the ionic valence state of PO43−, NH4+, and NO3; S is the effective membrane area, m2.

2.4. Analysis of Reaction Kinetic Process

The reaction kinetics is mainly used to study a dynamic non-equilibrium system where the concentration of the reactants decreases with time while the concentration of the products increases. Equation (6) displays the related equation. The kinetic equation is frequently separated into zero-, first-, and second-order kinetics in accordance with the various reaction orders (Equations (7)–(9)) [19].
d C d t = k C n
C t C o = k t
ln C t ln C o = k t
1 C t 1 C o = k t
where C is the reactant concentration, Ct is the reactant concentration at time t, Co is the initial reactant concentration, t is the reaction time, k is the coefficient of kinetics, and n is the reaction order.

3. Results and Discussion

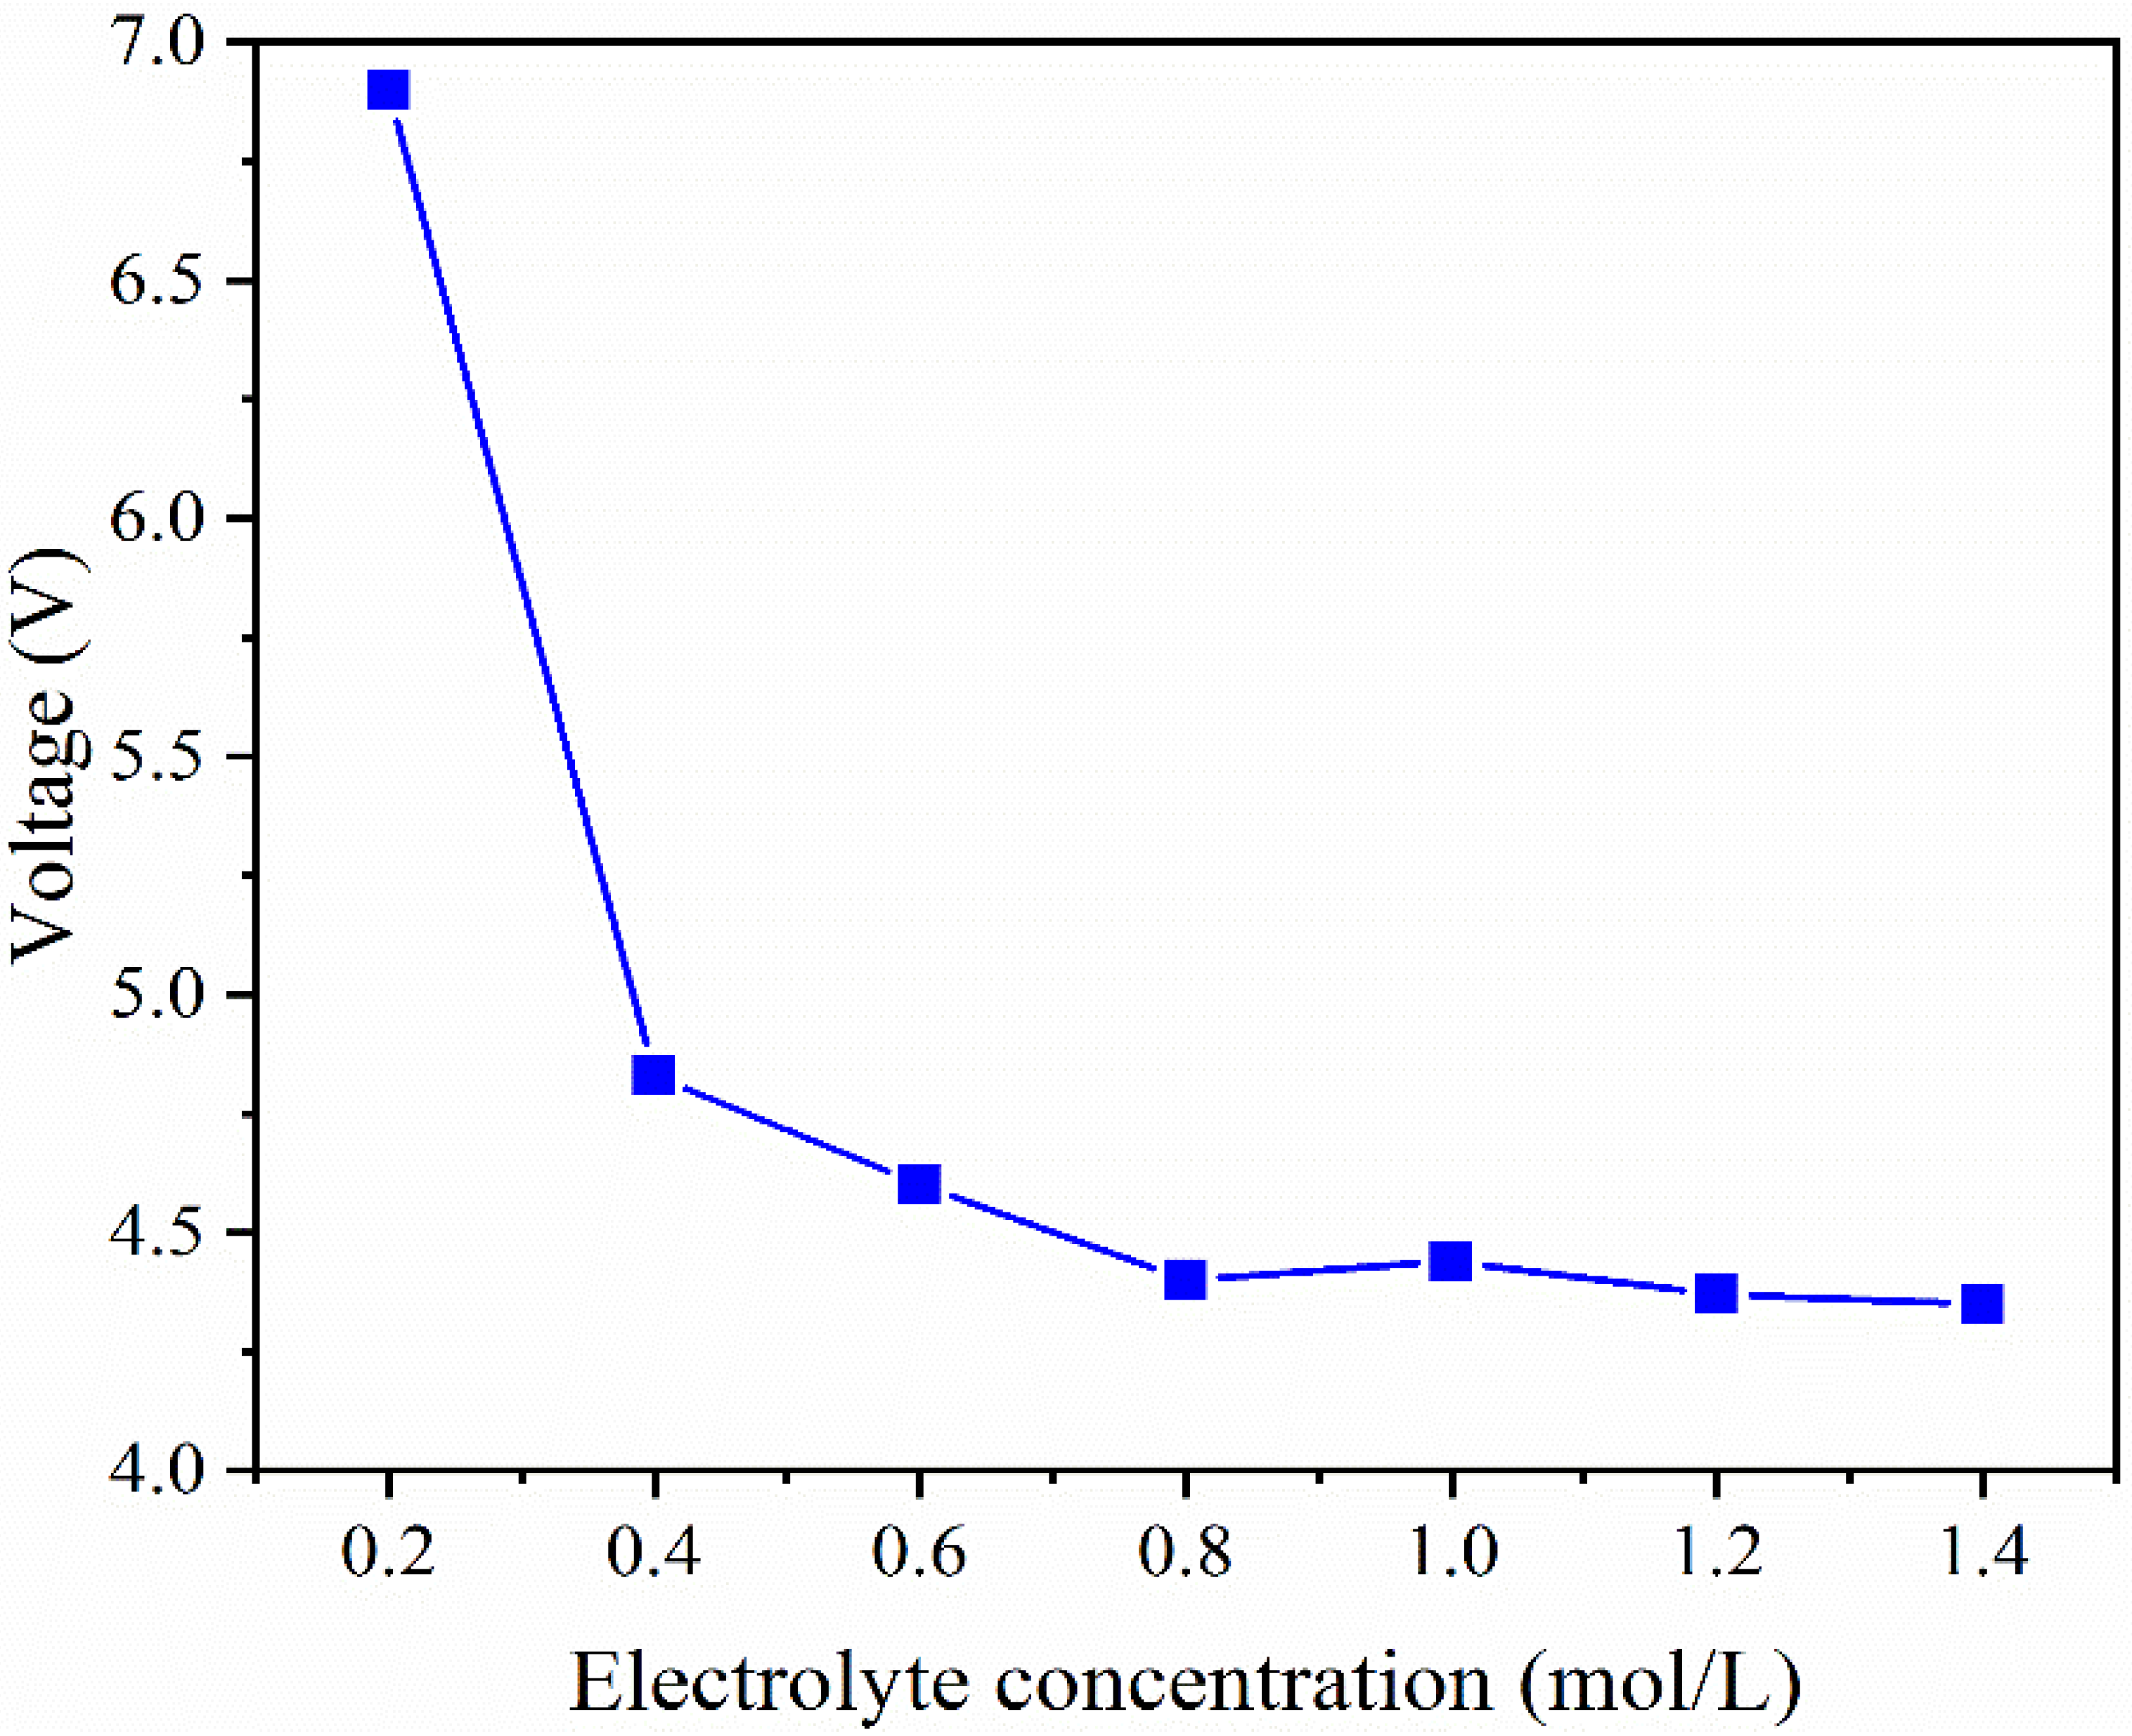
3.1. Influence of Electrolyte Concentration on Cell Voltage

The influence of the electrolyte concentration on cell voltage was examined with a current density of 2.0 mA/cm2 and electrolyte Na2SO4 concentrations of 0.2, 0.4, 0.6, 0.8, 1.0, 1.2, and 1.4 mol/L in each compartment.
It is evident from Figure 2, that when the concentration of electrolyte increased, the cell voltage first dropped rapidly before stabilizing. As the concentration of Na2SO4 was increased from 0.2 to 0.8 mol/L, the cell voltage dropped from 6.9 to 4.4 V. The cell voltage fell to 4.35 V as the concentration of Na2SO4 was further increased further from 0.8 to 1.4 mol/L. These are primarily driven by the fact that the system impedance and current are connected to the cell voltage. Since the current is constant (0.024 A), the system impedance was used to regulate the cell voltage. According to Figure 1, the system impedance is mostly made up of compartments and membranes. The cell voltage is mostly correlated with the compartment impedance during the experiment because the impedance of each membrane is also a consistent value. The conductivity of each compartment increased (reduced impedance) when the electrolyte content increased from 0.2 to 0.8 mol/L, thus, causing a decrease in impedance and cell voltage. Theoretically, once the electrolyte concentration was increased from 0.8 to 1.4 mol/L, the impedance of each compartment would decrease even more. However, the impedance decrease brought on by the increase of electrolyte concentration from 0.8 to 1.4 mol/L is negligible in comparison to the system’s overall impedance [20]. Consequently, the cell voltage did not change significantly as the electrolyte concentration increased from 0.8 to 1.4 mol/L. In the subsequent experiment, 0.8 mol/L of Na2SO4 was utilized as the electrolyte in all compartments aside from the WWC to minimize the amount of electrolyte as much as possible and achieve a lower cell voltage.

3.2. Effect of Current Density on Ions Separation and Concentration

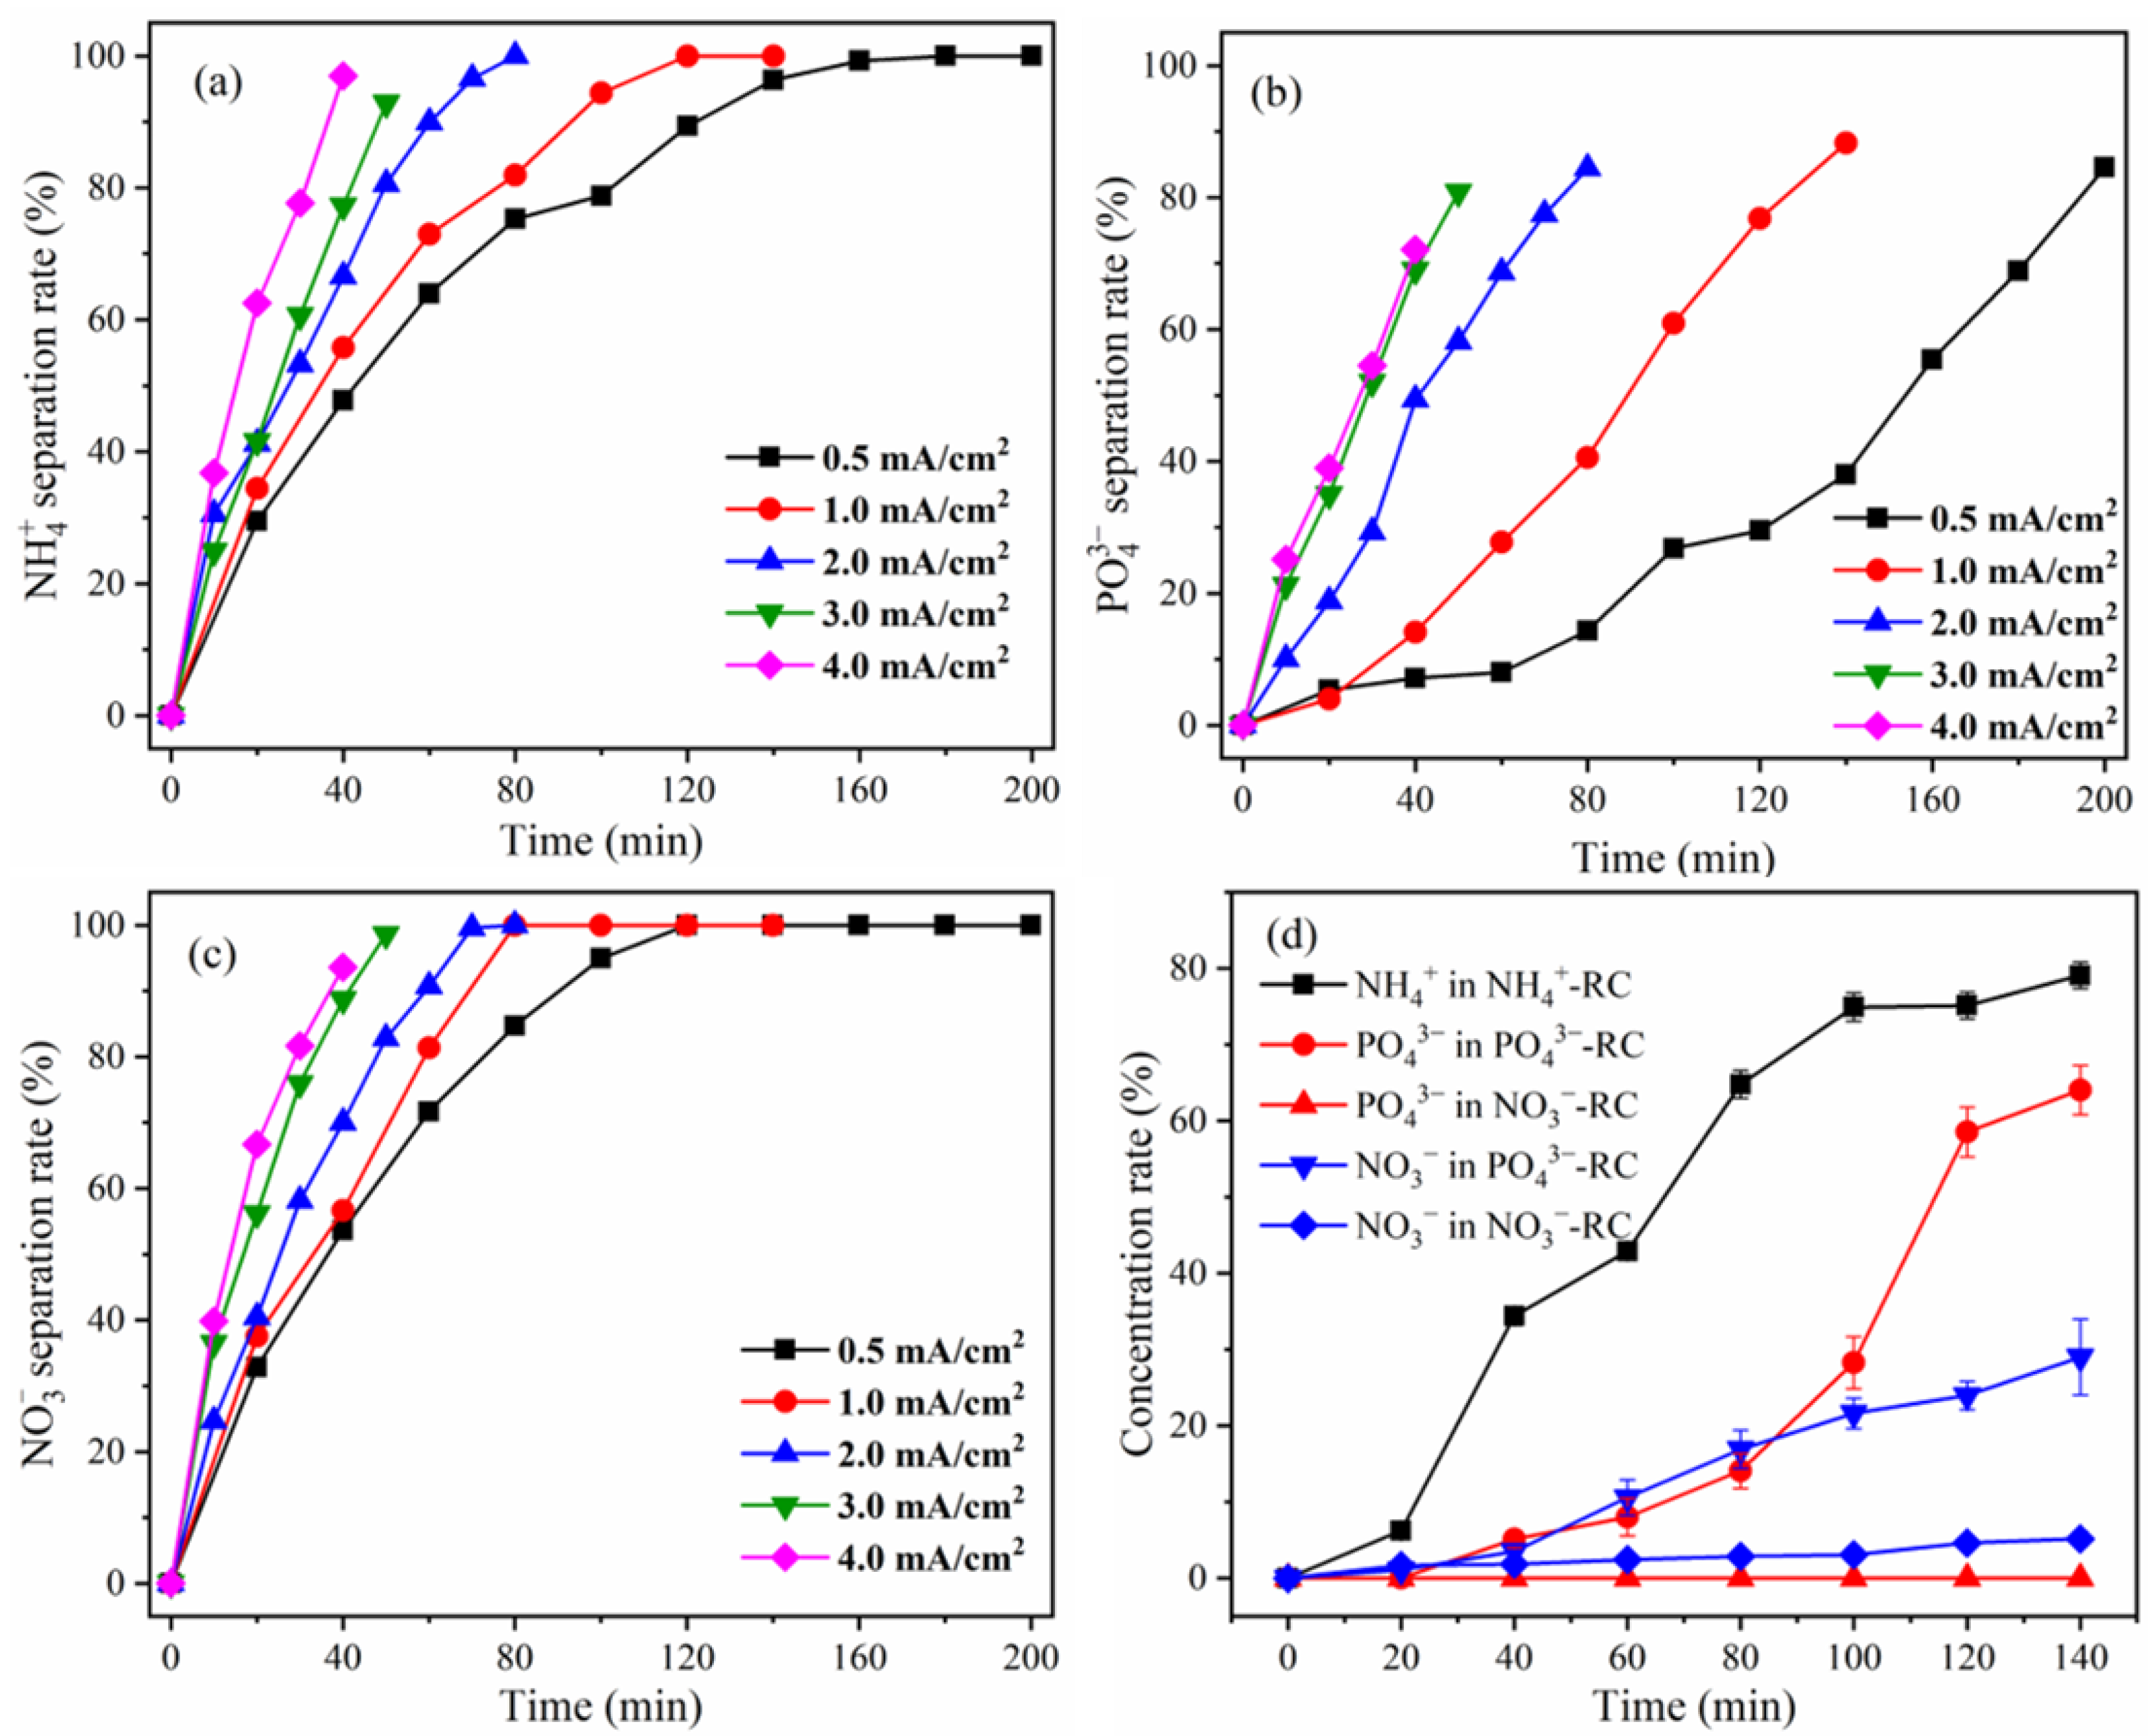
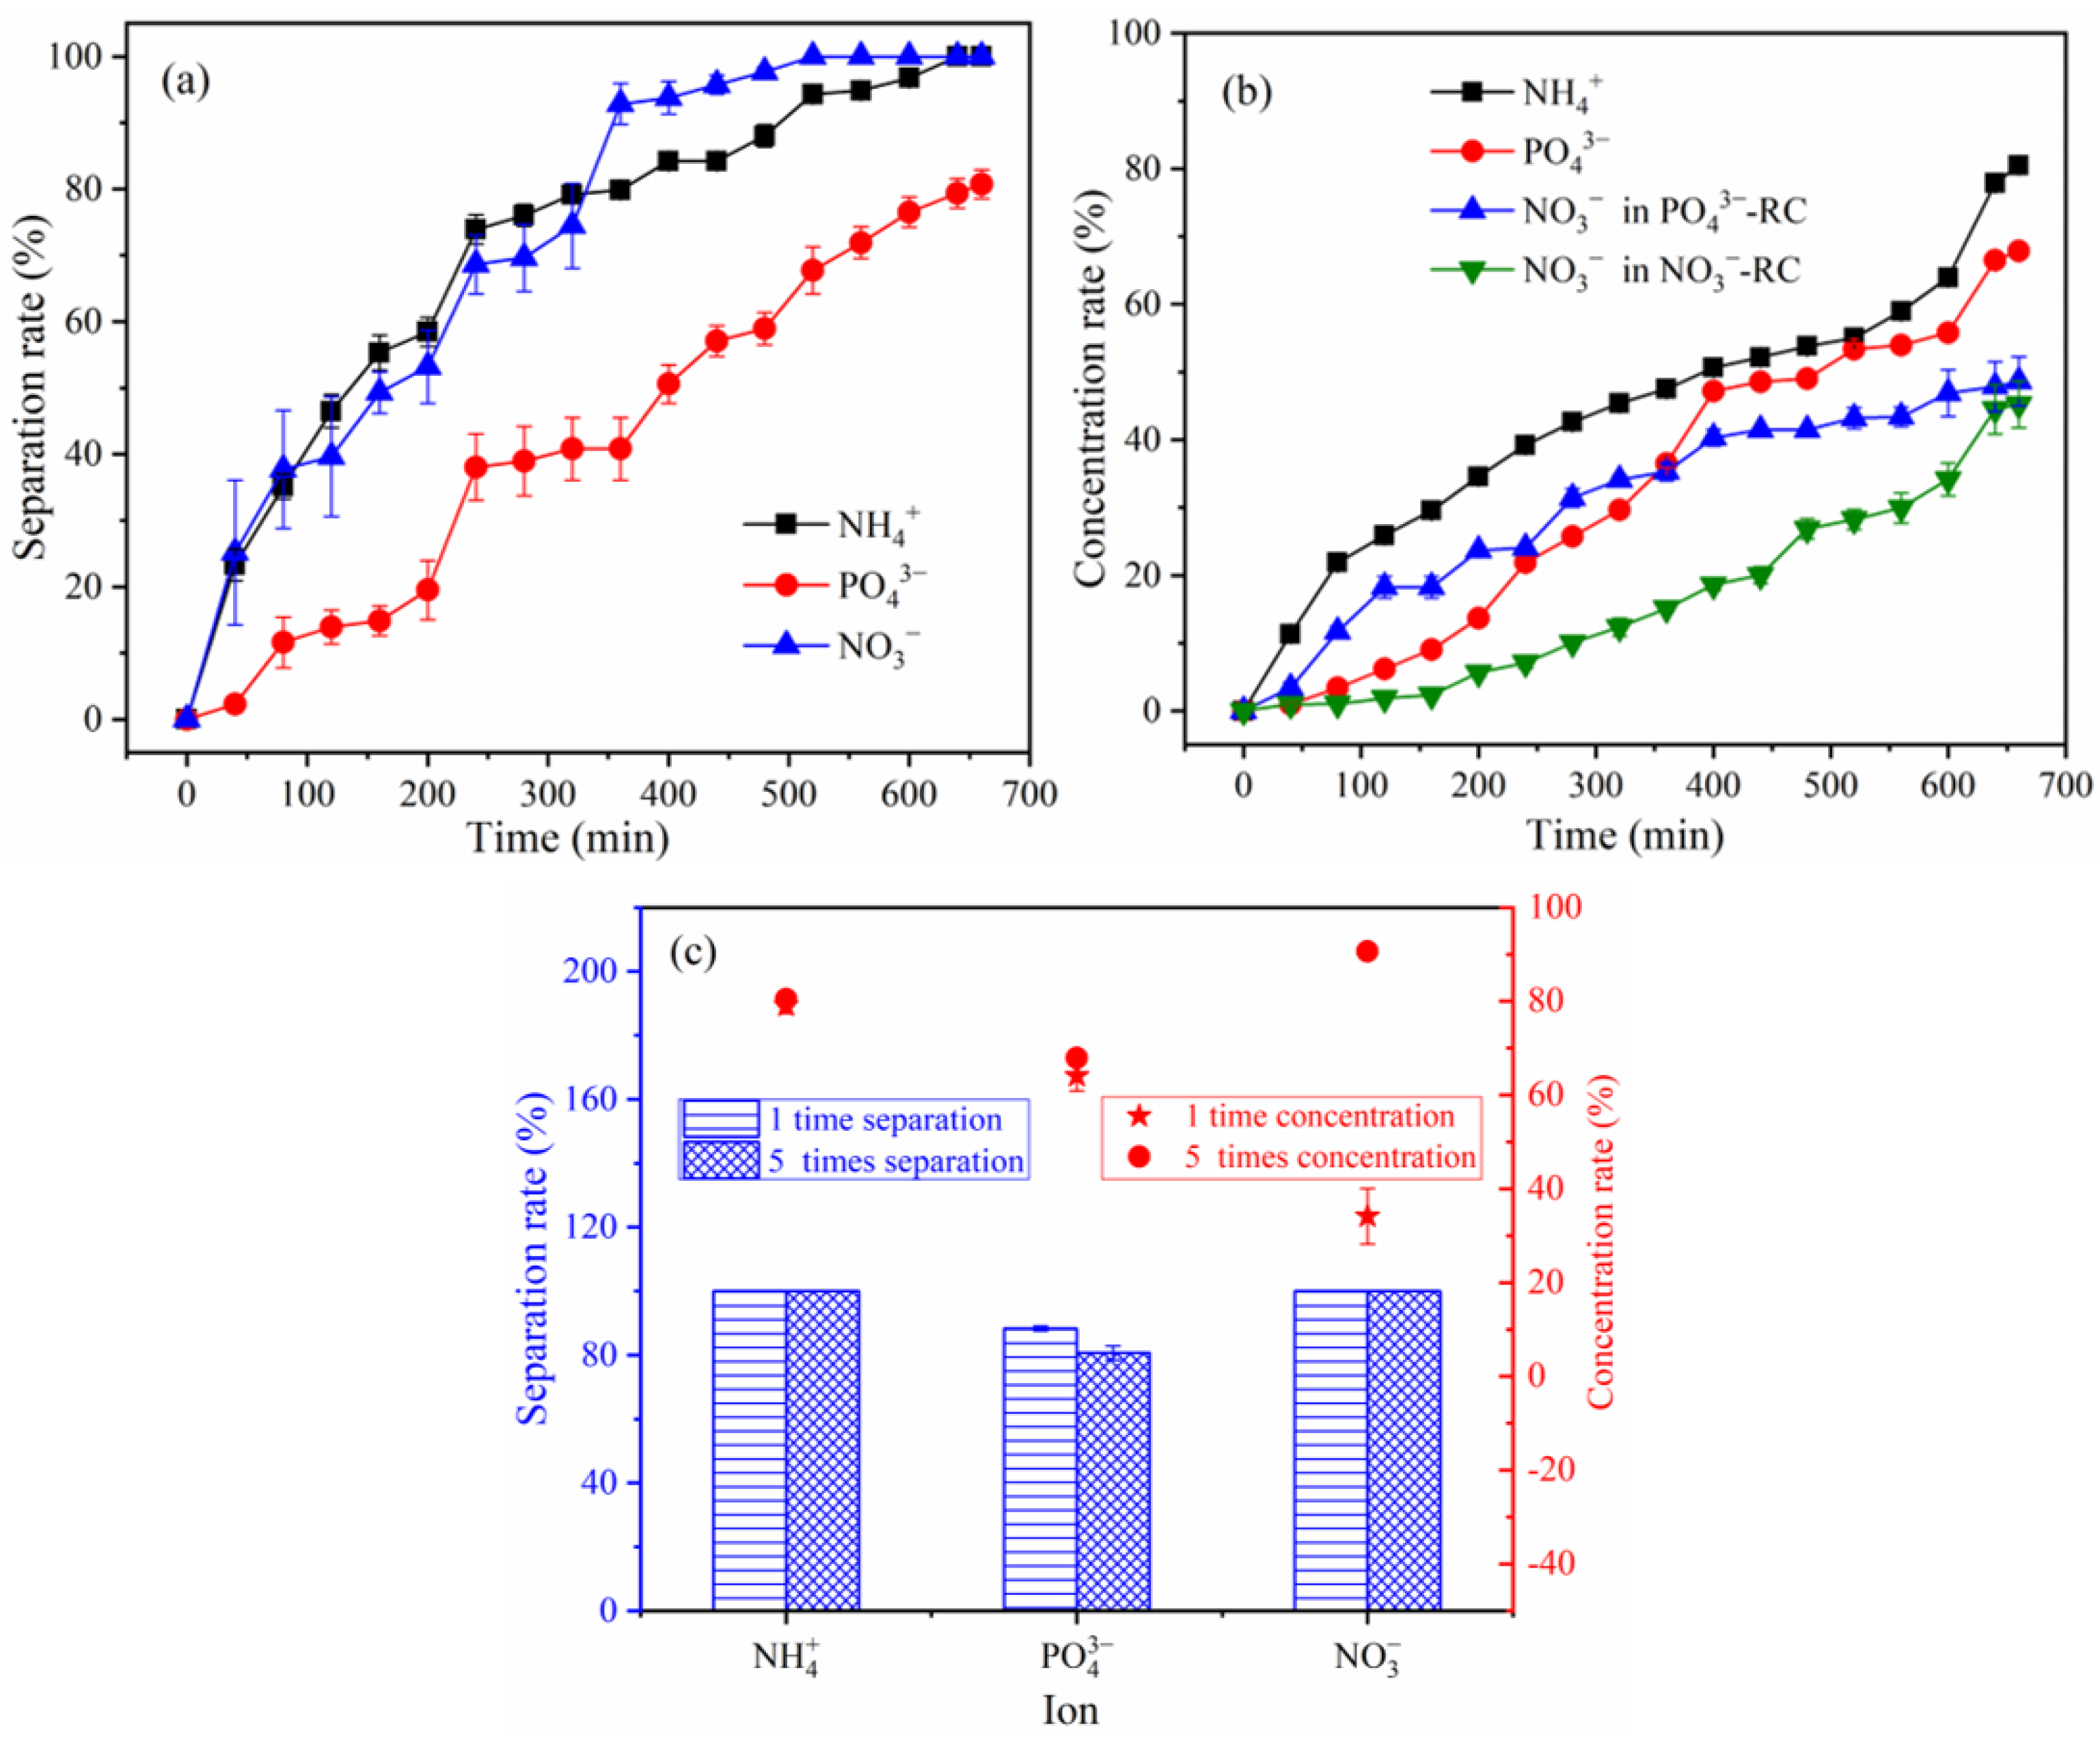
3.2.1. Effect of Current Density on the Separation of NH4+, PO43−, and NO3

According to the expectations, the separation rates of NH4+, PO43−, and NO3 increased over time (Figure 3a,b). Additionally, the current density increased the rate of separation of NH4+, PO43−, and NO3. The extents of NH4+ separation were 47.8% (0.5 mA/cm2), 55.8% (1.0 mA/cm2), 66.6% (2.0 mA/cm2), 77.3% (3.0 mA/cm2), and 97.0% (4.0 mA/cm2) after 40 min; that of PO43− were 7.2%, 14.1%, 49.4%, 69.0% and 72.1% and the extents of NO3 separation were 53.7, 56.7, 70.0, 88.7, and 93.6%, respectively. This is due to the fact that when the current density is increased, the electric field force acting on ions is increased, causing ion migration to accelerate [18]. However, as time passes, a high separation rate can still be achieved with a modest current density. For instance, when the current density was 0.5 and 1.0 mA/cm2, the extents of NH4+ separation were 96.4 and 100% respectively, and PO43− separation rates were 38.0 and 88.3%, respectively, while the NO3 separation rates were 100% after 140 min.

3.2.2. Concentration Rate of NH4+, PO43−, and NO3

Figure 3d demonstrates the concentration rate of NH4+, PO43−, and NO3 in each compartment when the current density was 1.0 mA/cm2. At 140 min, the NH4+ concentration rate in AWC was 79.1%, which was lower than the NH4+ separation rate. This is primarily caused by the following two reasons. First, the CEM has a large number of anionic functional groups [21], which absorbed part of NH4+; second, when the pH is high, the equilibrium reaction of Equation (10) occurs in the AWC, and some NH4+ is eliminated as NH3 as a result. This could slow down the rate at which NH4+ builds up in the WWC. According to Figure 3d, the PC had a concentration rate of PO43− of 64.1%, whereas no PO43− was detected in the NAC. It is imperative to mention here that the concentration of PO43− is also significantly lower than the separation rate, which is primarily because some of PO43− was adsorbed by AEM [22]. Since no PO43− was detected in the NAC, MVA had good retention of PO43−. In terms of NO3 recovery, at 140 min, 29.0% NO3 was recovered in the PC and 5.2% NO3 was recovered in the NAC. The NO3 concentration rate in the PC and the NAC was significantly lower than the NO3 separation rate, this is primarily due to AEM and MVA adsorbing the majority of NO3.
NH4+ + OH ⇌ NH3·H2O ⇌ NH3↑ + H2O

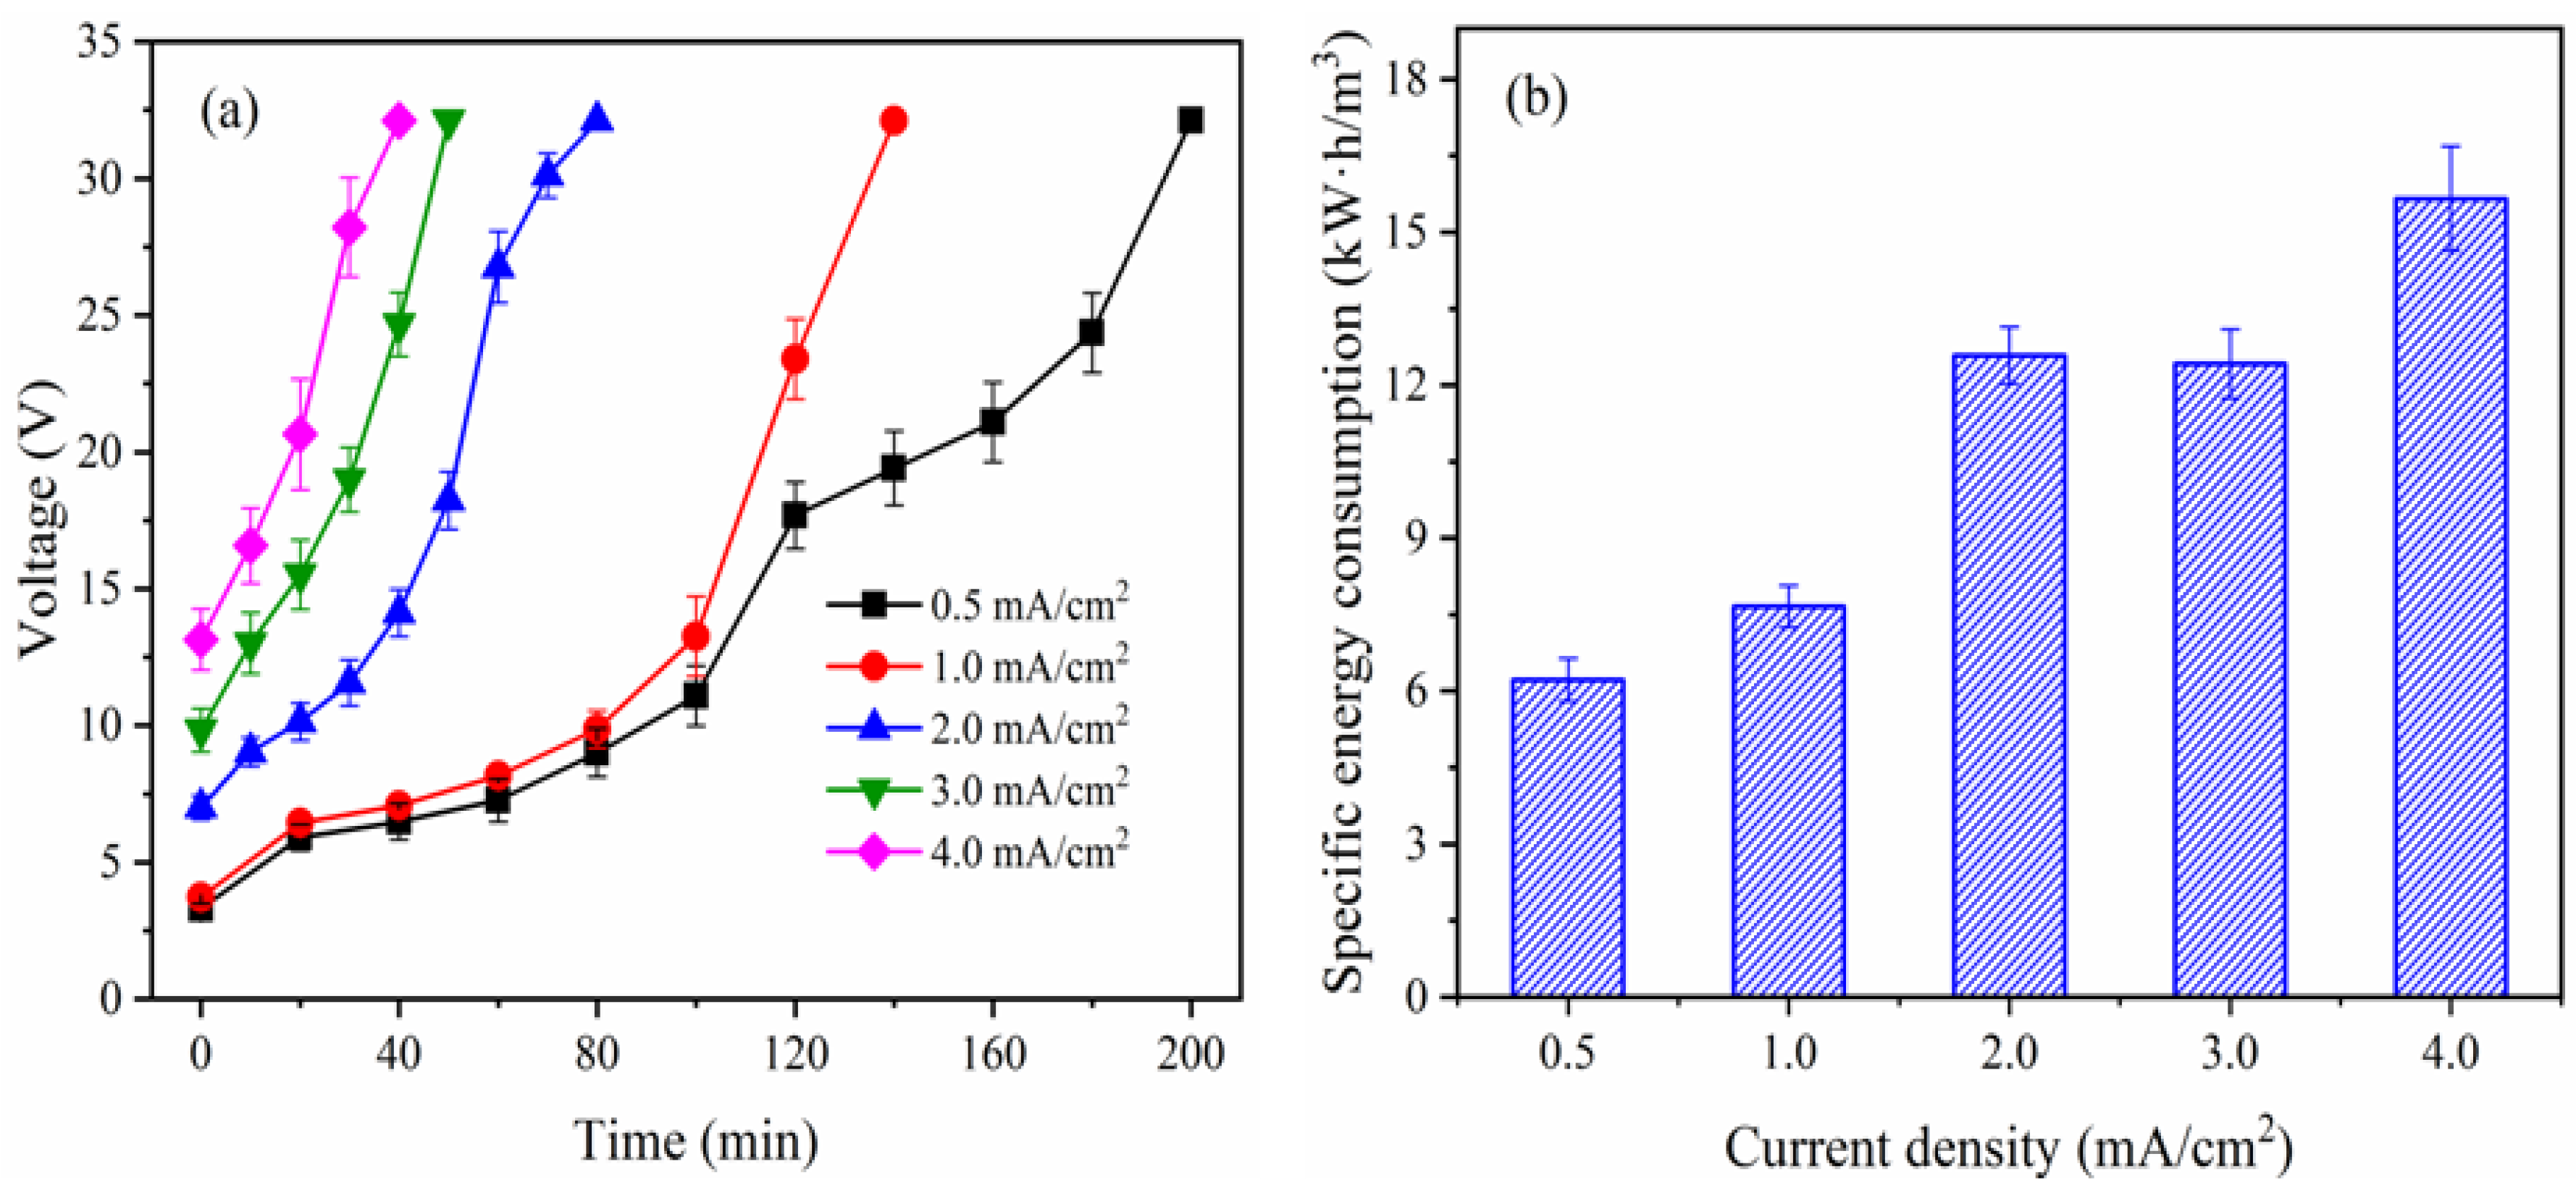
3.2.3. Effect of Current Density on Cell Voltage and Energy Consumption

According to Figure 4a, the cell voltage increased rapidly with time, this is because the conductivity in the WWC had a decrease within the corresponding time frame (Figure S1) due to NH4+ migrating from the WWC to the AWC and PO43− and NO3 migrating from the WWC to the PC, respectively, under the influence of the electric field [23]. Additionally, it was discovered that the cell voltage increased with current density. This is because the cell voltage directly correlates with both current and impedance, and as current increased, so did voltage. Likewise, as current density increased, ions moved faster from the WWC to the AWC and PC, increasing the cell voltage. In contrast, the conductivity in WWC decreased with an increase in current density (Figure S1) [24]. The specific energy consumption was calculated after 40 (4.0 mA/cm2), 50 (3.0 mA/cm2), 80 (2.0 mA/cm2), 140 (1.0 mA/cm2), and 200 min (0.5 mA/cm2) since a similar PO43− separation rate was observed during these times under varying current densities. The specific energy consumption increased with current density, as can be seen in Figure 4b. Equation (3) states that the specific energy consumption is inversely proportional to the quantity of eliminated ions and directly proportional to cell voltage, current, and time. The cell voltage and current increased with current density, which could in return increase the specific energy consumption. However, the increase in current density reduces the time needed for the ions separation rate to reach a given level, which helps to conserve specific energy. Meanwhile, a different quantity of PO43−, NH4+ and NO3 was removed under the condition of a varying current density. In light of the aforementioned variables, the specific energy consumption depicted in Figure 4b was derived.

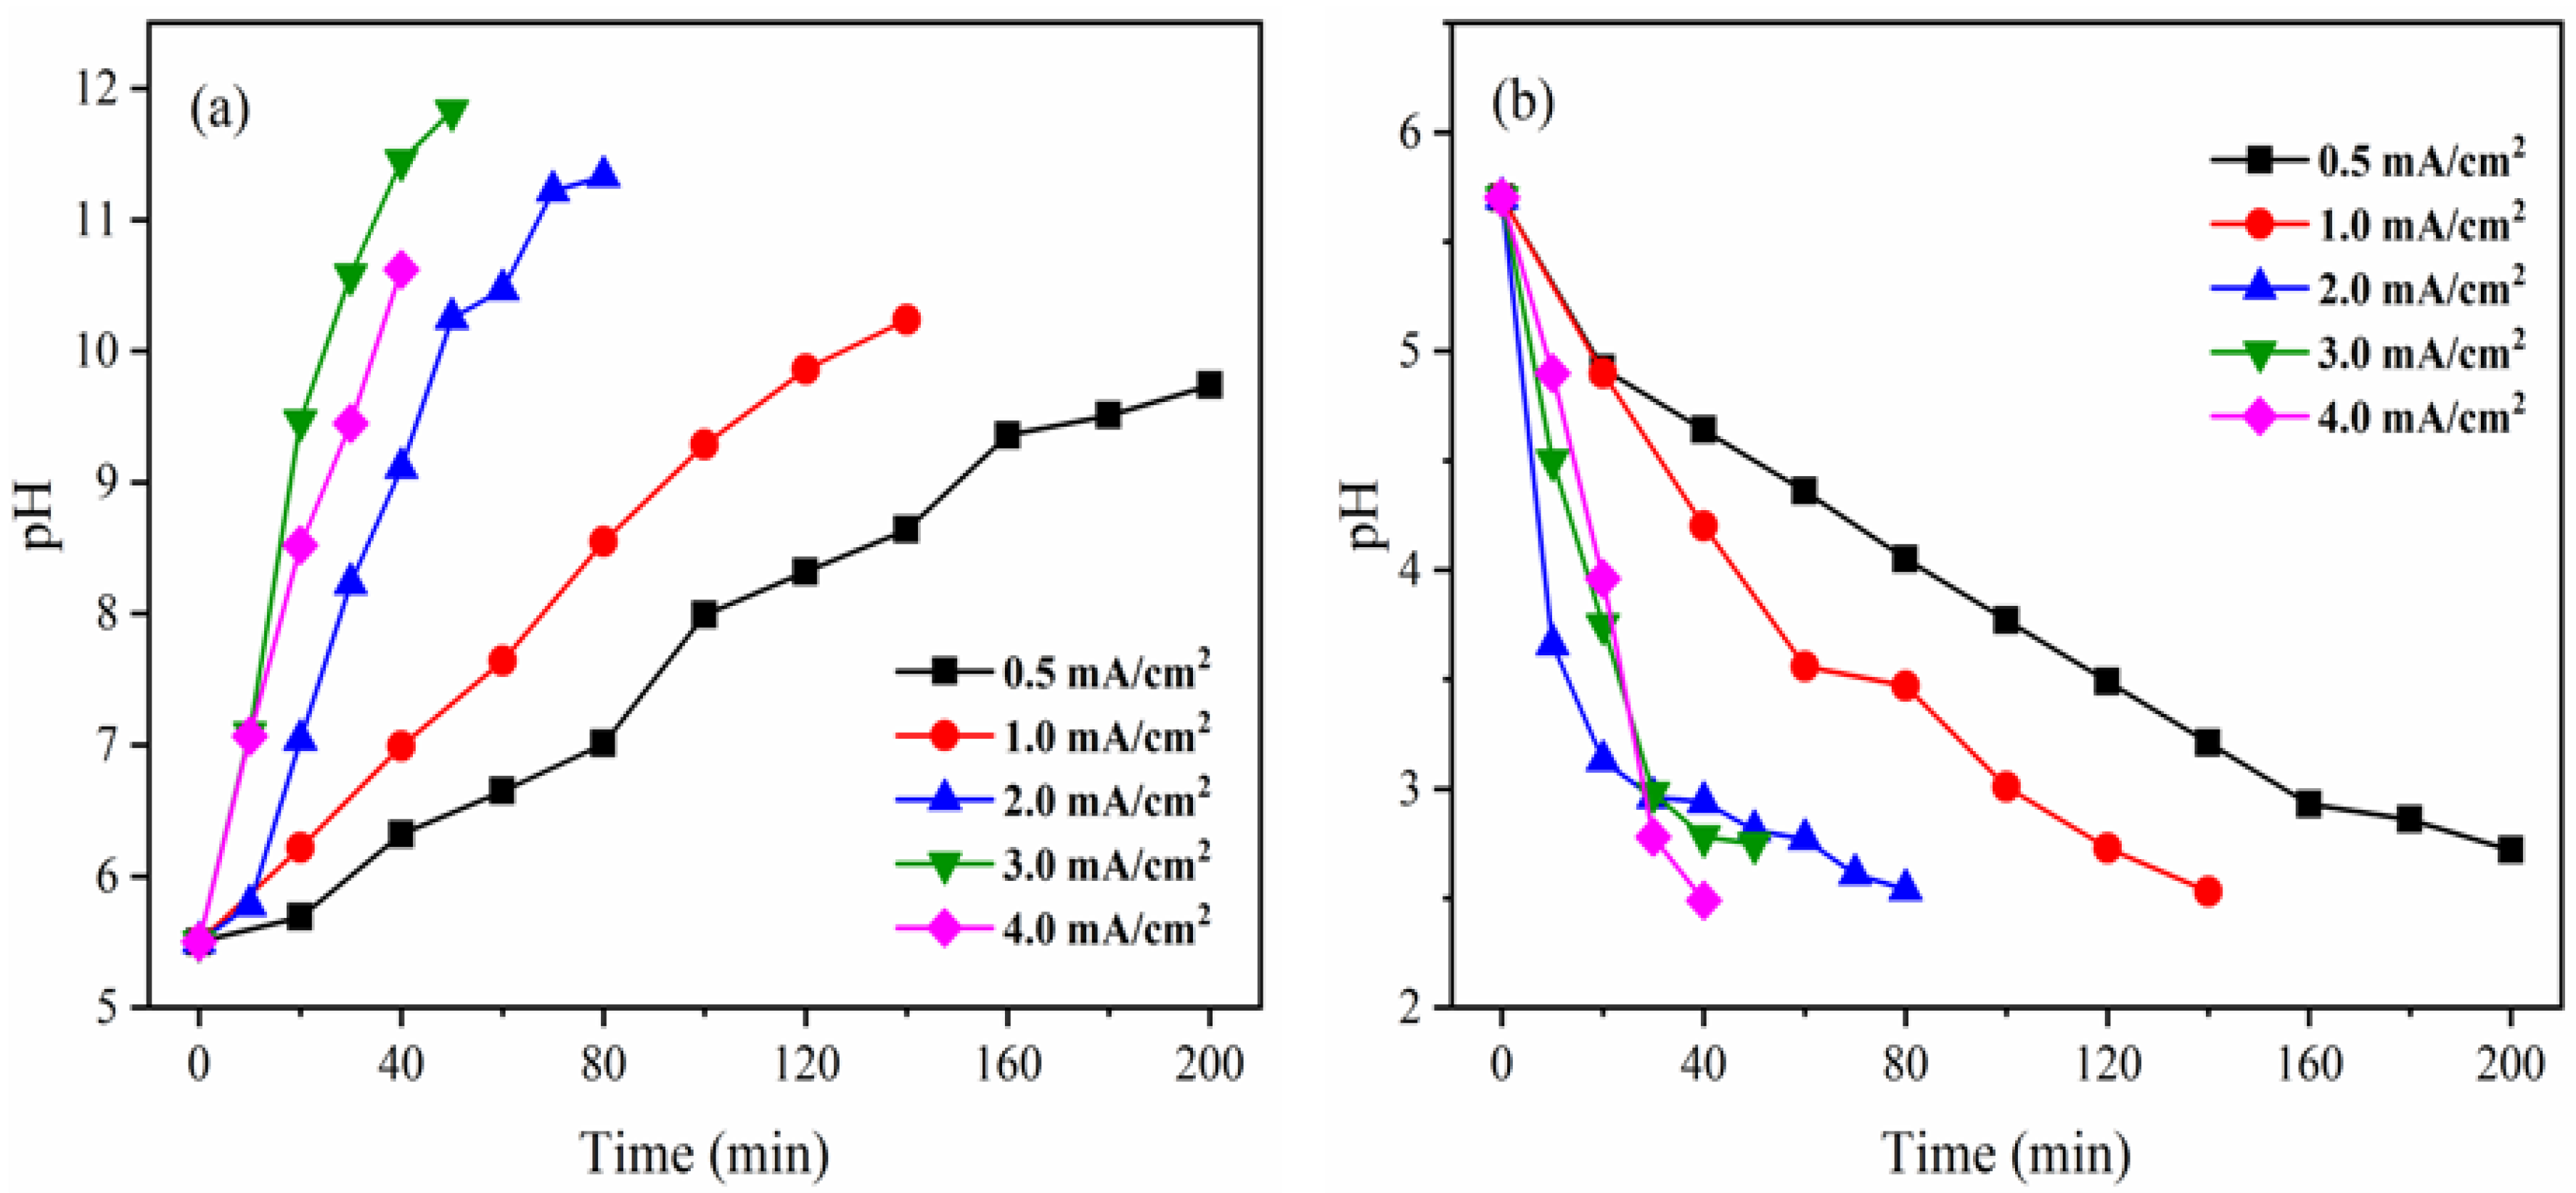
3.2.4. Effect of Current Density on the pH in AWC and NAC

Figure 5 displays the pH variation in AWC and NAC. As time and current density increased, the pH in AWC increased while the pH in NAC decreased. The fundamental reason for this is that the electric field force caused the water in the bipolar membrane to dissociate into OH- and H+ [25]. The OH migrated into the AWC and combined with NH4+ to form NH3·H2O and the H+ migrated into NAC and combined with NO3 to form HNO3. The pH of AWC increased while the pH of NAC decreased as time passed because more OH and H+ were produced. Furthermore, the hydrolysis rate of the bipolar membrane increased with current density, subsequently, the pH in AWC increased and the pH in NAC decreased. At 40 min, the pH levels in AWC were 6.32 (0.5 mA/cm2), 6.99 (1.0 mA/cm2), 9.11 (2.0 mA/cm2), 11.45 (3.0 mA/cm2), and 10.62 (4.0 mA/cm2), those in NAC were 4.64, 4.20, 2.94, 2.78, and 2.49. From Figure 5a, it was also found that the pH in AWC dropped from 11.45 to 10.62 as the current density increased from 3.0 to 4.0 mA/cm2 after 40 min. Theoretically, when current density increased, OH generation increased as well, raising the pH in the AWC [14]. However, as Equation 10 demonstrates, there is a reaction equilibrium in the AWC. As the concentration of NH4+ in the AWC increases, more OH will react with it to generate NH3·H2O, which will lower the pH.NH3·H2O. According to Figure 3a, the separation rates of NH4+ after 40 min were 77.3% and 97.0% when the current densities were 3.0 and 4.0 mA/cm2, respectively. This emphasizes that compared with a current density of 3.0 mA/cm2, more NH4+ entered the AWC and combined with OH while under the condition of current density at 4.0 mA/cm2, a decrease of the pH in AWC was observed as a result of the increase in current density from 3.0 to 4.0 mA/cm2. Thus, it can be incurred that, NH4+ is primarily concentrated in the form of NH3·H2O, while NO3 is concentrated in the form of HNO3, and PO43− is concentrated in the PC.
Taking into account energy consumption and ion separation rate, a current density of 1.0 mA/cm2 was used for the subsequent experiment. However, in a field application, if a short time is needed, a high current density might be used to reduce pretreatment time and boost ion removal.

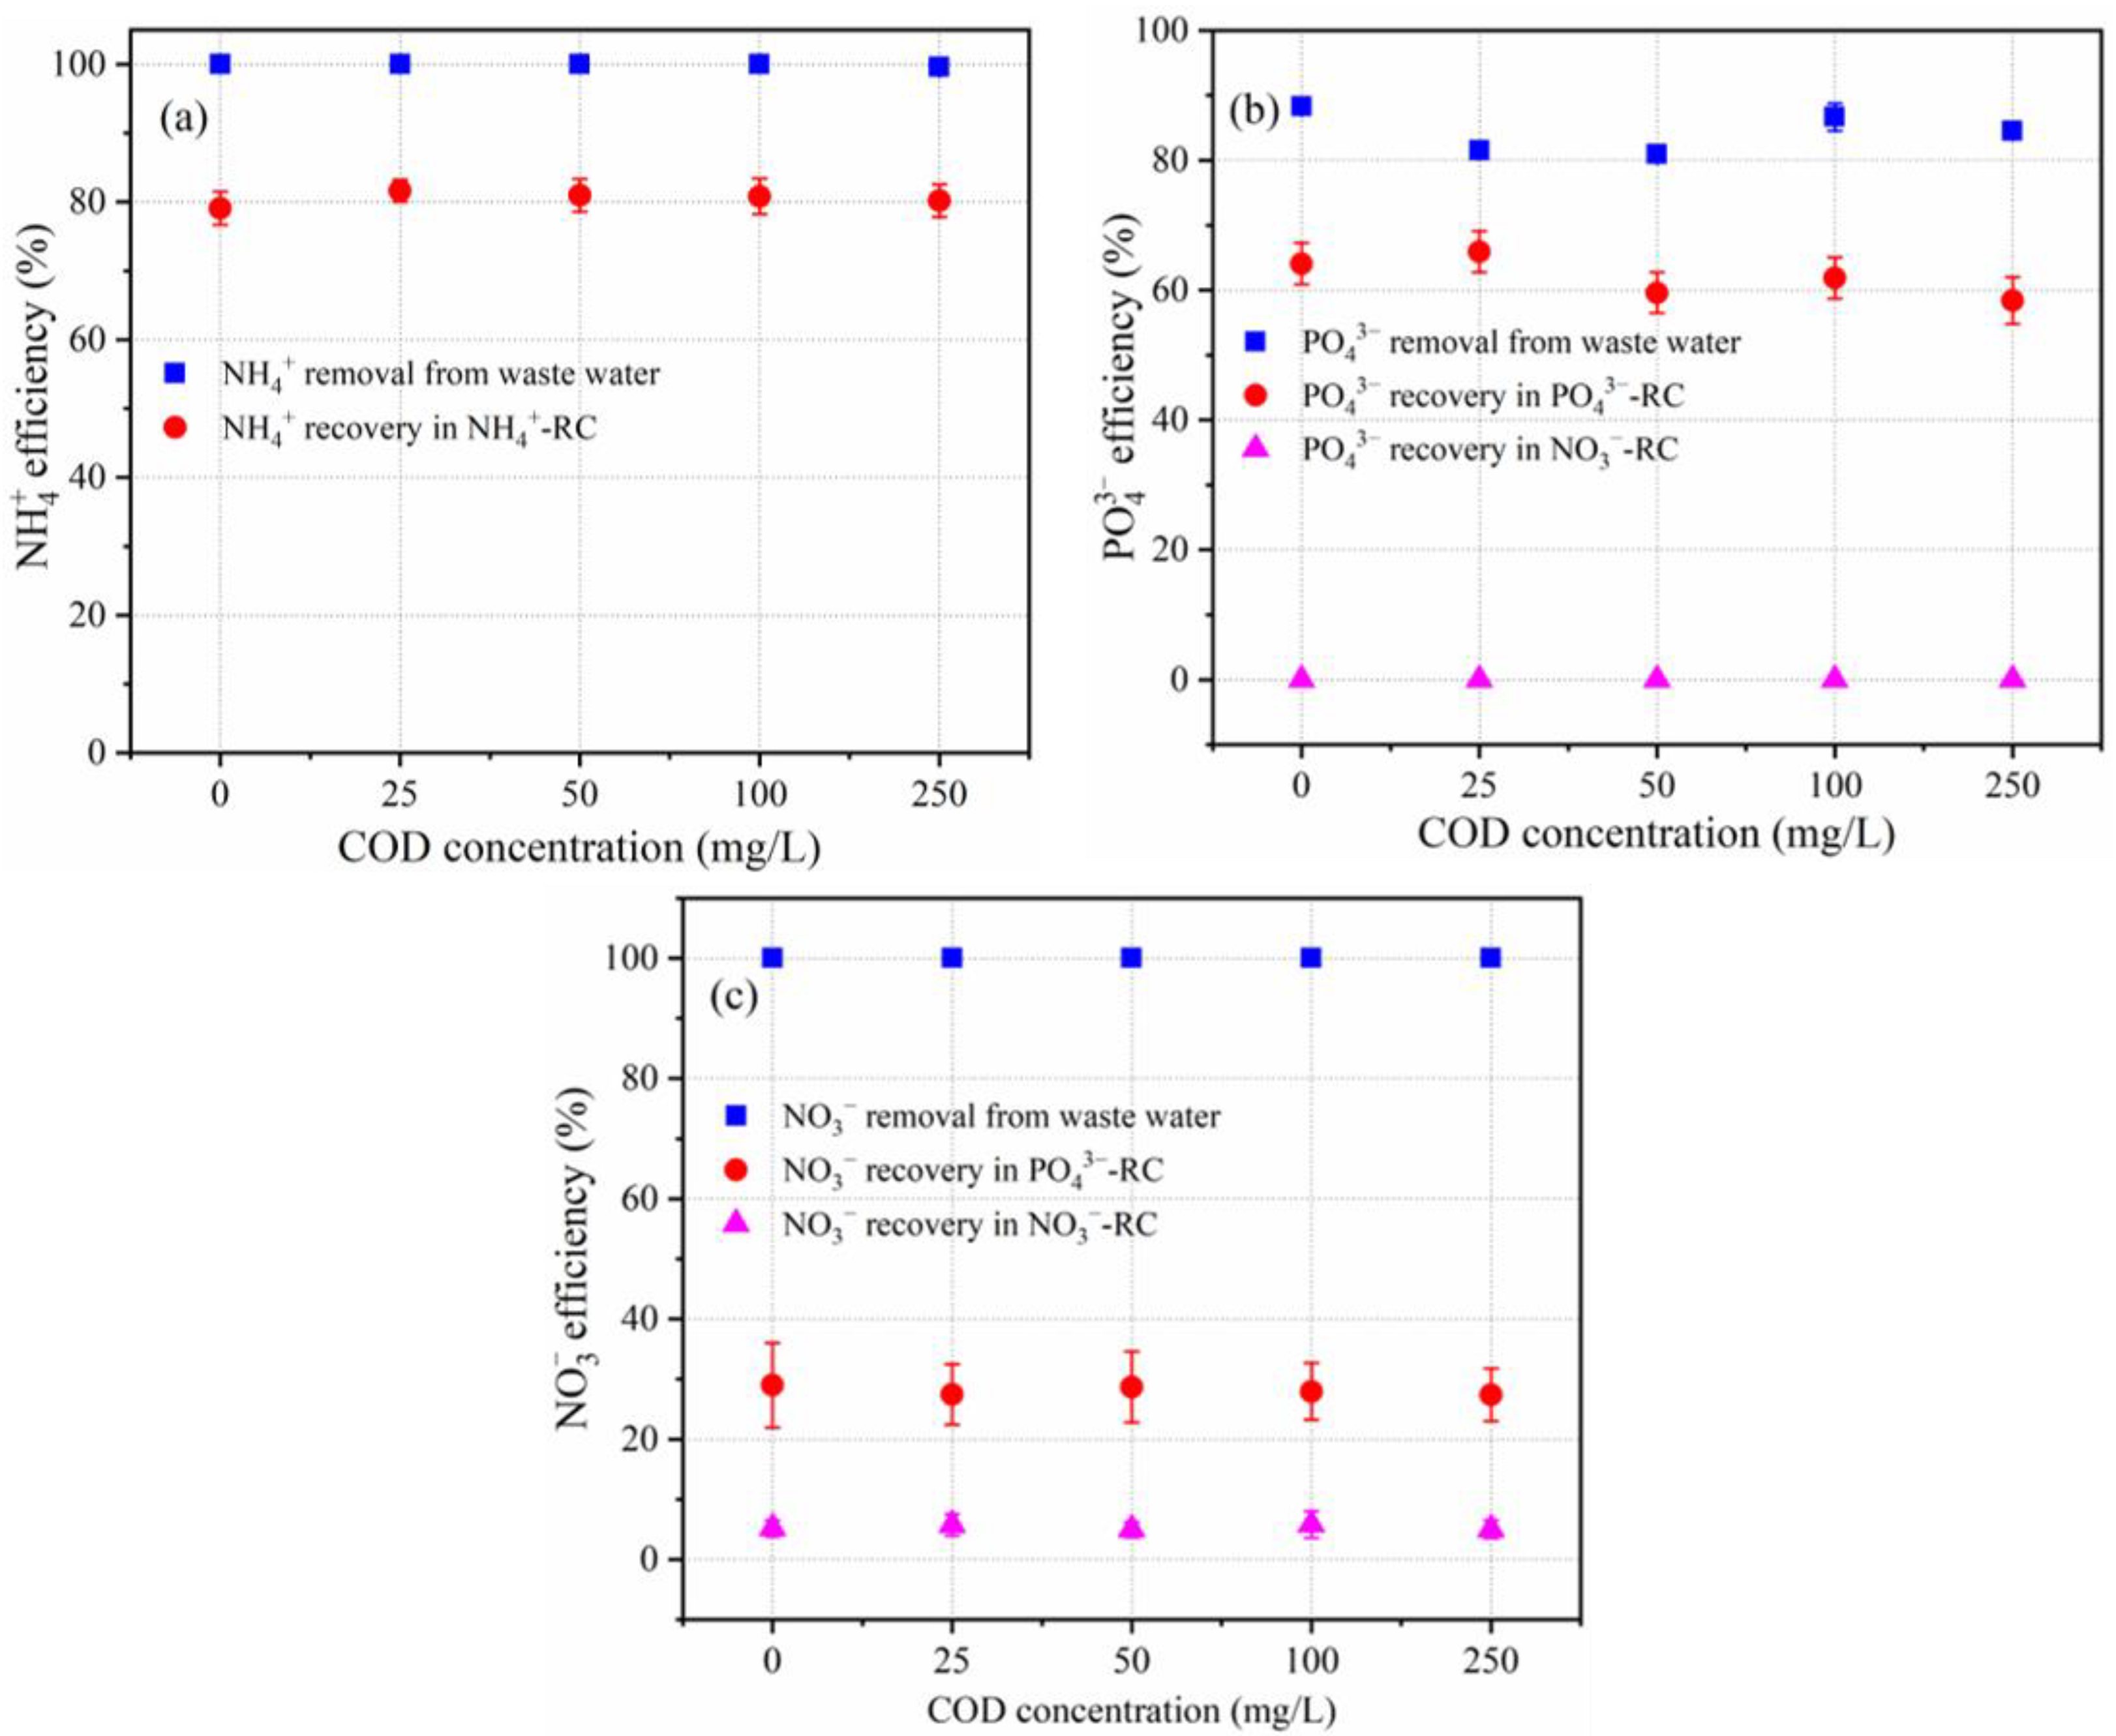
3.3. Effect of Organic Matter Concentration

Typically, organic matter is present in nitrogen- and phosphorus-containing wastewater. A series of simulated wastewater samples with various chemical oxygen demand (COD, which was prepared with glucose) concentrations (0, 25, 50, 100, and 250 mg/L) were used in order to evaluate the impact of organic matter on the separation and concentration of NH4+, PO43−, and NO3. Figure 6 depicts the separation and concentration of NH4+, PO43−, and NO3 in each compartment during 140 min. The separation and concentration rates of NH4+ were 100% and 80%, respectively, under varying COD concentrations.
The separation rate of PO43− in the WWC was 80–90%, subsequently, the concentration rate of PO43− in the PC was observed to be 60–65%, while no PO43− was detected in the NAC. The NO3 separation rate in the WWC was 100%, and its concentration rate in the PC and the NAC was in the range of 27.4–29.0% and 5.0–5.8%, respectively. This suggests that almost the same separation and concentration of NH4+, PO43−, and NO3 were achieved under varying COD conditions, indicating that COD had essentially no effect. This may be because organic matter existed in a non-ionic state and would not migrate during the electrodialysis process, and had no migration competition for ion migration. The cause of the lower concentration rate than the separation rate has been explained in Section 3.2.2.

3.4. Analysis of Concentration Performance

To validate the performance of the BMED in concentrating for NH4+, PO43−, and NO3, an experiment was performed with a volume ratio of VWWC/VAWC, VWWC/VPC, and VWWC/VNAC (at a ratio of 5:1) (Figure 7), where VWWC, VAWC, VPC, and VNAC represent the solution volume of WWC, AWC, PC and NAC, respectively.
As illustrated in Figure 7a,b, the separation and concentration rates of NH4+, PO43−, and NO3 increased with time. Both the NH4+ and NO3 separation rates reached 100% after 660 min. In contrast, an 80.7% separation rate of PO43− was achieved. The concentration rate and concentration of NH4+ in AWC were 80.5% and 805 mg/L, respectively. PO43− in PC was present at a rate and concentration of 67.9% and 339 mg/L, respectively. NO3 concentration rates in the PC and NAC were 48.6% and 45.2%, respectively, making up 93.8% of the total concentration rate. From Figure 7c, it was observed that the concentration rate of NH4+, PO43−, and NO3 increased compared with that mentioned in Section 3.2.2, when the volume ratio of VWWC/VAWC, VWWC/VPC, and VWWC/VNAC was 1:1. This is due to the fact that with the increase of the wastewater volume, the total amount of NH4+, PO43−, and NO3 increased and the fraction of ions adsorbed by the membranes decreased so that a larger proportion of ions could be concentrated. According to Figure 7c, the separation rate of PO43− (80.7%) decreased slightly and the volume ratio of VWWC/VAWC, VWWC/VPC, and VWWC/VNAC was 1:1 (i.e., 88.3%). This is primarily due to the fact that as time passed, the concentration of PO43− in the PC increased gradually, and the back-diffusion of PO43− from the PC to the WWC was reinforced, both of which would lower the separation rate of PO43−. According to the aforementioned facts, the BMED system has a good performance from concentrating NH4+, PO43−, and NO3. NH4+ and PO43− concentrations could be increased to 805 mg/L and 339 mg/L, respectively.

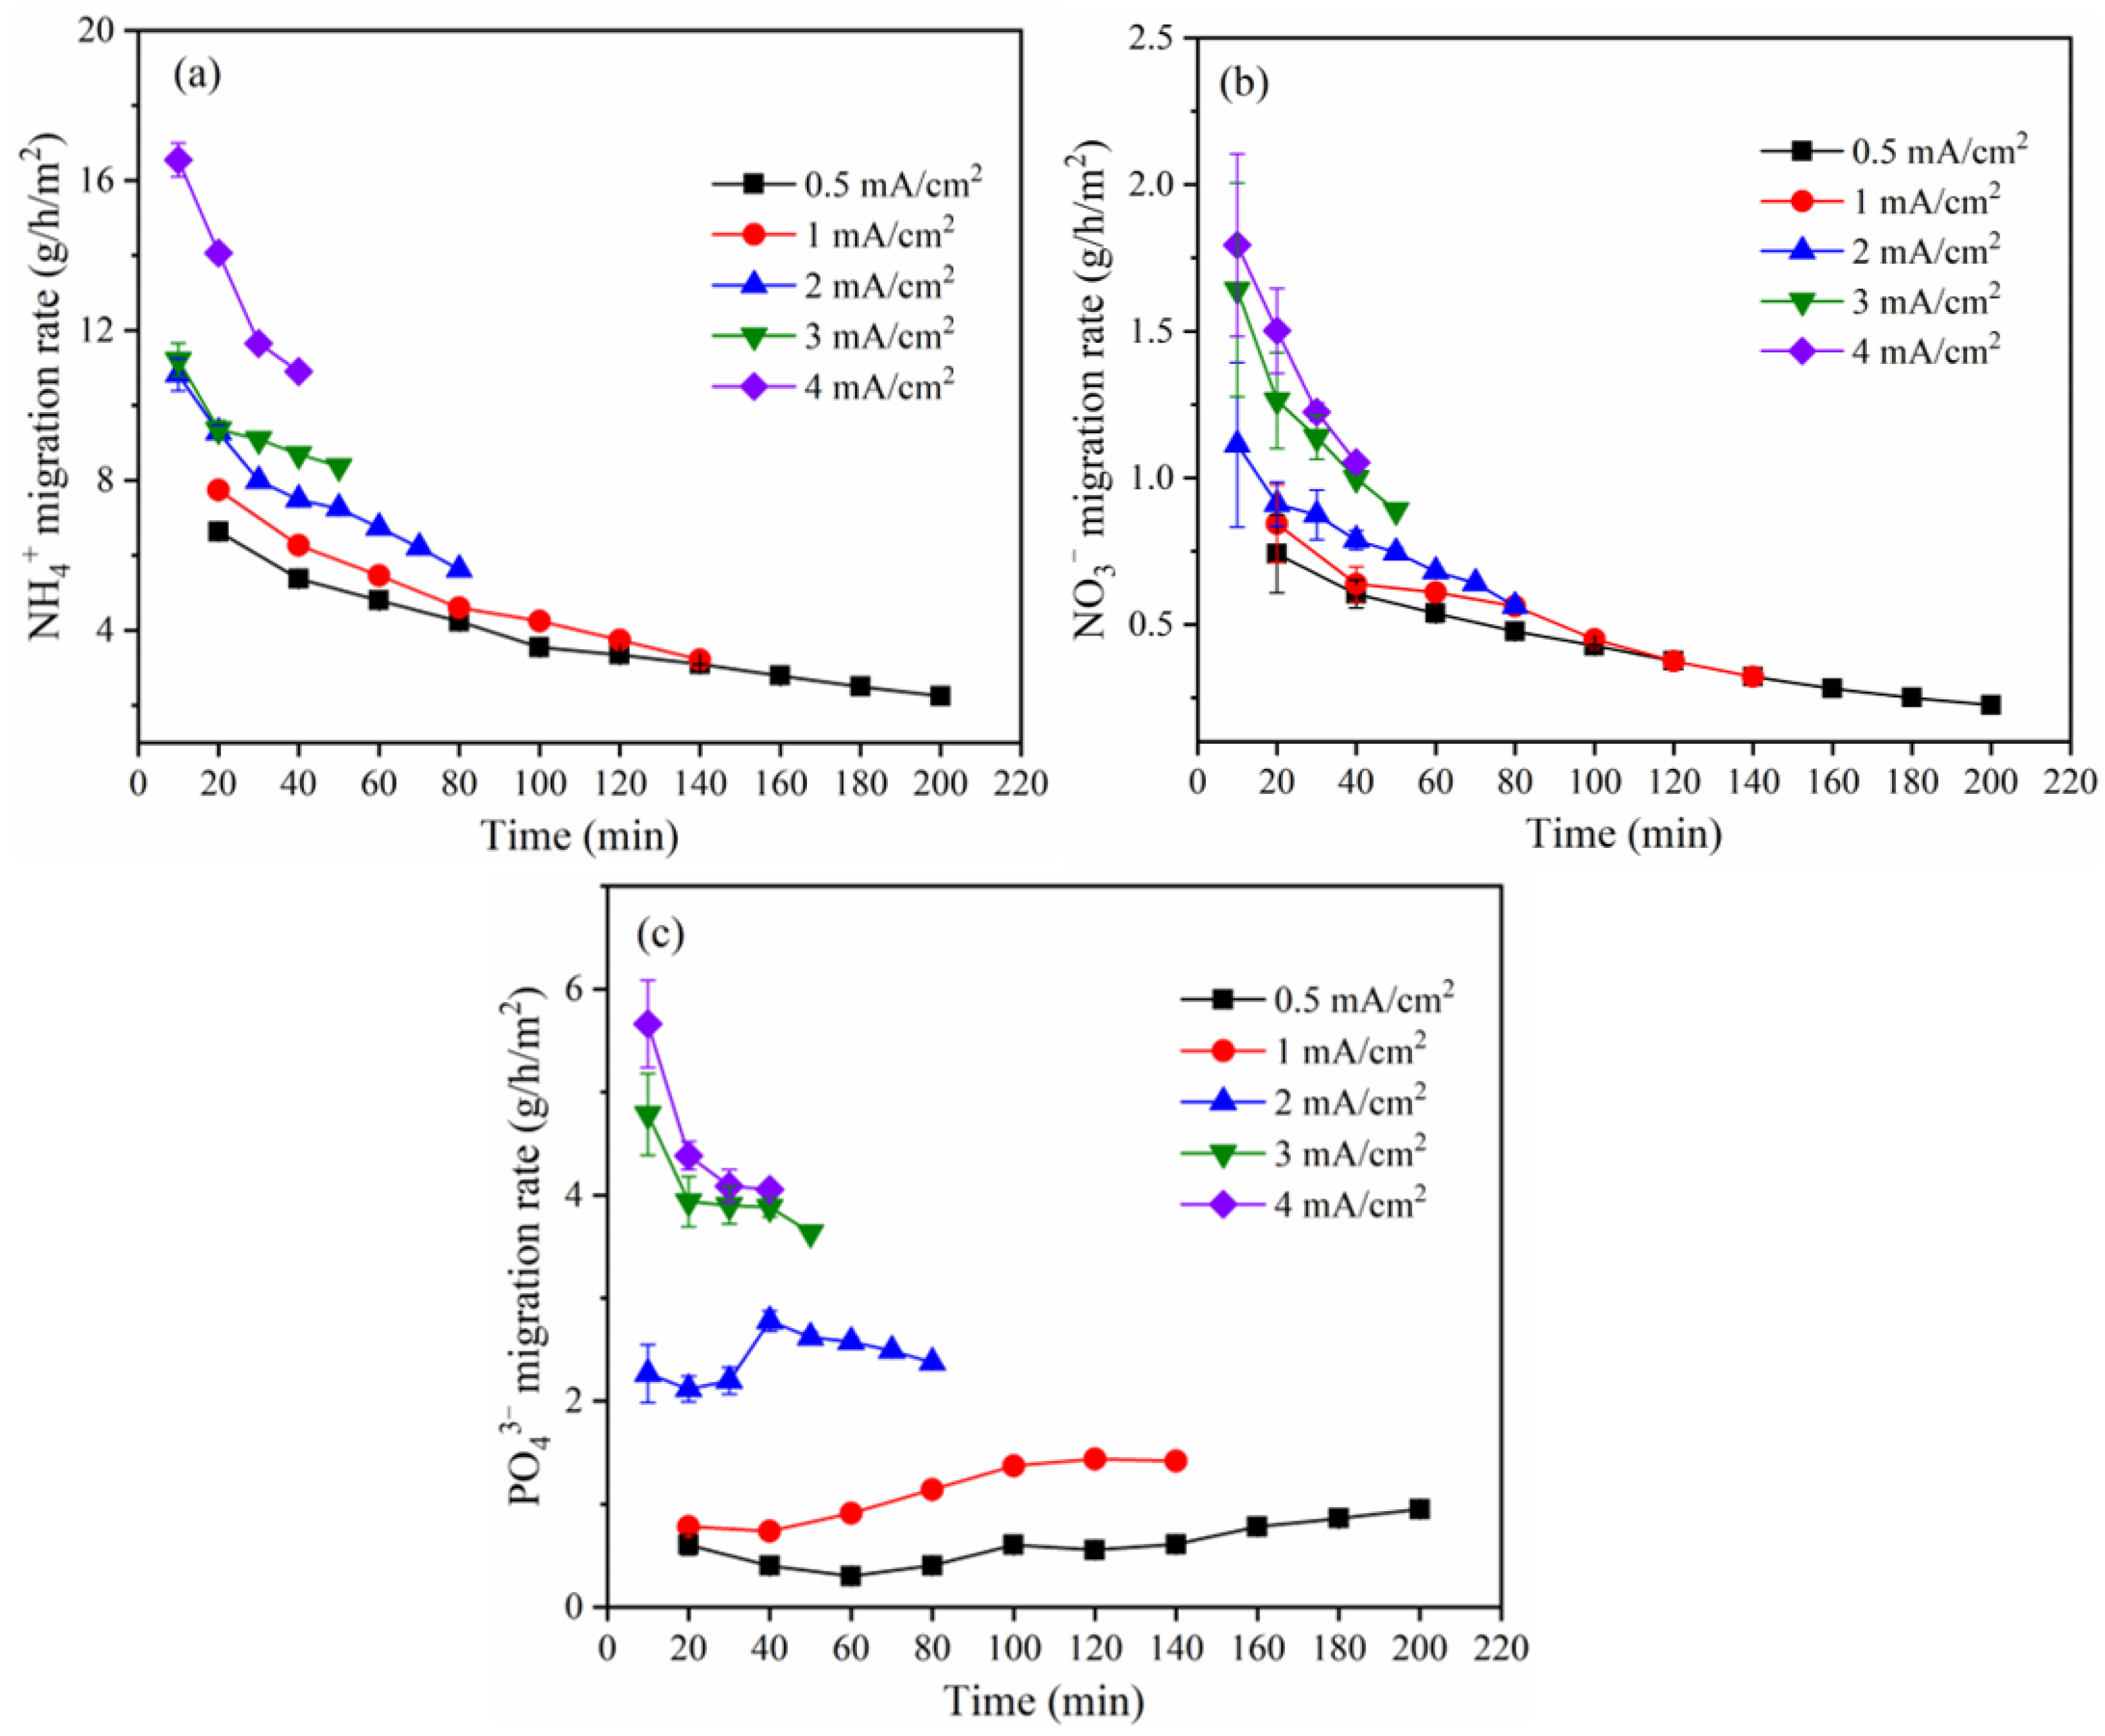
3.5. Kinetics and Migration Rate Analysis

Zero-order, first-order, and second-order kinetic models were used to investigate the separation process of NH4+, PO43−, and NO3 removal in order to understand the kinetic process under various current densities (Table 1). The separation of NH4+, PO43−, and NO3 is more consistent with the zero-order kinetic process, that is, the separation rate of the three ions is independent of the initial concentration, because the R2 values corresponding to the zero-order kinetic equations under different current densities were higher than those of the first- and second-order kinetic models. The time required to achieve a certain separation rate is proportional to the initial concentration. Moreover, the ion migration rate is directly proportional to the current density, and the coefficient of kinetics (k0) corresponding to NH4+, PO43−, and NO3 increased with the current density. This shows that current density has a significant impact on the separation of the three ions. (k0) NH4+, PO43−, and NO3. When the current density increased from 0.5 to 4.0 mA/cm2, the k0 of NH4+ increased from 1.159 to 4.698 mg/L/min, while the k0 of PO43− and NO3 increased from 0.407 to 1.735 mg/L/min and 0.185 to 0.457 mg/L/min, respectively.
The migration rate of NH4+ and NO3 steadily decreased with time (Figure 8). The cause is that the ions had a high migration rate at the beginning due to the high ion concentration at the corresponding time. As more time passed, the ion concentration dropped, which caused the ion migratory rate to drop over time. Additionally, the ion migration rate was accelerated with the current density, mostly due to the fact that the electric field force on ions increased with current density. When the current density is 0.5, 1.0, 2.0, 3.0, and 4.0 mA/cm2, the average migration rate of NH4+ and NO3 are 3.86, 5.04, 8.04, 9.35, 13.29 g/h/m2 and 0.42, 0.54, 0.79, 1.19, 1.39 g/h/m2, respectively. According to Figure 8c, the change in PO43− migration rate is complex, between current densities of 0.5 and 1.0 mA/cm2, the PO43− migration rate first decreased, then increased, while when the current density is ≥2.0 mA/cm2, the migration rate of PO43− first decreased and then increased, and finally decreased. Theoretically, the migration rate decreases with time, just as that of NH4+ and NO3, but there was a migration competition between PO43− and NO3, and since the NO3 radius is much smaller than that of PO43−, it was the dominant ion migrating to the anode initially, which might reduce PO43− migration rate. The migration competition between NO3 with PO43− diminished over time as NO3 concentration declined, which might increase PO43− migration. As PO43− concentration decreases, its migration rate would also decrease. The fluctuation in PO43− migration rate as shown in Figure 8c was achieved under the impact of the aforementioned parameters. When the current densities are 0.5, 1.0, 2.0, 3.0, and 4.0 mA/cm2, respectively, the average migration rate of PO43− were 0.61, 1.11, 2.43, 4.03, and 4.55 g/h/m2, respectively. A high current density can be used in the subsequent field engineering application process if a quick migration rate and short duration are required, but the energy consumption could be significant.

4. Summary

The primary findings of this study, which used selective BMED to separate and concentrate nitrogen and phosphorus in simulated wastewater, are as follows.
(1) The separation rate and migration rate of NH4+, PO43−, and NO3 increased with current density. When the current density was 1.0 mA/cm2, the separation rates of NH4+, PO43−, and NO3 after 140 min were 100%, 88.3%, and 100%, respectively. Their concentration rates were much lower than the separation rates due to membrane adsorption. The recoveries of them were 79.1%, 64.1%, and 34.2%, respectively.
(2) Organic matter had no effect on ion separation and concentration. The same separation rate and concentration rate of NH4+, PO43−, and NO3 were achieved under the condition of different organic matter content.
(3) MVA had a good performance for separating NO3 and PO43−, and PO43− was not detected in nitric acid compartment.
(4) The migration process of NH4+, PO43−, and NO3 followed a zero-order kinetic process, and their migration rate was independent of the initial concentration.
(5) The findings of the multifold concentration show that the BMED was able to separate and concentrate the NH4+, PO43−, and NO3. Thus, the BMED system can be regarded as an effective method to separate and concentrate the NH4+, PO43−, and NO3 from wastewater.

Supplementary Materials

The following are available online at https://www.mdpi.com/article/10.3390/membranes12111116/s1, Figure S1: Changes of solution conductivity in (a) wastewater compartment, (b) ammonia compartment, (c) phosphate compartment and (d) nitric acid compartment under different current density, Table S1: Characteristics of membranes.

Author Contributions

Conceptualization, X.W., Y.L. and Q.Q.; methodology, Y.L. and X.Y.; investigation, X.W. and W.C.; data curation, Y.F.; writing—original draft preparation, X.W.; writing—review and editing, Y.L. and B.V.d.B.; project administration, Y.L.; funding acquisition, X.W All authors have read and agreed to the published version of the manuscript.

Funding

This work was financially supported by the Department of Education, Fujian Province [grant number JAT210720]. The doctoral research project of Fujian Chuanzheng Communications College [grant number 20220104].

Institutional Review Board Statement

Not applicable.

Informed Consent Statement

Not applicable.

Data Availability Statement

The data presented in this study are available on request from the corresponding author.

Conflicts of Interest

The authors declare no conflict of interest.

Abbreviations

CC: cathode compartment; AWC: ammonia compartment; WWC: wastewater compartment; PC: phosphate compartment; NAC: nitric acid compartment; AC: anode compartment; SBMED: selective BMED; MVA: monovalent selective anion exchange membranes; SED: selective selectrodialysis; BPM: bipolar membrane; CEM: cation exchange membrane; AEM: anion exchange membrane.

References

  1. Li, B.; Boiarkina, I.; Young, B.; Yu, W. Substance flow analysis of phosphorus within New Zealand and comparison with other countries. Sci. Total Environ. 2015, 527–528, 483–492. [Google Scholar] [CrossRef] [PubMed]
  2. Li, B.; Boiarkina, I.; Yu, W.; Huang, H.M.; Munir, T.; Wang, G.Q.; Young, B.R. Phosphorous recovery through struvite crystallization: Challenges for future design. Sci. Total Environ. 2019, 648, 1244–1256. [Google Scholar] [CrossRef] [PubMed]
  3. Cordell, D.; Rosemarin, A.; Schröder, J.J.; Smit, A.L. Towards global phosphorus security: A systems framework for phosphorus recovery and reuse options. Chemosphere 2011, 84, 747–758. [Google Scholar] [CrossRef] [PubMed]
  4. Gilbert, N. Environment: The disappearing nutrient. Nature 2009, 461, 716–718. [Google Scholar] [CrossRef] [Green Version]
  5. Reijnders, L. Phosphorus resources, their depletion and conservation, a review. Resour. Conserv. Recycl. 2014, 93, 32–49. [Google Scholar] [CrossRef]
  6. Li, B.; Boiarkina, I.; Young, B.; Yu, W.; Singhal, N. Prediction of future phosphate rock: A demand based model. J. Environ. Inform. 2018, 1, 41–53. [Google Scholar] [CrossRef] [Green Version]
  7. Rahman, M.M.; Salleh, M.A.M.; Rashid, U.; Ahsan, A.; Hossain, M.M.; Ra, C.S. Production of slow release crystal fertilizer from wastewaters through struvite crystallization—A review. Arab. J. Chem. 2014, 7, 139–155. [Google Scholar] [CrossRef] [Green Version]
  8. Elser, J.J.; Elser, T.J.; Carpenter, S.R.; Brock, W.A. Regime shift in fertilizer commodities indicates more turbulence ahead for food security. PLoS ONE 2014, 9, e93998. [Google Scholar] [CrossRef] [Green Version]
  9. Cifuentes, G.; Germain, I.; Garrido, B.; Cifuentes-Cabezas, M.; Orrego, P.; Gentico, I.; Pino, E.; Calderón, C. Tetra-uranium fluoride electrowinning by electro-electrodialysis cell (EED). Sep. Purif. Technol. 2022, 281, 119833. [Google Scholar] [CrossRef]
  10. Huang, C.; Xu, T. Electrodialysis with bipolar membranes for sustainable development. Environ. Sci. Technol. 2006, 40, 5233–5243. [Google Scholar] [CrossRef]
  11. Liu, X.; Li, Q.; Jiang, C.; Lin, X.; Xu, T. Bipolar membrane electrodialysis in aqua–ethanol medium: Production of salicylic acid. J. Membr. Sci. 2015, 482, 76–82. [Google Scholar] [CrossRef]
  12. Li, Y.; Shi, S.; Cao, H.; Wu, X.; Zhao, Z.; Wang, L. Bipolar membrane electrodialysis for generation of hydrochloric acid and ammonia from simulated ammonium chloride wastewater. Water Res. 2016, 89, 201–209. [Google Scholar] [CrossRef] [PubMed]
  13. van Linden, N.; Bandinu, G.L.; Vermaas, D.A.; Spanjers, H.; van Lier, J.B. Bipolar membrane electrodialysis for energetically competitive ammonium removal and dissolved ammonia production. J. Clean. Prod. 2020, 259, 120788. [Google Scholar] [CrossRef]
  14. Li, X.; Shen, S.; Xu, Y.; Guo, T.; Dai, H.; Lu, X. Application of membrane separation processes in phosphorus recovery: A review. Sci. Total Environ. 2021, 767, 144346. [Google Scholar] [CrossRef]
  15. Tran, A.T.K.; Zhang, Y.; De Corte, D.; Hannes, J.-B.; Ye, W.; Mondal, P.; Jullok, N.; Meesschaert, B.; Pinoy, L.; Van der Bruggen, B. P-recovery as calcium phosphate from wastewater using an integrated selectrodialysis/crystallization process. J. Clean. Prod. 2014, 77, 140–151. [Google Scholar] [CrossRef]
  16. Liu, Y.; Ke, X.; Zhu, H.; Chen, R.; Chen, X.; Zheng, X.; Jin, Y.; Van der Bruggen, B. Treatment of raffinate generated via copper ore hydrometallurgical processing using a bipolar membrane electrodialysis system. Chem. Eng. J. 2020, 382, 122956. [Google Scholar] [CrossRef]
  17. State Environmental Protection Administration of China. Monitoring and Analysis Methods of Water and Wastewater, 4th ed.; China Environmental Science Press: Beijing, China, 2002. [Google Scholar]
  18. Liu, Y.; Zhu, H.; Zhang, M.; Chen, R.; Chen, X.; Zheng, X.; Jin, Y. Cr(VI) recovery from chromite ore processing residual using an enhanced electrokinetic process by bipolar membranes. J. Membr. Sci. 2018, 566, 190–196. [Google Scholar] [CrossRef]
  19. Zhang, L.; Zhou, W.; Liu, Y.; Jia, H.; Zhou, J.; Wei, P.; Zhou, H. Bioleaching of dewatered electroplating sludge for the extraction of base metals using an adapted microbial consortium: Process optimization and kinetics. Hydrometallurgy 2020, 191, 105227. [Google Scholar] [CrossRef]
  20. Liu, Y.; Chen, J.; Cai, Z.; Chen, R.; Sun, Q.; Sun, M. Removal of copper and nickel from municipal sludge using an improved electrokinetic process. Chem. Eng. J. 2017, 307, 1008–1016. [Google Scholar] [CrossRef]
  21. Liu, Y.; Ding, J.; Zhu, H.; Wu, X.; Dai, L.; Chen, R.; Van der Bruggen, B. Recovery of trivalent and hexavalent chromium from chromium slag using a bipolar membrane system combined with oxidation. J. Colloid Interface Sci. 2022, 619, 280–288. [Google Scholar] [CrossRef]
  22. Berkessa, Y.W.; Lang, Q.; Yan, B.; Kuang, S.; Mao, D.; Shu, L.; Zhang, Y. Anion exchange membrane organic fouling and mitigation in salt valorization process from high salinity textile wastewater by bipolar membrane electrodialysis. Desalination 2019, 465, 94–103. [Google Scholar] [CrossRef]
  23. Wu, X.; Zhu, H.; Liu, Y.; Chen, R.; Qian, Q.; Van der Bruggen, B. Cr(III) recovery in form of Na2CrO4 from aqueous solution using improved bipolar membrane electrodialysis. J. Membr. Sci. 2020, 604, 118097. [Google Scholar] [CrossRef]
  24. Rotta, E.H.; Bitencourt, C.S.; Marder, L.; Bernardes, A.M. Phosphorus recovery from low phosphate-containing solution by electrodialysis. J. Membr. Sci. 2019, 573, 293–300. [Google Scholar] [CrossRef]
  25. Chen, X.; Chen, G.Q.; Wang, Q.; Xu, T.; Kentish, S.E. Transforming salty whey into cleaning chemicals using electrodialysis with bipolar membranes. Desalination 2020, 492, 114598. [Google Scholar] [CrossRef]
Figure 1. Schematic diagram of experimental equipment. CC: cathode compartment; AWC: ammonia compartment; WWC: wastewater compartment; PC: phosphate compartment; NAC: nitric acid compartment; AC: anode compartment.
Membranes 12 01116 g001
Figure 2. Cell voltage variation of cell voltage with Na2SO4 concentration.
Membranes 12 01116 g002
Figure 3. Effect of current density on the separation rate of (a) NH4+, (b) PO43−, (c) NO3, and (d) the concentration rate of NH4+, PO43−, and NO3 in different compartments under the condition of current density 1.0 mA/cm2.
Membranes 12 01116 g003
Figure 4. (a) Voltage and (b) energy consumption under different current density.
Membranes 12 01116 g004
Figure 5. Effect of current density on (a) solution pH of ammonia compartment and (b) nitric acid compartment.
Membranes 12 01116 g005
Figure 6. Effect of COD concentration on the separation and concentration of (a) NH4+, (b) PO43− and (c) NO3.
Membranes 12 01116 g006
Figure 7. (a) separation and (b) concentration of NH4+, PO43− and NO3 with the volume ratio of VWWC/VAWC, VWWC/VPC, and VWWC/VNAC was 5:1 and (c) the comparison with volume ratio of VWWC/VAWC, VWWC/VPC, and VWWC/VNAC was 1:1.
Membranes 12 01116 g007
Figure 8. Migration rate of (a) NH4+, (b) PO43−, and (c) NO3 under different current densities.
Membranes 12 01116 g008
Table 1. Migration kinetic analysis of NH4+, PO43−, and NO3.
Type of IonsType of DynamicsCoefficient of Kinetics
k and R2
Current Density (mA/cm2)
0.51.02.03.04.0
NH4+Zero-orderk0 (mg/L/min)1.1591.8042.6283.6664.698
R20.9130.9440.9660.9940.969
First-order ek1 (min−1)0.0260.0260.0430.0490.080
R20.8850.9510.9140.9040.876
Second-orderk2 (L/mg/min)0.0020.0000.0010.0010.003
R20.4380.6760.5880.6440.592
PO43−Zero-orderk0 (mg/L/min)0.4070.6761.1141.6121.735
R20.9180.9800.9890.9940.989
First-orderk1 (min−1)0.0070.0140.0230.0320.030
R20.7730.8810.9630.9680.973
Second-orderk2 (L/mg/min)0.0000.0000.0000.0000.000
R20.5670.6800.8300.8510.885
NO3Zero-orderk0 (mg/L/min)0.1850.2630.2770.3820.457
R20.9580.9800.9700.9510.939
First-orderk1 (min−1)0.0280.0270.0630.0780.066
R20.9520.9650.7590.8750.977
Second-orderk2 (L/mg/min)0.0070.0030.1070.0570.016
R20.6810.8440.3640.5140.760
Publisher’s Note: MDPI stays neutral with regard to jurisdictional claims in published maps and institutional affiliations.

