
Fabrication and Characterisation of MWCNT/Polyvinyl (PVC) Polymer Inclusion Membrane for Zinc (II) Ion Removal from Aqueous Solution
 , , ,
, , ,  and
and
Abstract
:1. Introduction
2. Materials and Methods
2.1. Materials
2.2. Fabrication of the MWCNT/PVC-PIMs
2.3. Characterisation of the Fabricated PIMs
2.3.1. The Scanning Electron Microscopy (SEM) Analysis
2.3.2. The Contact Angle (CA) Study
2.3.3. The Water Uptake Analysis
2.3.4. The Porosity Evaluation
2.3.5. The Fourier Transform Infrared Spectroscopy (FTIR) Analysis
2.3.6. The Differential Scanning Calorimeter (DSC) Analysis
2.3.7. The IEC Evaluation
2.3.8. The Electrochemical Impedance Spectroscopy (EIS) Analysis
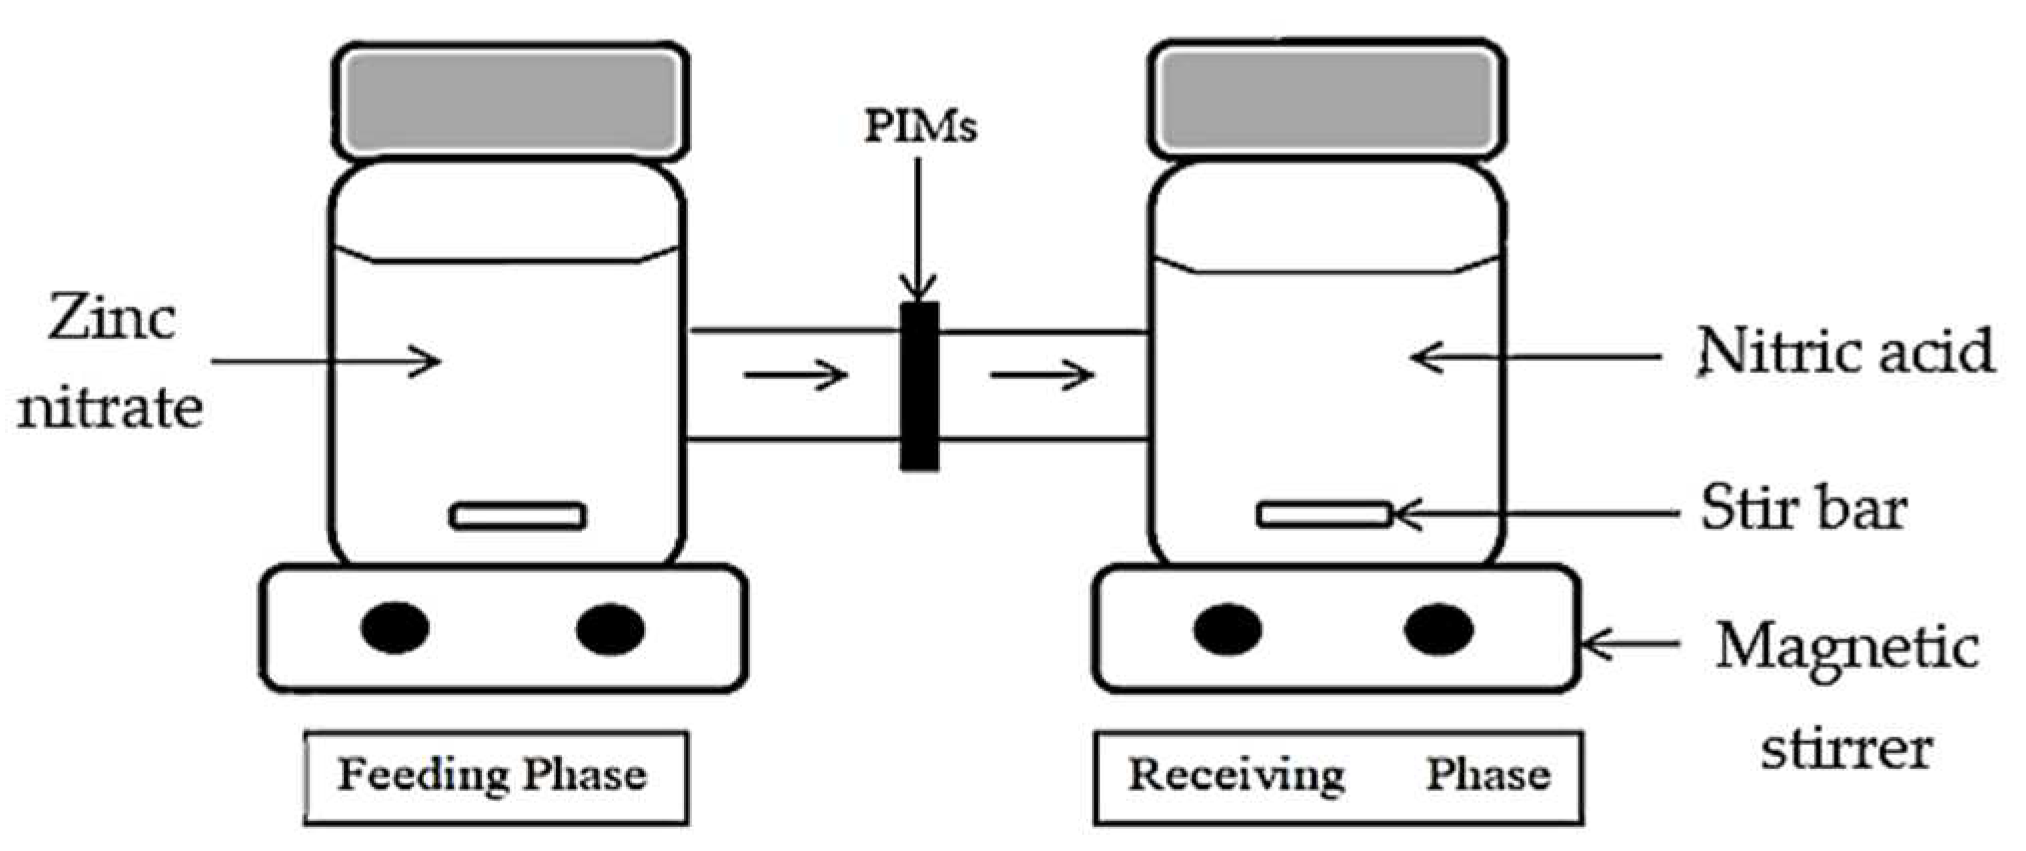
2.4. The H-Cell Apparatus Arrangement
2.5. The Zn2+ Removal Performance Studies
2.6. The Kinetic Studies
2.7. Permeability and Flux Assessments
3. Results and Discussion
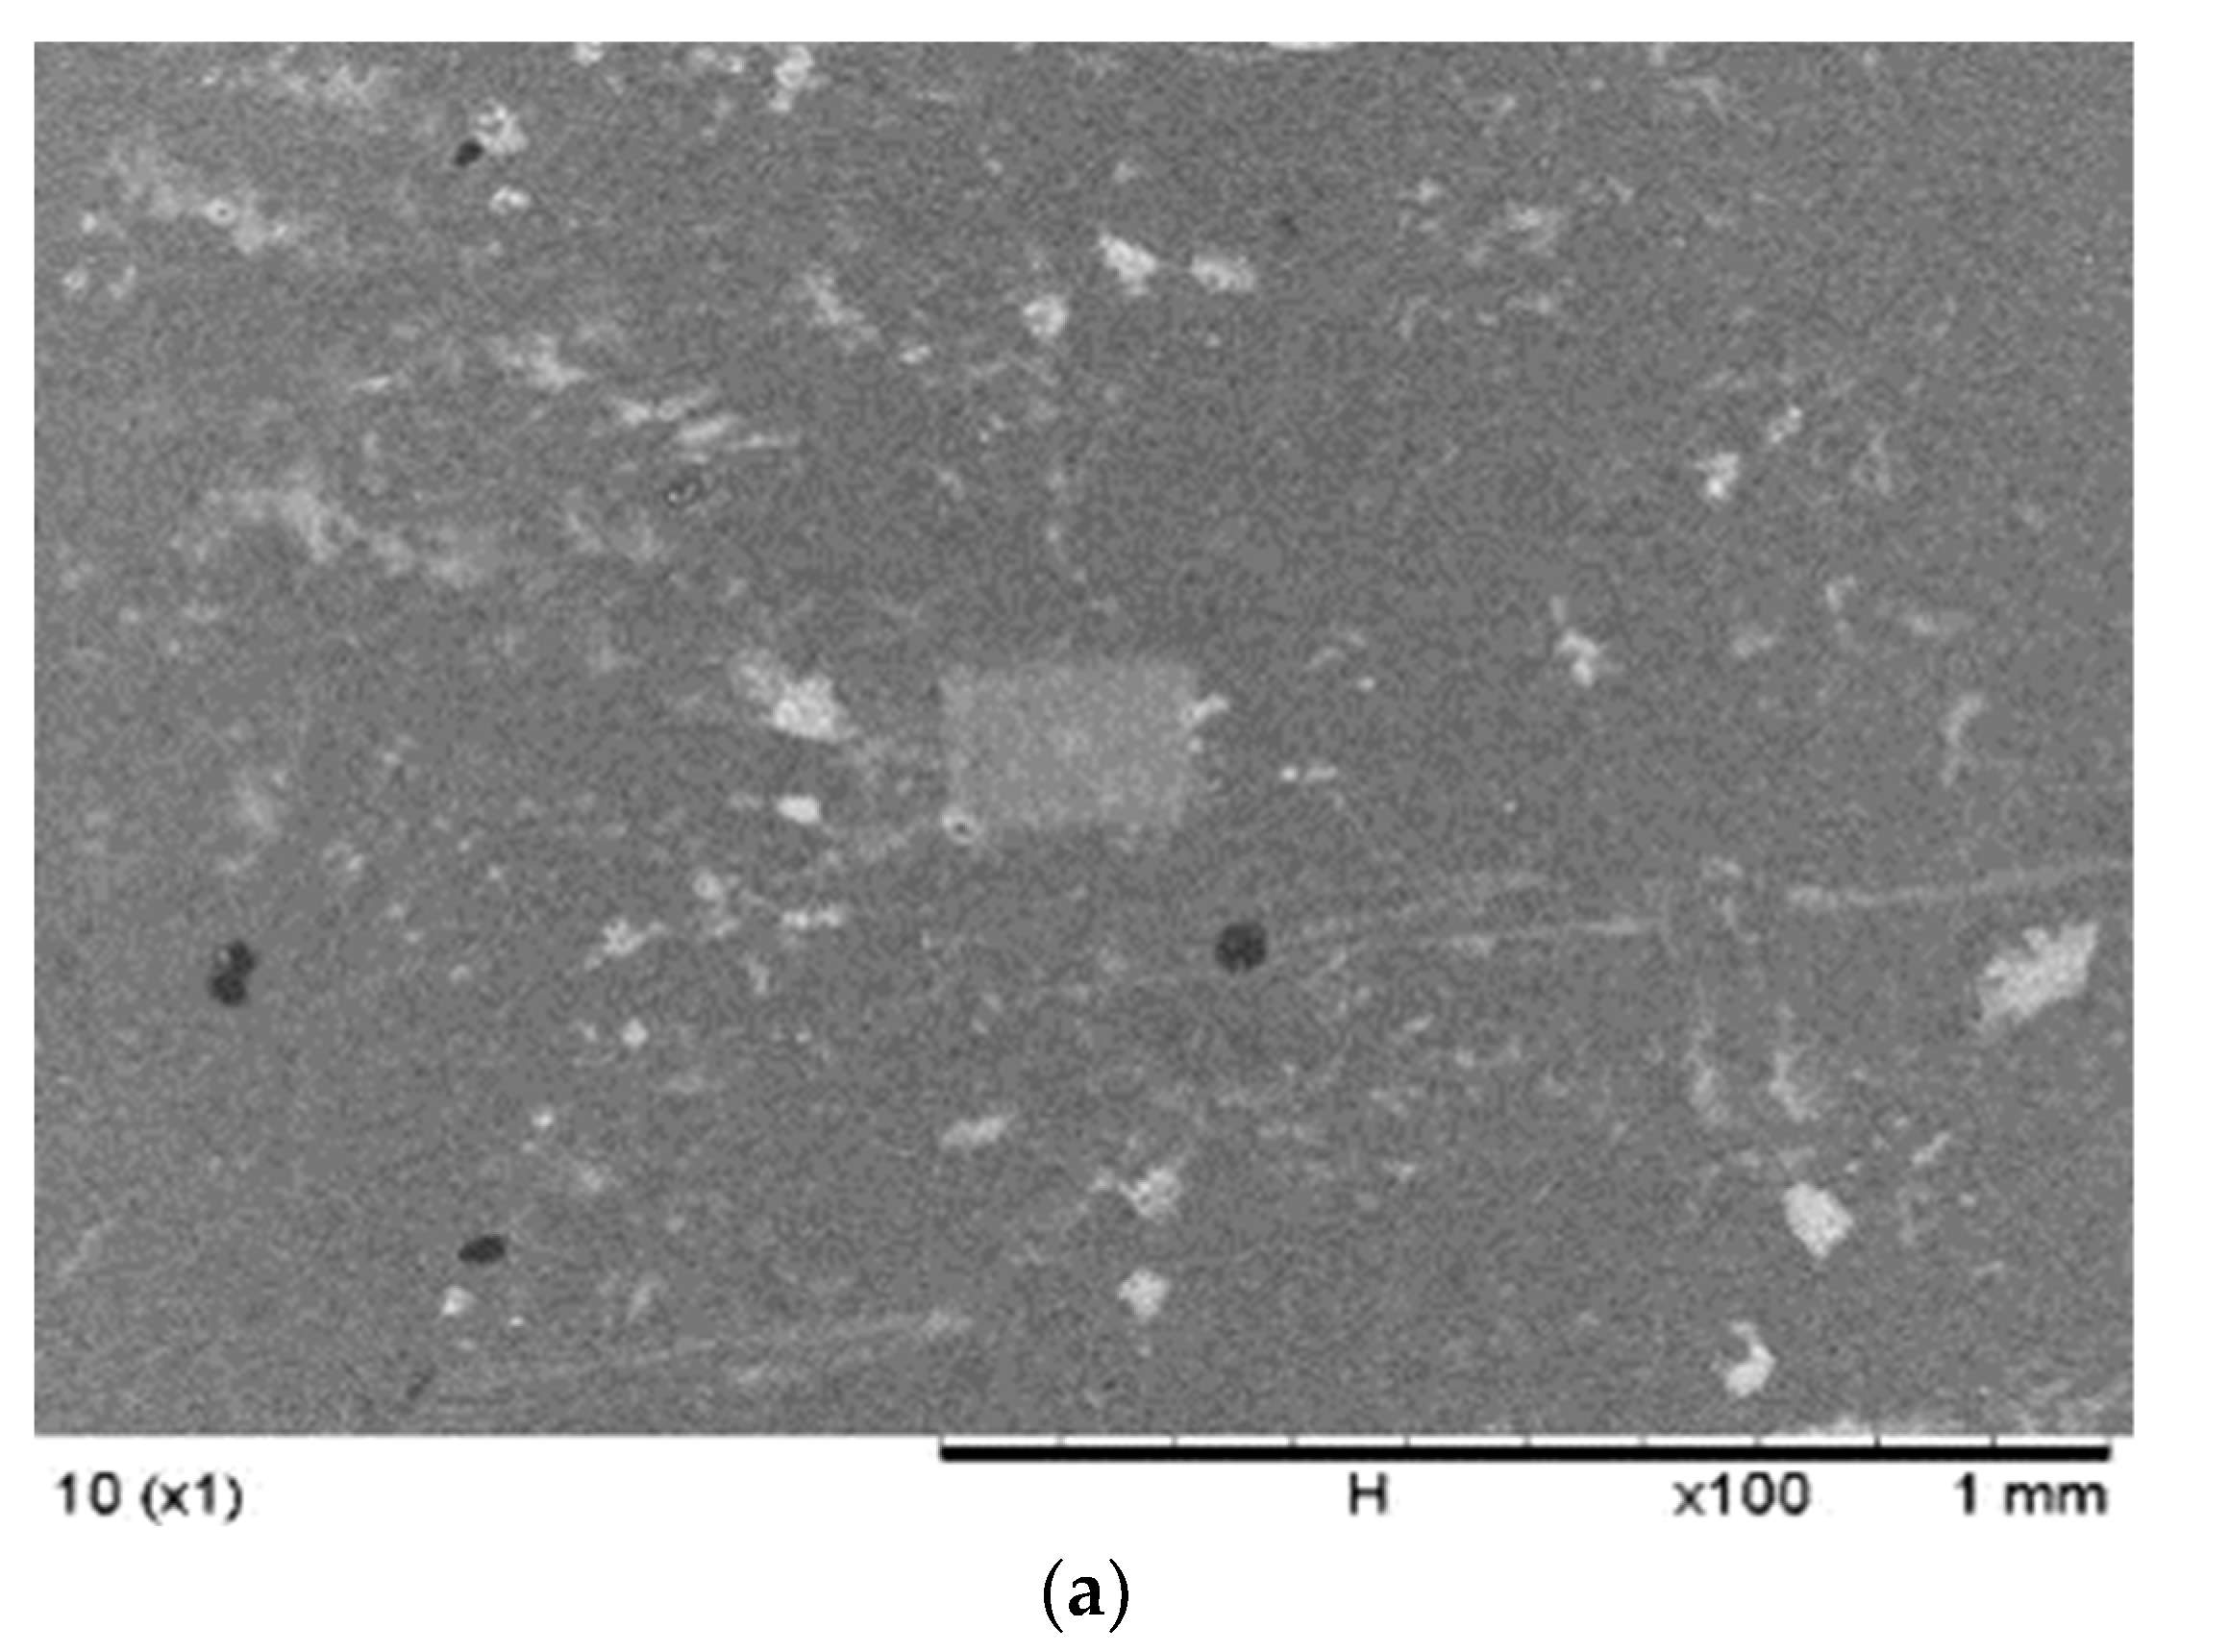
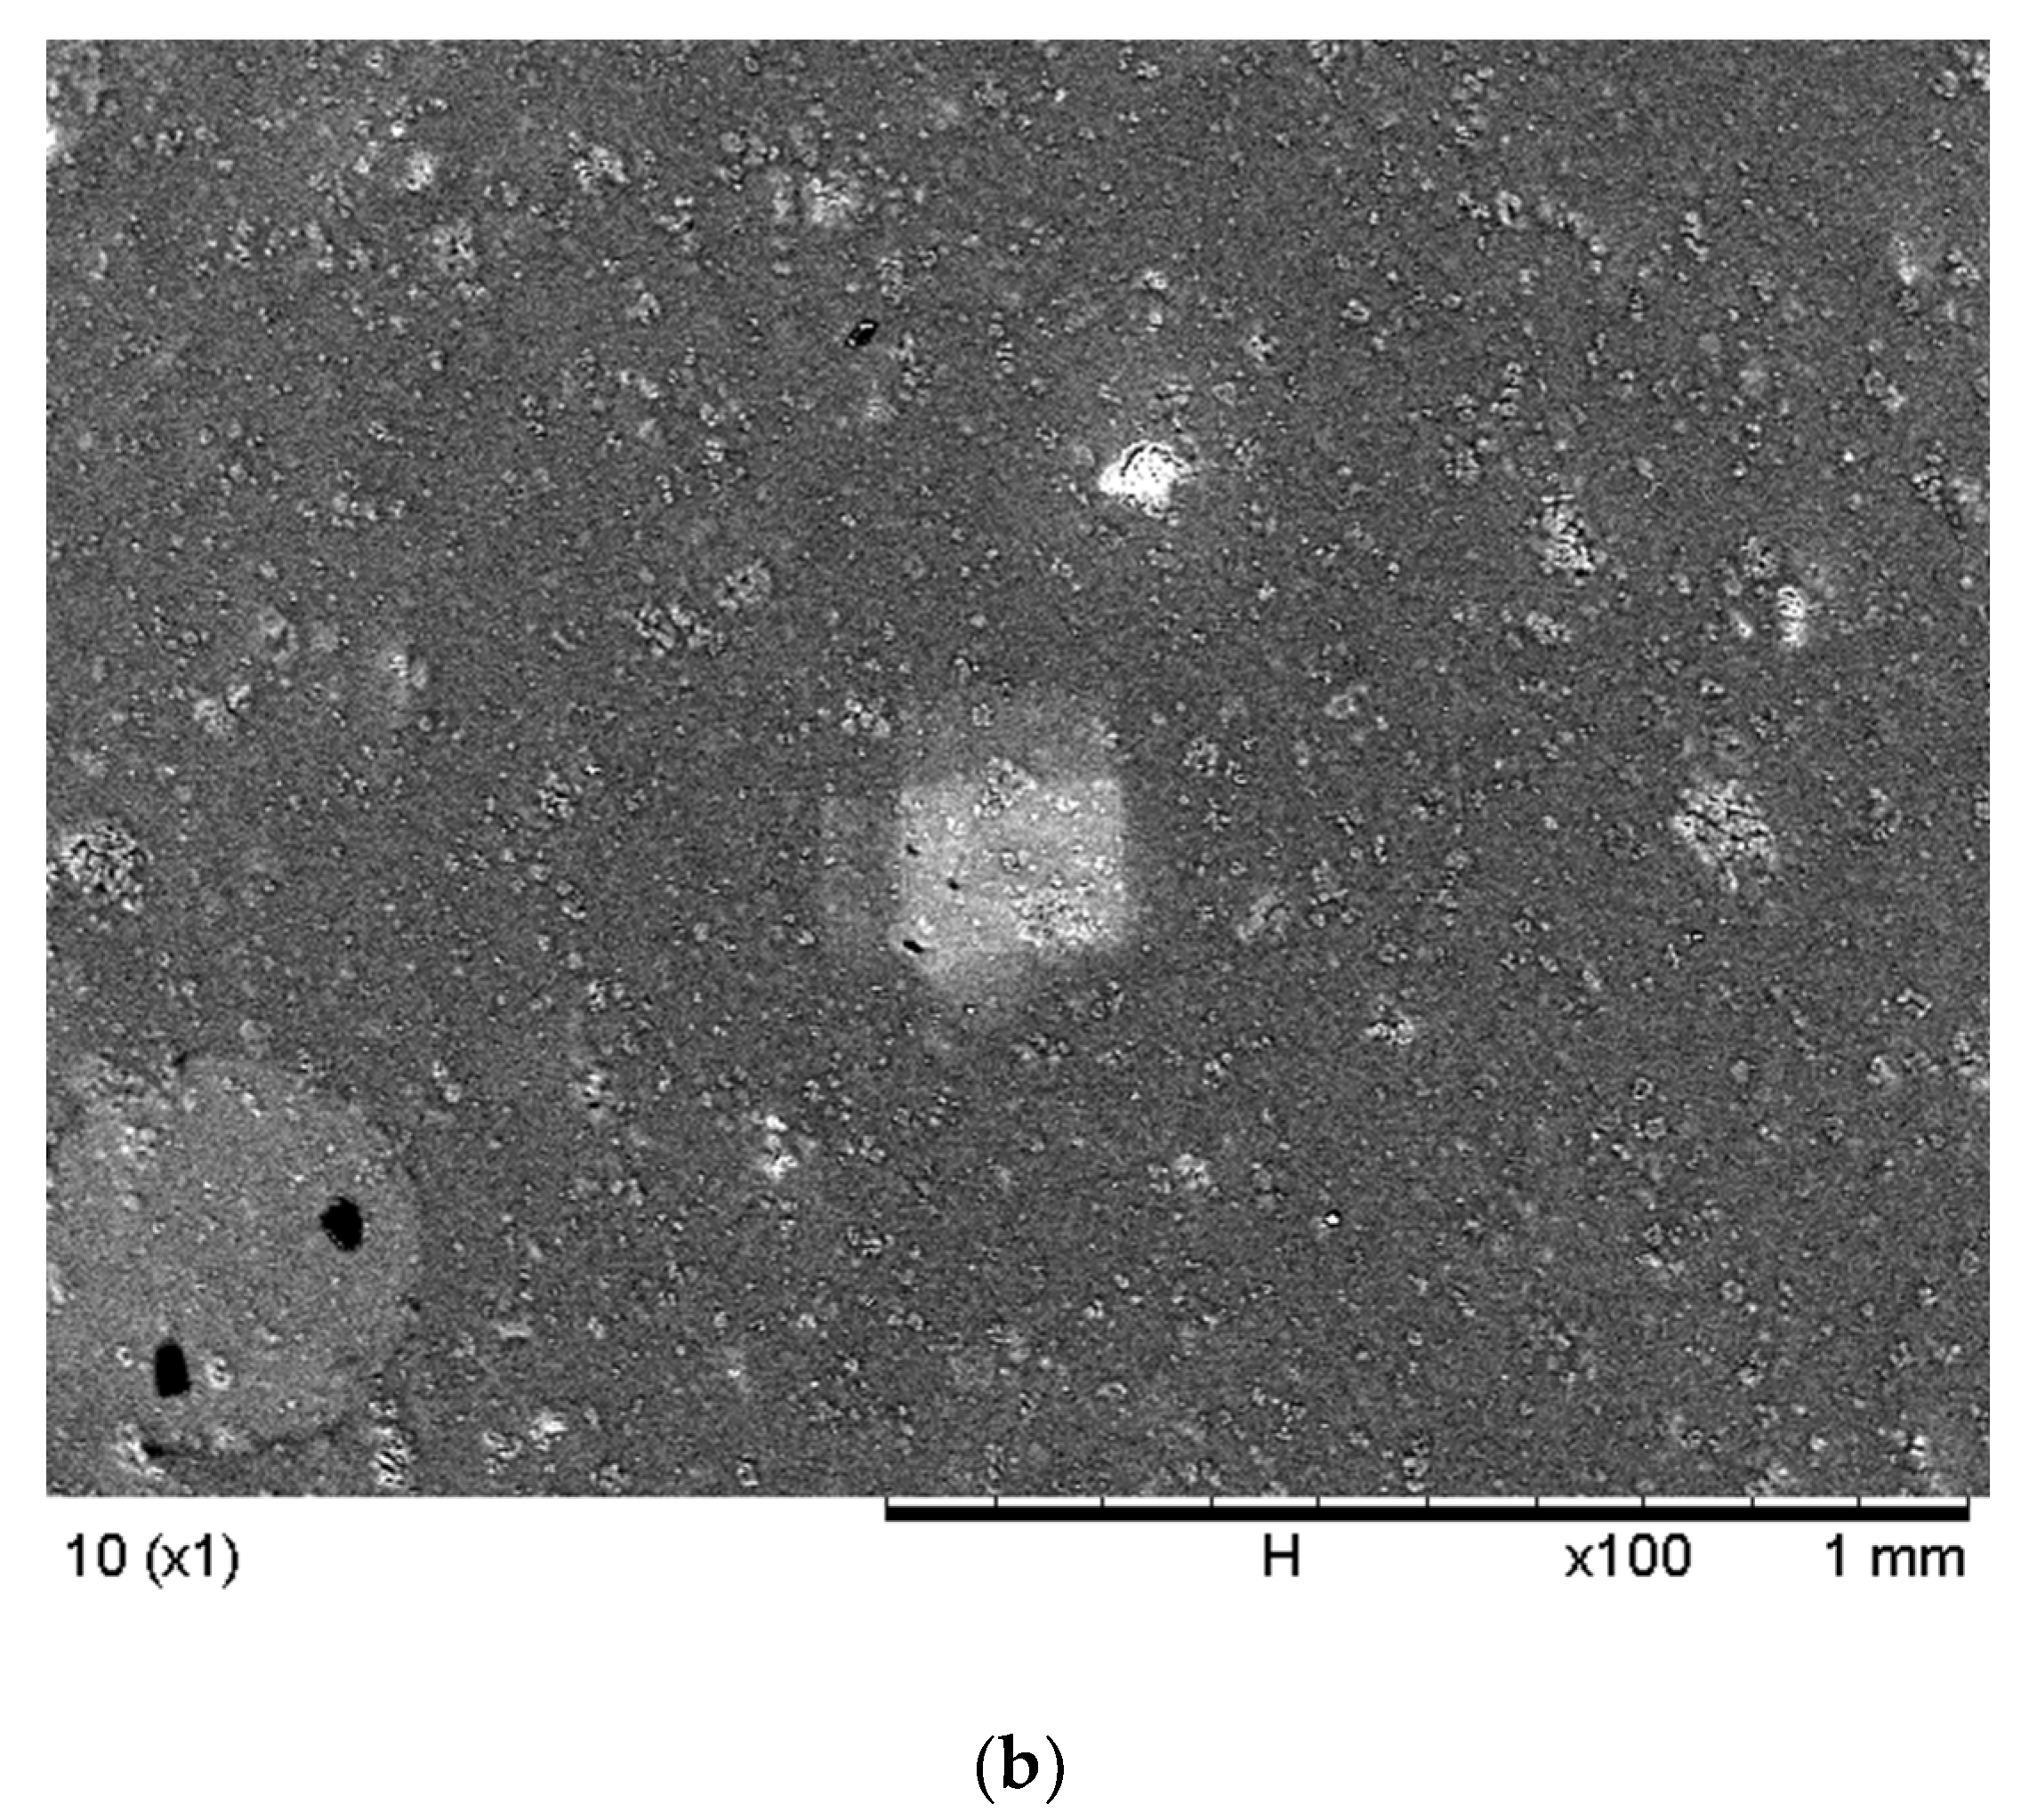
3.1. The SEM Analysis
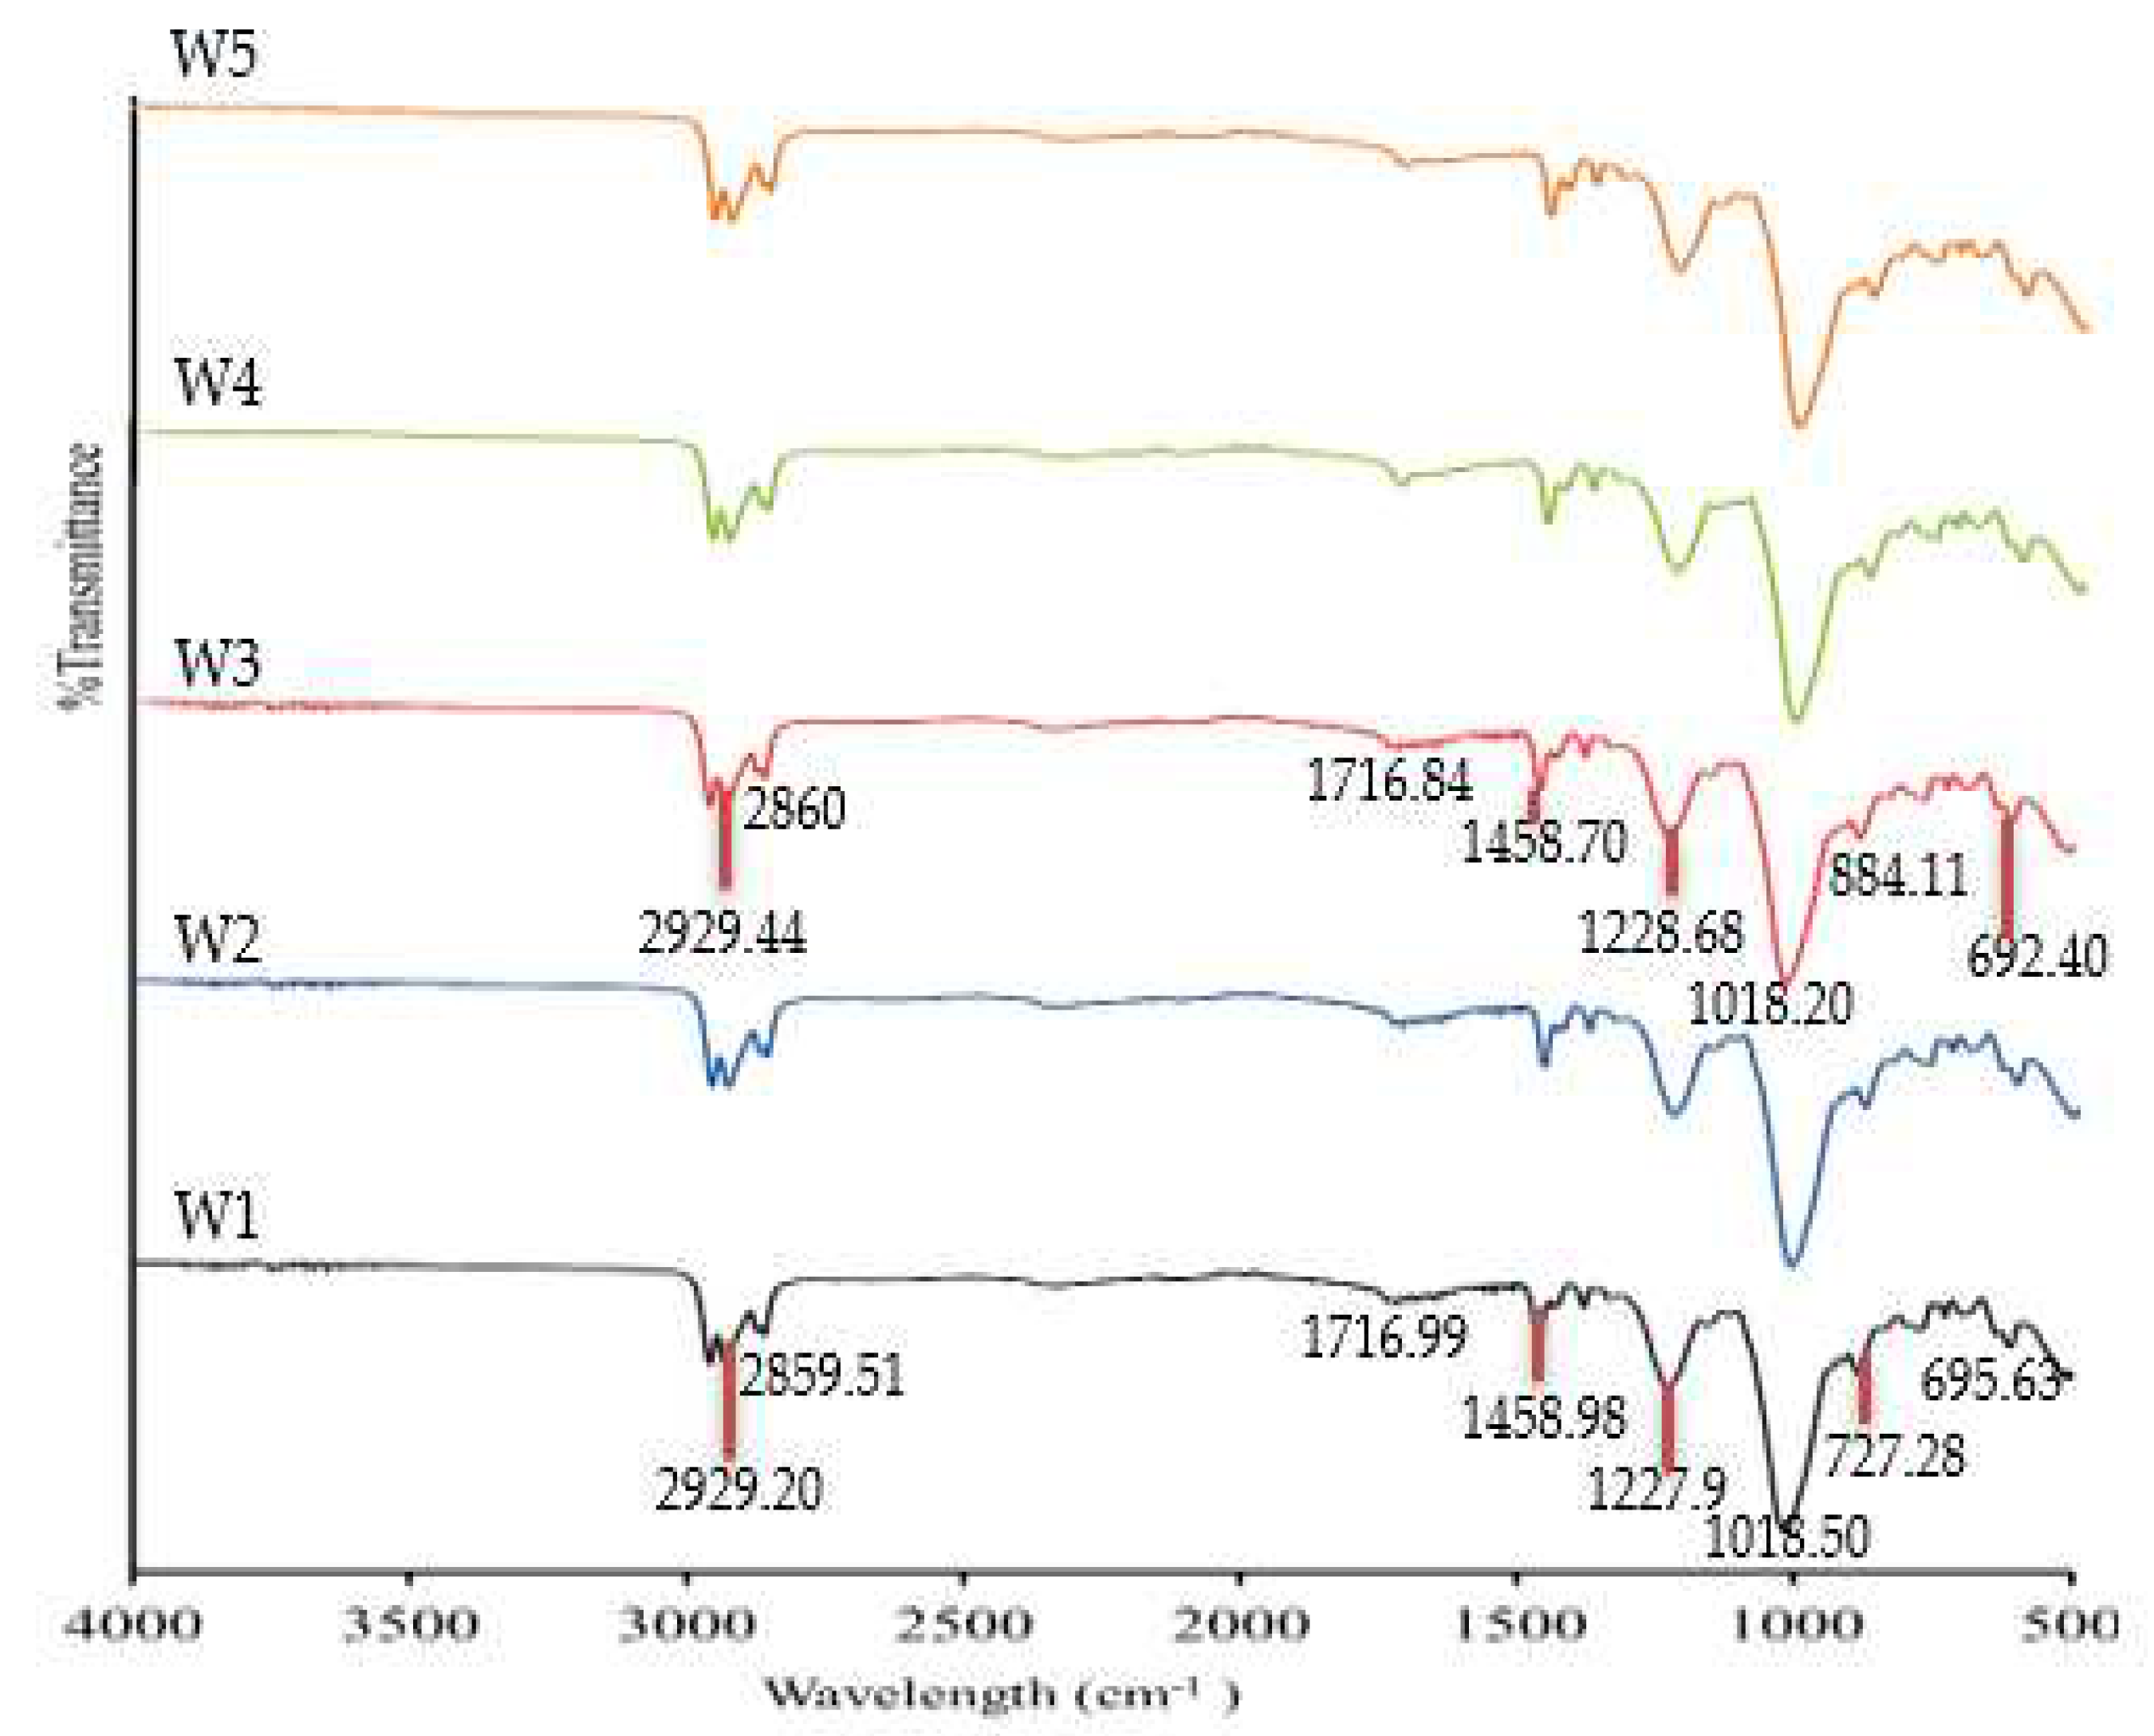
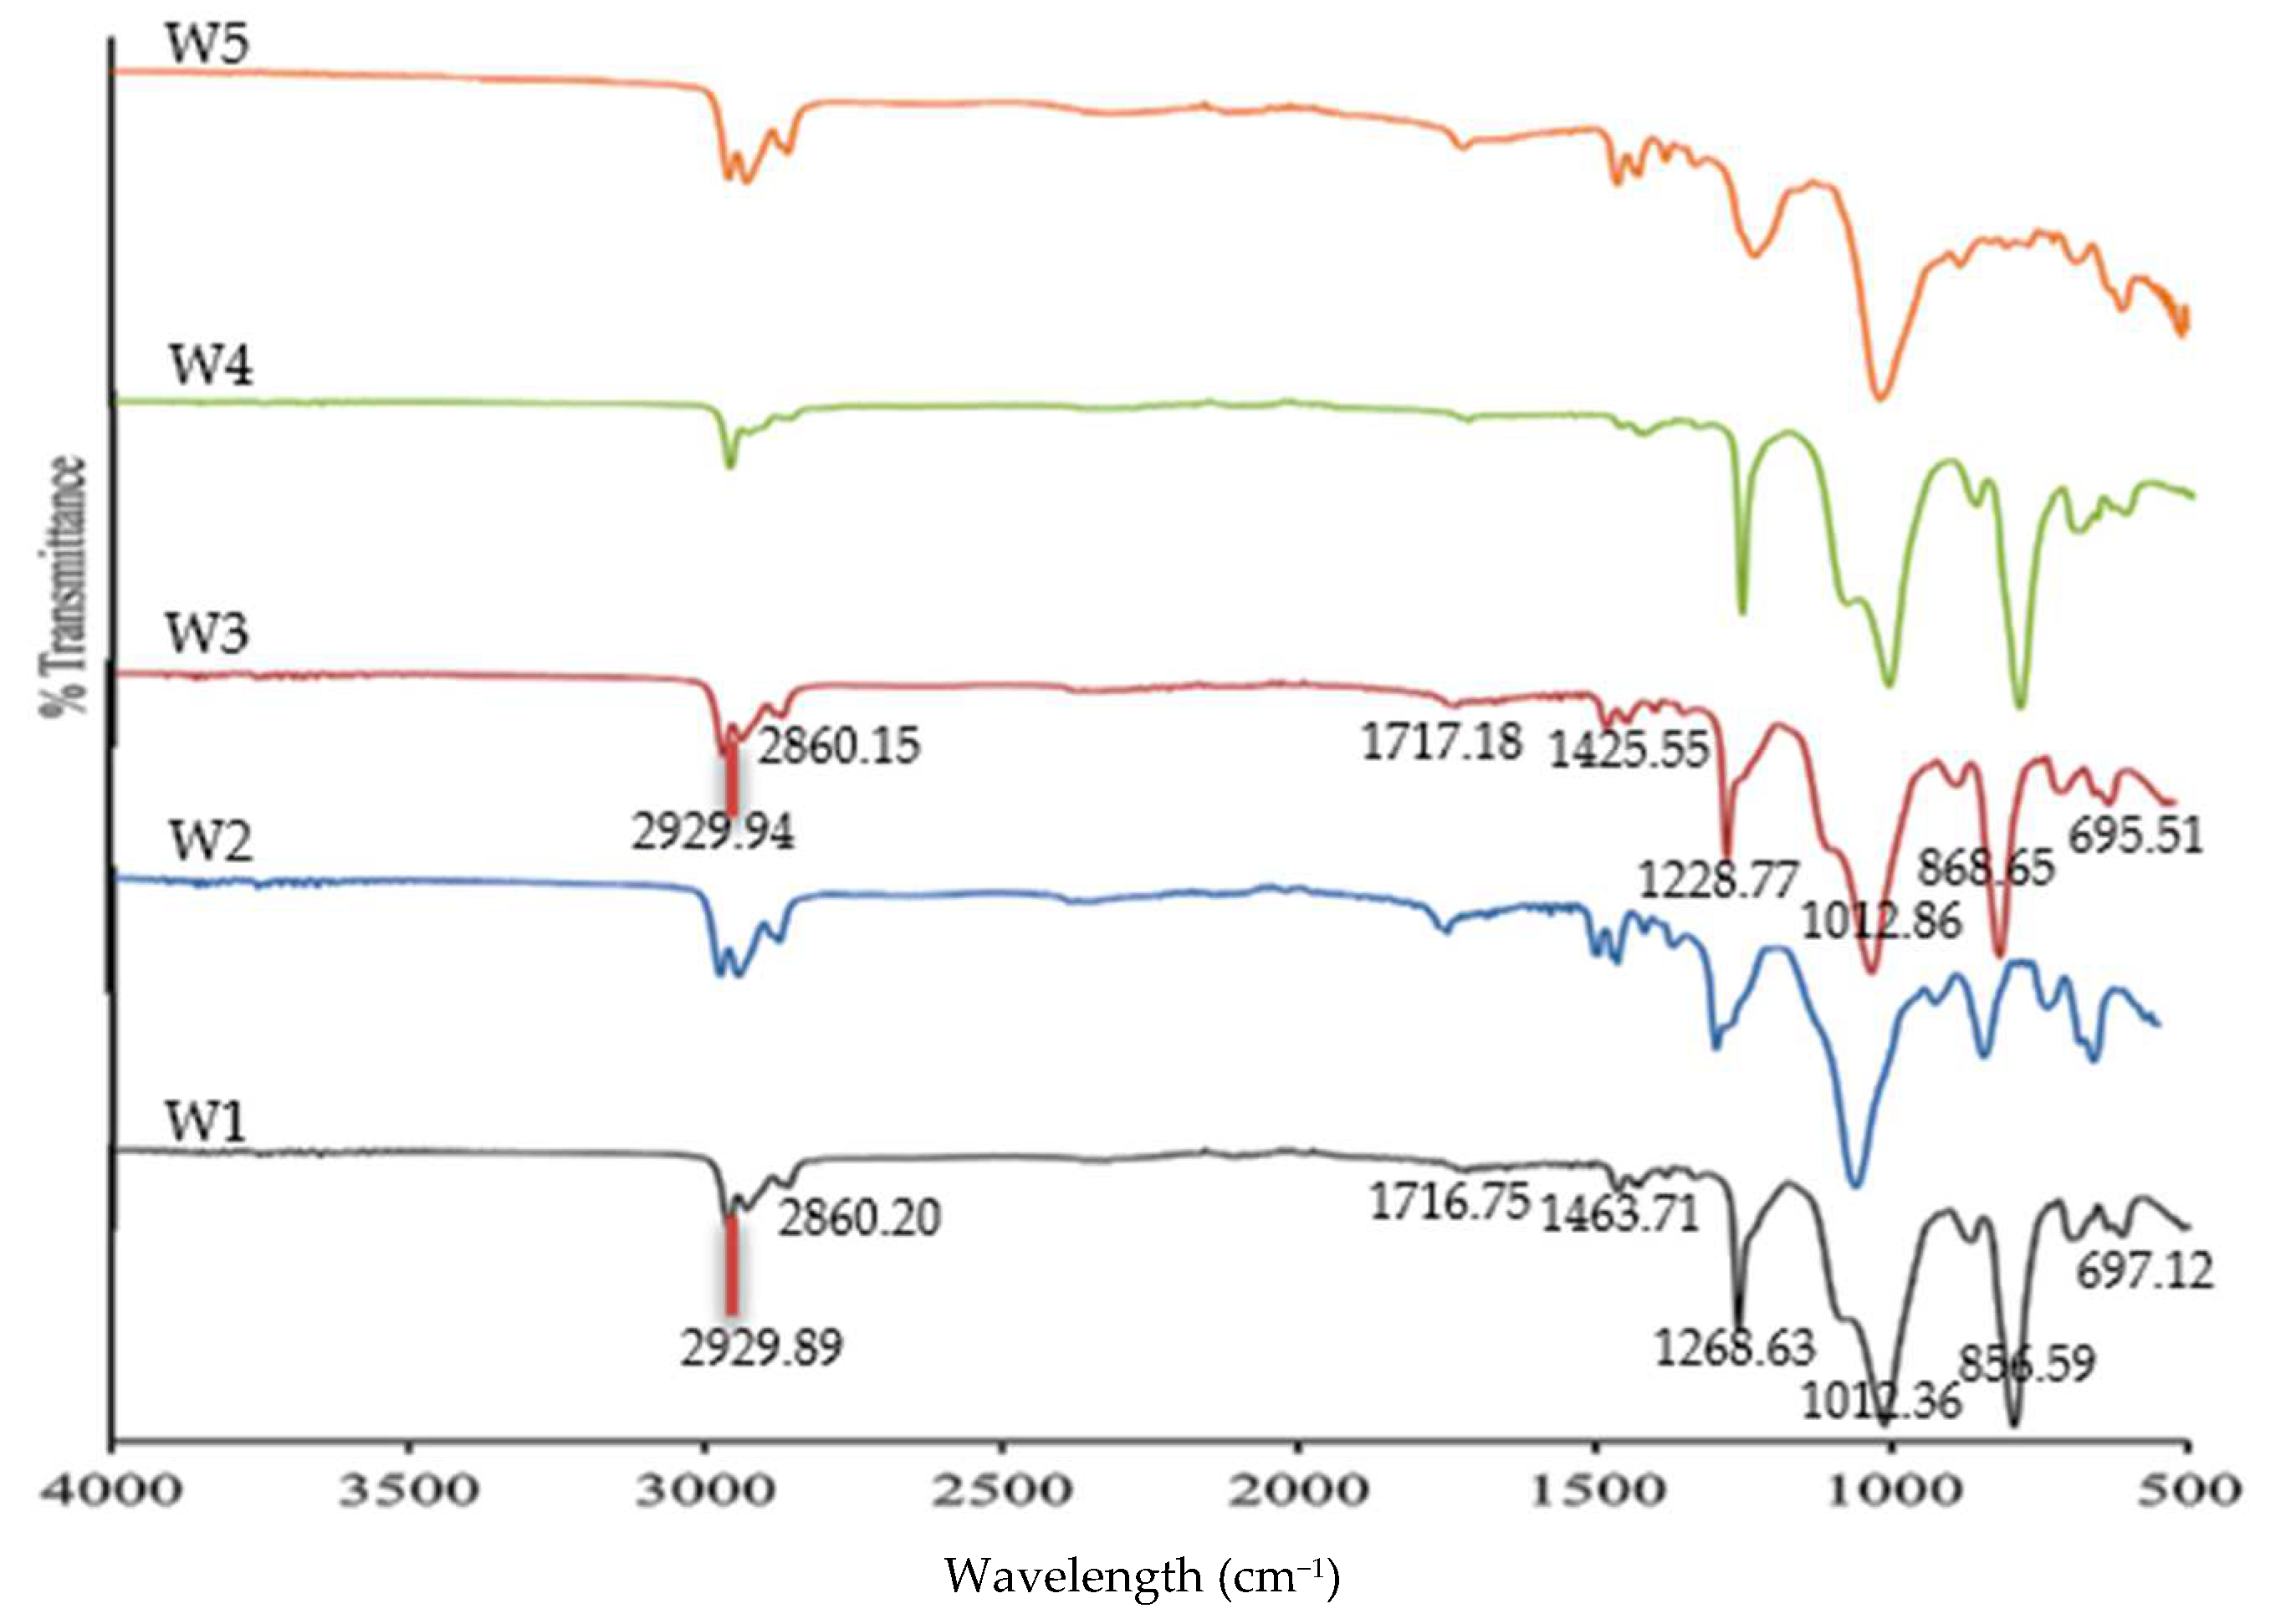
3.2. The FTIR Analysis
3.3. The CA, Porosity, Water Uptake, and Thickness Evaluations
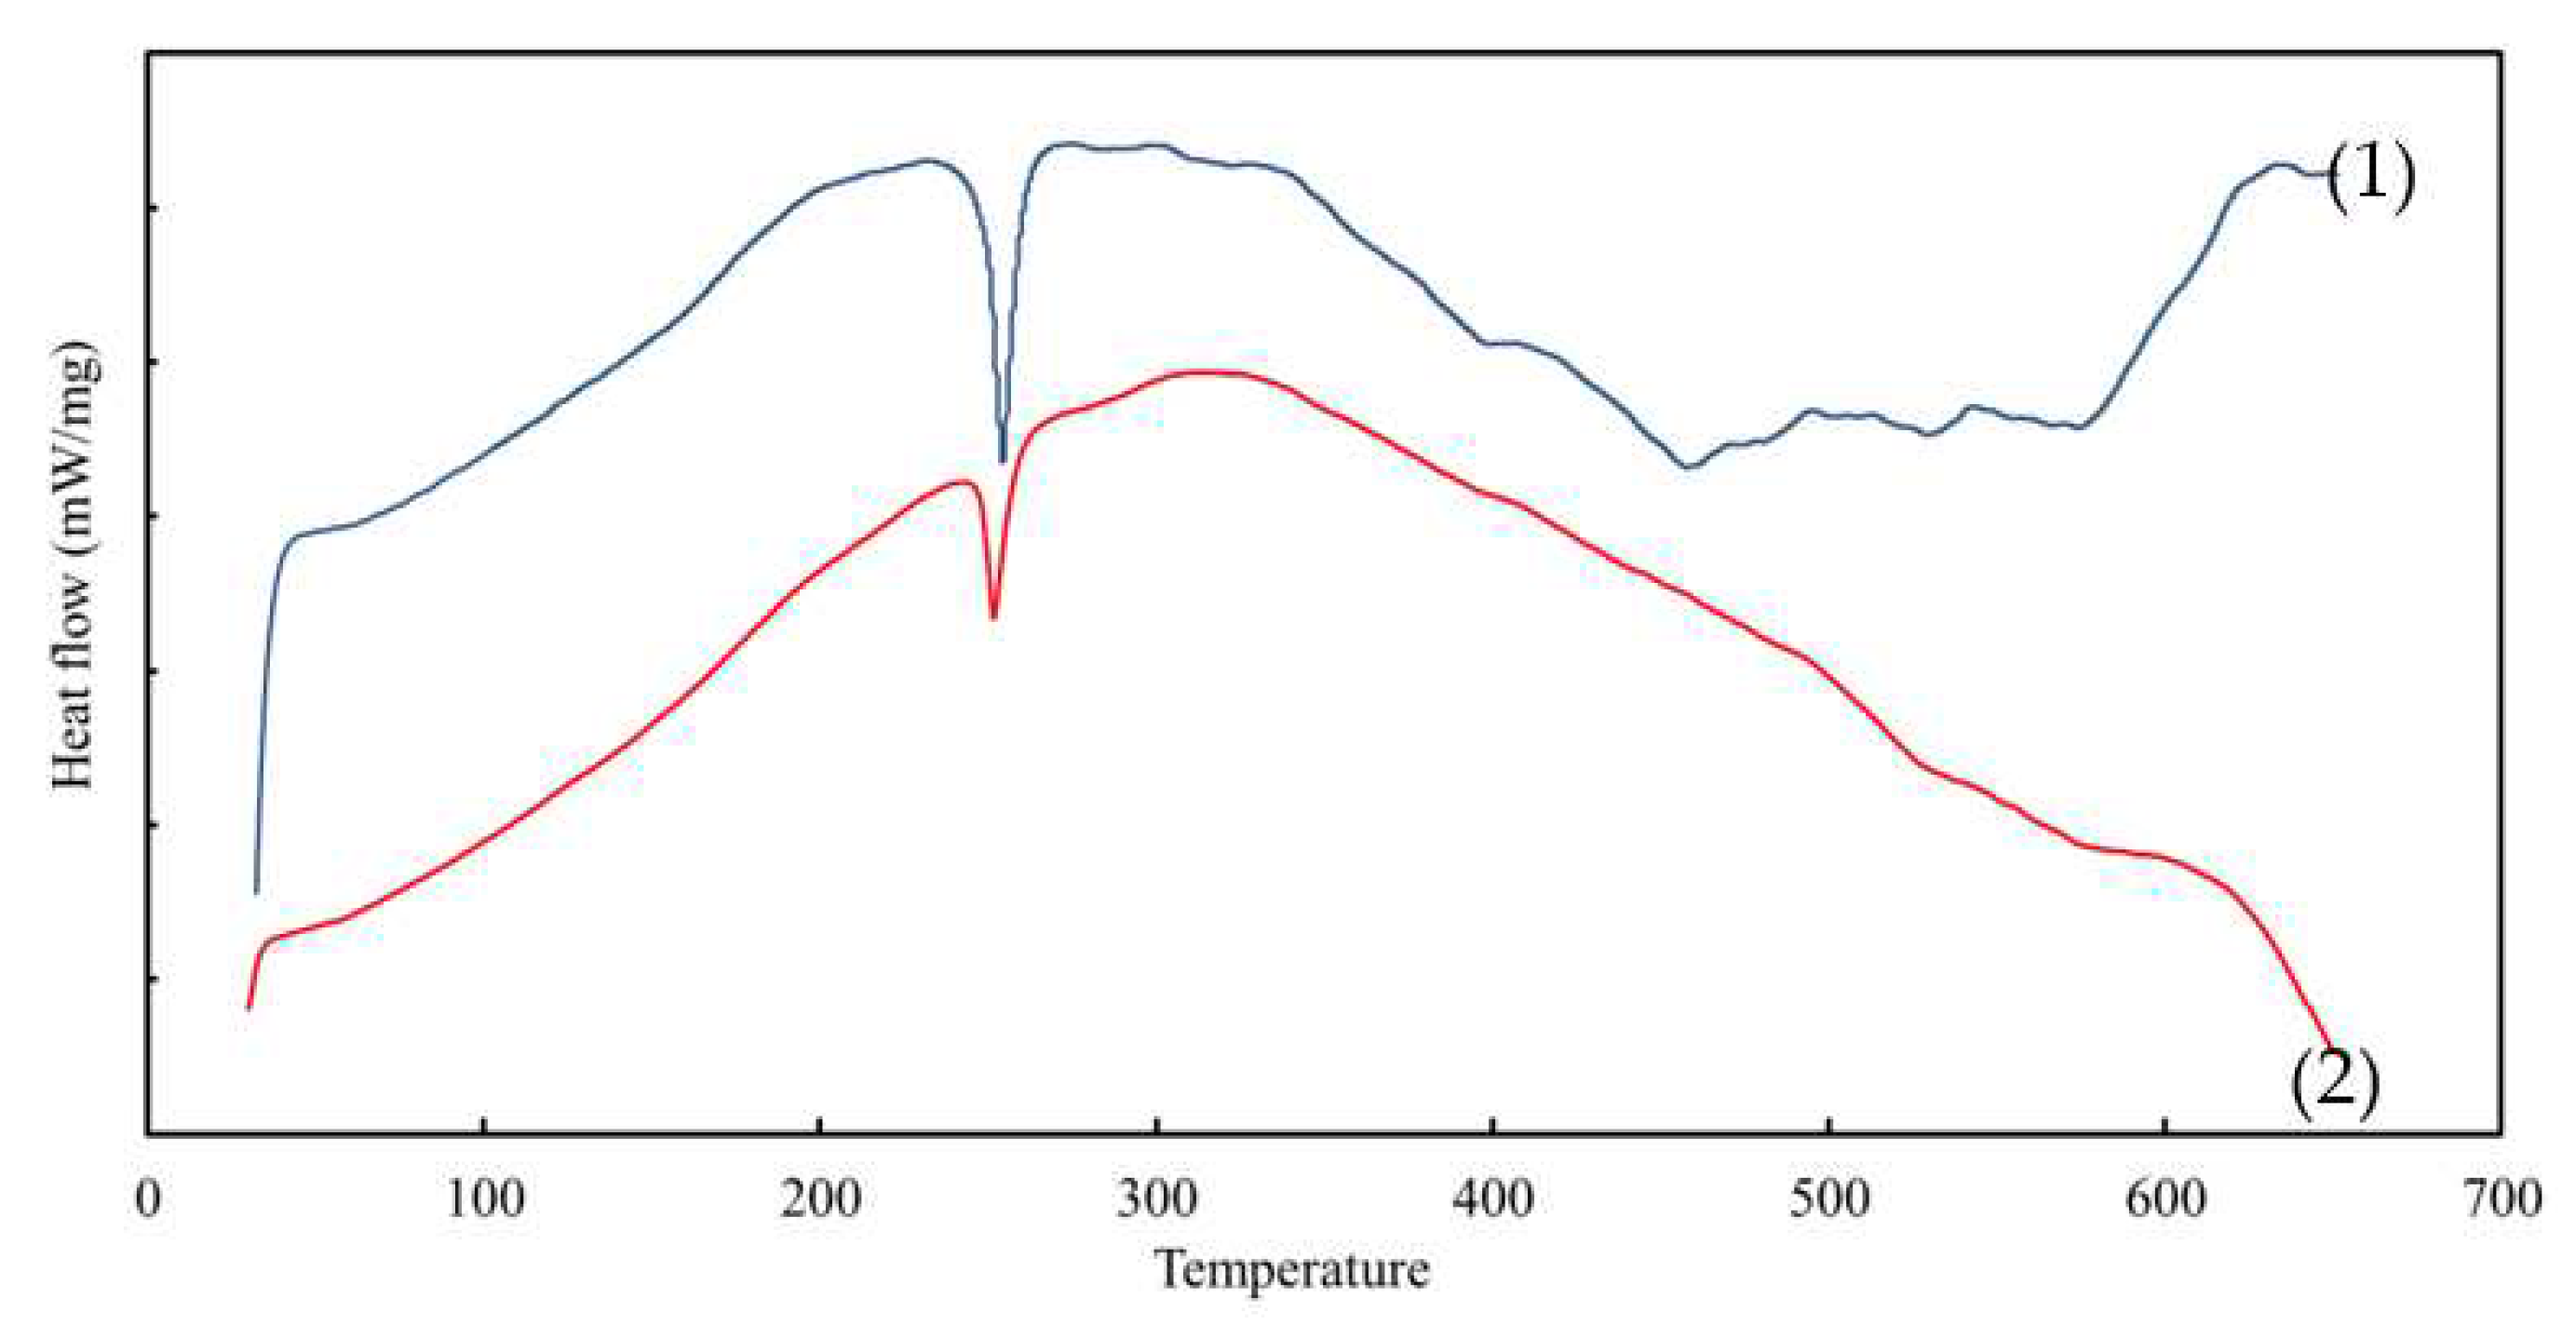
3.4. The DSC Analysis
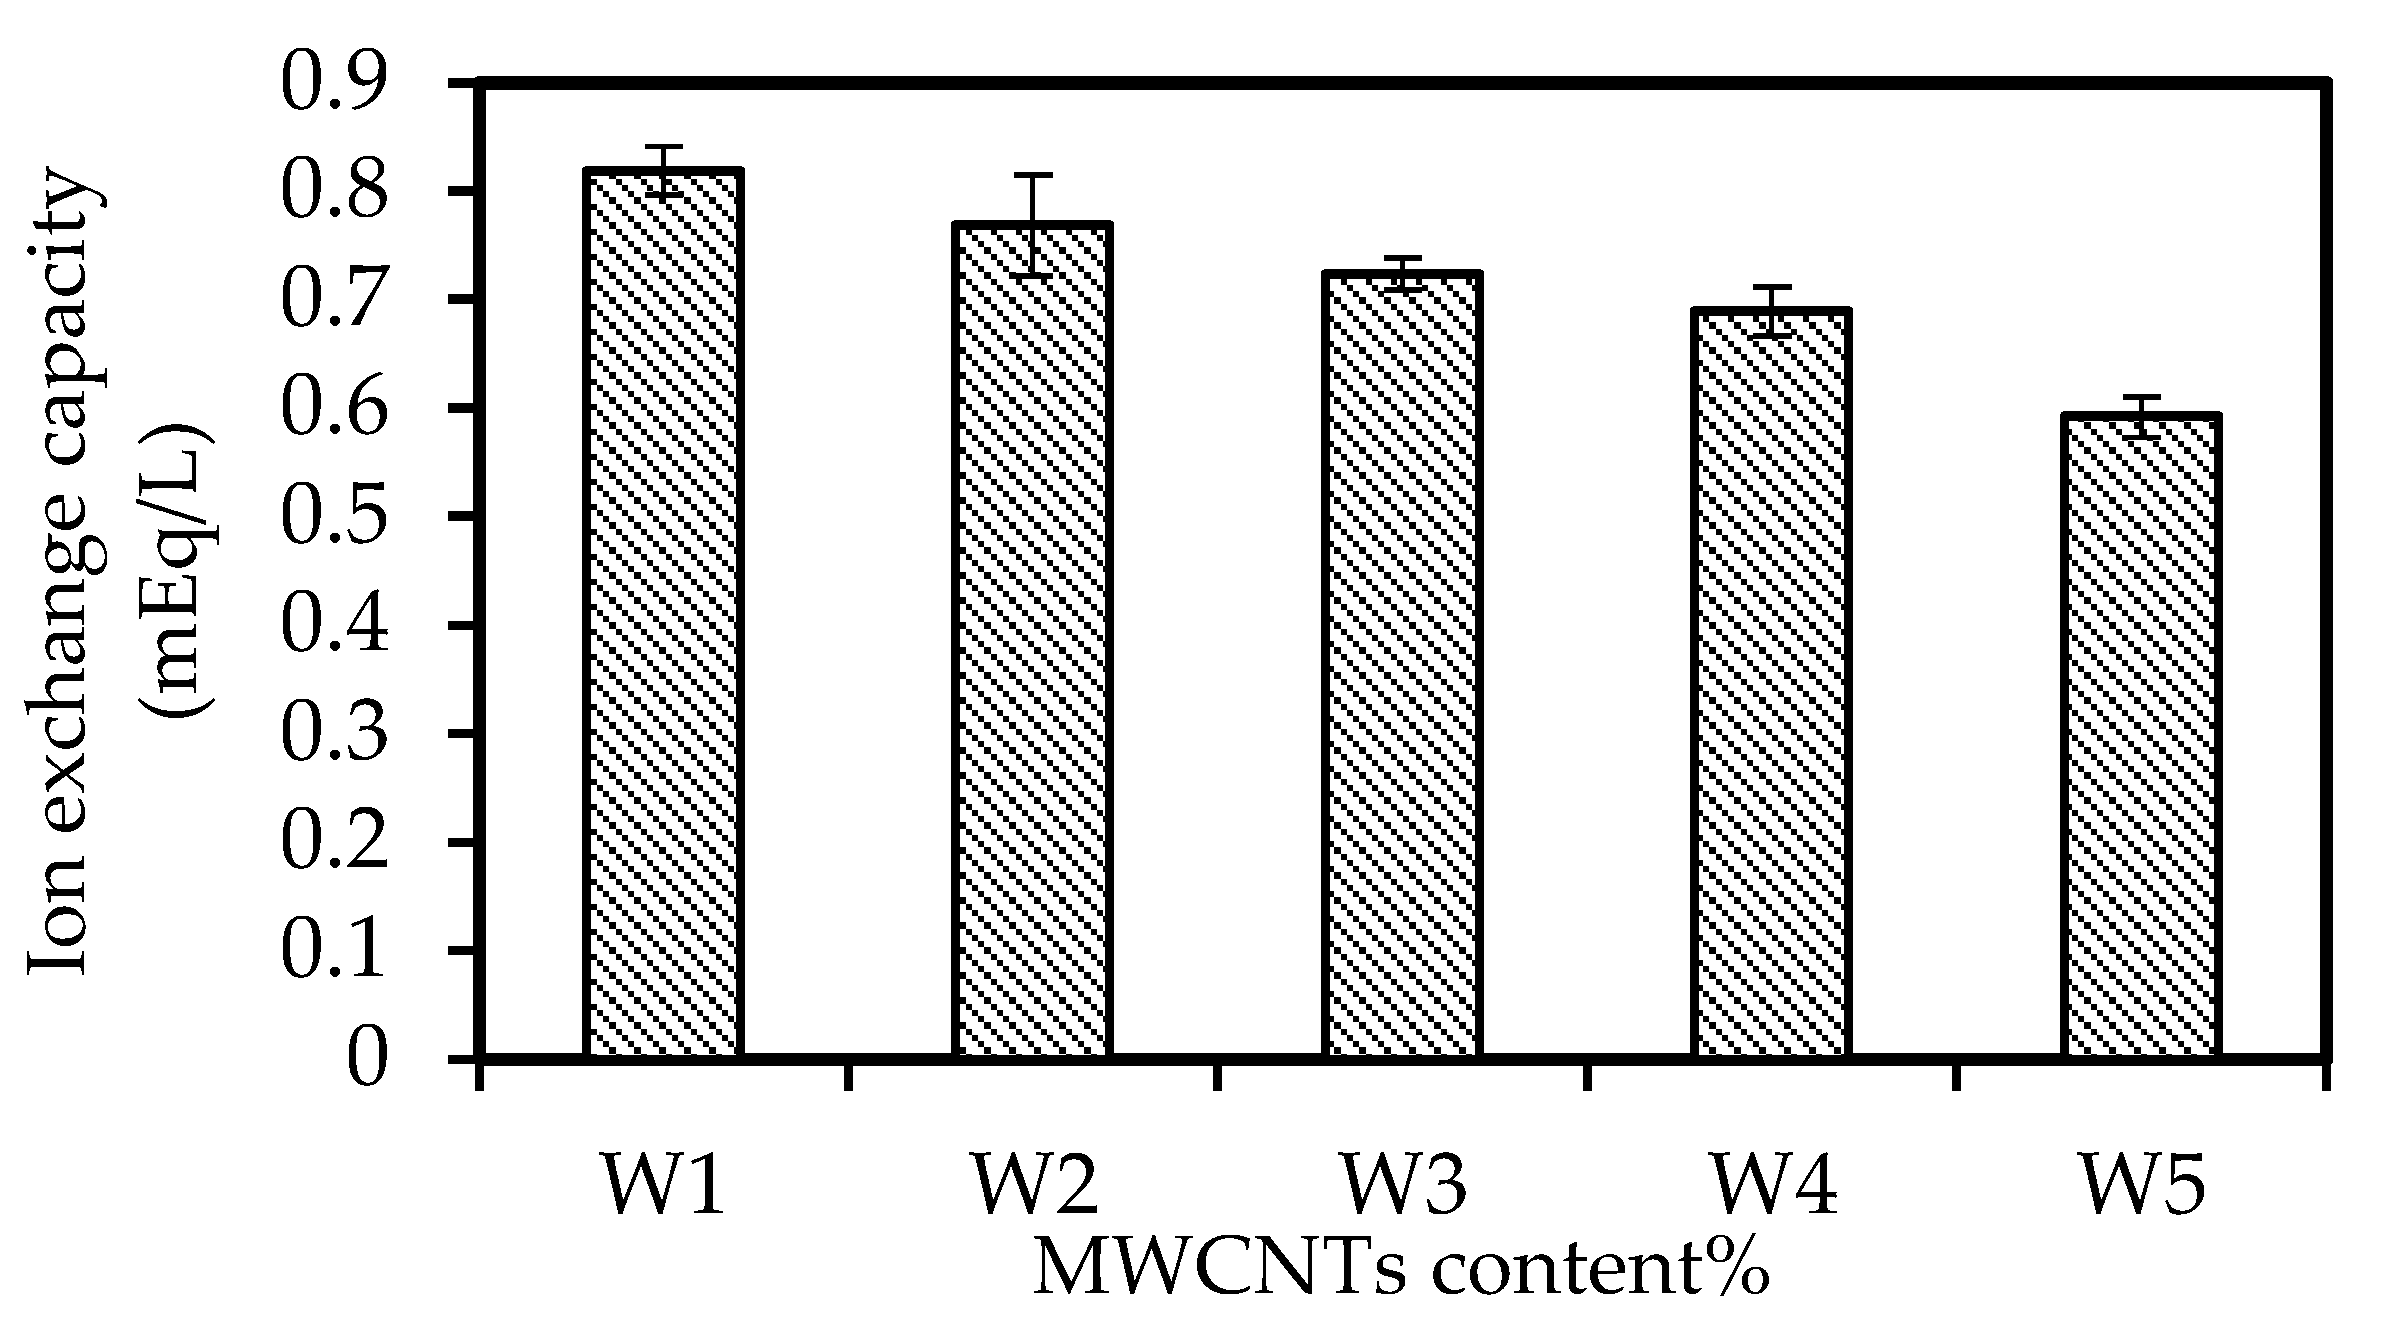
3.5. The IEC Study
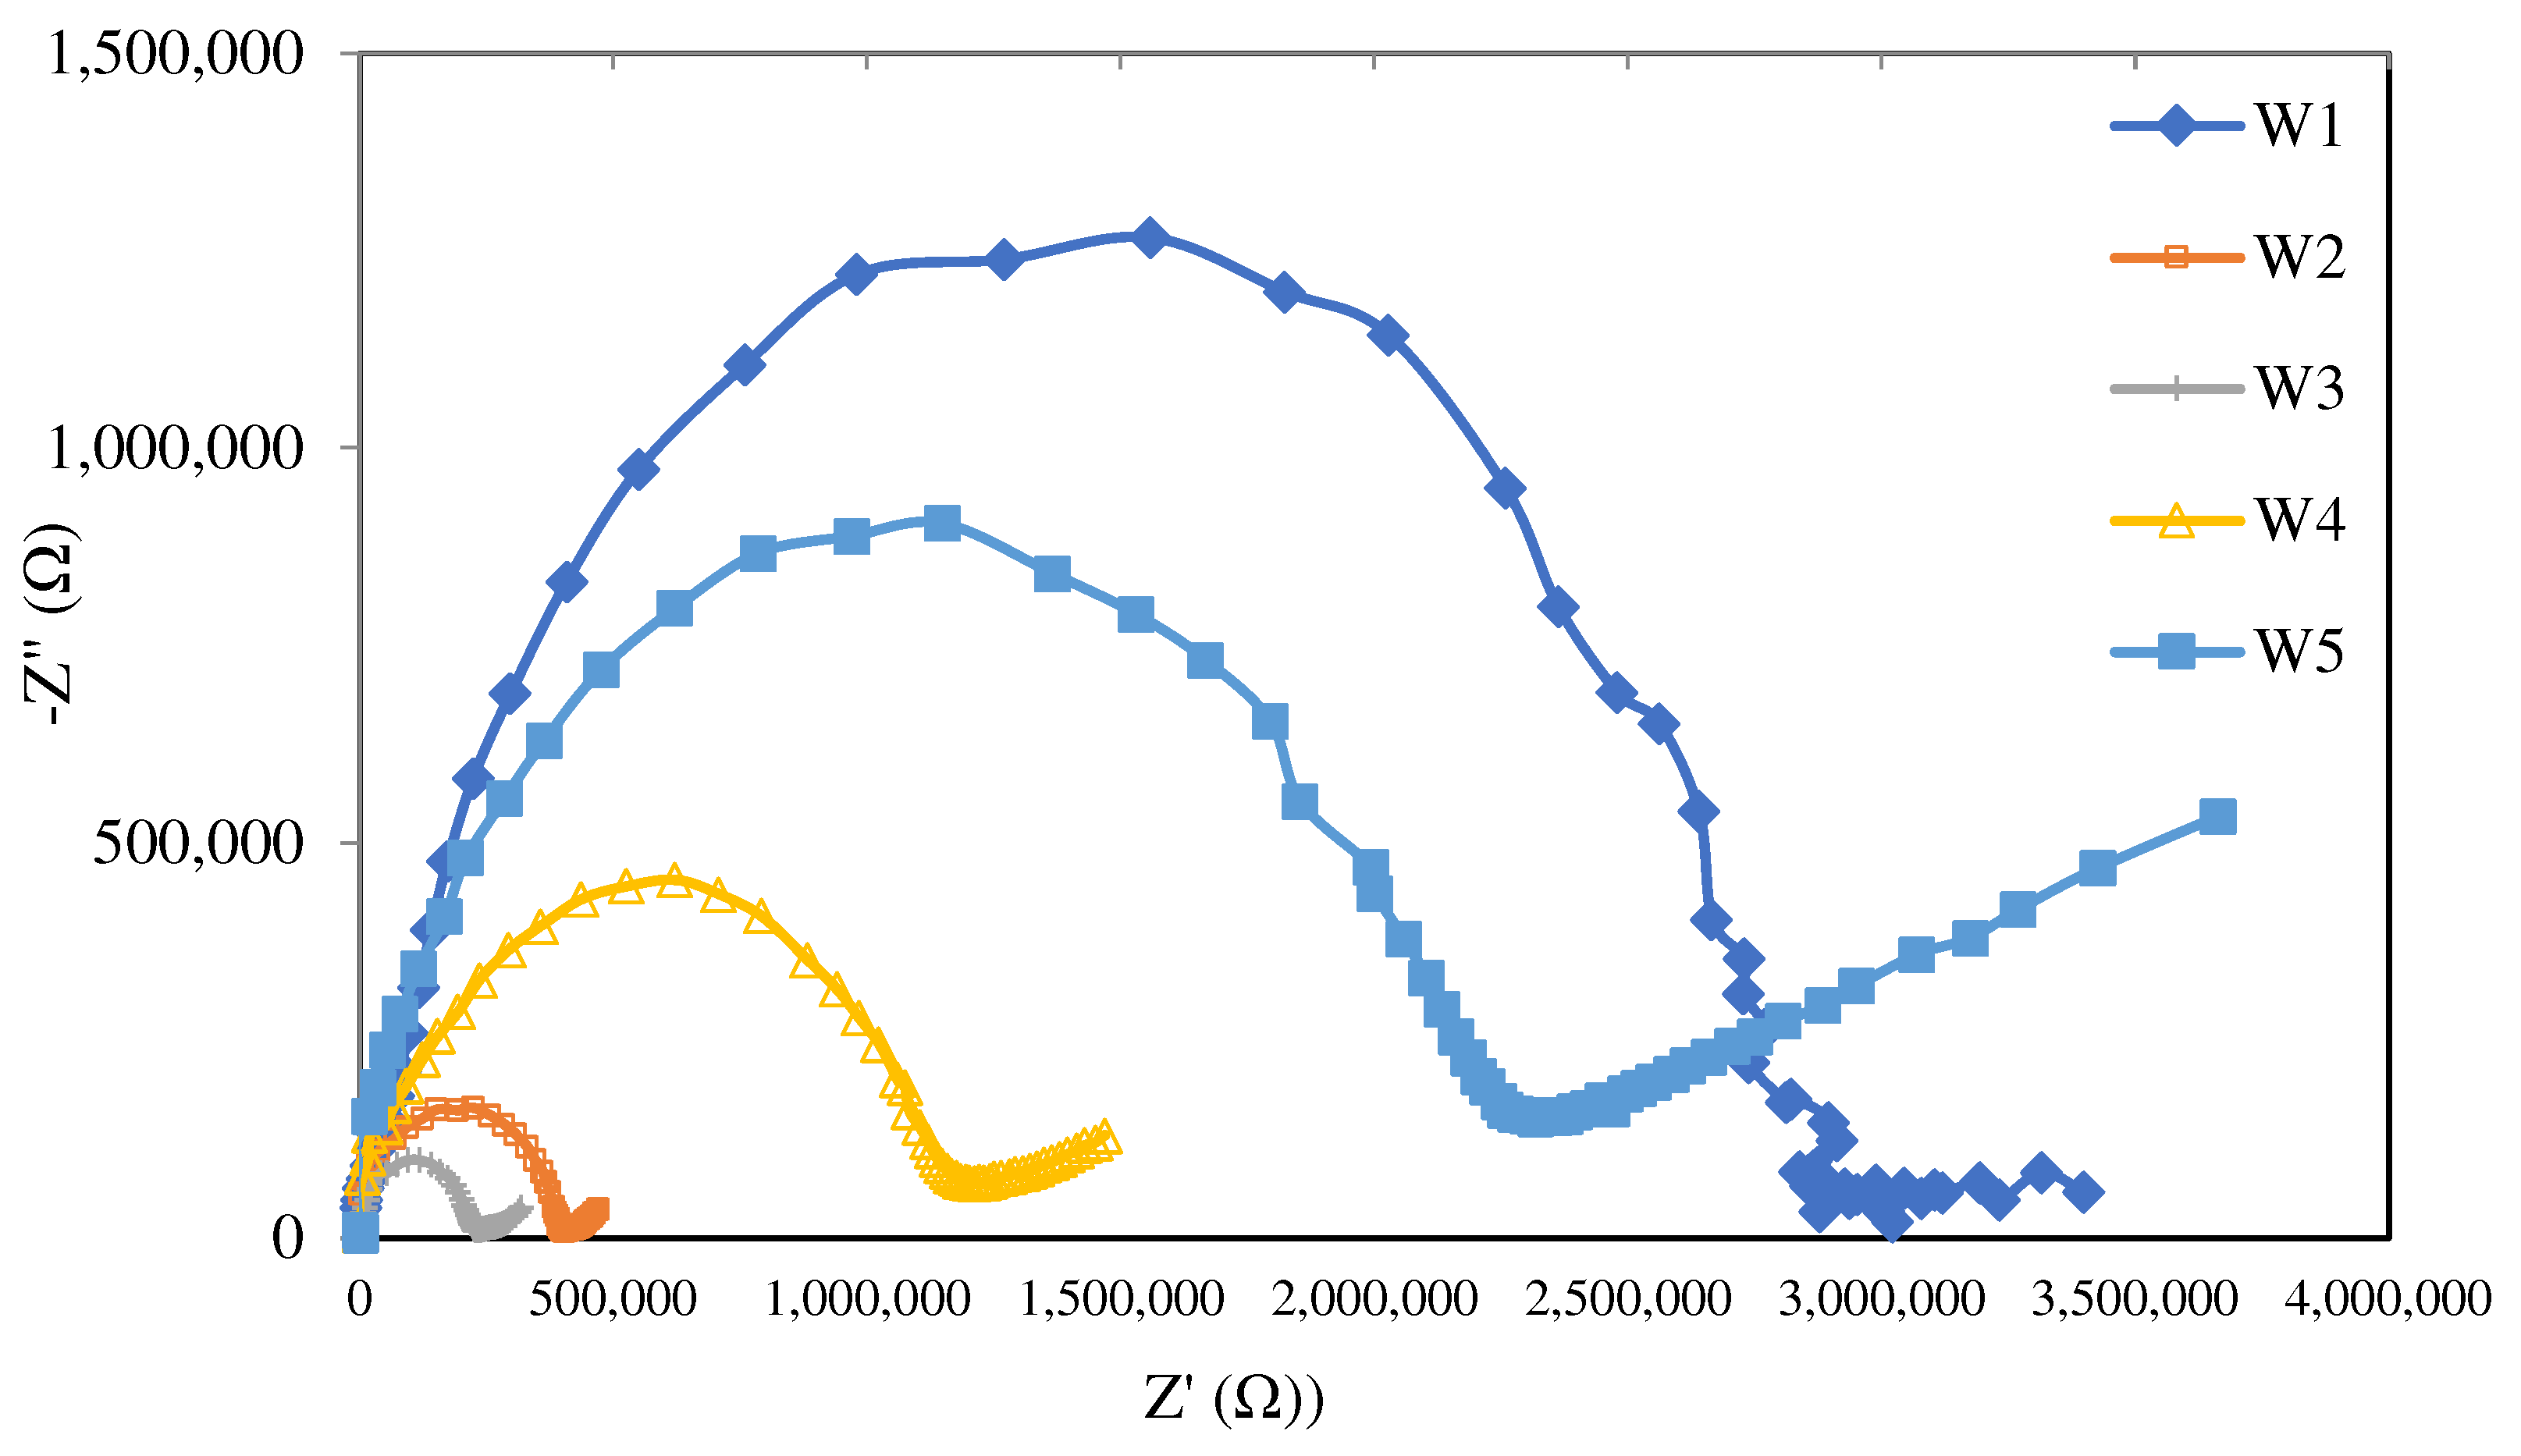
3.6. The EIS Analysis
3.7. Performance Studies of the Fabricated PIMs
3.7.1. Optimisation of the Nanoparticle Compositions
3.7.2. Optimisation of Essential Parameters for Optimal Membrane Performance
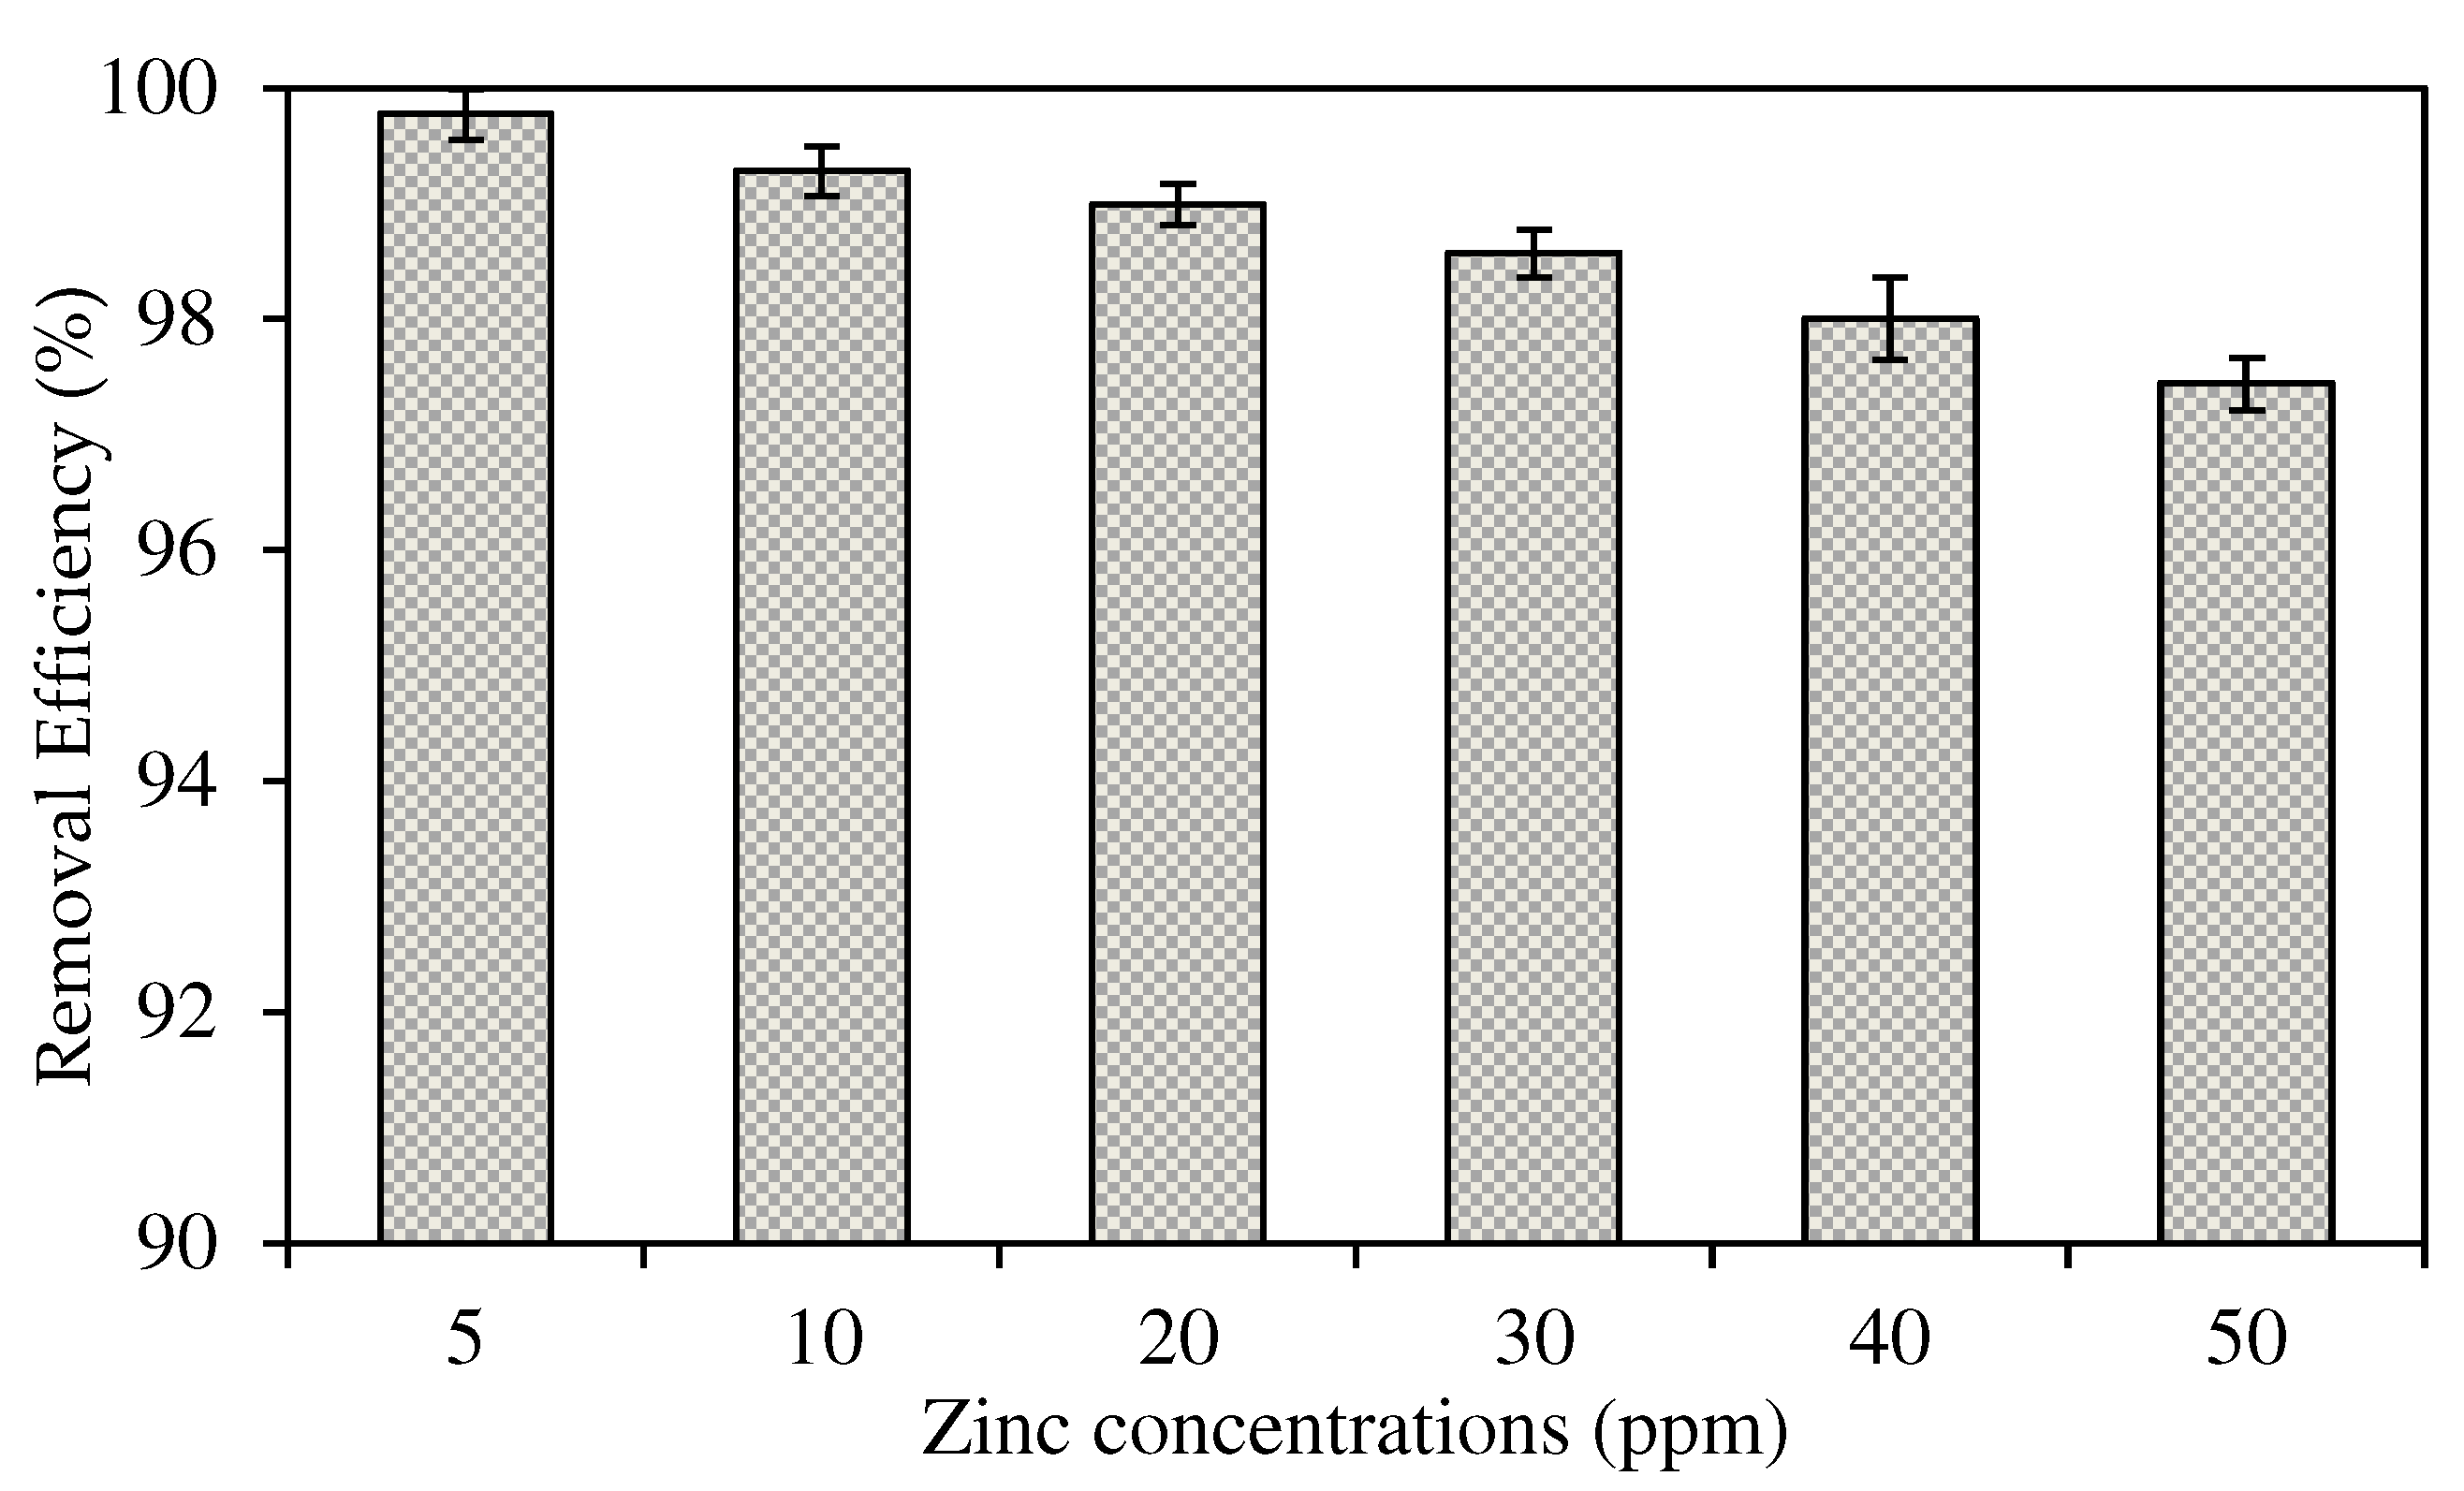
The Effects of Different Initial Concentrations of Source Phase
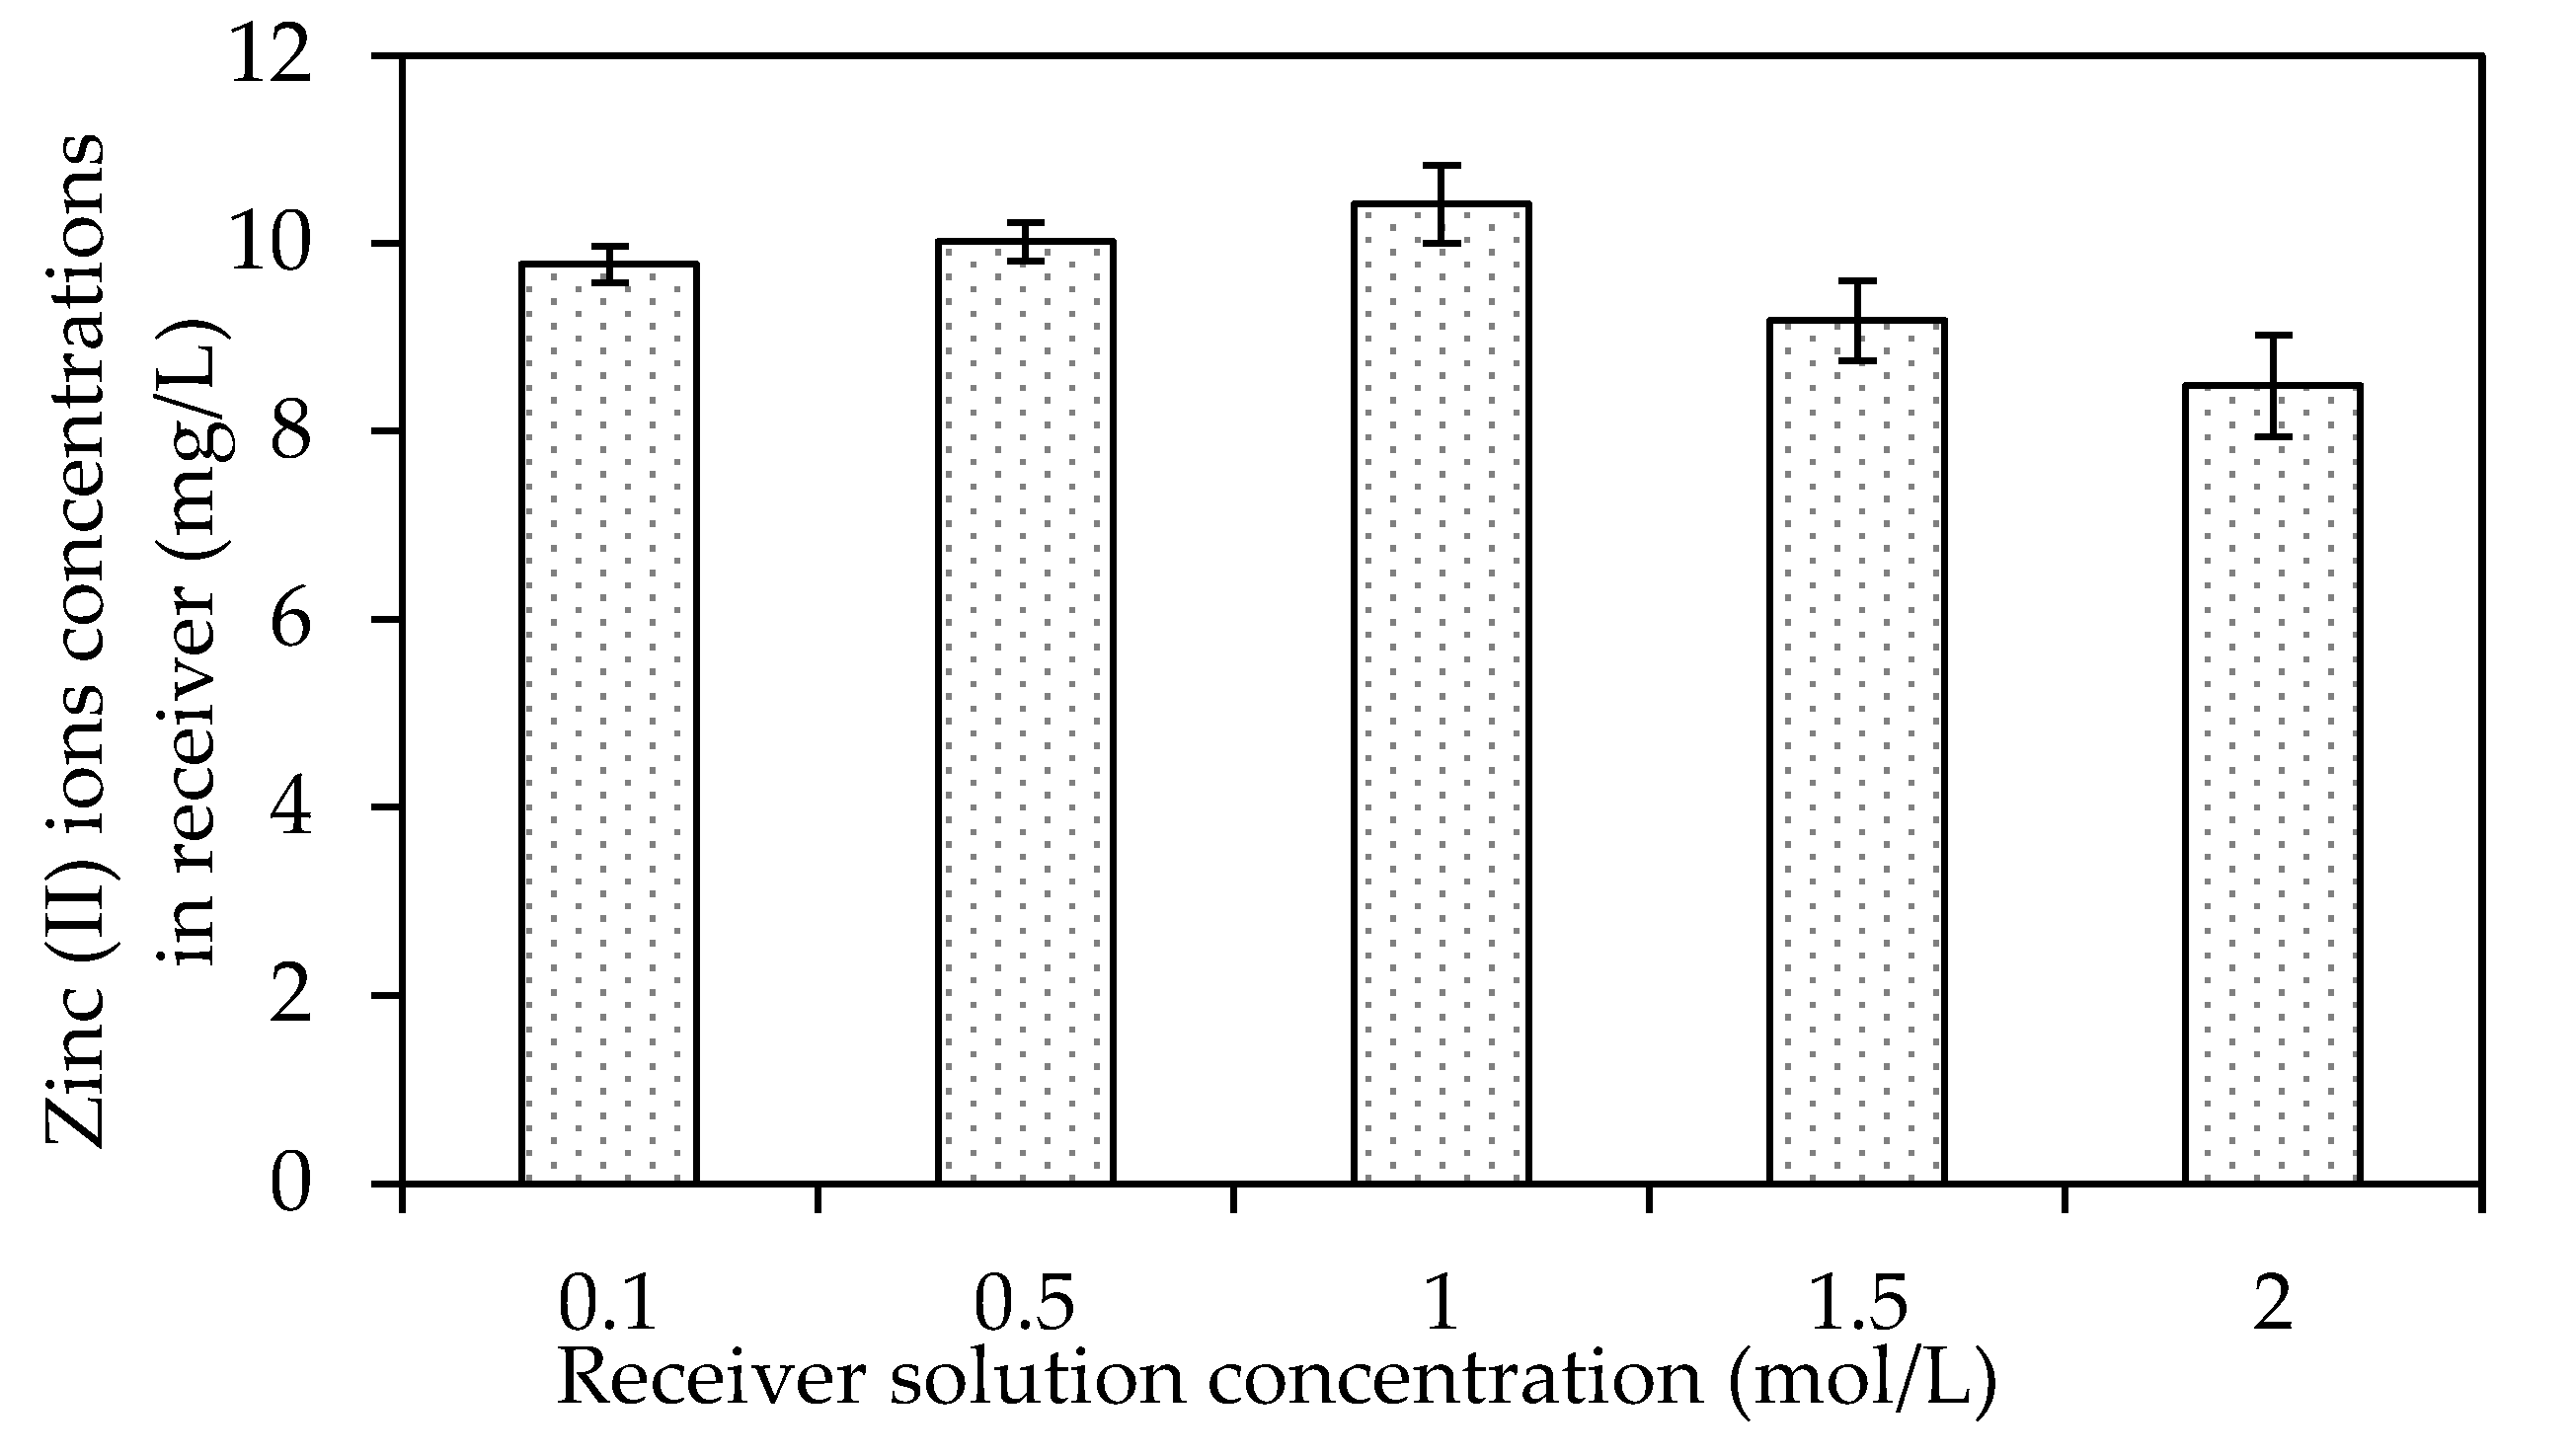
The Effects of Different Receiving Agent Concentrations
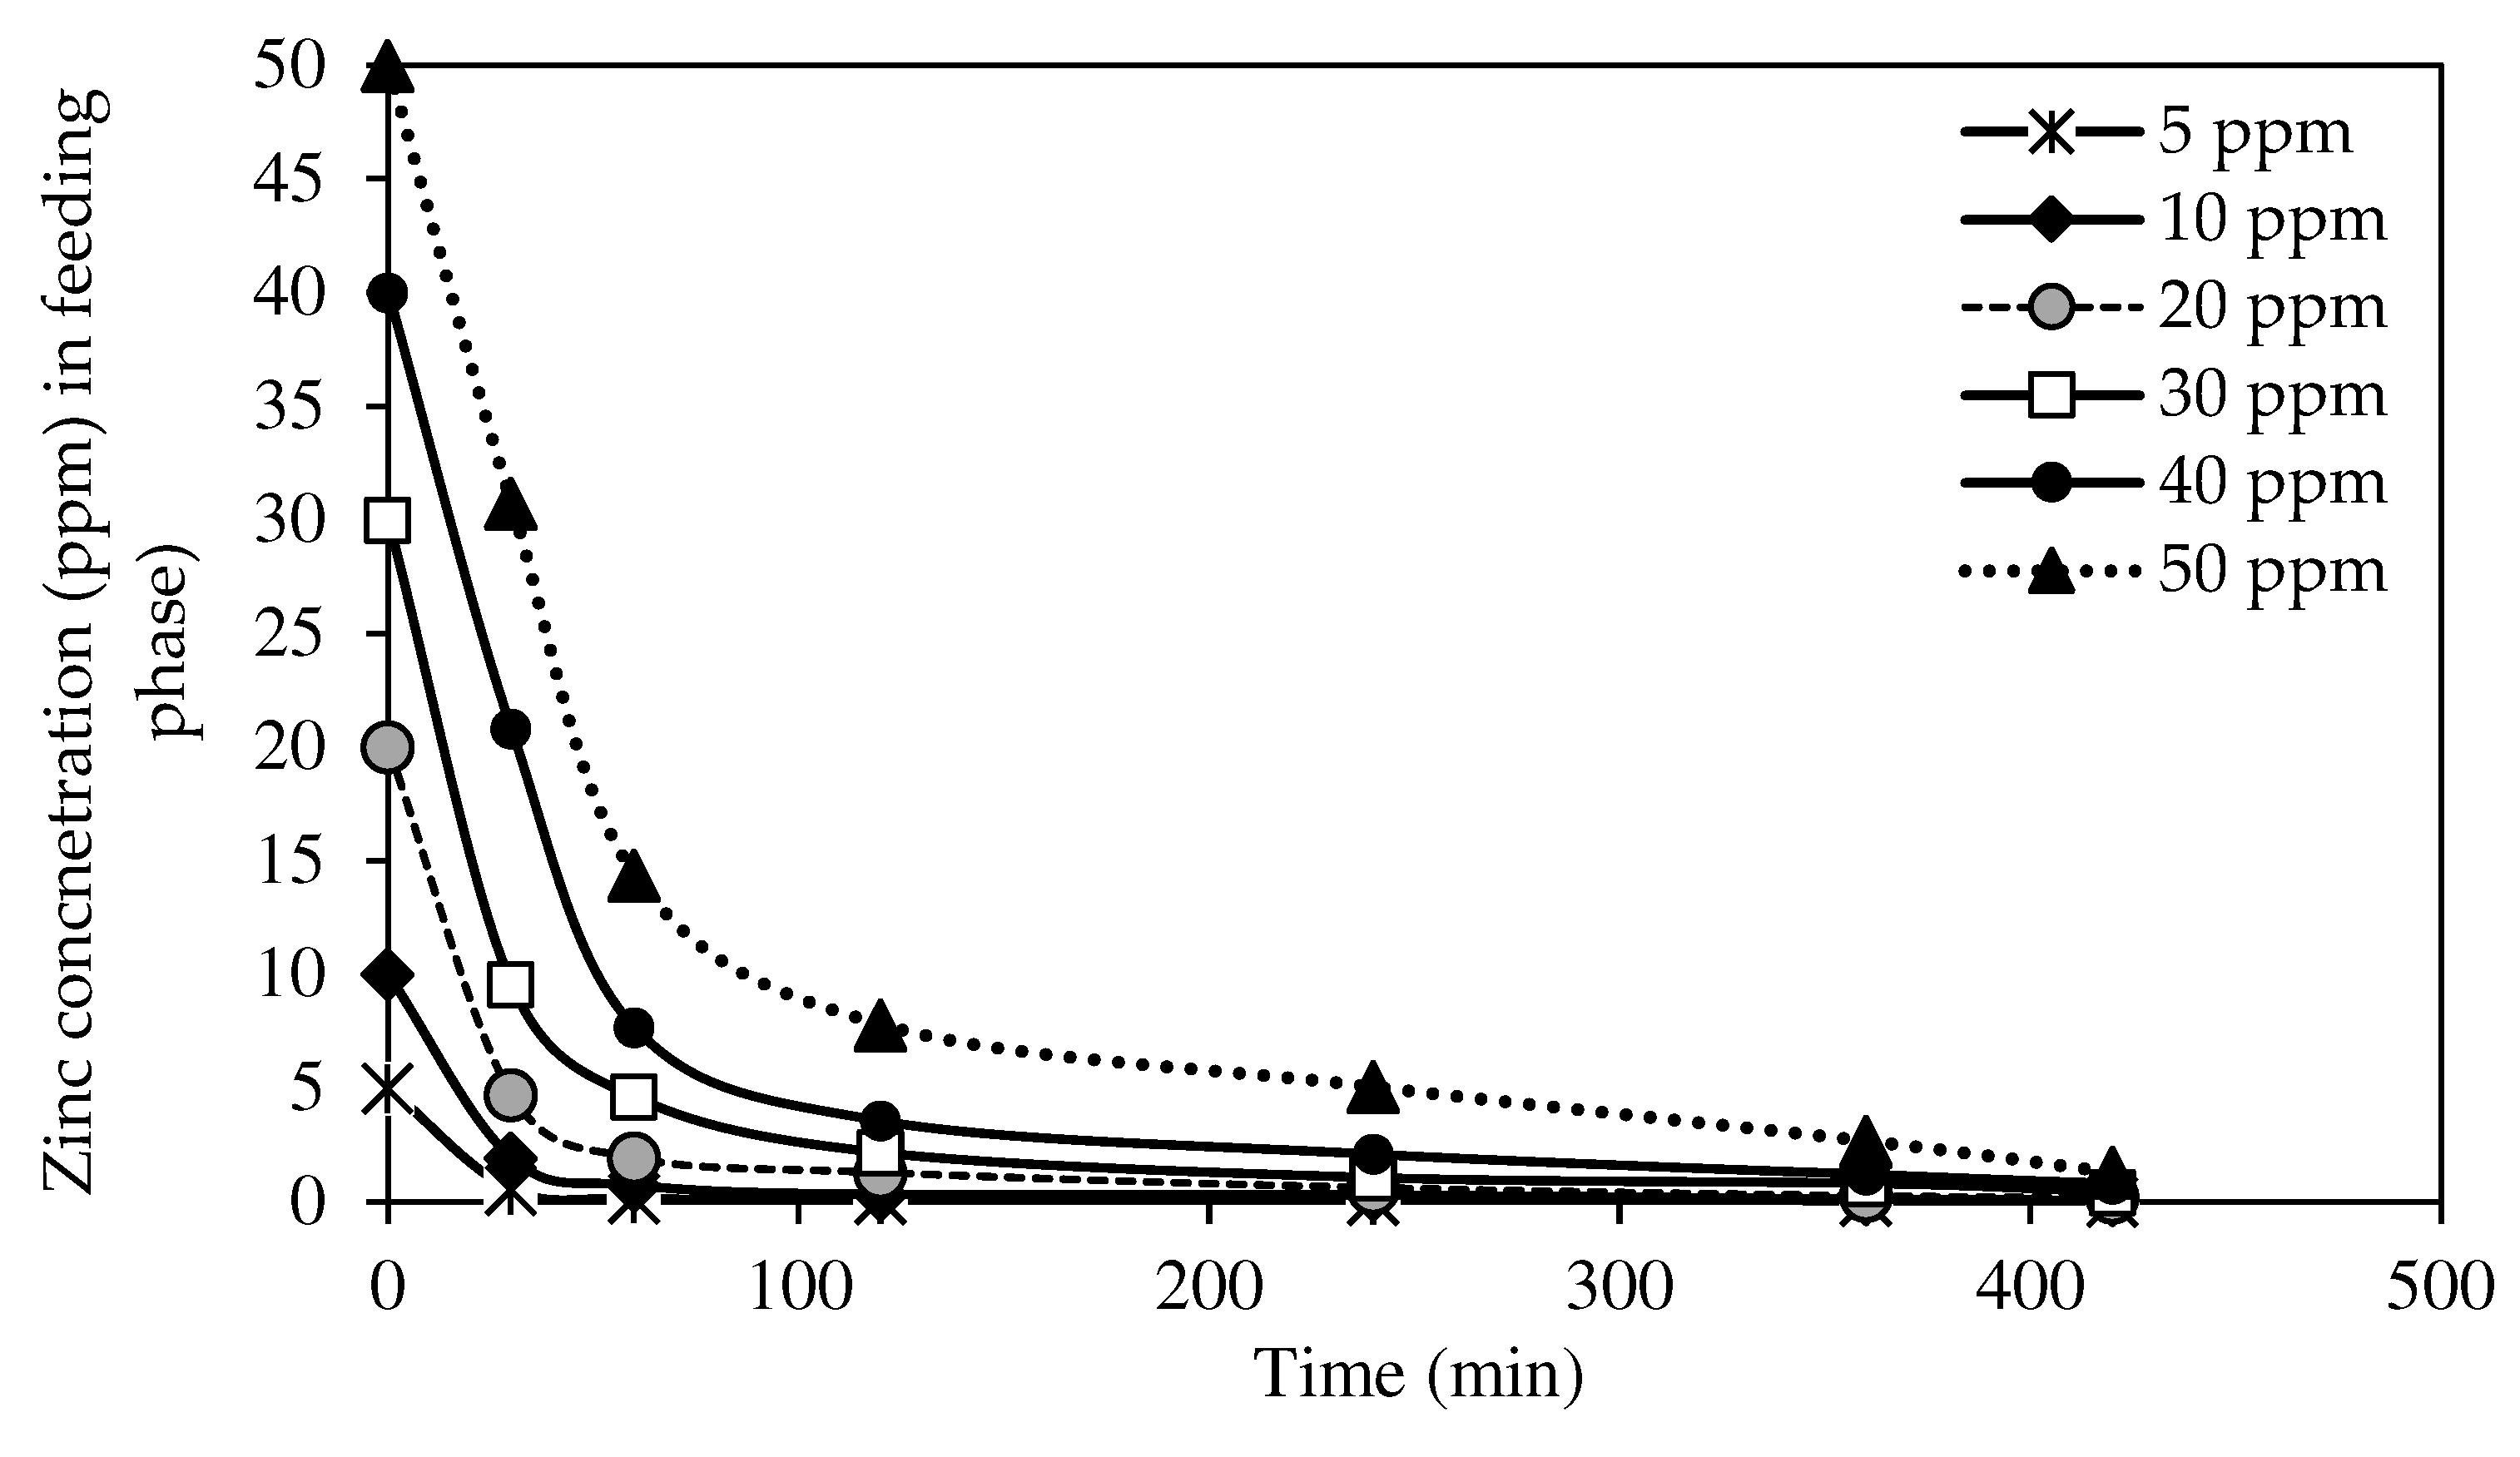
3.8. Kinetic Studies
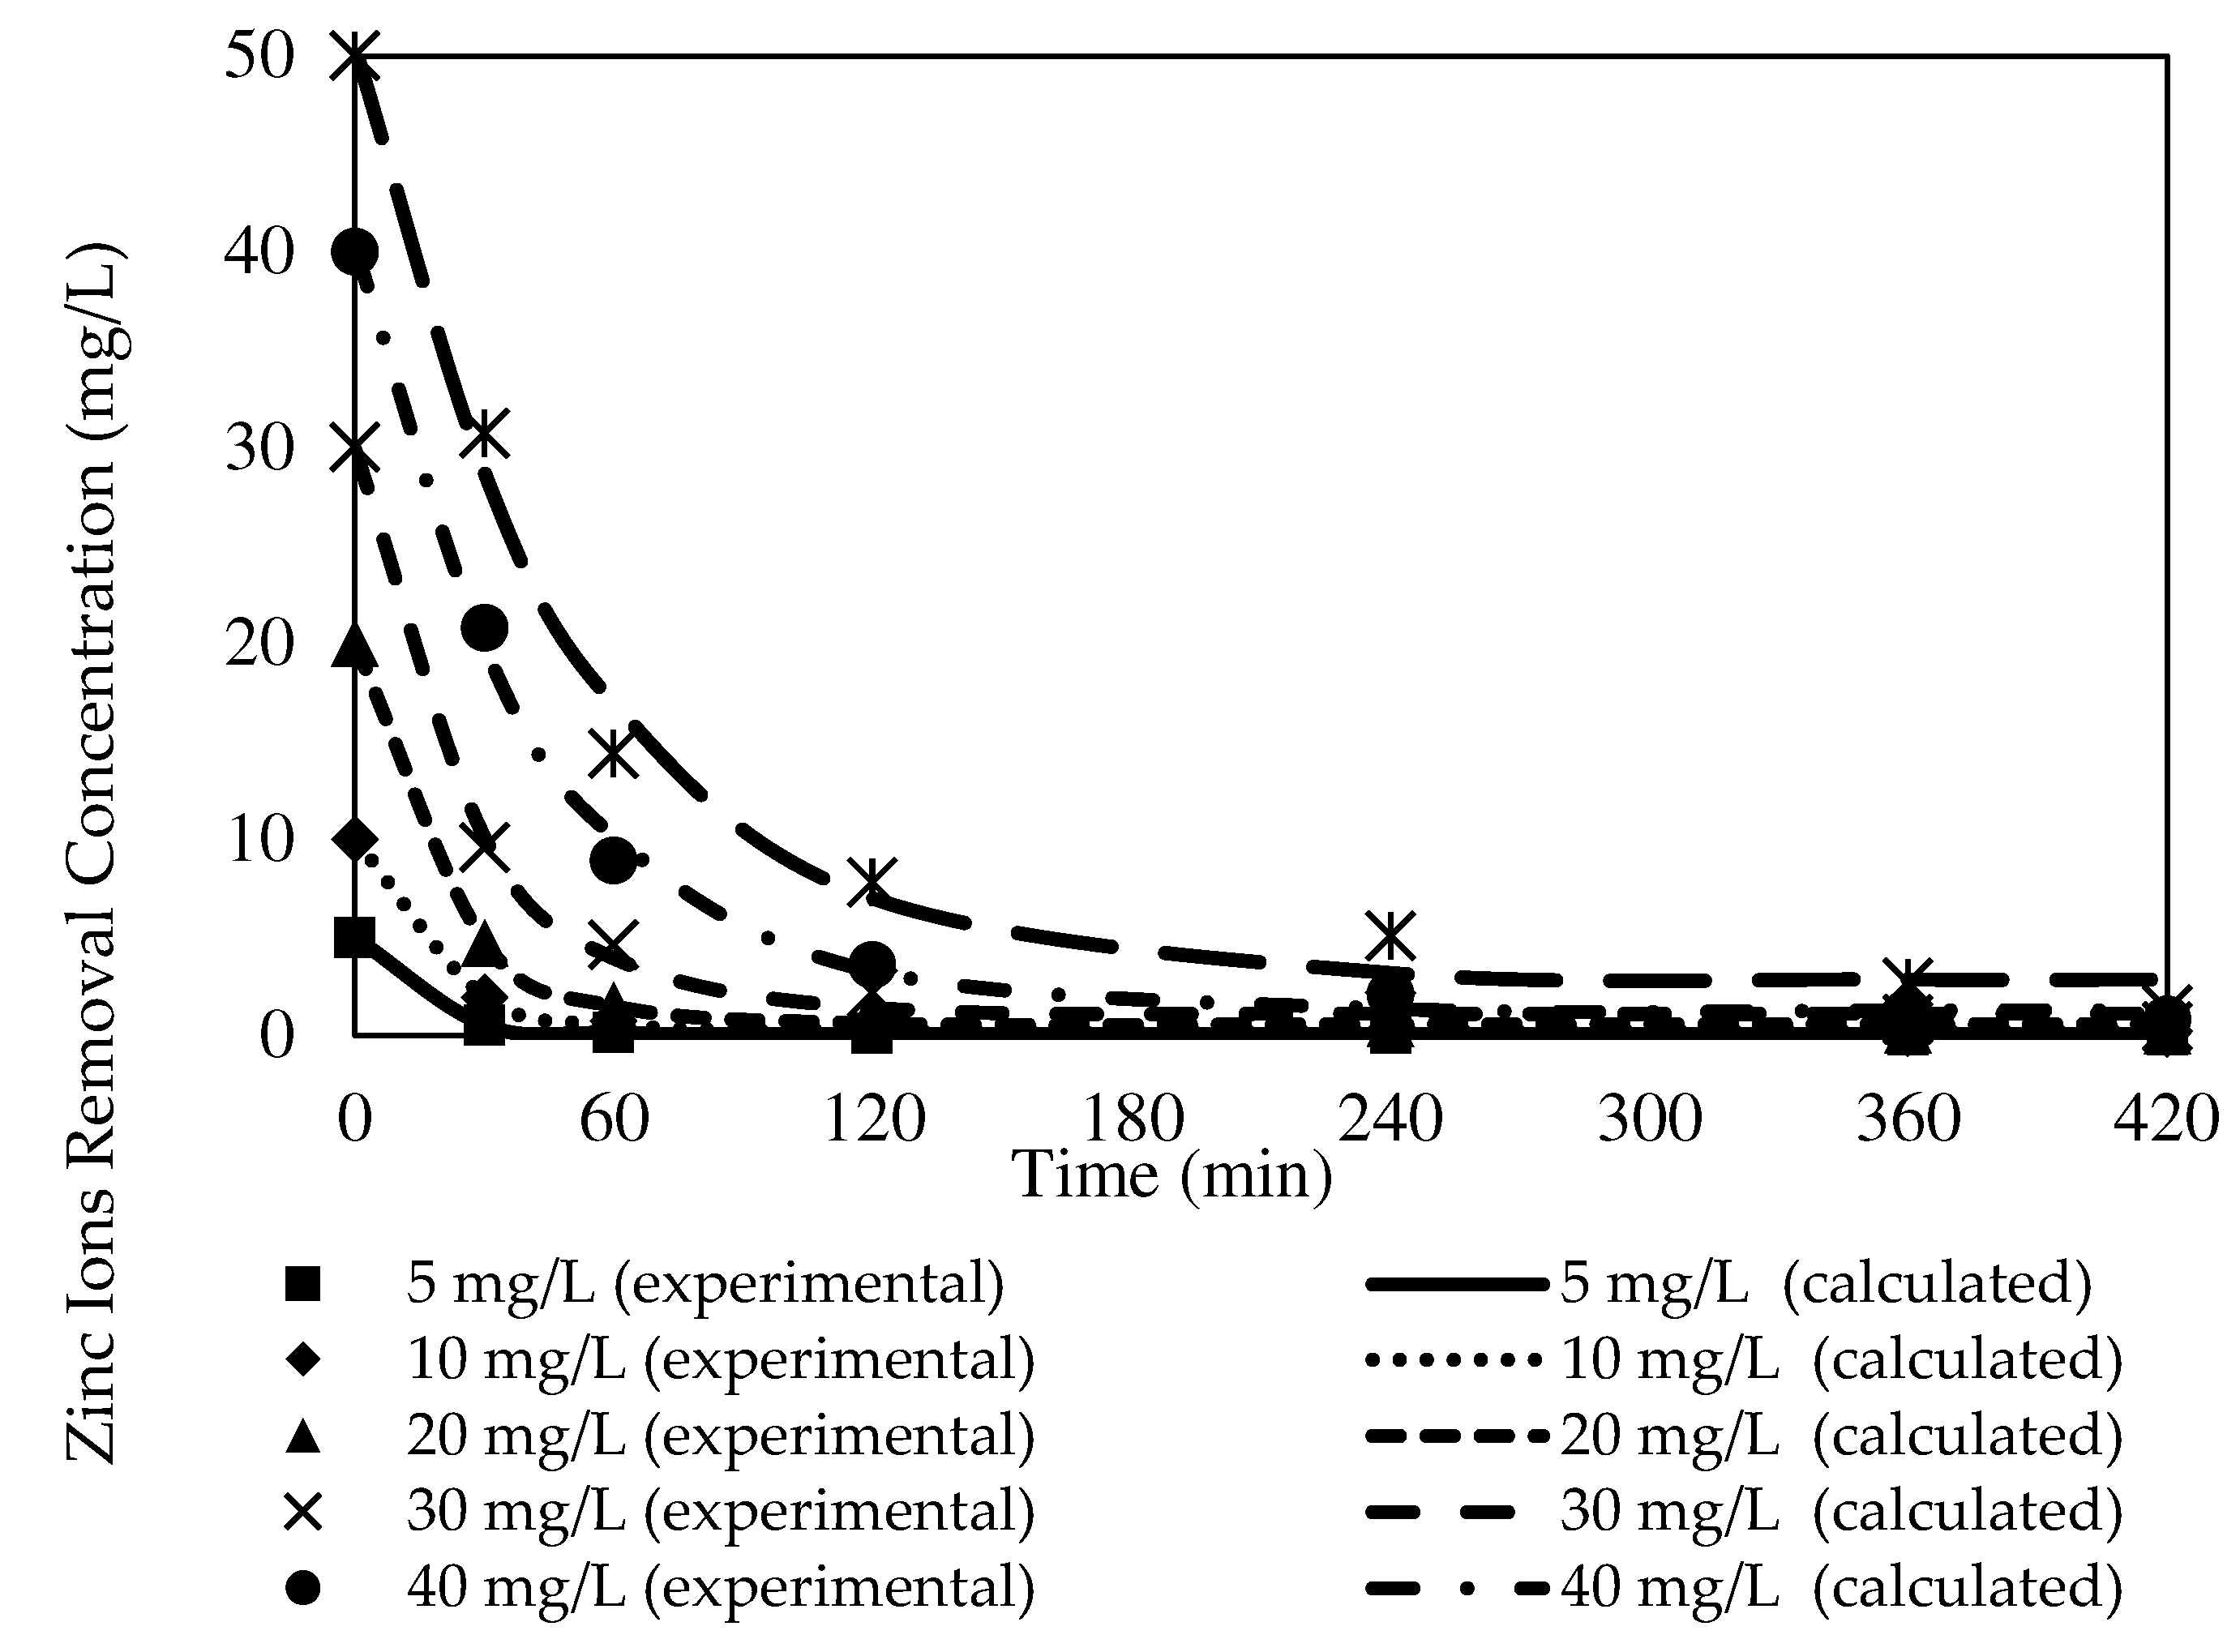
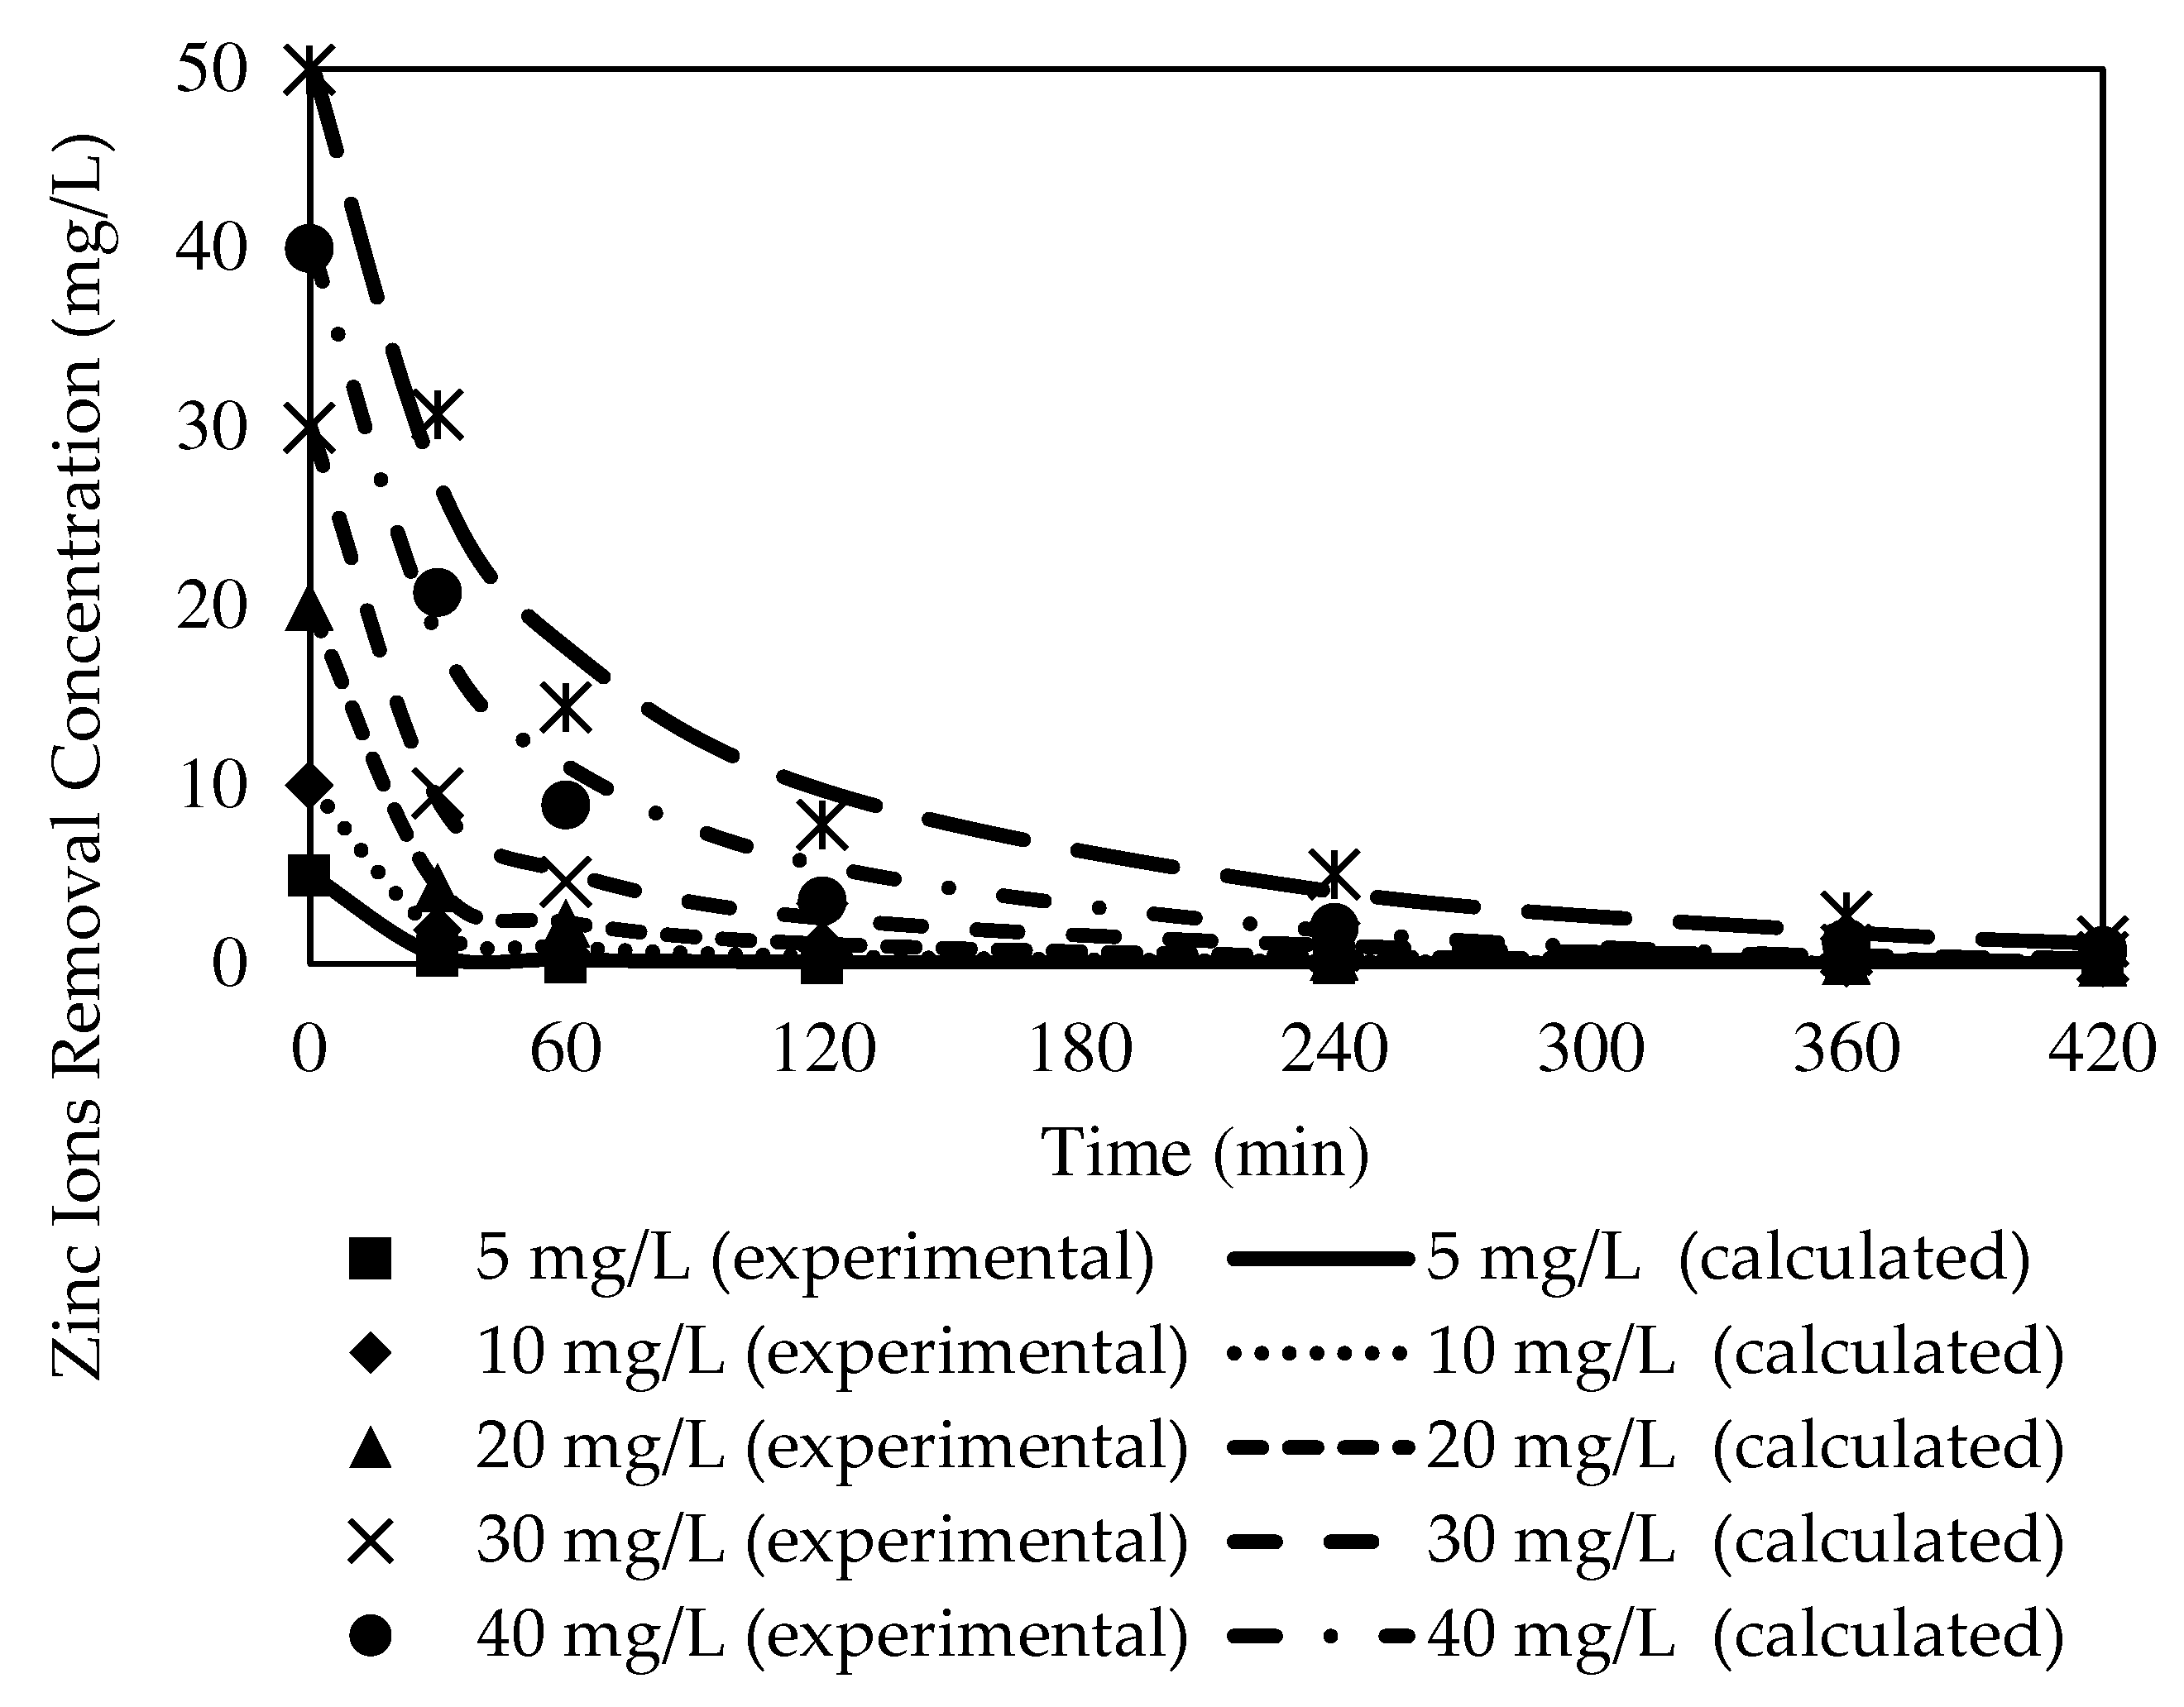
3.8.1. The Effects of Different Initial Feed Phase Concentrations on Zn2+ Removal with the W3 Membrane
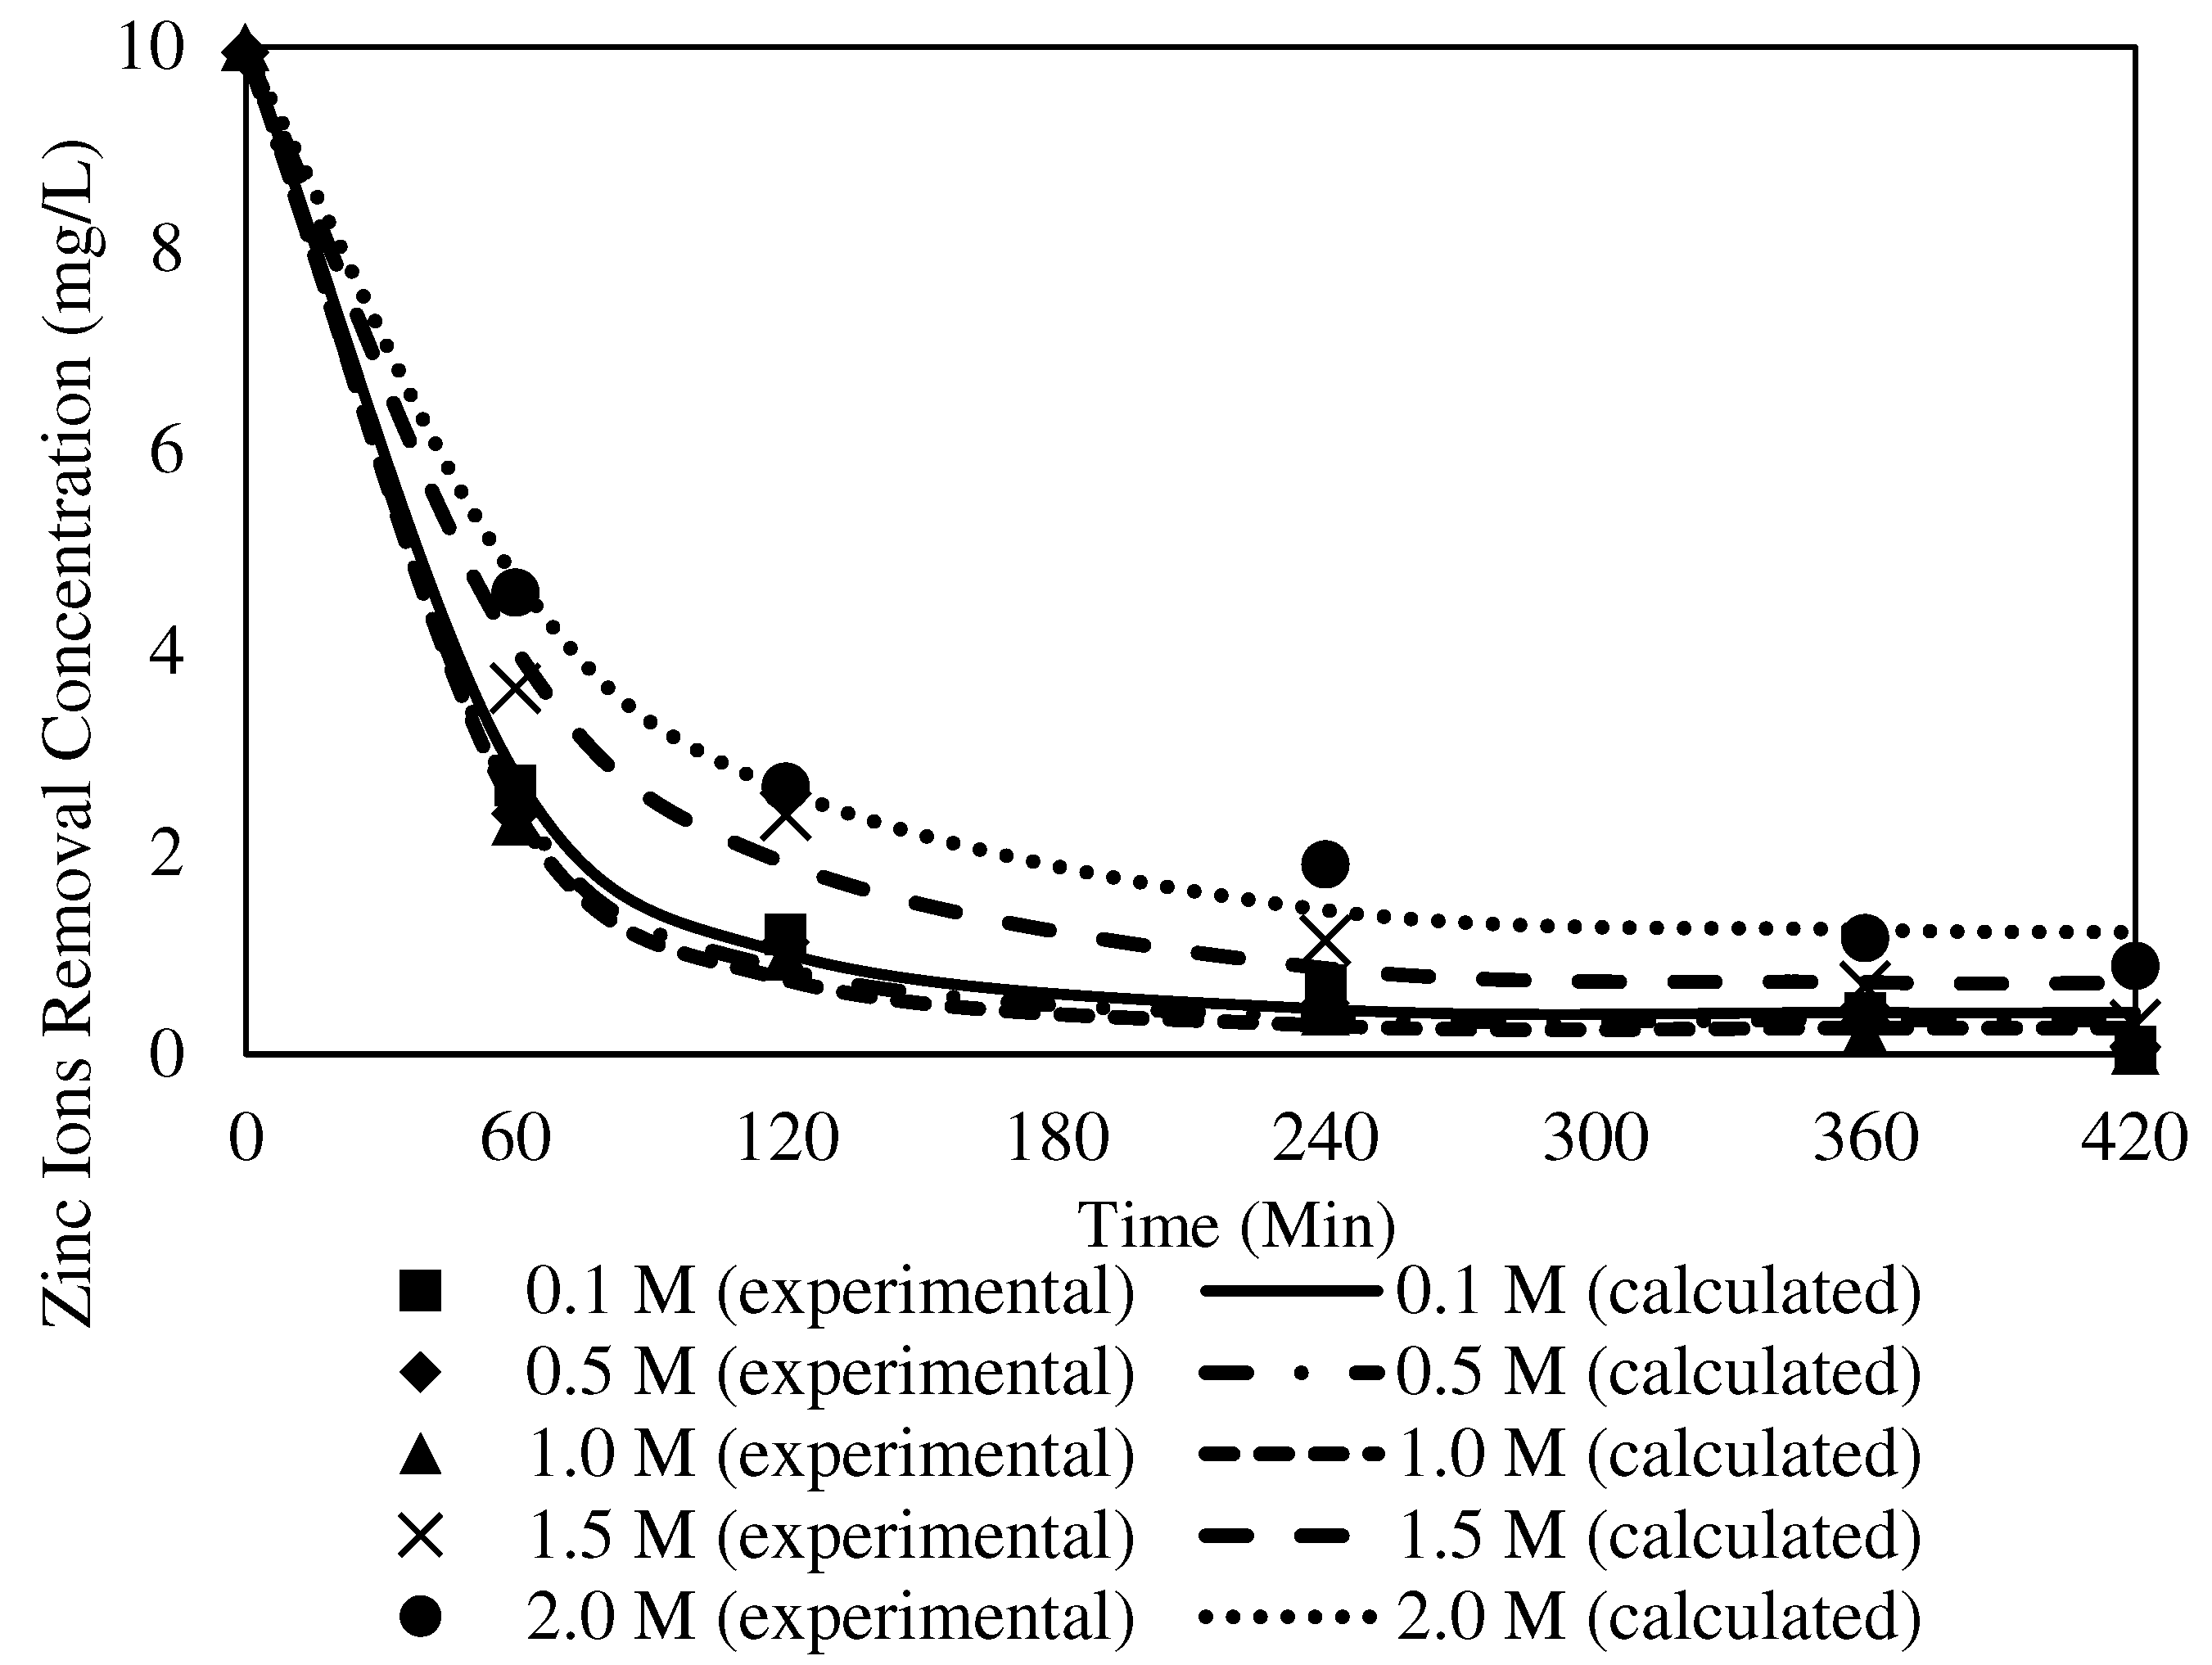
3.8.2. The Effects of Different Receiving Agent Concentrations with the W3 Membrane
3.9. Permeation Study on PIMs with Optimised Parameters
3.9.1. The Effects of Different Initial Concentrations
3.9.2. The Effects of Different Feed Phase Initial Concentrations with the W3 Membrane
4. Conclusions
Author Contributions
Funding
Institutional Review Board Statement
Data Availability Statement
Acknowledgments
Conflicts of Interest
References
- Chiu, H.C.; Liu, C. Removal of zinc(II) from aqueous solution by purified carbon nanotubes: Kinetics and equilibrium studies. Ind. Eng. Chem. Res. 2006, 45, 2850–2855. [Google Scholar]
- Jjagwe, J.; Olupot, P.W.; Menya, E.; Kalibbala, H.M. Synthesis and Application of Granular Activated Carbon from Biomass Waste Materials for Water Treatment: A Review. J. Bioresour. Bioprod. 2021, 6, 292–322. [Google Scholar] [CrossRef]
- Saad, E.M.; Elshaarawy, R.F.; Mahmoud, S.A.; El-Moselhy, K.M. New Ulva lactuca Algae Based Chitosan Bio-composites for Bioremediation of Cd(II) Ions. J. Bioresour. Bioprod. 2021, 6, 223–242. [Google Scholar] [CrossRef]
- Anticó, E.; Vera, R.; Vázquez, F.; Fontàs, C.; Lu, C.; Ros, J. Preparation and characterisation of nanoparticle-doped polymer inclusion membranes: Application to the removal of arsenate and phosphate from waters. Materials 2021, 14, 878. [Google Scholar] [CrossRef]
- Bonggotgetsakul, Y.Y.N.; Cattrall, R.W.; Kolev, S.D. Extraction of Gold(III) from Hydrochloric Acid Solutions with a PVC-based Polymer Inclusion Membrane (PIM) Containing Cyphos® IL 104. Membranes 2015, 5, 903–914. [Google Scholar] [CrossRef] [Green Version]
- Witt, K.; Radzymińska-Lenarcik, E.; Kosciuszko, A.; Gierszewska, M.; Ziuziakowski, K. The Influence of the Morphology and Mechanical Properties of Polymer Inclusion Membranes (PIMs) on Zinc Ion Separation from Aqueous Solutions. Polymers 2018, 10, 134. [Google Scholar] [CrossRef] [Green Version]
- Pereira, N.; John, A.S.; Cattrall, R.W.; Perera, J.M.; Kolev, S.D. Influence of the composition of polymer inclusion membranes on their homogeneity and flexibility. Desalination 2009, 236, 327–333. [Google Scholar] [CrossRef]
- Kebiche-Senhadji, O.; Mansouri, L.; Tingry, S.; Seta, P.; Benamor, M. Facilitated Cd(II) transport across CTA polymer inclusion membrane using anion (Aliquat 336) and cation (D2EHPA) metal carriers. J. Membr. Sci. 2008, 310, 438–445. [Google Scholar] [CrossRef]
- Nghiem, L.; Mornane, P.; Potter, I.; Perera, J.; Cattrall, R.; Kolev, S. Extraction and transport of metal ions and small organic compounds using polymer inclusion membranes (PIMs). J. Membr. Sci. 2006, 281, 7–41. [Google Scholar] [CrossRef]
- Sellami, F.; Kebiche-Senhadji, O.; Marais, S.; Couvrat, N.; Fatyeyeva, K. Polymer inclusion membranes based on CTA/PBAT blend containing Aliquat 336 as extractant for removal of Cr(VI): Efficiency, stability and selectivity. React. Funct. Polym. 2019, 139, 120–132. [Google Scholar] [CrossRef]
- Yıldız, Y.; Manzak, A.; Tutkun, O.; Yildiz, Y. Selective extraction of cobalt ions through polymer inclusion membrane containing Aliquat 336 as a carrier. Desalination Water Treat. 2014, 57, 4616–4623. [Google Scholar] [CrossRef]
- Baczyńska, M.; Rzelewska, M.; Regel-Rosocka, M.; Wiśniewski, M. Transport of iron ions from chloride solutions using cellulose triacetate matrix inclusion membranes with an ionic liquid carrier. Chem. Pap. 2015, 70, 8. [Google Scholar] [CrossRef]
- Kaya, A.; Onac, C.; Alpoguz, H.K.; Yilmaz, A.; Atar, N. Removal of Cr(VI) through calixarene based polymer inclusion membrane from chrome plating bath water. Chem. Eng. J. 2016, 283, 141–149. [Google Scholar] [CrossRef]
- Radzyminska-Lenarcik, E.; Ulewicz, M. The Application of Polymer Inclusion Membranes Based on CTA with 1-alkylimidazole for the Separation of Zinc(II) and Manganese(II) Ions from Aqueous Solutions. Polymers 2019, 11, 242. [Google Scholar] [CrossRef] [Green Version]
- Ling, Y.Y.; Suah, F.B.M. Extraction of malachite green from wastewater by using polymer inclusion membrane. J. Environ. Chem. Eng. 2017, 5, 785–794. [Google Scholar] [CrossRef]
- Suah, F.B.M.; Roslan, N.A.; Dahlan, N.F.; Mohamed, N. A Use of Polymer Inclusion Membrane as Anion Exchange Membrane for Recovery of Cu(II) Ions Based on an Electrogenerative System. J. Electrochem. Soc. 2018, 165, H310–H315. [Google Scholar] [CrossRef]
- Abdul-Halim, N.S.; Shoparwe, N.F.; Weng, S.K.; Zulkefeli, N.S.W. Heavy metal ions adsorption from CTA-aliquat 336 polymer inclusion membranes (PIMs): Experimental and kinetic study. AIP Conf. Proc. 2019, 2124, 020014. [Google Scholar]
- Witt, K.; Radzyminska-Lenarcik, E.; Urbaniak, W. Selective transport of zinc ions through novel polymer inclusion membranes (PIMS) containing β-diketone derivatives as carrier reagents. Sep. Sci. Technol. 2016, 51, 2620–2627. [Google Scholar] [CrossRef]
- Guo, L.; Liu, Y.; Zhang, C.; Chen, J. Preparation of PVDF-based polymer inclusion membrane using ionic liquid plasticiser and Cyphos IL 104 carrier for Cr(VI) transport. J. Membr. Sci. 2011, 372, 314–321. [Google Scholar] [CrossRef]
- Cai, C.; Yang, F.; Zhao, Z.; Liao, Q.; Bai, R.; Guo, W.; Chen, P.; Zhang, Y.; Zhang, H. Promising transport and high-selective separation of Li(I) from Na(I) and K(I) by a functional polymer inclusion membrane (PIM) system. J. Membr. Sci. 2019, 579, 1–10. [Google Scholar] [CrossRef]
- Yoshida, W.; Baba, Y.; Kubota, F.; Kolev, S.D.; Goto, M. Selective transport of scandium(III) across polymer inclusion membranes with improved stability which contain an amic acid carrier. J. Membr. Sci. 2018, 572, 291–299. [Google Scholar] [CrossRef]
- Khalid, A.; Ibrahim, A.; Al-Hamouz, O.C.S.; Laoui, T.; Benamor, A.; Atieh, M.A. Fabrication of polysulfone nanocomposite membranes with silver-doped carbon nanotubes and their antifouling performance. J. Appl. Polym. Sci. 2017, 134, 1–12. [Google Scholar] [CrossRef]
- Hosseini, S.M.; Madaeni, S.S.; Khodabakhshi, A.R. Preparation and characterisation of PC/SBR heterogeneous cation exchange membrane filled with carbon nanotubes. J. Membr. Sci. 2010, 362, 550–559. [Google Scholar] [CrossRef]
- Kogure, M.; Ohya, H.; Paterson, R.; Hosaka, M.; Kim, J.-J.; McFadzean, S. Properties of new inorganic membranes prepared by metal alkoxide methods Part II: New inorganic-organic anion-exchange membranes prepared by the modified metal alkoxide methods with silane coupling agents. J. Membr. Sci. 1997, 126, 161–169. [Google Scholar] [CrossRef]
- Liao, S.H.; Weng, C.C.; Yen, C.Y.; Hsiao, M.C.; Ma, C.C.M.; Tsai, M.C.; Su, A.; Yen, M.Y.; Lin, Y.F.; Liu, P.L. Preparation and properties of functionalised multi-walled carbon nanotubes/polypropylene nanocomposite bipolar plates for polymer electrolyte membrane fuel cells. J. Power Sources 2010, 195, 263–270. [Google Scholar] [CrossRef]
- Mansourpanah, Y.; Madaeni, S.; Rahimpour, A.; Farhadian, A.; Taheri, A. Formation of appropriate sites on nanofiltration membrane surface for binding TiO2 photo-catalyst: Performance, characterization and fouling-resistant capability. J. Membr. Sci. 2009, 330, 297–306. [Google Scholar] [CrossRef]
- Ohya, H.; Masaoka, K.; Aihara, M.; Negishi, Y. Properties of new inorganic membranes prepared by metal alkoxide methods. Part III: New inorganic lithium permselective ion exchange membrane. J. Membr. Sci. 1998, 146, 9–13. [Google Scholar] [CrossRef]
- Thomassin, J.-M.; Kollar, J.; Caldarella, G.; Germain, A.; Jérôme, R.; Detrembleur, C. Beneficial effect of carbon nanotubes on the performances of Nafion membranes in fuel cell applications. J. Membr. Sci. 2007, 303, 252–257. [Google Scholar] [CrossRef] [Green Version]
- Xu, T. Ion exchange membranes: State of their development and perspective. J. Membr. Sci. 2005, 263, 1–29. [Google Scholar] [CrossRef]
- Iijima, S. Helical microtubules of graphitic carbon. Nature 1991, 354, 56–58. [Google Scholar] [CrossRef]
- Afzali, D.; Mostafavi, A. Potential of modified multi-walled carbon nanotubes with 1-(2-pyridylazo)-2-naphtol as a new solid sorbent for the pre-concentration of trace amounts of cobalt(II) ion. Anal. Sci. 2008, 24, 1135–1139. [Google Scholar] [CrossRef] [PubMed] [Green Version]
- Tuzen, M.; Saygi, K.O.; Usta, C.; Soylak, M. Pseudomonas aeruginosa immobilised multi-walled carbon nanotubes as biosorbent for heavy metal ions. Bioresour. Technol. 2008, 99, 1563–1570. [Google Scholar] [CrossRef] [PubMed]
- Ali, S.; Rehman, S.A.U.; Shah, I.A.; Farid, M.U.; An, A.K.; Huang, H. Efficient removal of zinc from water and wastewater effluents by hydroxylated and carboxylated carbon nanotube membranes: Behaviors and mechanisms of dynamic filtration. J. Hazard. Mater. 2018, 365, 64–73. [Google Scholar] [CrossRef] [PubMed]
- Sarkar, B.; Mandal, S.; Tsang, Y.F.; Kumar, P.; Kim, K.-H.; Ok, Y.S. Designer carbon nanotubes for contaminant removal in water and wastewater: A critical review. Sci. Total Environ. 2018, 612, 561–581. [Google Scholar] [CrossRef]
- Low, L.W.; Teng, T.T.; Ahmad, A.; Morad, N.; Wong, Y.S. A Novel Pretreatment Method of Lignocellulosic Material as Adsorbent and Kinetic Study of Dye Waste Adsorption. Water Air Soil Pollut. 2011, 218, 293–306. [Google Scholar] [CrossRef]
- Klaysom, C.; Moon, S.-H.; Ladewig, B.P.; Lu, G.M.; Wang, L. Preparation of porous ion-exchange membranes (IEMs) and their characterisations. J. Membr. Sci. 2011, 371, 37–44. [Google Scholar] [CrossRef]
- Rosli, A.; Shoparwe, N.; Ahmad, A.; Low, S.; Lim, J. Dynamic modelling and experimental validation of CO2 removal using hydrophobic membrane contactor with different types of absorbent. Sep. Purif. Technol. 2019, 219, 230–240. [Google Scholar] [CrossRef]
- Guo, W.; Chen, S.; Feng, Y.; Yang, C. Investigations of Triphenyl Phosphate and Bis-(2-ethylhexyl) Phosphate Self-Assembled Films on Iron Surface Using Electrochemical Methods, Fourier Transform Infrared Spectroscopy, and Molecular Simulations. J. Phys. Chem. C 2007, 111, 3109–3115. [Google Scholar] [CrossRef]
- Jakriya, S.P.; Syed, A.M.; Pillai, S.K.; Rahim, D.B. High-performance poly(vinylidene fluoride-co-hexafluoropropylene) based electrospun polyelectrolyte mat for lithium-ion battery. Mater. Express 2018, 8, 77–84. [Google Scholar] [CrossRef]
- Singh, V.K.; Singh, R.K. Development of ion conducting polymer gel electrolyte membranes based on polymer PVdF-HFP, BMIMTFSI ionic liquid and the Li-salt with improved electrical, thermal and structural properties. J. Mater. Chem. C 2015, 3, 7305–7318. [Google Scholar]
- Zamri, S.N.A.M.; Masri, M.N. Fourier Transform Infrared Spectroscopy of Porous Zinc with Different Concentration of Potassium Hydroxidein Agar Binder. Int. J. Curr. Res. Sci. Eng. Technol. 2018, 1, 361–366. [Google Scholar] [CrossRef]
- Zuo, X.; Yu, S.; Xu, X.; Bao, R.; Xu, J.; Qu, W. Preparation of organic–inorganic hybrid cation-exchange membranes via blending method and their electrochemical characterisation. J. Membr. Sci. 2009, 328, 23–30. [Google Scholar] [CrossRef]
- Ahmad, A.L.; Farooqui, U.R.; Hamid, N.A. Porous (PVDF-HFP/PANI/GO) ternary hybrid polymer electrolyte membranes for lithium-ion batteries. RSC Adv. 2018, 8, 25725–25733. [Google Scholar] [CrossRef] [PubMed]
- Gunasegaran, M.; Ravi, S.; Shoparwe, N.F. Kinetic Studies of Reactive Orange 16 (RO16) Dye Removal from Aqueous Solution using PIMs. J. Phys. Conf. Ser. 2020, 1529, 052003. [Google Scholar] [CrossRef]
- Kozlowski, C.A. Facilitated transport of metal ions through composite and polymer inclusion membranes. Desalination 2006, 198, 132–140. [Google Scholar] [CrossRef]
- Mahendrakar, S.; Anna, M.; Kumar, J.S.; Reddy, J. Structural, Morphological and Electrical Studies of Plasticized Polymer-Salt Electrolyte membrane and Application to Lithium ion Batteries. Int. J. Appl. Chem. Vol. 2017, 13, 13. [Google Scholar]
- Haghighat, N.; Vatanpour, V. Fouling decline and retention increase of polyvinyl chloride nanofiltration membranes blended by polypyrrole functionalised multi-walled carbon nanotubes. Mater. Today Commun. 2020, 23, 100851. [Google Scholar] [CrossRef]
- Kaya, A.; Onac, C.; Alpoğuz, H.; Agarwal, S.; Gupta, V.K.; Atar, N.; Yilmaz, A. Reduced graphene oxide based a novel polymer inclusion membrane: Transport studies of Cr(VI). J. Mol. Liq. 2016, 219, 1124–1130. [Google Scholar] [CrossRef]
- Maiphetlho, K.; Shumbula, N.; Motsoane, N.; Chimuka, L.; Richards, H. Evaluation of silver nanocomposite polymer inclusion membranes (PIMs) for trace metal transports: Selectivity and stability studies. J. Water Process Eng. 2020, 37, 101527. [Google Scholar] [CrossRef]
- Cardoso, V.F.; Machado, A.R.; Pinto, V.C.; Sousa, P.J.; Botelho, G.; Minas, G.; Lanceros-Mendez, S. From superhydrophobic-to superhydrophilic-patterned poly (vinylidene fluoride-co-chlorotrifluoroethylene) architectures as a novel platform for biotechnological applications. J. Polym. Sci. Part B Polym. Phys. 2016, 54, 1802–1810. [Google Scholar] [CrossRef]
- Simpson, J.T.; Hunter, S.R.; Aytug, T. Superhydrophobic materials and coatings: A review. Rep. Prog. Phys. 2015, 78, 086501. [Google Scholar] [CrossRef] [PubMed]
- Khalid, A.; Al-Juhani, A.A.; Al-Hamouz, O.C.; Laoui, T.; Khan, Z.; Atieh, M.A. Preparation and properties of nanocomposite polysulfone/multi-walled carbon nanotubes membranes for desalination. Desalination 2015, 367, 134–144. [Google Scholar] [CrossRef]
- Vatanpour, V.; Madaeni, S.S.; Moradian, R.; Zinadini, S.; Astinchap, B. Fabrication and characterisation of novel antifouling nanofiltration membrane prepared from oxidised multi-walled carbon nanotube/polyethersulfone nanocomposite. J. Membr. Sci. 2011, 375, 284–294. [Google Scholar] [CrossRef]
- Pang, J.; Zhang, H.; Li, X.; Ren, D.; Jiang, Z. Low Water Swelling and High Proton Conducting Sulfonated Poly (arylene ether) with Pendant Sulfoalkyl Groups for Proton Exchange Membranes. Macromol. Rapid Commun. 2007, 28, 2332–2338. [Google Scholar] [CrossRef]
- Jyothi, M.; Nayak, V.; Padaki, M.; Balakrishna, R.G.; Soontarapa, K. Aminated polysulfone/TiO2 composite membranes for an effective removal of Cr(VI). Chem. Eng. J. 2016, 283, 1494–1505. [Google Scholar] [CrossRef]
- Shah, P.; Murthy, C. Studies on the porosity control of MWCNT/polysulfone composite membrane and its effect on metal removal. J. Membr. Sci. 2013, 437, 90–98. [Google Scholar] [CrossRef]
- Hołda, A.K.; Vankelecom, I.F. Understanding and guiding the phase inversion process for synthesis of solvent resistant nanofiltration membranes. J. Appl. Polym. Sci. 2015, 132, 42130. [Google Scholar] [CrossRef]
- Yakout, S.M. Effect of porosity and surface chemistry on the adsorption-desorption of uranium(VI) from aqueous solution and groundwater. J. Radioanal. Nucl. Chem. Artic. 2016, 308, 555–565. [Google Scholar] [CrossRef]
- Chakrabarti, R.; Das, M.; Chakraborty, D. Physical, mechanical, and thermal properties of PVC/PMMA blends in relation to their morphologies. J. Appl. Polym. Sci. 2004, 93, 2721–2730. [Google Scholar] [CrossRef]
- Sadiq, A.J.; Shabeeb, K.M.; Khalil, B.I.; Alsalhy, Q.F. Effect of embedding MWCNT-g-GO with PVC on the performance of PVC membranes for oily wastewater treatment. Chem. Eng. Commun. 2020, 207, 733–750. [Google Scholar] [CrossRef]
- Rohatgi, C.V.; Dutta, N.K.; Choudhury, N.R. Separator Membrane from Crosslinked Poly(Vinyl Alcohol) and Poly(Methyl Vinyl Ether-alt-Maleic Anhydride). Nanomaterials 2015, 5, 398–414. [Google Scholar] [CrossRef] [PubMed]
- Halim, N.S.A.; Whitten, P.G.; Nghiem, L.D. Characteristics and cadmium extraction performance of PVC/Aliquat 336 electrospun fibres in comparison with polymer inclusion membranes. Sep. Sci. Technol. 2016, 51, 1515–1522. [Google Scholar]
- Zheng, J.; Yan, B.; Feng, L.; Zhang, Q.; Zhang, C.; Yang, W.; Han, J.; Jiang, S.; He, S. Potassium citrate assisted synthesis of hierarchical porous carbon materials for high performance supercapacitors. Diam. Relat. Mater. 2022, 128, 109247. [Google Scholar] [CrossRef]
- Bonastre, J.; Molina, J.; Galvan, J.C.; Cases, F. Characterisation of polypyrrole/phosphotungstate membranes by electrochemical impedance spectroscopy. Synth. Met. 2014, 187, 37–45. [Google Scholar] [CrossRef] [Green Version]
- Kavitha, N.; Palanivelu, K. Recovery of copper(II) through polymer inclusion membrane with di (2-ethylhexyl) phosphoric acid as carrier from e-waste. J. Membr. Sci. 2012, 415–416, 663–669. [Google Scholar] [CrossRef]
- Zawierucha, I.; Nowik-Zajac, A.; Kozlowski, C.A. Removal of Pb(II) Ions Using Polymer Inclusion Membranes Containing Calix[4]resorcinarene Derivative as Ion Carrier. Polymers 2019, 11, 2111. [Google Scholar] [CrossRef] [Green Version]
- Shoparwe, N.F.; Ahmad, A.L.; Ahmad, N.A.; Mohamad, H.M.S.Z. Fabrication, characterisation and electrochemical properties of heterogeneous multi-walled carbon nanotubes cation exchange membranes (MWCNT-CEMs). J. Phys. Sci. 2018, 29, 41–48. [Google Scholar] [CrossRef] [Green Version]
- John, A.M.S.; Cattrall, R.W.; Kolev, S.D. Transport and separation of uranium(VI) by a polymer inclusion membrane based on di-(2-ethylhexyl) phosphoric acid. J. Membr. Sci. 2012, 409–410, 242–250. [Google Scholar] [CrossRef]
- Motsoane, N.M. Development and Application of Passive Samplers Based on Polymer Inclusion Membranes for Evaluating the Fate of Trace Metals Polluted by Acid Mine Drainage. Ph.D. Theis, The University of Melbourne, Melbourne, Australia, 2016. [Google Scholar]
- Ihsanullah. Carbon nanotube membranes for water purification: Developments, challenges, and prospects for the future. In Separation and Purification Technology; Elsvier: Riyadh, Saudi Arabia, 2019; Volume 209. [Google Scholar]
- Zhou, R.; Rana, D.; Matsuura, T.; Lan, C.Q. Effects of multi-walled carbon nanotubes (MWCNTs) and integrated MWCNTs/SiO2 nano-additives on PVDF polymeric membranes for vacuum membrane distillation. Sep. Purif. Technol. 2019, 217, 154–163. [Google Scholar] [CrossRef]
- Hosseini, S.M.; Madaeni, S.S.; Khodabakhshi, A.R. Preparation and characterisation of ABS/HIPS heterogeneous anion exchange membrane filled with activated carbon. J. Appl. Polym. Sci. 2010, 118, 3371–3383. [Google Scholar] [CrossRef]
- Nagarale, R.K.; Gohil, G.S.; Shahi, V.K.; Rangarajan, R. Preparation and electrochemical characterisations of cation-exchange membranes with different functional groups. Colloids Surf. A Physicochem. Eng. Asp. 2004, 251, 133–140. [Google Scholar] [CrossRef]
- Králik, M. Adsorption, chemisorption, and catalysis. Chem. Pap. 2015, 68, 1625–1638. [Google Scholar] [CrossRef]
- Alguacil, F.; Alonso, M.; Sastre, A. Modelling of mass transfer in facilitated supported liquid membrane transport of copper(II) using MOC-55 TD in Iberfluid. J. Membr. Sci. 2001, 184, 117–122. [Google Scholar] [CrossRef]
- Yilmaz, E.; Soylak, M. Solid phase extraction of Cd, Pb, Ni, Cu, and Zn in environmental samples on multi-walled carbon nanotubes. Environ. Monit. Assess. 2014, 186, 5461–5468. [Google Scholar] [CrossRef]


| Base Polymer | Plasticiser | Solvent | Carrier | Target Analytes | Removal Efficiency | References |
|---|---|---|---|---|---|---|
| CTA | 2-NPPE | TBP | Aliquat 336 | Co(II) | 100% | [11] |
| CTA | NPOE | DCM | Cyphos IL 104 | Fe(III) | 89.6% | [12] |
| CTA | PBAT | - | Aliquat 336 | Cr(IV) | >99.0% | [10] |
| CTA | 2-NPOE | - | Calix [4]arene | Cr(IV) | 97.69% | [13] |
| CTA | o-NPPE | - | 1-decyl-imidazole | Zn(II) | 92.5% | [14] |
| PVC | - | THF | Alqiuat 336 | Thiocyanate | 99% | [6] |
| PVC | DOP | THF | B2EHPA | Malachite Green (MG) | 96% | [15] |
| PVC | DOP | THF | Aliquat 336 | Cu(II) | 99.9% | [16] |
| PVC | - | THF | Aliquat 336 | Cd(II) | 95.0% | [17] |
| PVC | ADO | - | 3-propylacetylacetone | Zn(II) | 93.0% | [18] |
| PVC | ILPs | - | Cyphos IL 104 | Cr(VI) | 99.5% | [19] |
| Batch Code | Membrane | PVC (wt%) | B2EHP (wt%) | DDOP (wt%) | THF (wt%) | MWCNT (wt%) |
|---|---|---|---|---|---|---|
| 0030 | W1 | 18 | 30 | 1 | 51.0 | 0.0 |
| 0530 | W2 | 18 | 30 | 1 | 51.0 | 0.5 |
| 1030 | W3 | 18 | 30 | 1 | 51.0 | 1.0 |
| 1530 | W4 | 18 | 30 | 1 | 51.0 | 1.5 |
| 2030 | W5 | 18 | 30 | 1 | 51.0 | 2.0 |
| Material | Wavenumber (cm−1) | Type of Molecular Vibration |
|---|---|---|
| Before Zn2+ removal | ||
| W1 (PVC 18%:B2EHP 30%:DOP %:THF 51%)-PIM | 2958.39–2929.20 2859.91 1716.99 1458.98 1227.90 1018.50 884.73–727.28 695.63–610.40 | Csp3-H Csp2-H C=O C–C P=O/O–C P–O C–H ‘oop’ C–Cl |
| W3 (MWCNT 1%:PVC 18%:B2EHP 30%:DOP %:THF 51%)-MM-PIM | 2958.30–2929.44 2860.00 1716.84 1458.70 1228.68 1018.20 884.11–727.00 692.40–611.34 | Csp3-H Csp2-H C=O C–C P=O/O–C P–O C–H ‘oop’ C–Cl |
| After Zn2+ removal | ||
| W1 (PVC 18%:B2EHP 30%:DOP %:THF 51%)-PIM | 2960.47–2929.89 2860.20 1716.75 1463.71 1258.63 1012.36 865.59–794.42 697.12–611.17 | Csp3-H Csp2-H C=O C–C P=O/O–C P–O C–H ‘oop’ C–Cl |
| W3 (MWCNT 1%:PVC 18%:B2EHP 30%:DOP %:THF 51%)-MM-PIM | 2960.34–2929.94 2860.15 1717.18 1425.55 1258.77 1012.86 868.65–795.90 695.51–611.45 | Csp3-H Csp2-H C=O C–C P=O/O–C P–O C–H ‘oop’ C–Cl |
| Membrane Sample | CA (°) | Water Uptake, U (%) | Porosity, ε(%) | Thickness (mm) | Ion Conductivity (mS cm−1) |
|---|---|---|---|---|---|
| W1 | 52.5 | 50.21 | 32.98 | 0.06 ± 0.01 | 4.62 × 10⁻⁹ |
| W2 | 51.6 | 47.26 | 28.77 | 0.08 ± 0.01 | 2.47 × 10⁻⁸ |
| W3 | 45.8 | 45.51 | 26.35 | 0.08 ± 0.01 | 7.86 × 10⁻⁸ |
| W4 | 43.5 | 41.04 | 20.12 | 0.09 ± 0.01 | 7.26 × 10⁻⁸ |
| W5 | 43.9 | 39.25 | 19.21 | 0.09 ± 0.01 | 8.41 × 10⁻⁹ |
| Initial Concentration (mg/L) | Ce | K1 | C0 | R2 | Variance |
|---|---|---|---|---|---|
| 5 | 0.0678 | 0.0788 | 4.9997 | 0.9996 | 0.0018 |
| 10 | 0.2167 | 0.0570 | 9.9942 | 0.9990 | 0.0195 |
| 20 | 0.5704 | 0.0512 | 19.9939 | 0.9979 | 0.1652 |
| 30 | 1.1074 | 0.0388 | 29.9100 | 0.9972 | 0.4803 |
| 40 | 1.2733 | 0.0247 | 40.2138 | 0.9974 | 0.8143 |
| 50 | 2.8219 | 0.0203 | 50.4390 | 0.9912 | 4.2980 |
| Initial Concentration (mg/L) | Ce | K1 | C0 | R2 | Variance |
|---|---|---|---|---|---|
| 5 | 0.0231 | 0.0599 | 5.0002 | 0.9993 | 0.0037 |
| 10 | 0.1270 | 0.0142 | 10.0025 | 0.9987 | 0.0256 |
| 20 | 0.2626 | 0.0057 | 20.0089 | 0.9973 | 0.2131 |
| 30 | 0.6751 | 0.0023 | 30.0244 | 0.9989 | 0.1928 |
| 40 | 2.7380 | 0.0008 | 40.3296 | 0.9869 | 4.1776 |
| 50 | 3.4251 | 0.0005 | 50.6057 | 0.9841 | 7.7936 |
| Receiving Agent Concentration (mg/L) | Ce | K1 | C0 | R2 | Variance |
|---|---|---|---|---|---|
| 0.1 | 0.2107 | 0.0233 | 10.0054 | 0.9969 | 0.0748 |
| 0.5 | 0.3413 | 0.0246 | 9.9347 | 0.9983 | 0.0656 |
| 1.0 | 0.6600 | 0.0251 | 9.9877 | 0.9991 | 0.0464 |
| 1.5 | 0.4957 | 0.0171 | 9.9660 | 0.9974 | 0.2127 |
| 2.0 | 0.1983 | 0.0152 | 9.9716 | 0.9960 | 0.1174 |
| Receiving Agent Concentration (mg/L) | Ce | K1 | C0 | R2 | Variance |
|---|---|---|---|---|---|
| 0.1 | 0.3610 | 0.0040 | 10.0219 | 0.9949 | 0.0258 |
| 0.5 | 0.3625 | 0.0045 | 9.9510 | 0.9982 | 0.0103 |
| 1.0 | 0.4282 | 0.0046 | 10.0017 | 0.9986 | 0.0100 |
| 1.5 | 0.2438 | 0.0024 | 10.0297 | 0.9976 | 0.0307 |
| 2.0 | 0.1788 | 0.0020 | 10.0146 | 0.9979 | 0.0413 |
| Initial Concentration (mg/L) | Permeability Coefficient (m s−1) | Flux(mol m−2 s−1) |
|---|---|---|
| 5 | 0.0167 | 0.0836 |
| 10 | 0.0121 | 0.1209 |
| 20 | 0.0109 | 0.2172 |
| 30 | 0.0082 | 0.2462 |
| 40 | 0.0052 | 0.2127 |
| 50 | 0.0043 | 0.2112 |
| Receiving Agent Concentration (M) | Permeability Coefficient (m s−1) | Flux(mol m−2 s−1) |
|---|---|---|
| 0.1 | 0.0049 | 0.0495 |
| 0.5 | 0.0052 | 0.0519 |
| 1.0 | 0.0053 | 0.0532 |
| 1.5 | 0.0036 | 0.0362 |
| 2.0 | 0.0032 | 0.0322 |
Publisher’s Note: MDPI stays neutral with regard to jurisdictional claims in published maps and institutional affiliations. |
© 2022 by the authors. Licensee MDPI, Basel, Switzerland. This article is an open access article distributed under the terms and conditions of the Creative Commons Attribution (CC BY) license (https://creativecommons.org/licenses/by/4.0/).
Share and Cite
Khalid, N.A.; Shoparwe, N.F.; Yusoff, A.H.; Sulaiman, A.Z.; Ahmad, A.L.; Azmi, N.A. Fabrication and Characterisation of MWCNT/Polyvinyl (PVC) Polymer Inclusion Membrane for Zinc (II) Ion Removal from Aqueous Solution. Membranes 2022, 12, 1020. https://doi.org/10.3390/membranes12101020
Khalid NA, Shoparwe NF, Yusoff AH, Sulaiman AZ, Ahmad AL, Azmi NA. Fabrication and Characterisation of MWCNT/Polyvinyl (PVC) Polymer Inclusion Membrane for Zinc (II) Ion Removal from Aqueous Solution. Membranes. 2022; 12(10):1020. https://doi.org/10.3390/membranes12101020
Chicago/Turabian StyleKhalid, Nadia Aqilah, Noor Fazliani Shoparwe, Abdul Hafidz Yusoff, Ahmad Ziad Sulaiman, Abdul Latif Ahmad, and Nur Aina Azmi. 2022. "Fabrication and Characterisation of MWCNT/Polyvinyl (PVC) Polymer Inclusion Membrane for Zinc (II) Ion Removal from Aqueous Solution" Membranes 12, no. 10: 1020. https://doi.org/10.3390/membranes12101020