Article

Separation of Soluble Benzene from an Aqueous Solution by Pervaporation Using a Commercial Polydimethylsiloxane Membrane

1
Membrane Technology Research Unit, Department of Chemical Engineering, University of Technology-Iraq, Alsinaa Street 52, Baghdad 10066, Iraq
2
Department of Chemical Engineering and Petroleum Industries, Al-Mustaqbal University College, Babylon 51001, Iraq
*
Author to whom correspondence should be addressed.
Membranes 2022, 12(11), 1040; https://doi.org/10.3390/membranes12111040
Submission received: 18 September 2022 / Revised: 14 October 2022 / Accepted: 18 October 2022 / Published: 25 October 2022
(This article belongs to the Special Issue Membrane Science towards Sustainable Development Goals (SDGs))

Abstract

:
A developed polydimethylsiloxane (PDMS) membrane was used to separate soluble benzene compounds (C6H6) from an aqueous solution via a pervaporation (PV) process. This membrane was characterized by scanning electron microscopy (SEM), Fourier-transform infrared (FTIR) spectroscopy, contact angle (CA), and energy-dispersive spectroscopy (EDS). To evaluate the performance of the membrane, the separation factor and permeation flux were estimated in various operating conditions, including the feed temperature, initial benzene concentration, and feed flow rate. The experiments to maximize the separation factor and permeation flux were designed using the response surface method (RSM) that is built into Minitab 18. A quadratic model (nonlinear regression equation) was suggested to obtain mathematical expressions to predict the benzene permeation flux and the separation factor according to the effect of the parameters’ interaction. The optimization of the PV was performed using an RSM that was based on the analysis of variance (ANOVA). The optimal values of the benzene permeation flux and separation factor were 6.7 g/m2·h and 39.8, respectively, at the optimal conditions of temperature (30 °C), initial concentration of benzene (1000 ppm), and feed flow rate (3.5 L/min). It was found that the feed concentration was the most influential parameter, leading to a significant increase in the permeation flux and separation factor of the PDMS membrane.

1. Introduction

By 2050, the world population is expected to increase by 40–50%, so there is increased interest in providing water suitable for human use [1]. However, preserving the environment and protecting aquatic life from pollution requires disposing of volatile organic compounds (VOCs) using modern, more effective, and less costly methods. Currently, many industrial applications involve the use of organic solvents in their technological processes in order to manufacture refrigerants, plastics, adhesives, paints, petroleum products, etc. [2,3,4,5,6,7]. In the presence of various industrial processes, thousands of cubic meters polluted with these carcinogenic VOCS are thrown into river waters, causing great danger to the environment and humans [8,9,10,11]. Usually, the solubility of VOCs in water is very low, which means that the concentrations of these substances in water are weak and environmentally dangerous. Fortunately, VOCs can be successfully treated using the PV process because it is sufficient for treating these pollutants without the need to use high-cost separation processes, such as distillation, oxidation, biological treatment, and adsorption [12]; these other processes are usually applied, regardless of their high energy demand or their ability to form azeotropes [11,13,14,15,16,17,18]. In contrast, employing the PV process to rid pollutants from industrial water is characterized by being low-cost, having no emission problems, and not requiring expensive regeneration steps [13,14,15,19] as well as using compact/modular designs and allowing for the possible reuse of the recovered VOC solvents [12]. Many researchers have used the PV process for treating water polluted by VOCs under various operating conditions and with different membranes. He et al. used PDMS with lotus leaf powder mixed-matrix membranes (MMMs) and poly(divinylbenzene) (PDVB)-coated PDMS composite membranes to recover ethanol from water [20]. Hamouni et al. prepared PDMS membranes to remove ethanol, toluene, and propanol from water [21], while Unlu used polyvinyl chloride (PVC) to remove propyl acetate [22]. Ethanol was removed using PDMS, PDMS_plasma_C8, PDMS–NaCl, PDMS_Al2O3_nat, PDMS_Al2O3_mod._C8, PDMS/PVDF (polyvinylidene fluoride), and Pervap™4060 [23]. Peng et al. prepared PDMS membranes by embedded fumed silica nanoparticles that were functionalized with two silane coupling agents—NH2(CH2)3Si(OC2H5)3 (APTS) (3-aminopropyltriethoxysilane) and NH2(CH2)2NH(CH2)3Si(OC2H5)3 (TSED) (3-triethoxysilylpropyl ethylenediamine)—for the selective separation of ethanol from aqueous solutions [24]. PDMS was employed to remove acetonitrile in experiments by Wang et al. [25], whereas Ye et al. removed phenol by combining PDMS with oleyl alcohol (5%) [26]. Wu et al. prepared PDMS-ZSM-5 zeolite with nylon to remove acetaldehyde [27], while Aliabadi et al. used PDMS to remove styrene [28]. Hilmioglu et al. used PEBA (polyamide and polyether) to remove MTBE (methyl tert-butyl ether) [29]. Khayet et al. used PDMS Pervap™4060 to remove acetone [30]
Of the VOCs, benzene (C6H6, the pollutant under study) is a volatile substance with a hexagonal cyclic molecule; it is a flammable liquid that is nonpolar, colorless, and has great thermal stability. Benzene is used to prepare many chemicals, such as phenol, styrene, cyclohexane, polyester resins, aniline, chlorobenzenes, and alkylbenzenes, and is used in the production of drugs, dyes, insecticides, and plastics [16]. Benzene is also produced from refinery operations [17]. The presence of benzene as a pollutant in drain water is considered very dangerous for humans and the environment, as benzene causes many carcinogenic diseases [18]. Therefore, water polluted by benzene must be treated before being discharged into rivers or other bodies of water. Uragami et al. [31] used the PV process to separate benzene from an aqueous solution using two different membranes. The first was polyvinyl chloride (PVC) with a 13.8 cm2 active area under the following operating conditions: 500 ppm initial concentration of benzene in the feed, 40 °C feed temperature, and a vacuum pressure of 1.33 Pa abs [32]. The normalized permeation flux was 1.39 × 10⁻⁵ kg m/m2·h, and 8.1 wt% of benzene reached the permeate. The second was polyvinyl chloride with 1-allyl-3-butylimidazilium bis(trifluoromethanesulfonyl)imide ([ABIM]TFSI), where [ABIM] TFSI, as an ionic liquid, has a high affinity for VOCs and a low affinity for water. Under the same conditions, the normalized permeation rate was 1.91 × 10⁻⁵ kg m/m2·h, and 38.4 wt% of benzene reached the permeate.
Ohshima et al. [32] fabricated organic–inorganic membranes by using the sol–gel process using poly(methyl methacrylate-co-vinyltriethoxysilane) (P(MMA-co-VTES)) and poly(butyl methacrylate-co-vinyltriethoxysilane) (P(BMAco-VTES)) as organic compounds with good affinities for VOCs and tetraethoxysilane (TEOS) as an inorganic compound to separate benzene from an aqueous solution. The PV process was achieved at a temperature of 40 °C, a vacuum pressure of 0.01 mm Hg abs, and an initial benzene concentration in the feed of 500 ppm. The experimental results indicated that the benzene–water selectivity of the P(BMA-co-VTES)/TEOS hybrid membrane was about 20 times higher than that of the P(MMA-co-VTES)/TEOS hybrid membrane. Peng et al. [33] added a carbon molecular sieve (CMS) to the PDMS membranes as a filling to remove the benzene from the aqueous solution by the PV process. The membrane’s active area and pressure vacuum were 28 cm2 and 1.0 kPa abs, respectively. The separation factor and flux were evaluated under several operating conditions by varying the initial concentration of benzene, the feed temperature, the feed Reynold numbers, and the effects of the CMS content in the PDMS.
The performances of PDMS membranes vary according to the main components of their compositions, which mainly consist of various proportions of PDMS polymer types (different molecular weights), solvent types, crosslinking types, and catalyst types as well as various materials that may be added to improve the membrane performance such as nanomaterials, carbon molecular sieves, etc. The thickness of the effective layer of the PDMS membrane also has a significant effect on the membrane performance. The mechanical properties of the PDMS membrane have been improved by using many types and several numbers of supporting layers. Thus, the performance of PV processes for VOC recovery from aqueous solutions in terms of the permeation flux and separation factor were mainly based on the type of PDMS membrane, the operating conditions, and the operation style (batch or continuous), as shown in Table 1. It is clear that there are differences in PV process performances. The membrane performance plays a significant role in the PV process results, as shown in Table 1, and the operation style and operating conditions play an important role in the performance results. The batch style of low feed volume leads to a continuous change in the VOC concentration in the feed during operation, which leads to a drop in the VOC permeate flux across the membrane, where the concentration of the VOCs in the feed is considered the highly affected operator for the performance of the PV process, as shown in the present results.
Many researchers used RSM for experimental design and applied a statistical analysis in their work, such as Wee Shin Ling et al. [38], who applied the design of experiments coupled with RSM to study the dehydration of an isopropanol–water mixture by the PV process, where a commercially available ceramic membrane was used to achieve this process. The results showed the effects of feed temperature, feed concentration, vacuum pressure, and feed velocity on the membrane performance. Moreover, the optimal operating conditions and a quadratic model were obtained.
Khayet [39] et al. used a commercial PDMS membrane to remove acetonitrile from the aqueous solution by the PV process under different conditions of temperature and initial organic concentration in the feed. The overall mass transfer coefficients and the activation energy associated with the permeation process were determined. A statistical experimental design and RSM were used to obtain the optimal conditions of the pervaporation process, where the permeate flux ratio and the concentration of organic in the permeate represented the responses.
Margarida Catarino et al. [40] used an olyoctylmethylsiloxane/polyetherimide (POMS/PEI) composite asymmetric membrane to separate aroma from beer by the PV process at various operating conditions of the feed temperature, feed velocity, and permeate pressure. The RSM method has been applied to show the effects of the factors mentioned above on the responses that were represented by the permeate flux, the aromas/ethanol selectivity, the ethanol concentration, and the ratio between high alcohol and ester concentrations on the permeate by building a mathematical model; moreover, the optimal conditions were determined.
The mechanism of solution diffusion is one of the most widely accepted models for describing the movement of matter through a dense membrane in the PV process [41]. The membranes used in PV processes are nonporous and often depend on the solution diffusion mechanism, which consists of three steps. The first one is sorption, where the target substance is sorbed on the membrane surface. The second step is diffusion through the membrane, and this step depends on the affinity between the material and the membrane, where molecules penetrate through polymeric chains. The third step is desorption, where the phase of the material changes from liquid to vapor due downstream vacuum pressure [42].
A commercially developed polydimethylsiloxane (PDMS) membrane prepared by DeltaMem AG (Switzerland) for the pervaporation process was used to separate various VOCs from aqueous solutions, such as ethanol [23], acetone and acetonitrile [30], and butanol [43]. However, to date, no work has been presented in the literature using this PDMS membrane to separate soluble benzene from an aqueous solution. Therefore, the current study is focused on testing this membrane’s performance using the PV process for the separation of the soluble benzene compound from an aqueous solution at different operating conditions, including the feed temperature, the initial concentration of benzene in the feed, and the feed flow rate. RSM was used in this study to obtain the best operating conditions to obtain an optimal response during the PV process and to determine which of the operating parameters have the most significant effects on this response. In addition, this study created a mathematical expression estimated by a data regression that linked the significant variables with the predicted response.

2. Materials and Methods

2.1. Materials

The commercial hydrophobic membrane (PDMS PervapTM4060) used in this research was supplied by DeltaMem AG, Allschwil, Switzerland. The benzene (99.5% purity) was provided by Riedel-De Haën AG Seelze-Hannover, Wunstorfer, Germany. Distilled water was used to prepare all aqueous solutions.

2.2. Membrane Characterizations

Many membrane characterization tests were conducted to identify the characteristics of the commercial membrane, including the following:

2.2.1. Contact Angle

It is well-known that the contact angle (CA) is indicated by the hydrophobicity or hydrophilicity of the membrane. Thus, the contact angle of the present PDMS membrane used was measured using CAM 110-04W, Taiwan. The contact angle was measured by putting a drop of distilled water on the active layer of the membrane, where the contact angle between the drop and the surface of the membrane was read.

2.2.2. Scanning Electron Microscopy (SEM)

Scanning electron microscopy is the most common technique for morphological membrane characterization. For enclosing the membrane morphology, the cross section of the membrane was viewed by scanning electronic microscopy (SEM) by the TESCAN VEGA3 SB Instrument EO-Service, Kohoutovice, Czech Republic. By using liquid nitrogen, the membrane was cut to obtain a clean fracture and a clear image.

2.2.3. Fourier-Transform Infrared Spectroscopy (FTIR)

FTIR is a technique that is used to obtain the infrared spectrum of absorption, emission, and photoconductivity of solids, liquids, and gases. It is used to detect different functional groups. The functions groups in the PDMS membrane were determined by using a Tensor 27 FTIR spectrometer, from Bruker, Ettlingen, Germany.

2.2.4. Energy-Dispersive Spectroscopy (EDS)

EDS is an analysis method that identifies the elemental and chemical compositions of a substance. This test was carried out on the membrane in the present study by the TESCAN VEGA3 SB Instrument EO-Service, Kohoutovice, Czech Republic.

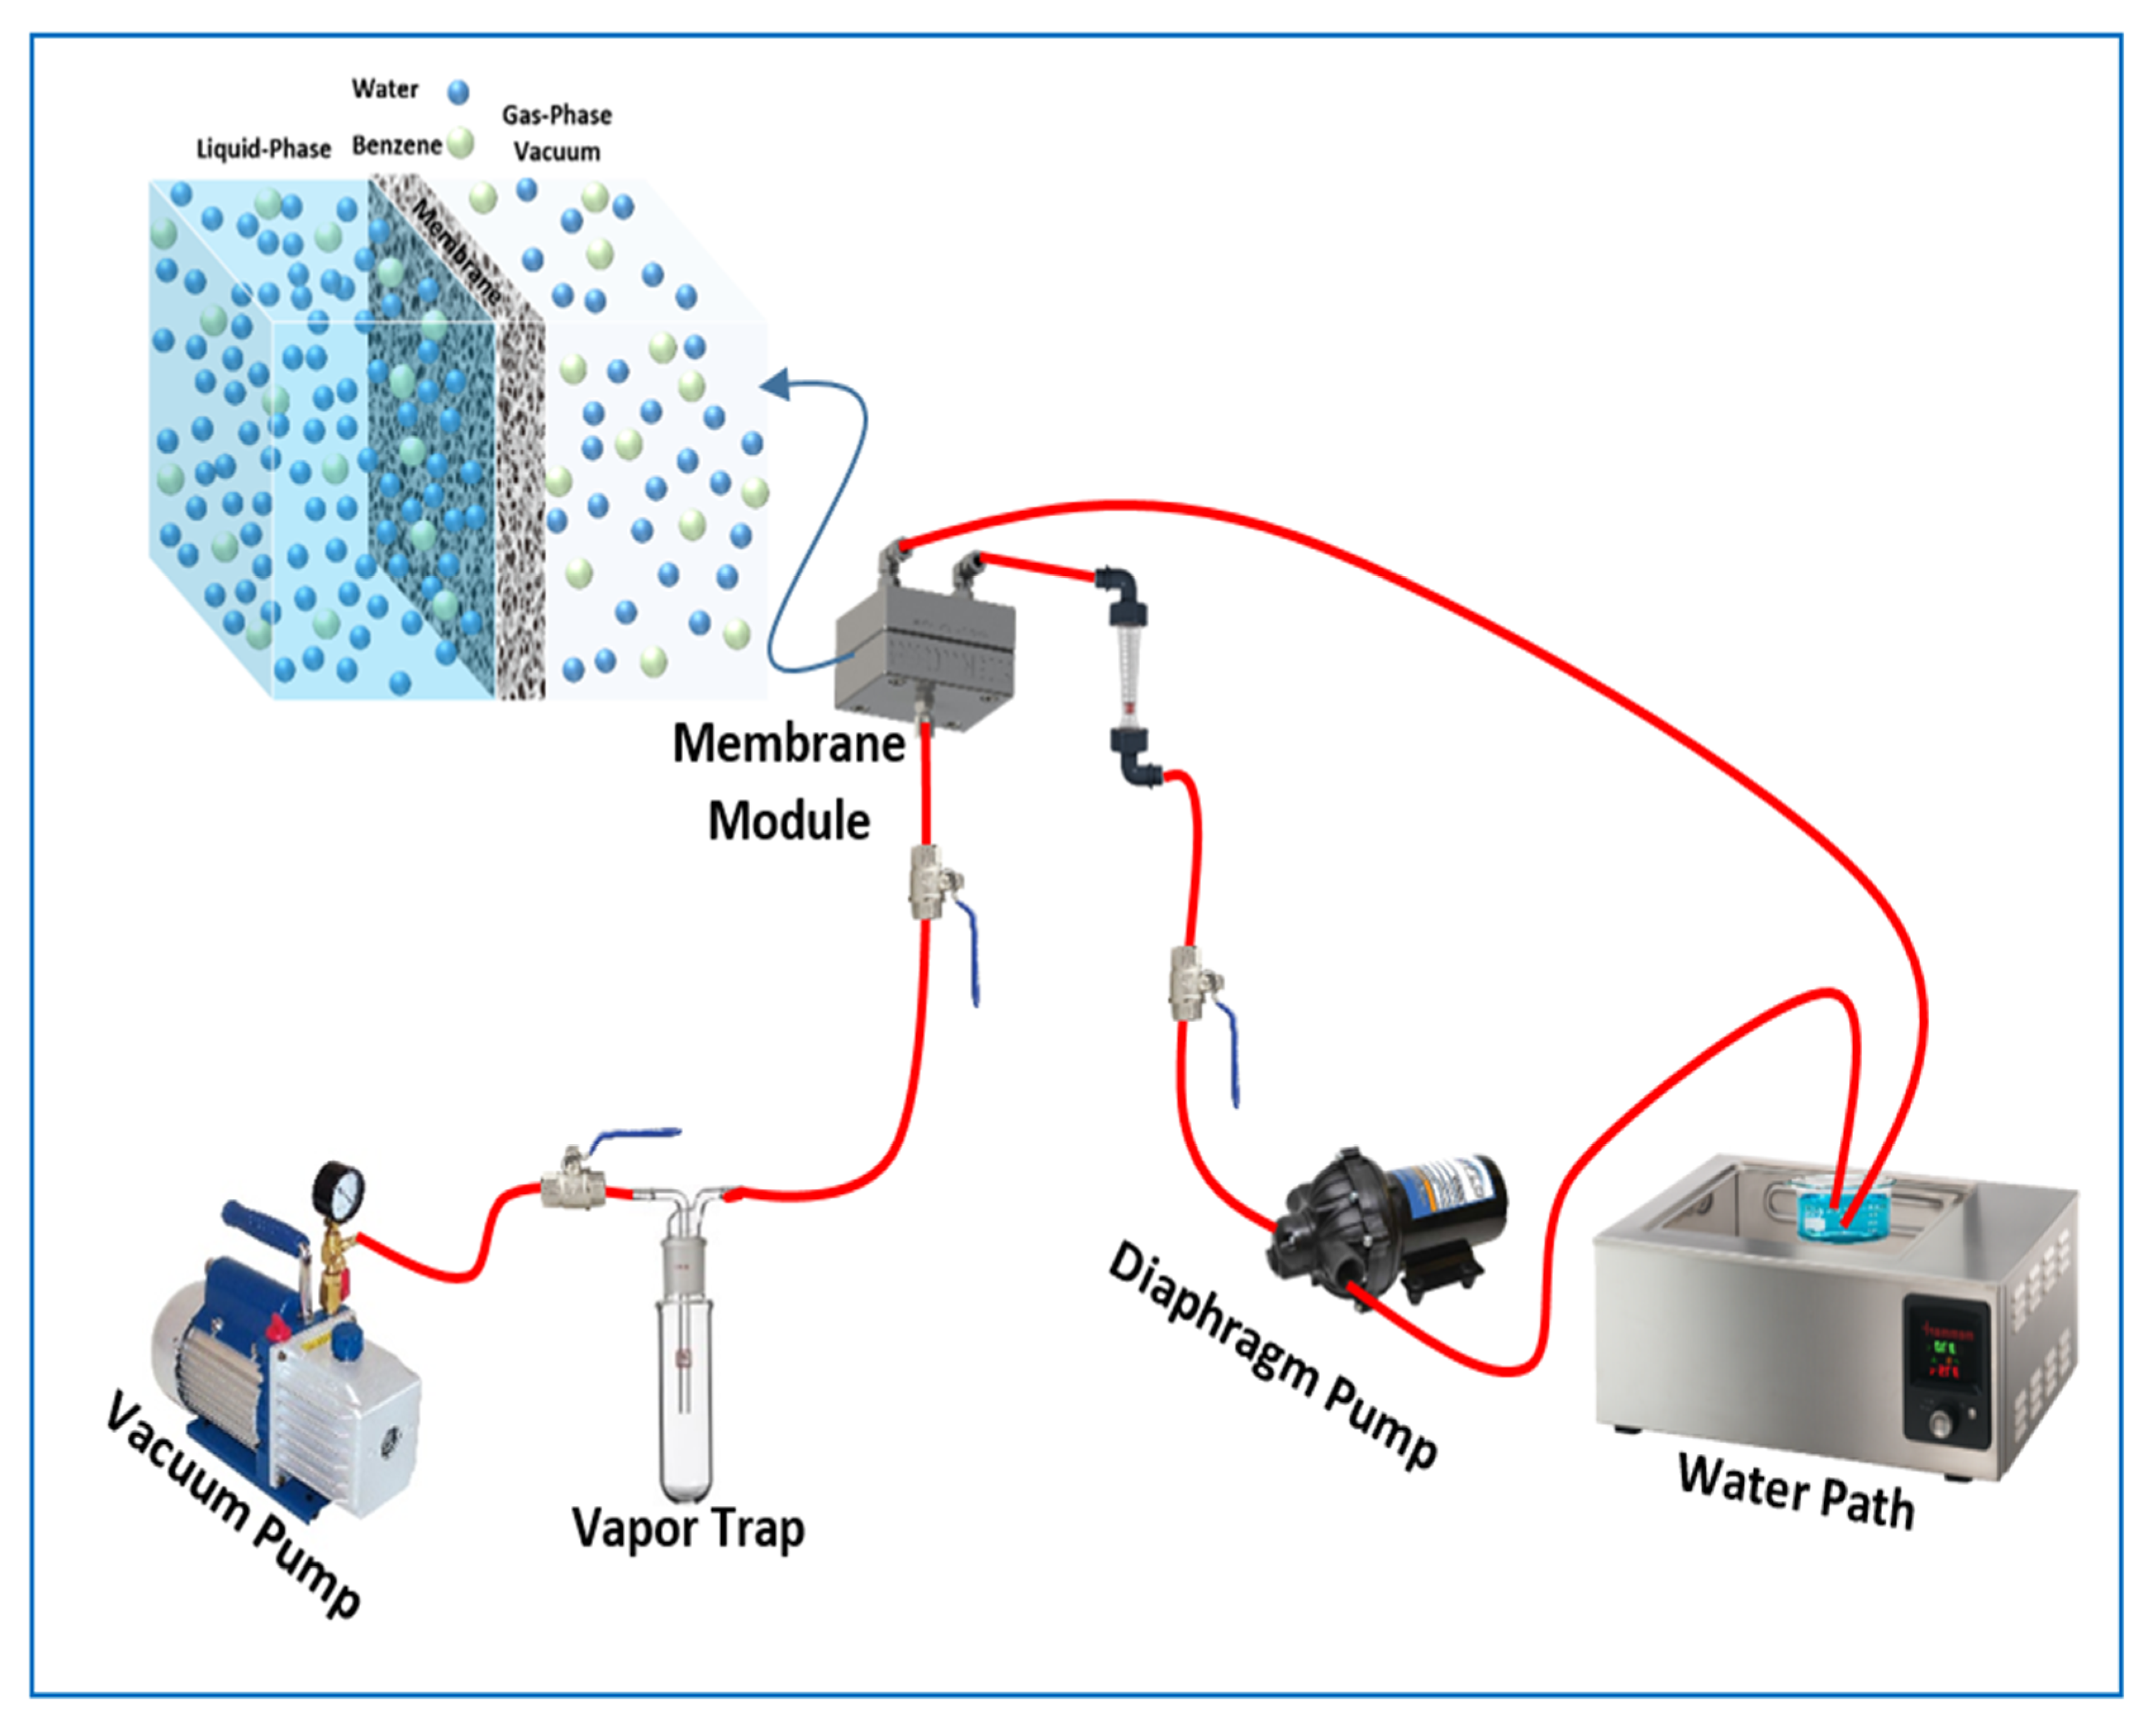
2.3. Pervaporation Process

Pervaporation process tests were carried out using a lab-scale apparatus, which is illustrated schematically in Figure 1. First, a 200 mL benzene–water mixture was prepared in a 250 mL glass flask. To control the temperature, the flask was placed in a thermal digital water bath (DK-8AXX, MEDITECH, Taichung, China), with the bath set at temperatures ranging from 30 to 50 °C. The mixture feed was pumped to the membrane cell by a diaphragm pump (BD, 400GPD, Taiwan), where the initial concentration of the benzene in the feed solution ranged from 100 to 1000 ppm and the feed flow rate ranged from 1.5 to 3.5 L/min. This membrane, with an effective area of 48 cm², rested on a perforated plate placed in the middle of the PV cell to support the membrane. Downstream of the module, the vacuum pressure was kept at 2.0 kPa by a single-stage vacuum pump (B-42, Sigma, Shanghai, China). Samples of the permeate were collected in a vapor trap that was immersed in liquid nitrogen. The collected permeate was weighed with a digital balance with a precision of 0.001 g. The concentration of benzene and water in the permeate was estimated by measuring at least in triplicate using an ultraviolet-visible spectrophotometer (V-630, Jasco, λmax = 253 nm), Tokyo, Japan.
The membrane performance in the PV process could be evaluated in terms of the permeation flux (J) and separation factor (S.F.). The permeation flux is the rate of transport of the targeted substance through a unit area of a membrane during a given time; the separation factor consists of two materials (i and j), such as benzene-water, and it is defined as the ratio of the mole fraction of the components in the permeate to that in the feed.
The flux and separation factor were determined according to Equations (1) and (2):
J = w A   t
S . F . = y i / y j x i / x j
where w is the weight of the permeate; t is the experimental time; A is the effective area of the membrane; and y i , y j , x i , and x j are the mole fractions in the permeate ( y ) and the feed ( x ) in relation to benzene and water, respectively.

2.4. Experimental Design

While other studies have employed a variety of methods to design similar experiments (e.g., the Taguchi method) [44,45], this paper is based on the response surface method (RSM), which was designed using Minitab 18. RSM is an assortment of mathematical and statistical techniques to create, improve, and optimize processes and can be utilized to assess the relative significance of several factors, even in the presence of complex interactions [46]. Therefore, in this work, the system required 20 experimental runs in which all factors were varied simultaneously over a set of experiments to determine the relationships between the factors affecting the output. The experimental design program was also used to obtain the best operating conditions and to determine the optimal response [39,47].

3. Results and Discussion

3.1. Membrane Characterizations

3.1.1. Contact Angle

Because the contact angle (CA) indicates the hydrophobicity or hydrophilicity of a membrane, the contact angle of the PDMS membrane in this study was measured. Measurements were repeated three times, and all results were >90°, as can be seen in Figure 2a. The average CA result was 97° ± 0.05, demonstrating that the membrane was hydrophobic.

3.1.2. SEM Analysis

To examine the membrane’s morphology, its cross section was viewed by scanning electron microscopy (SEM). The SEM tests of the PDMS membrane are presented in Figure 1a, which clearly shows that the membrane contains three layers: (1) an active layer of 5.53 µm thickness, characterized as a dense (nonporous) layer; (2) a porous layer of 77.49 µm thickness; and (3) a nonwavy fabric layer with a thickness of 101.5 µm. The membrane surface of the first layer was smooth and uniform, as shown in Figure 2b. The dense nature of the membrane is confirmed by the image in this figure.

3.1.3. FTIR

The functional groups in the PDMS membrane were determined, and the surface composition of the PDMS membrane was analyzed, as illustrated in Figure 3a. The peak at 794 represented a Si–CH3 group, and the peaks from 1012 to 1061 pointed to a Si–O–Si group. The peak at 1258 represented a Si–CH3 group, while the peak at 1460 represented a Si–CH=CH2 group. The peaks at 2856 and 2960, respectively, corresponded with the asymmetric and symmetric vibration of CH3.

3.1.4. Energy-Dispersive Spectroscopy (EDS)

EDS is an analysis method that identifies the elemental and chemical compositions of a substance. Figure 3b presents the results of an EDS test to identify the elements of the PDMS membrane.
It is noted that the presence of silicon, carbon, nitrogen, and oxygen, in addition to calcium, which may appear as a result of the use of some additives by the manufacturing company, may be to improve the performance of the membrane.

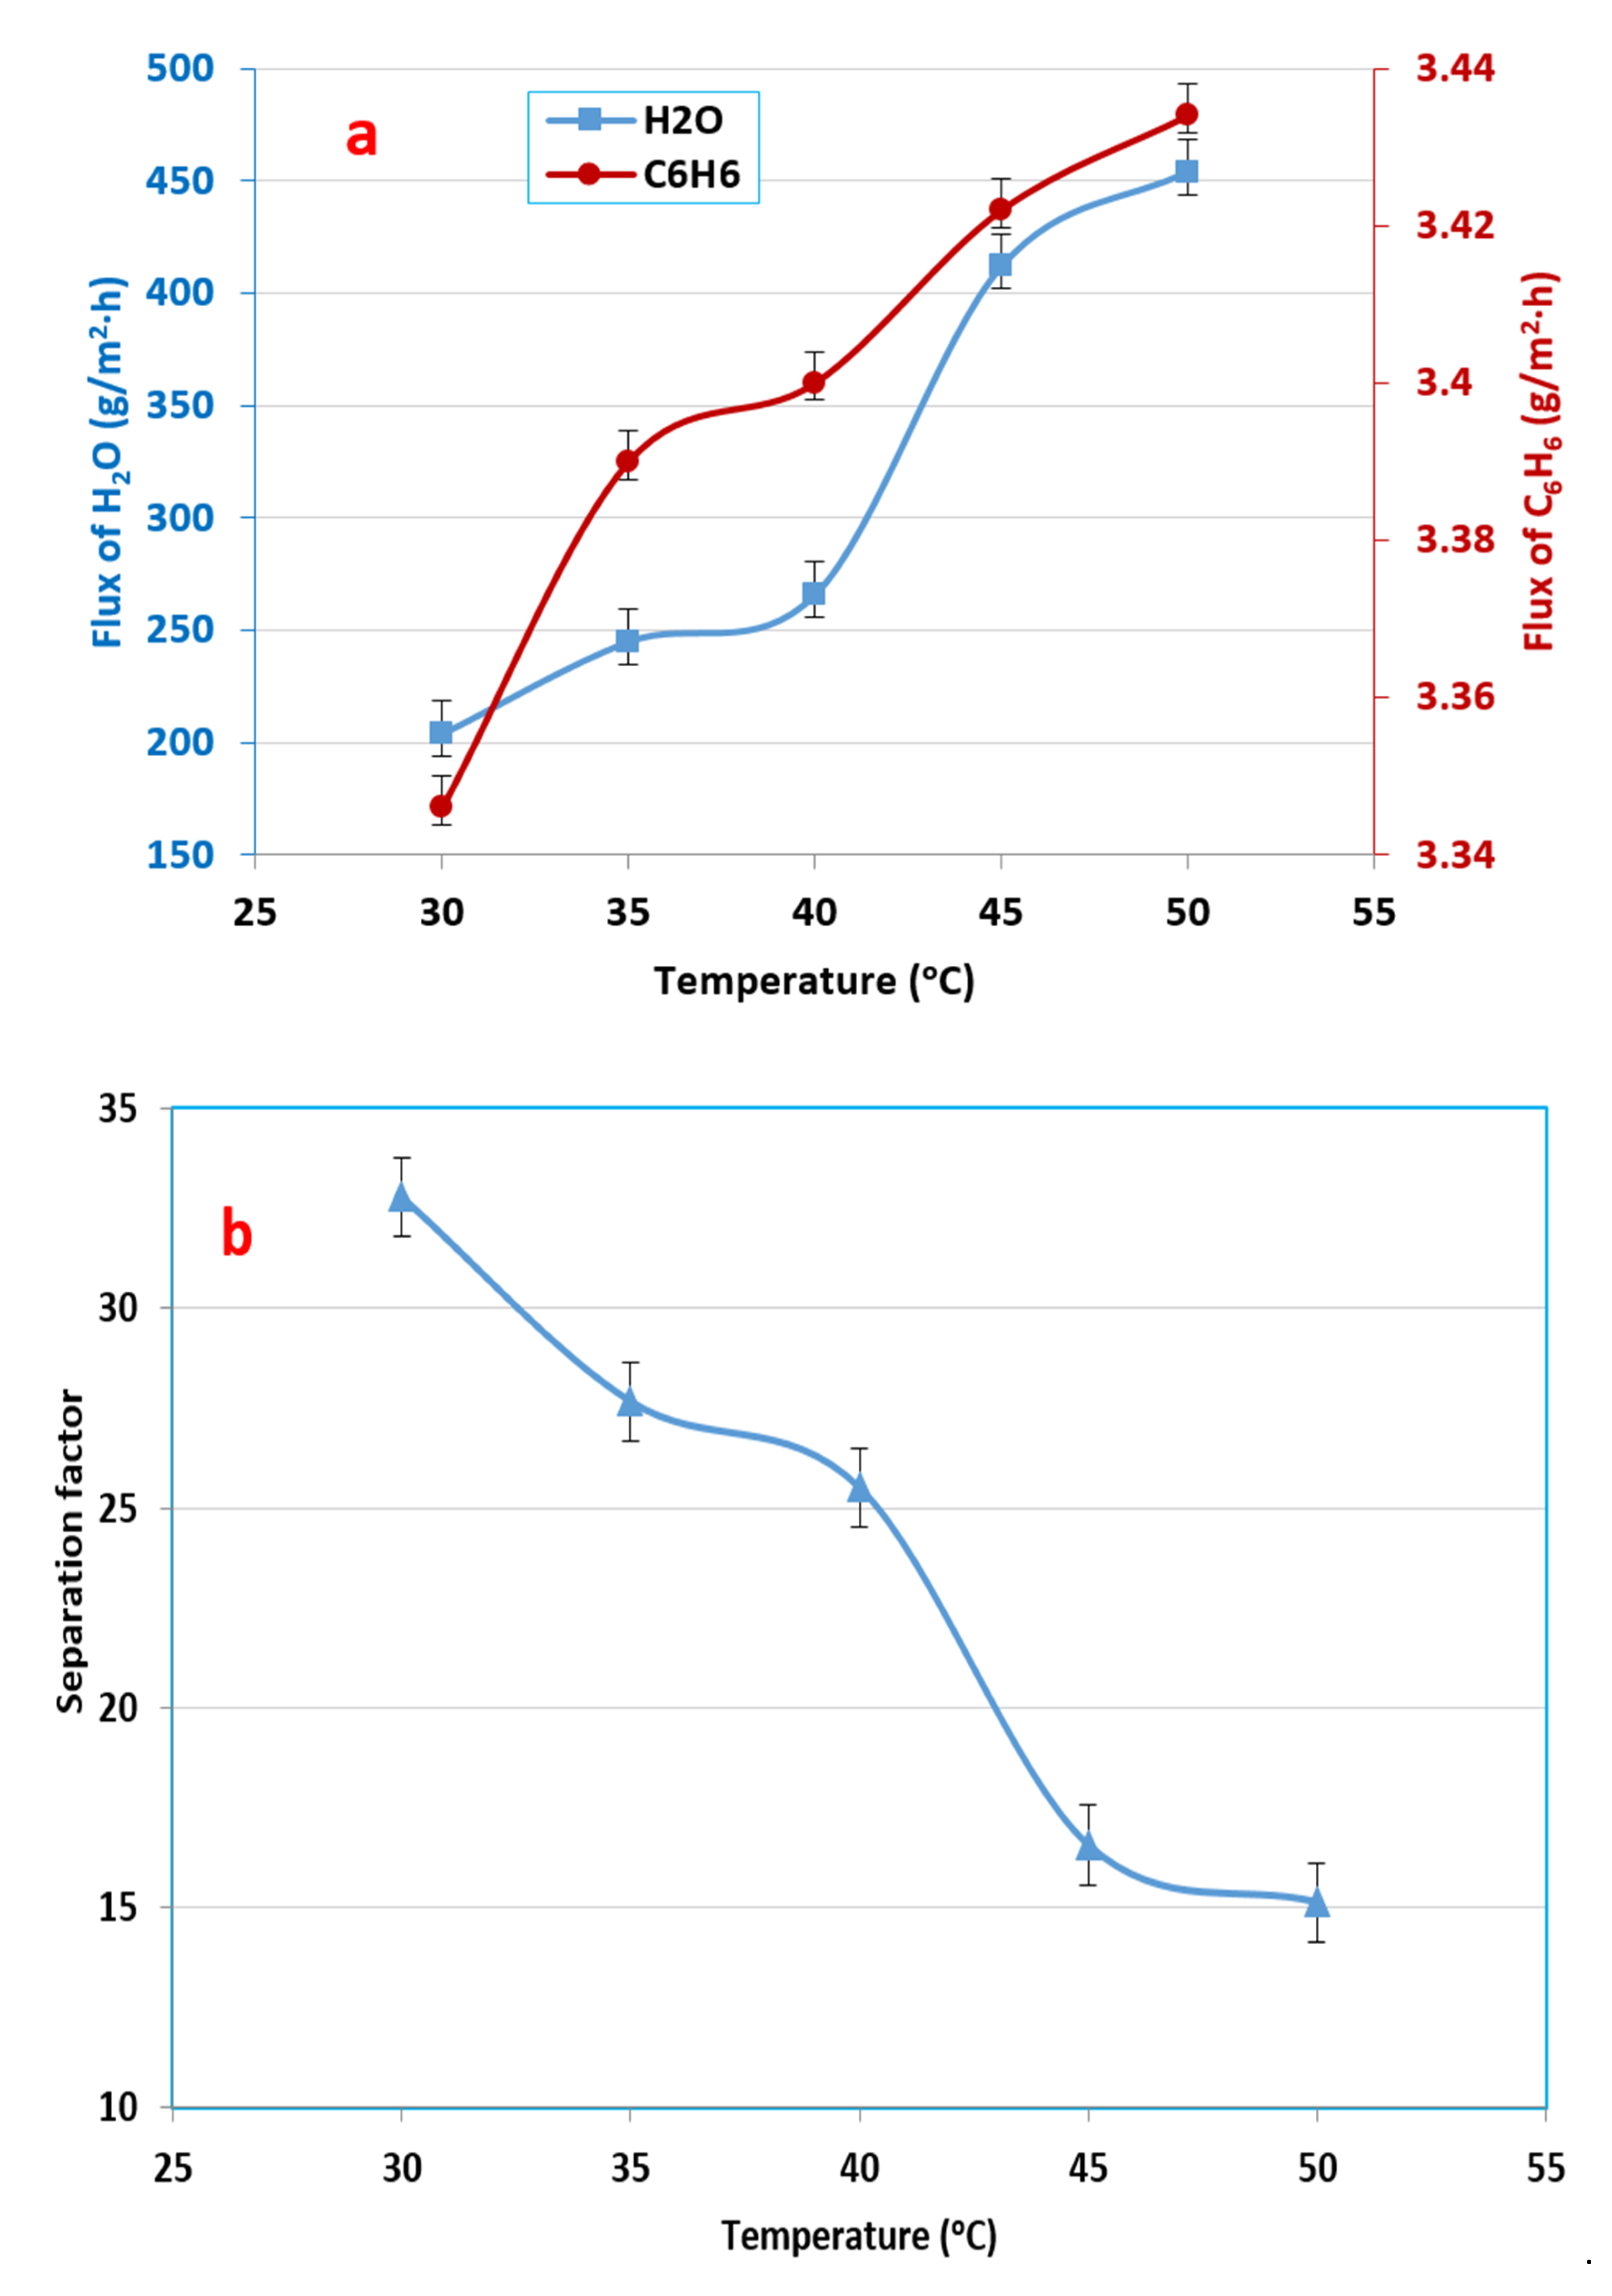
3.2. Influence of Feed Temperature in Benzene–Water Mixture

The experimental results of the influence of temperature on the permeation flux are shown in Figure 4a, which demonstrates that the benzene permeate flux through the PDMS membrane increased from 3340 to 3434 mg/m2·h, while the water flux increased from 204 to 454 g/m2·h. This figure clearly shows that the permeate flux increased with a rise in temperature due to the increment in the distance between the polymer chains with the rise in temperature; this resulted in an increase in the free volume available for molecular transit [48]. Moreover, by increasing the temperature, the vapor pressure of each compound increased, which led to a high permeation flux of all compounds by increasing the driving force across the membrane [28].
However, in spite of the permeation flux increasing, the separation factor decreased with a rise in temperature, as displayed in Figure 4b. The fluxes of benzene and water increased with an increase in temperature, but the rate of increase of the water molecules was greater than that of the benzene molecules. The separation factor changed from 32.78 to 15.12, possibly due to benzene having a larger molecular size than water. Therefore, with the increase in the feed temperature, the rate of water diffusion should increase faster than benzene [34,41].

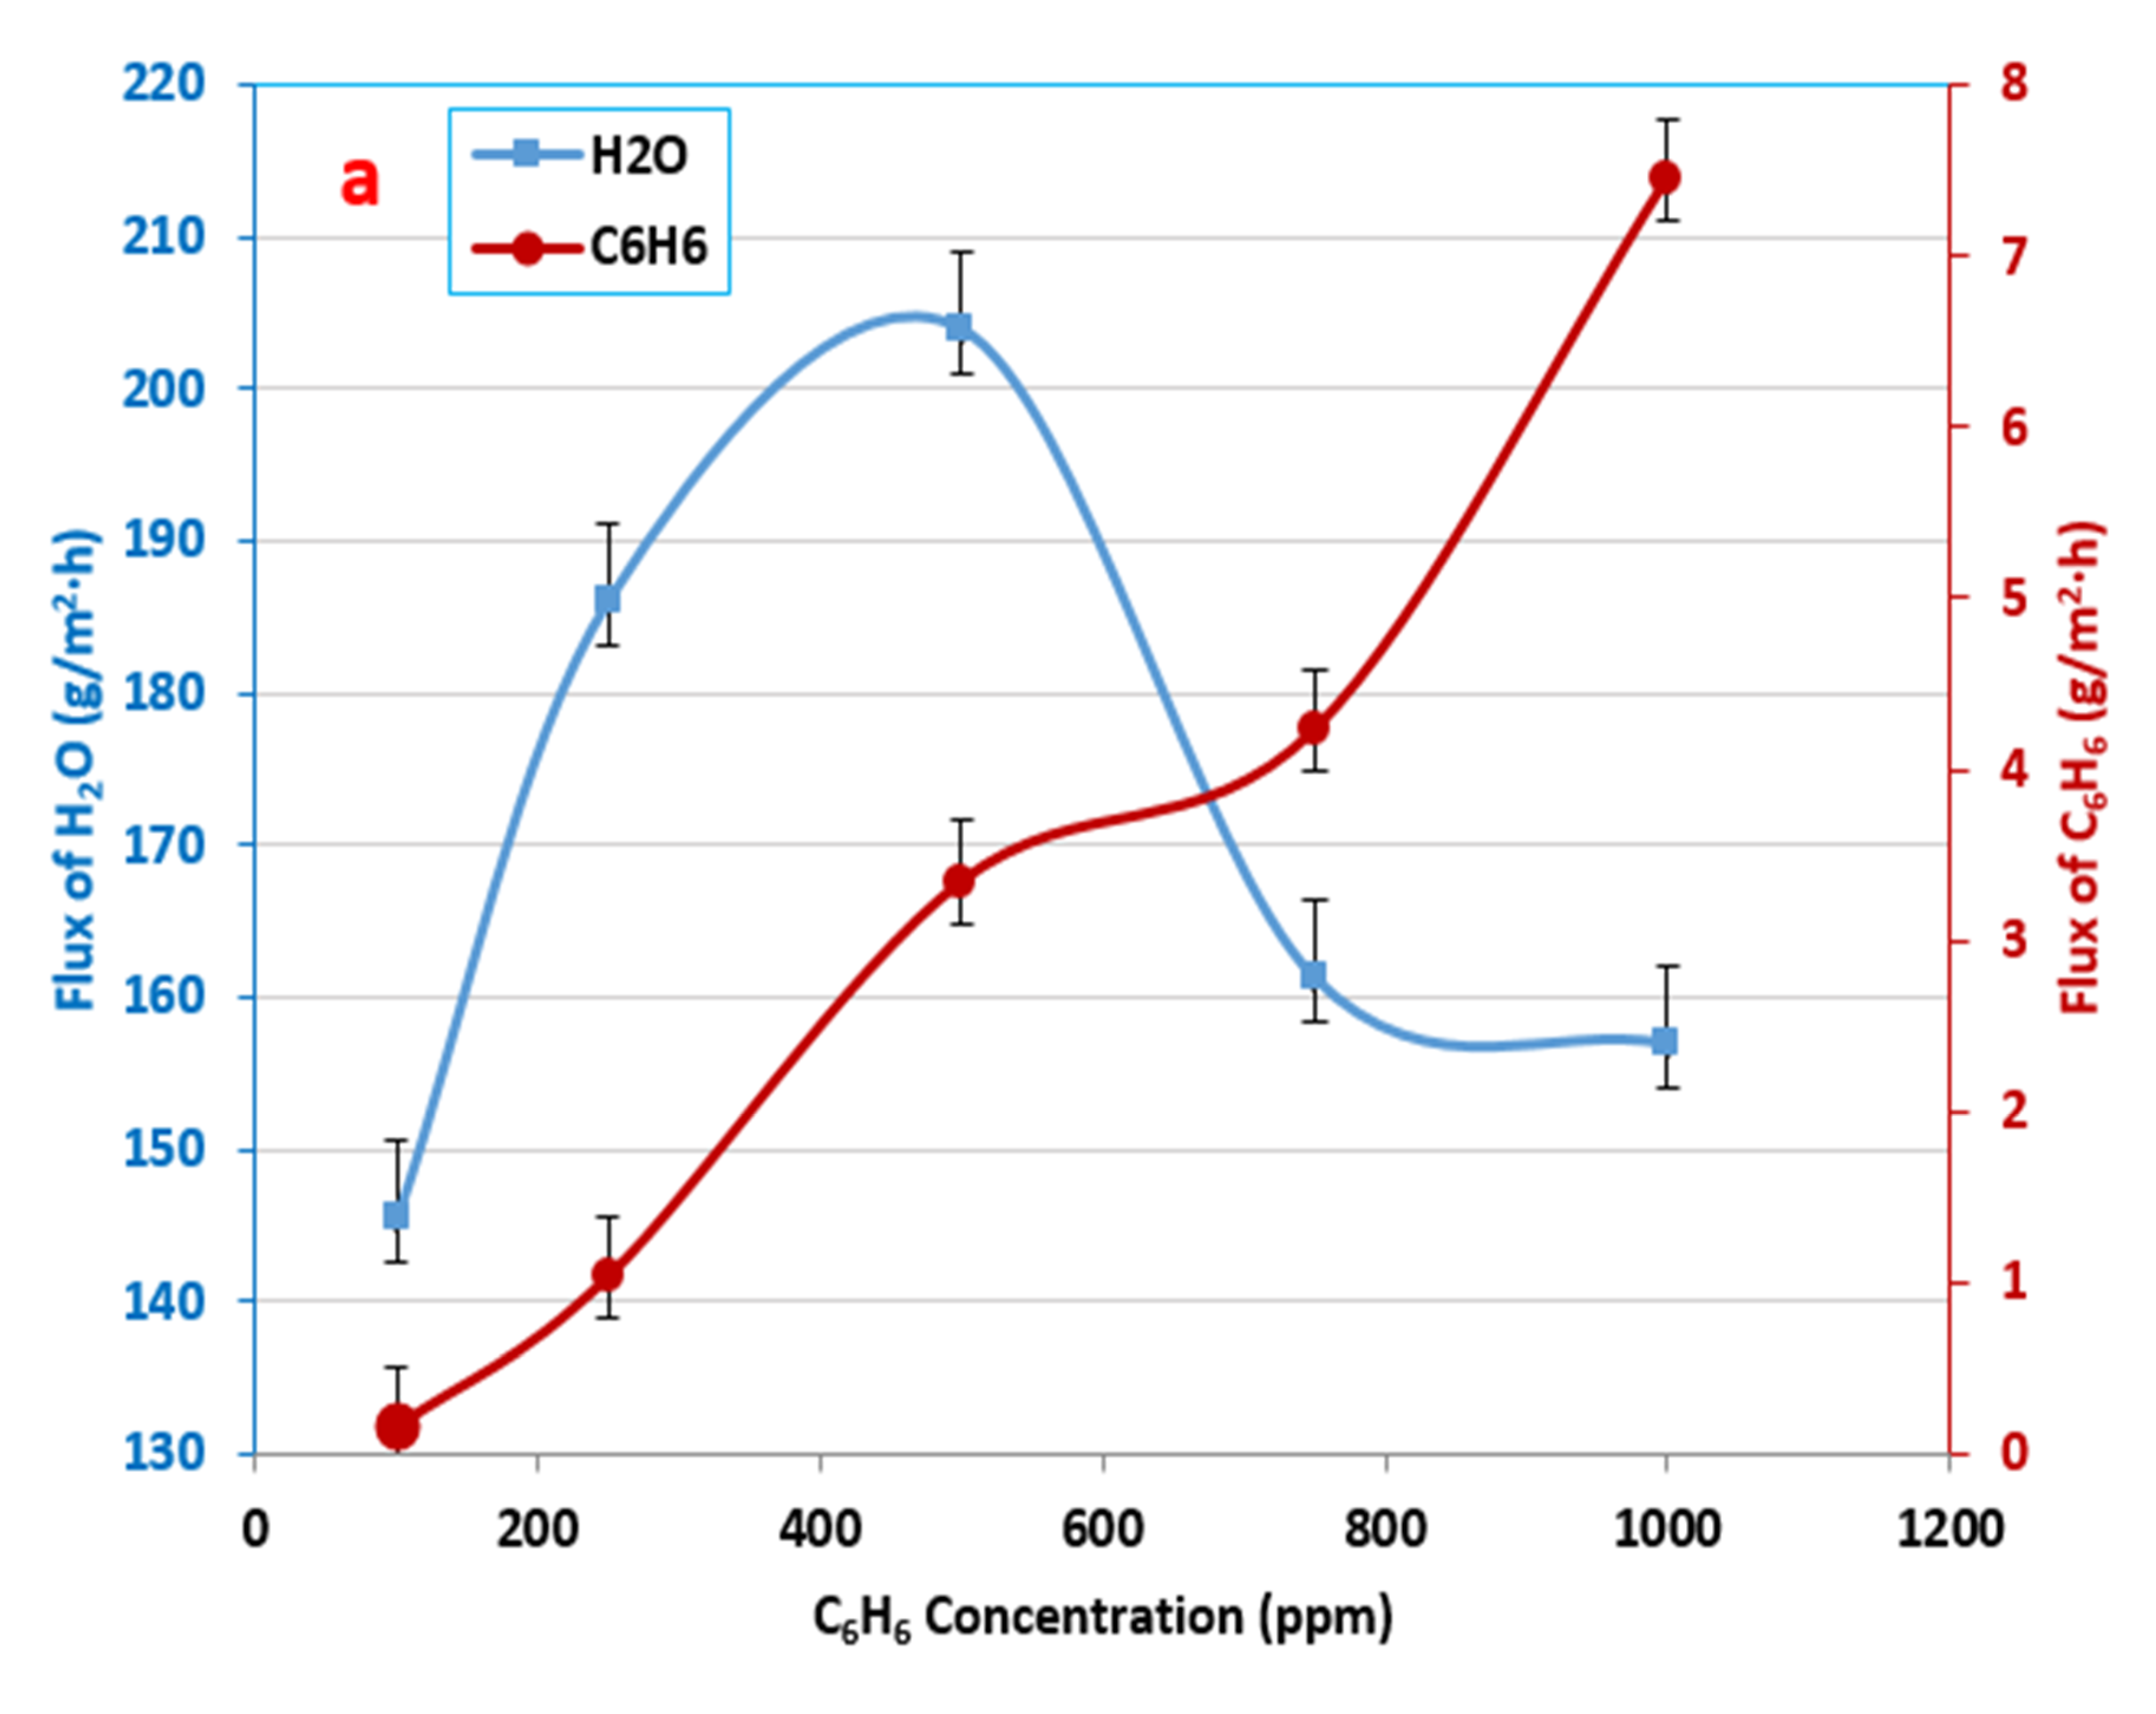
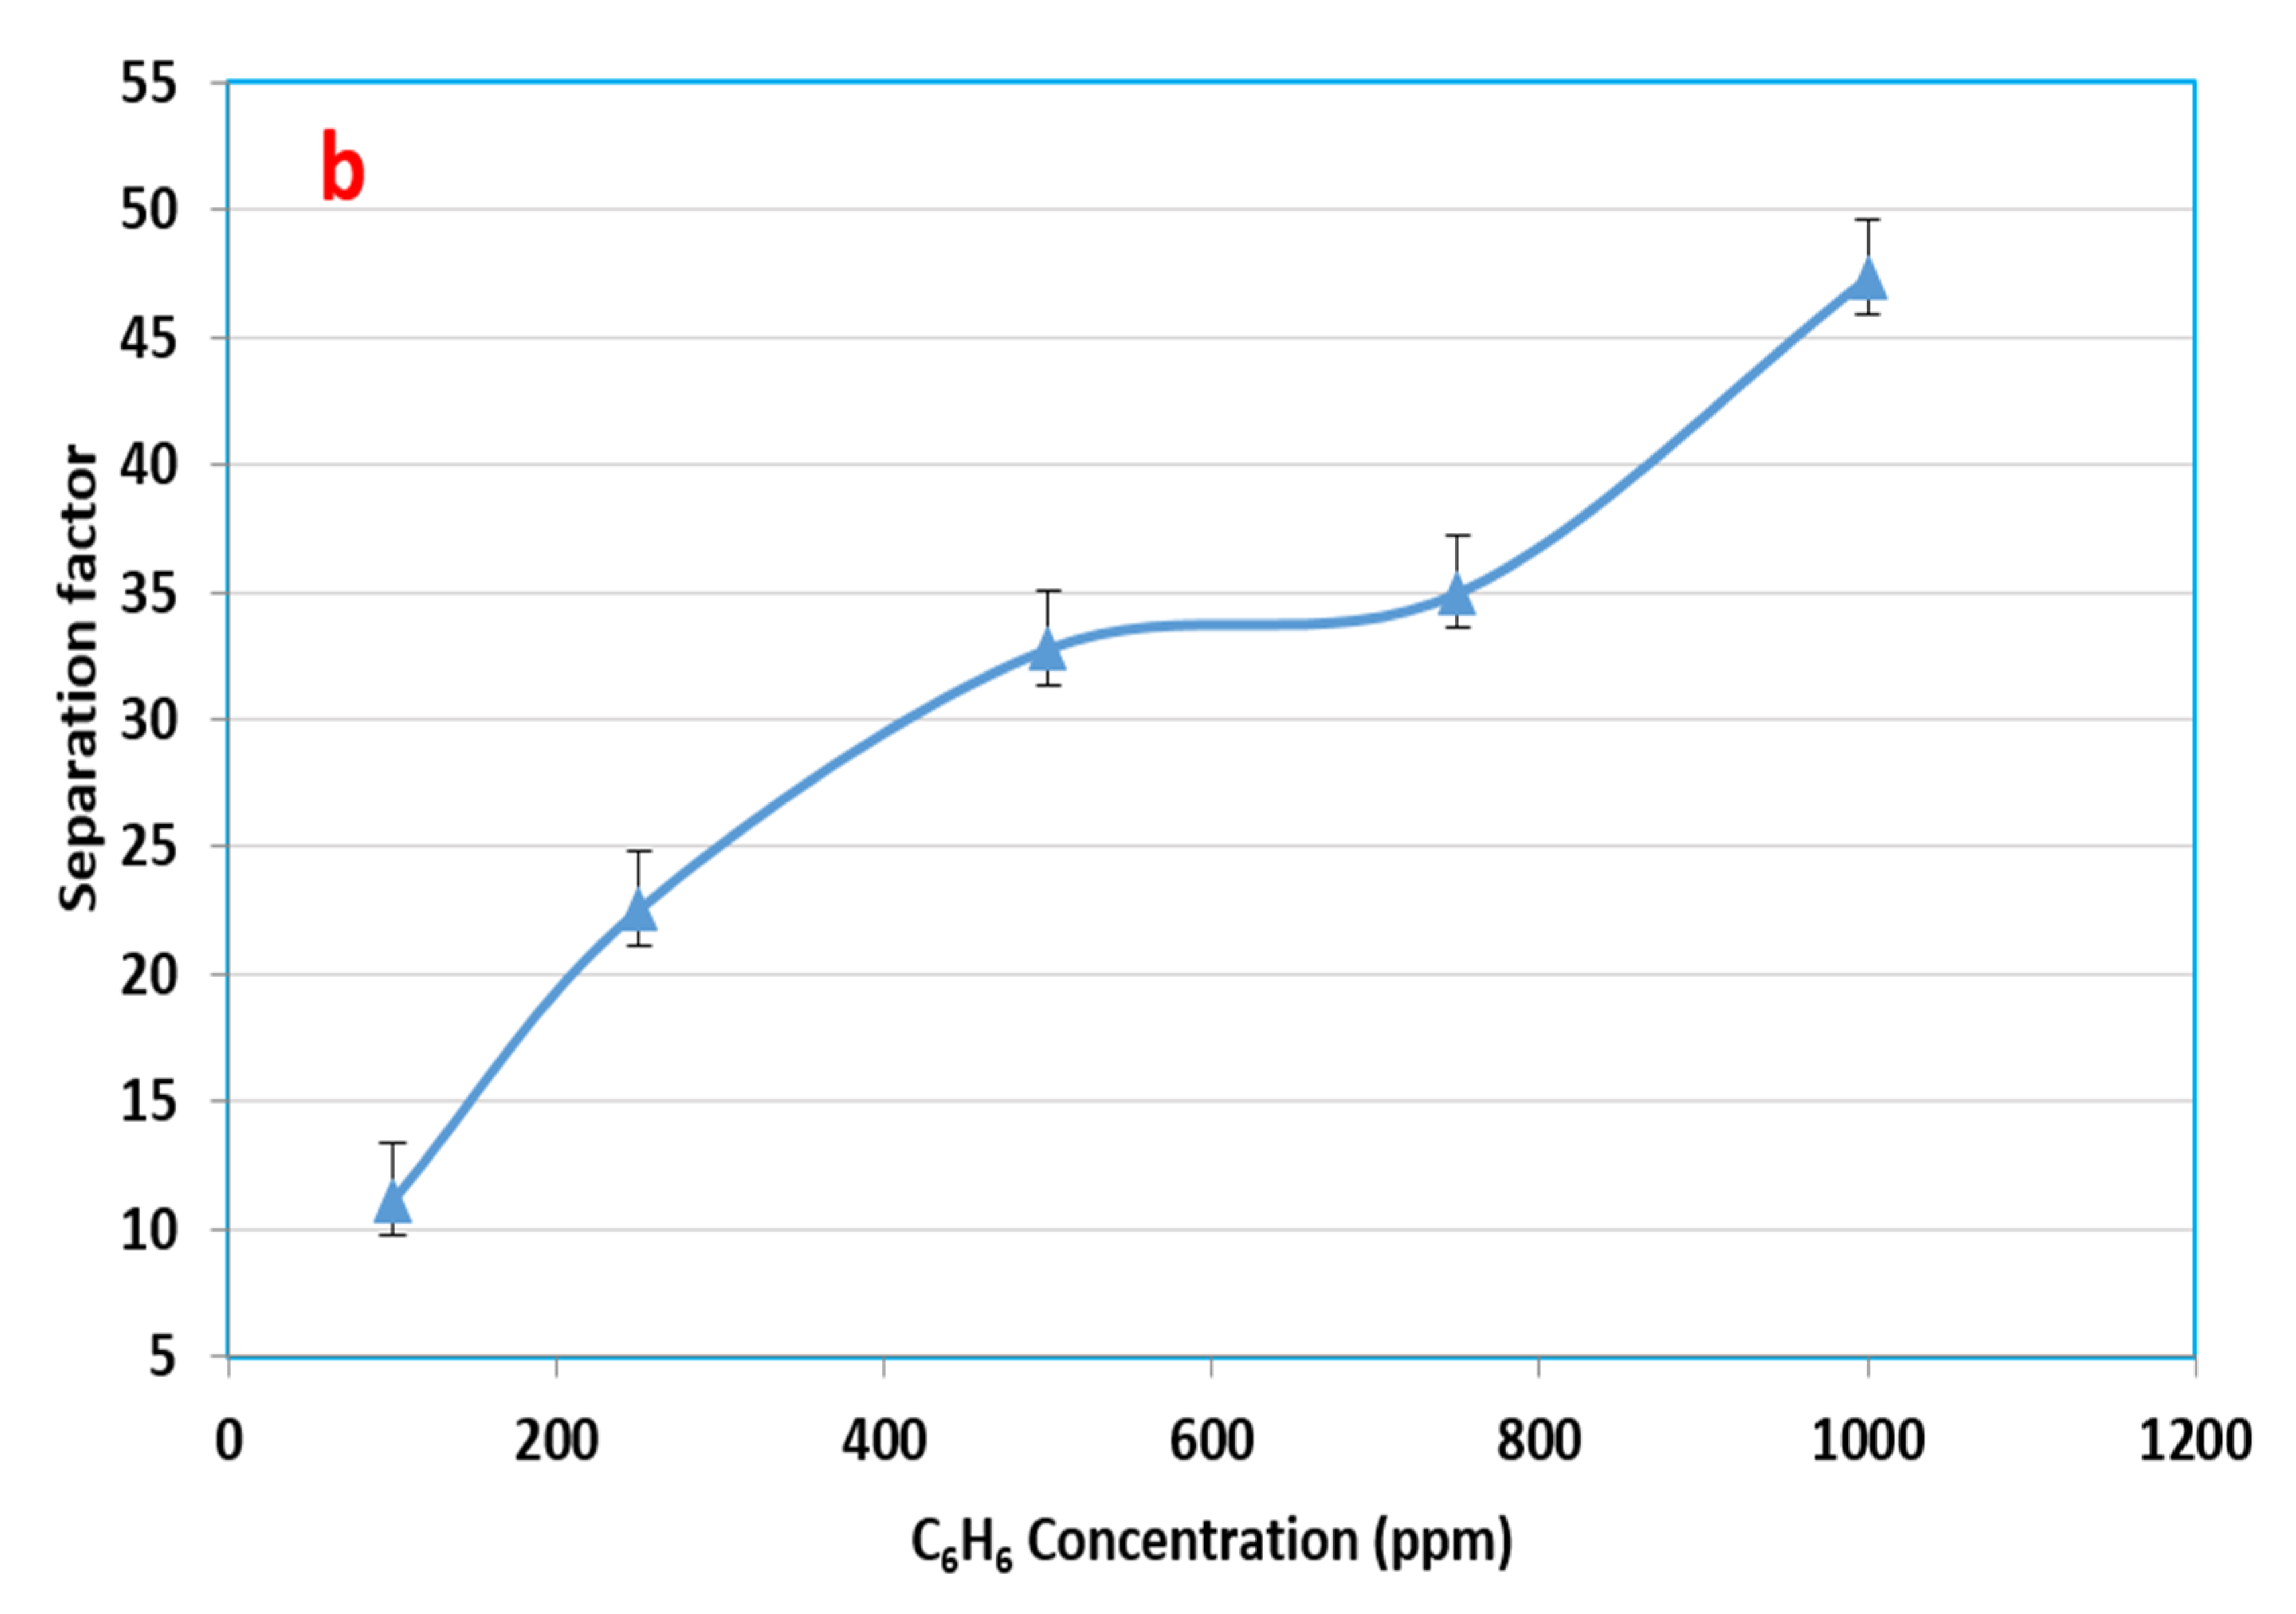
3.3. Influence of the Initial Feed Concentration in Benzene–Water Solution

The solubility of the benzene component in water can reach 1800 ppm at 25 °C [49]; consequently, the initial concentrations of benzene studied in the present work ranged from 100 to 1000 ppm. The experimental results displayed that the increase in the feed concentration led to an increase in the benzene flux.
With an increase in the initial benzene concentration in the feed solution from 100 to 1000 ppm, the permeation flux increased from 0.161 to 7.45 g/m2·h, as shown in Figure 5a. The increase in the initial benzene concentration in the feed caused an increase in the driving force between the upstream and downstream pressures across the membrane [34].
The water flux behavior changed with an increased initial benzene concentration in the feed solution. At first, the water flux increased and achieved 204 g/m2·h. Then, it decreased to 157 g/m2·h, as can be seen in Figure 5a. This result may be explained by the fact that the water molecules clustered due to the hydrogen bonding between the water molecules, which reduced their diffusivity and permeability [25]. The separation factor also increased with an increase in the initial benzene concentration in the feed solution, as shown in Figure 5b, where water clustering developed in the membrane, arising from the repulsive interaction between the organic compound and water that had been absorbed [48]. It was proven that the water permeation within polymer membranes may be hindered by the formation of a water cluster. This analysis revealed that because the diffusion size of the water increased, the diffusion coefficient decreased [28].

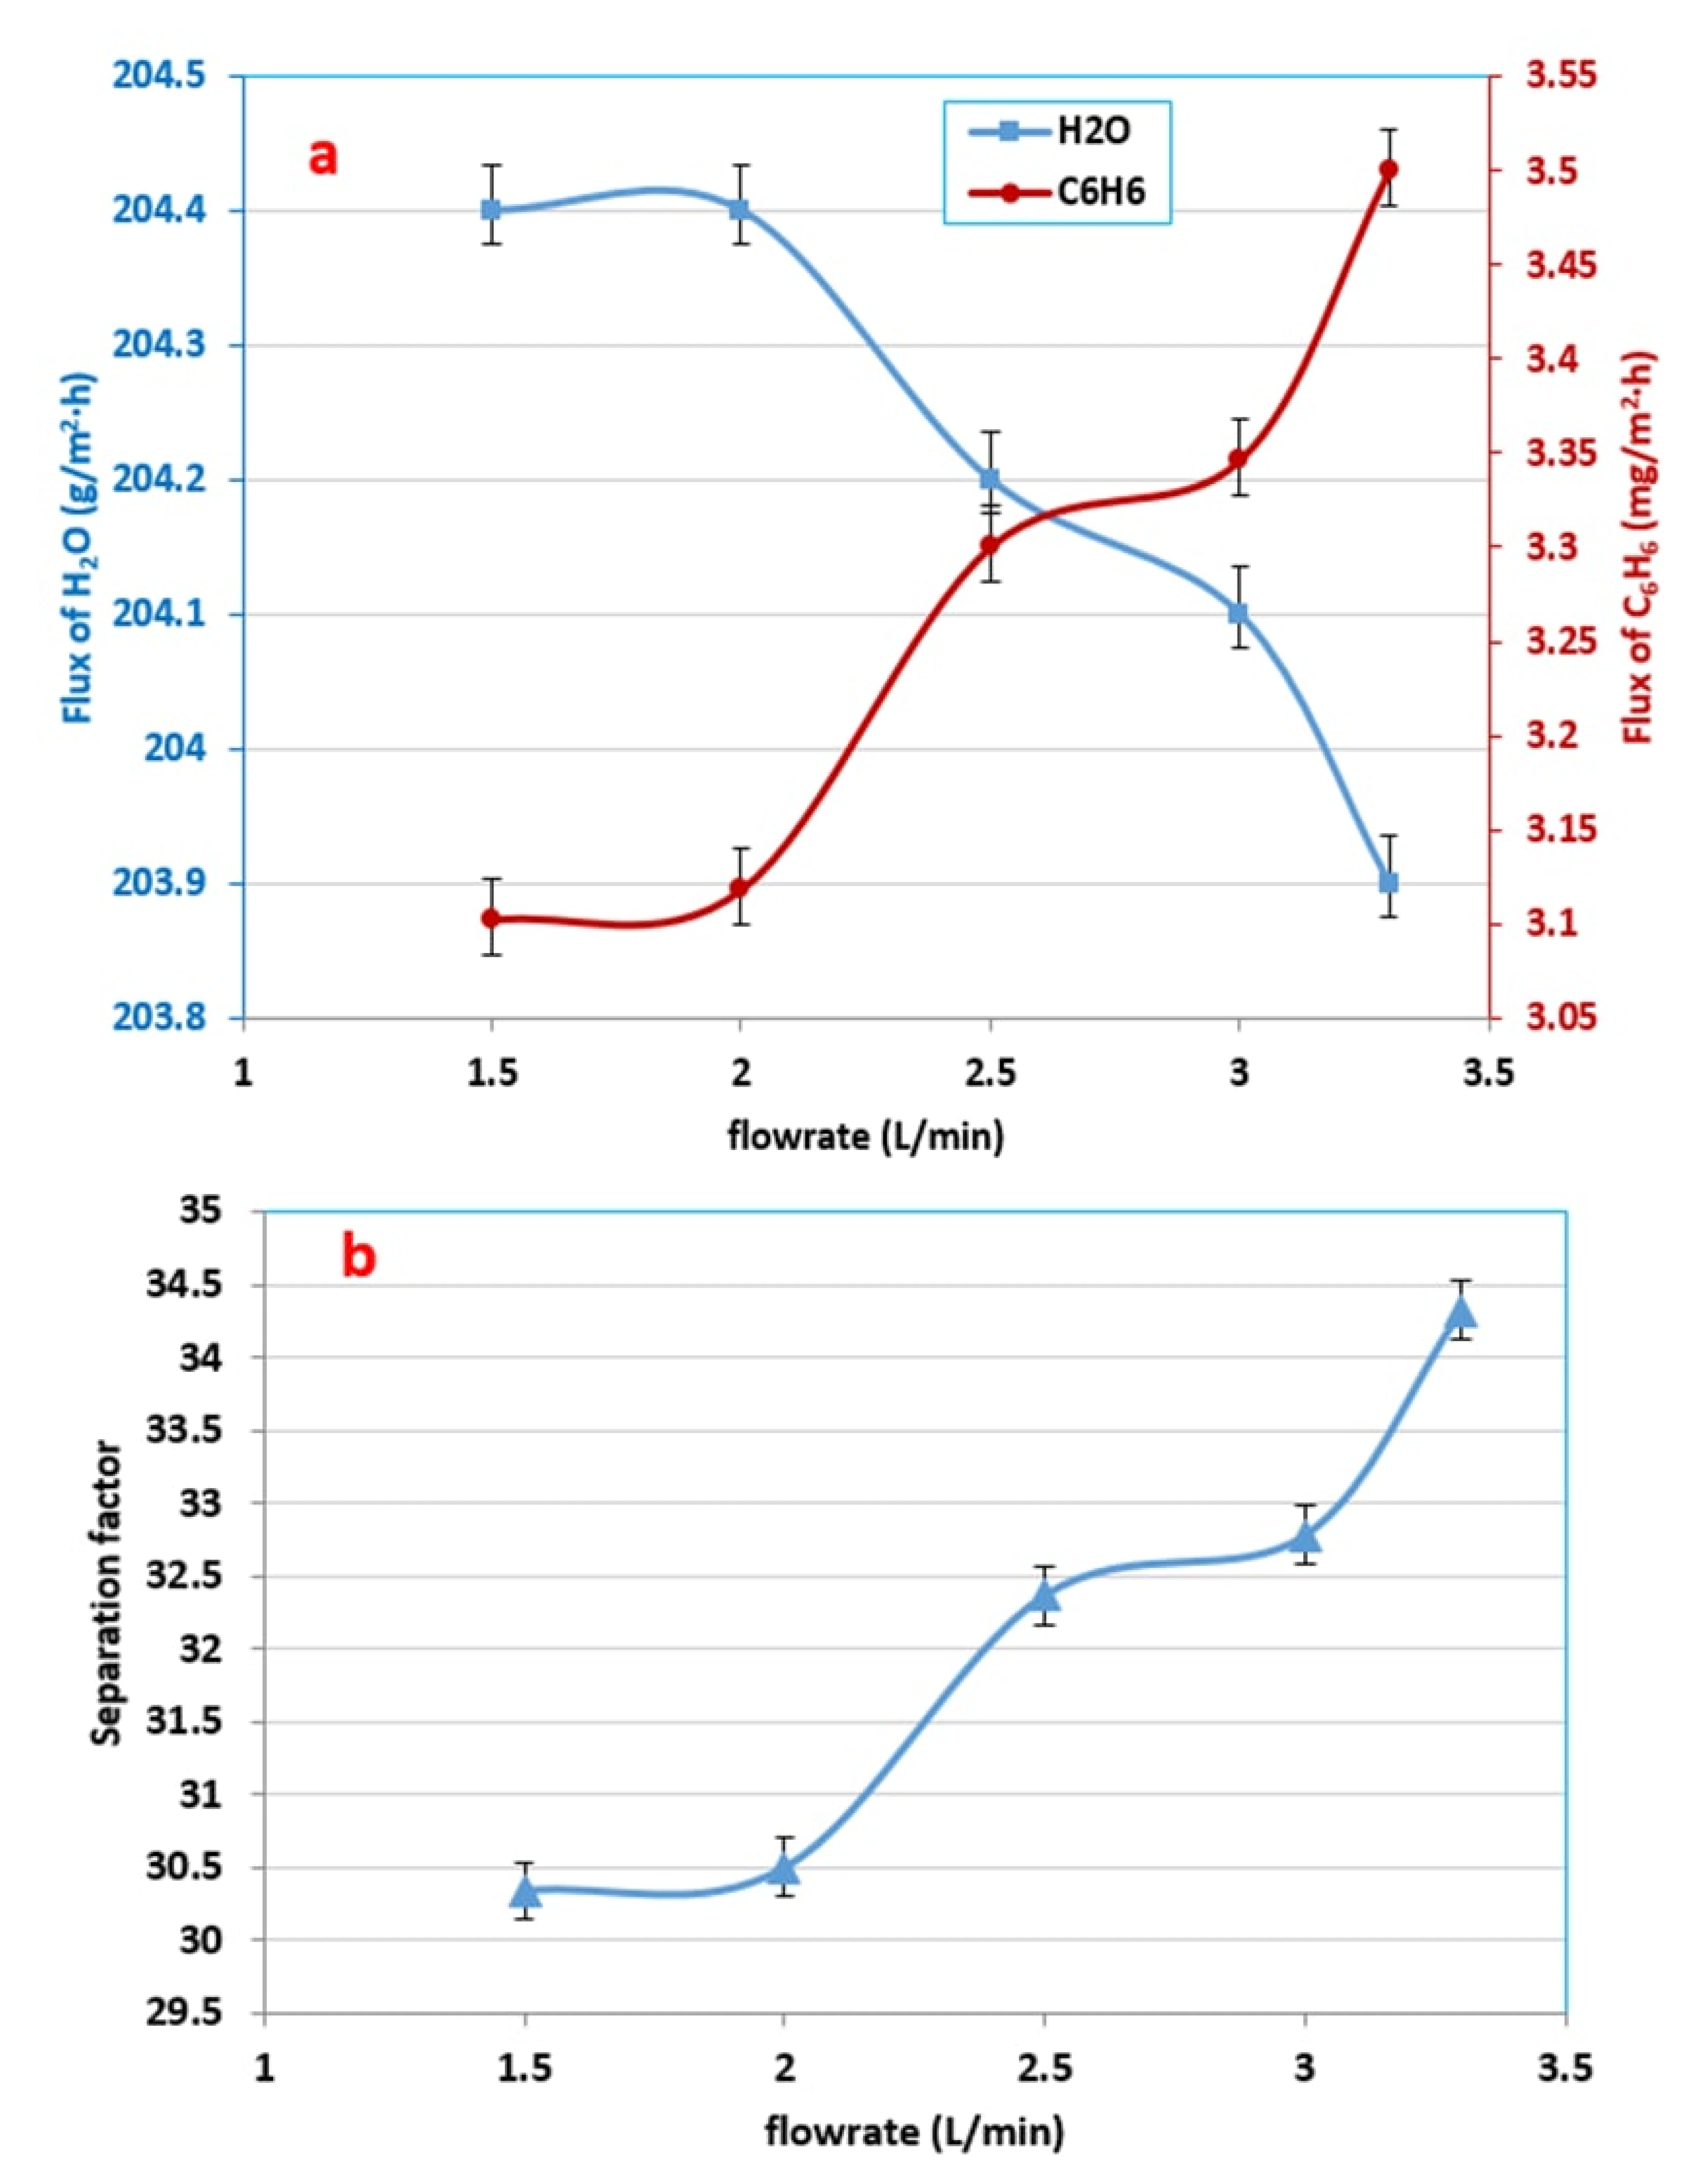
3.4. Effect of Feed Flow Rate on the Benzene Flux

Figure 6a demonstrates that there was an improvement in the benzene partial flux with increases in the feed flow rate at a 500 ppm initial concentration of benzene and a temperature of 30 °C. The experimental results showed that when the flow rate increased from 1.5 to 3.5 L/min the permeate flux of benzene increased from 3102 to 3500 mg/m2·h. The effect of concentration polarization may explain these results because it is well-known that this effect occurs at the liquid boundary layer near the surface of the membrane. Concentration polarization always decreases the rate of permeation of the more permeable compound (benzene) and increases the rate of permeation of the less permeable compound, such as water; that, in return, decreases the efficiency of the separation. However, the increase in the flow rate of the feed could decrease the influence of concentration polarization, and the boundary layer thickness would also decrease. Thus, the resistance to the transfer of the material through the membrane decreased for benzene, while the flux of water seemed to be slightly decreased from 204.4 to 203.9 g/m2·h, which was almost constant (see Figure 6a). In fact, the permeate flux of water is mainly depends on the rate of diffusion across the membrane, which means that should be independent of feed flow rate [29,48].
The separation factor increased with increasing feed flow rates, as depicted in Figure 6b, where the flux of benzene increased while the water flux decreased very slightly (approximately constant) [33]. While increasing the flow rate of the feed, an increase in the flux of benzene and a slight decrease in the flux of water was observed. Therefore an increase in the separation factor was obtained according to Equation (3) [50]:
S . F . = c i p e r m . c j   p e r m . c i   f e e d c j f e e d = J i J j c i   f e e d c j f e e d
where c i p e r m . and c i   f e e d are the concentration of compound i in the permeate and feed, respectively; c j   p e r m . and c j   f e e d are the concentration of compound j in the permeate and feed, respectively; and J i and J j are the permeate flux of compounds i and j, respectively.
The performance of the present PV process for soluble benzene recovery from an aqueous solution is mainly based on the commercial PDMS membrane used in the present work, the operating conditions, and the operating style. This performance may be different than the performances reported in previous works according to the characterizations of the membrane used, the operating conditions, and the style. Table 1 shows the performances of many PV processes with different VOC contaminants in aqueous solution using many types of PDMS membrane. As mentioned above, this table shows various performances in terms of permeation flux and separation factor according to the operators listed in Table 1. A comparison of the performance between the present and previous works of the PV process for benzene recovery from an aqueous solution is shown in Table 2. The performance of the present study seems to be lower in comparison with the performances that were reported in some previous studies. The expected reason may be due to the differences in the performance of the membrane used, the operating conditions, and the operating style. In the present work, the operation was based on a certain initial benzene concentration in a relatively small feed mixture volume (200 mL) that led to a significant decrease in the benzene concentration in the feed during the experiment’s operation. This operation style is somewhat similar to the operation style used by Xianshe Feng and Robert Y.M Huang [51] for isopropanol recovery from an aqueous solution, where they also used a small volume of an isopropanol–water mixture near to that used in the present study but with a high initial concentration of isopropanol.

3.5. Results of the RSM

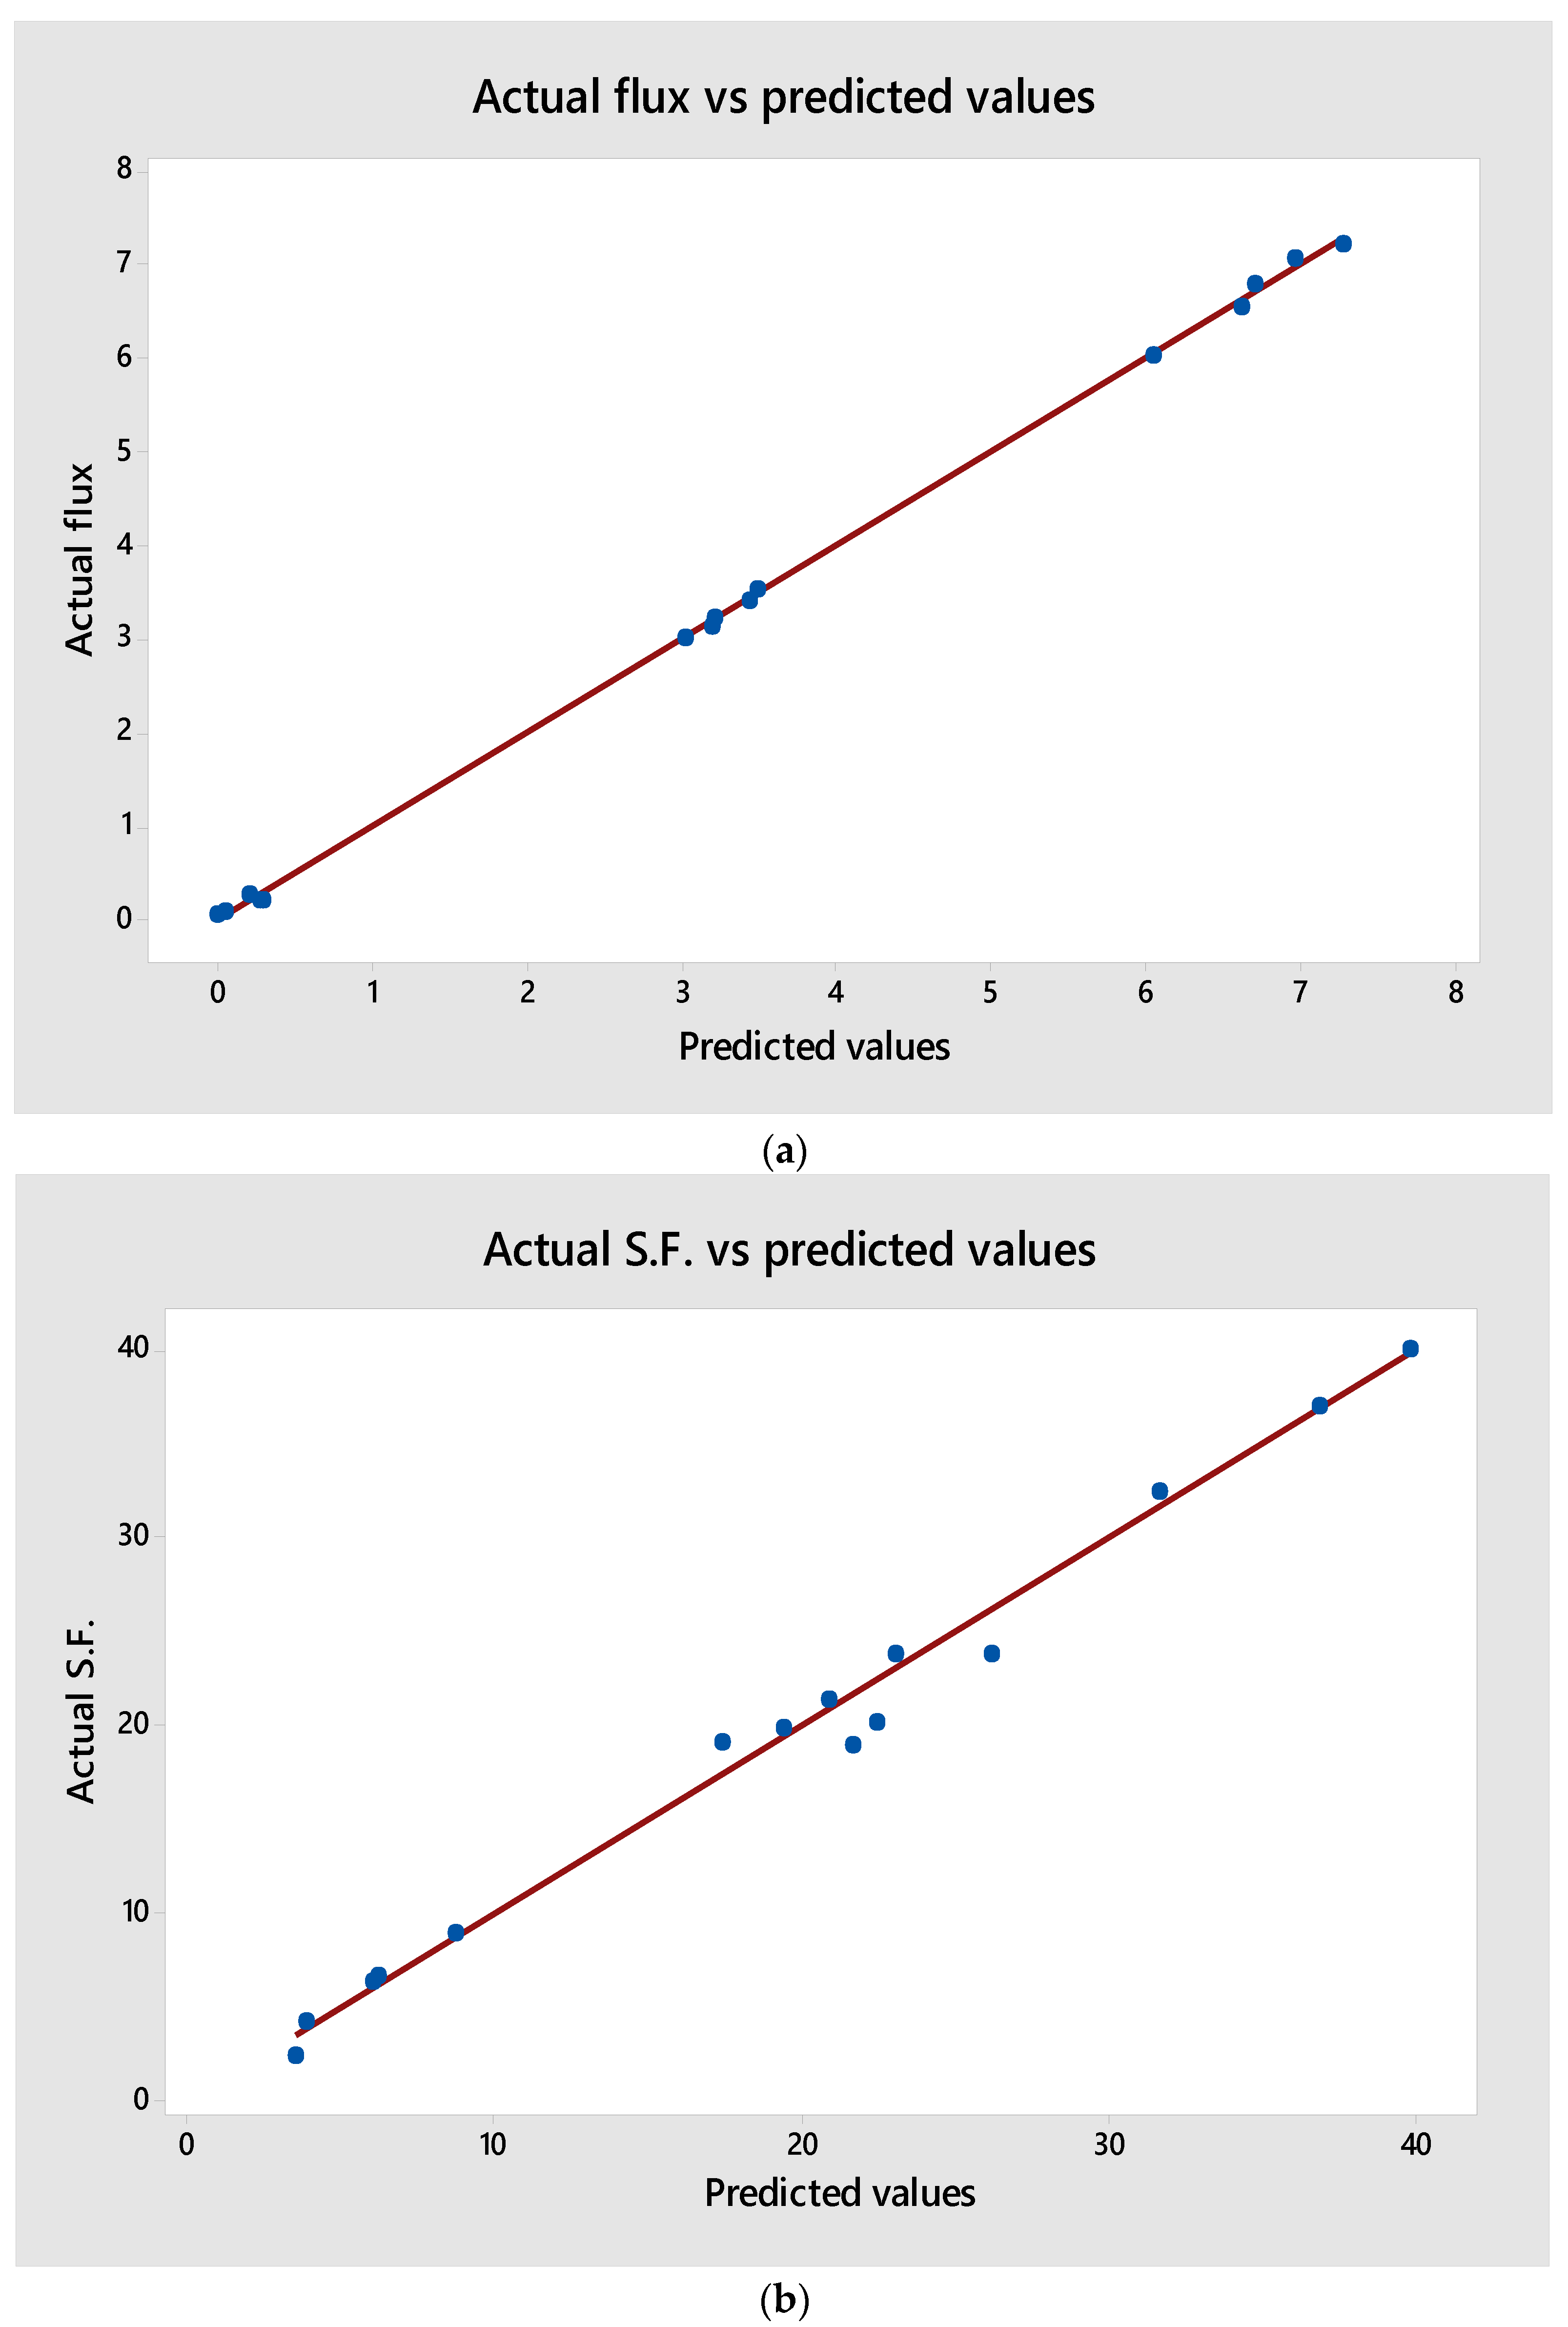
3.5.1. Predicted Model and ANOVA Calculations

The operating parameters of the RSM experimental data points were obtained using Minitab 18, and the experimental results that represented the responses of the process (i.e., the permeate flux and separation factor) are provided in Table 3.
The analysis of these results was used to determine mathematical expressions to predict the responses of the PV process (i.e., the benzene permeate flux and separation factor). A quadratic nonlinear regression model was suggested using Minitab 18 to obtain the equations for the benzene permeate flux and separation factor, as follows:
J B = A 0 + A 1   T + A 2   C A 3   F +   A 4   T 2 + A 5 C 2 + A 6   F 2 + A 7   T   C +   A 8 T   F   +   A 9   C   F
S . F . = A 0 + A 1   T + A 2   C + A 3   F +   A 4   T 2 + A 5 C 2 + A 6   F 2 + A 7   T   C +   A 8 T   F   +   A 9   C   F
where the coefficients from A0 to A9 are illustrated in Table 4.
The predicted values for the benzene permeate flux and separation factor from Equations (4) and (5) were compared with the experimental values from the experiments given in Table 2, as presented in Figure 7a,b. This figure indicates that the proposed models (regression formulas) were in good agreement with the experimental results.
To fully quantify the significance of each factor, an analysis of variance (ANOVA) was calculated using Minitab 18. Table 5 and Table 6 display the results of the ANOVA calculations for the benzene permeate flux and separation factor, respectively. On the other hand, the correlation coefficients (R2 values) were found to equal 99.95 and 98.63 for the benzene permeation flux and separation factor, respectively, both of which are considered desirable. This reveals that about 99% of the data deviation can be described by the two empirical models [39].
Moreover, the predicted correlation coefficient (R2pred) values are close to the adjusted correlation coefficient (R2adj) for both models, as shown in Table 7. This means that significant terms were included in both empirical models.

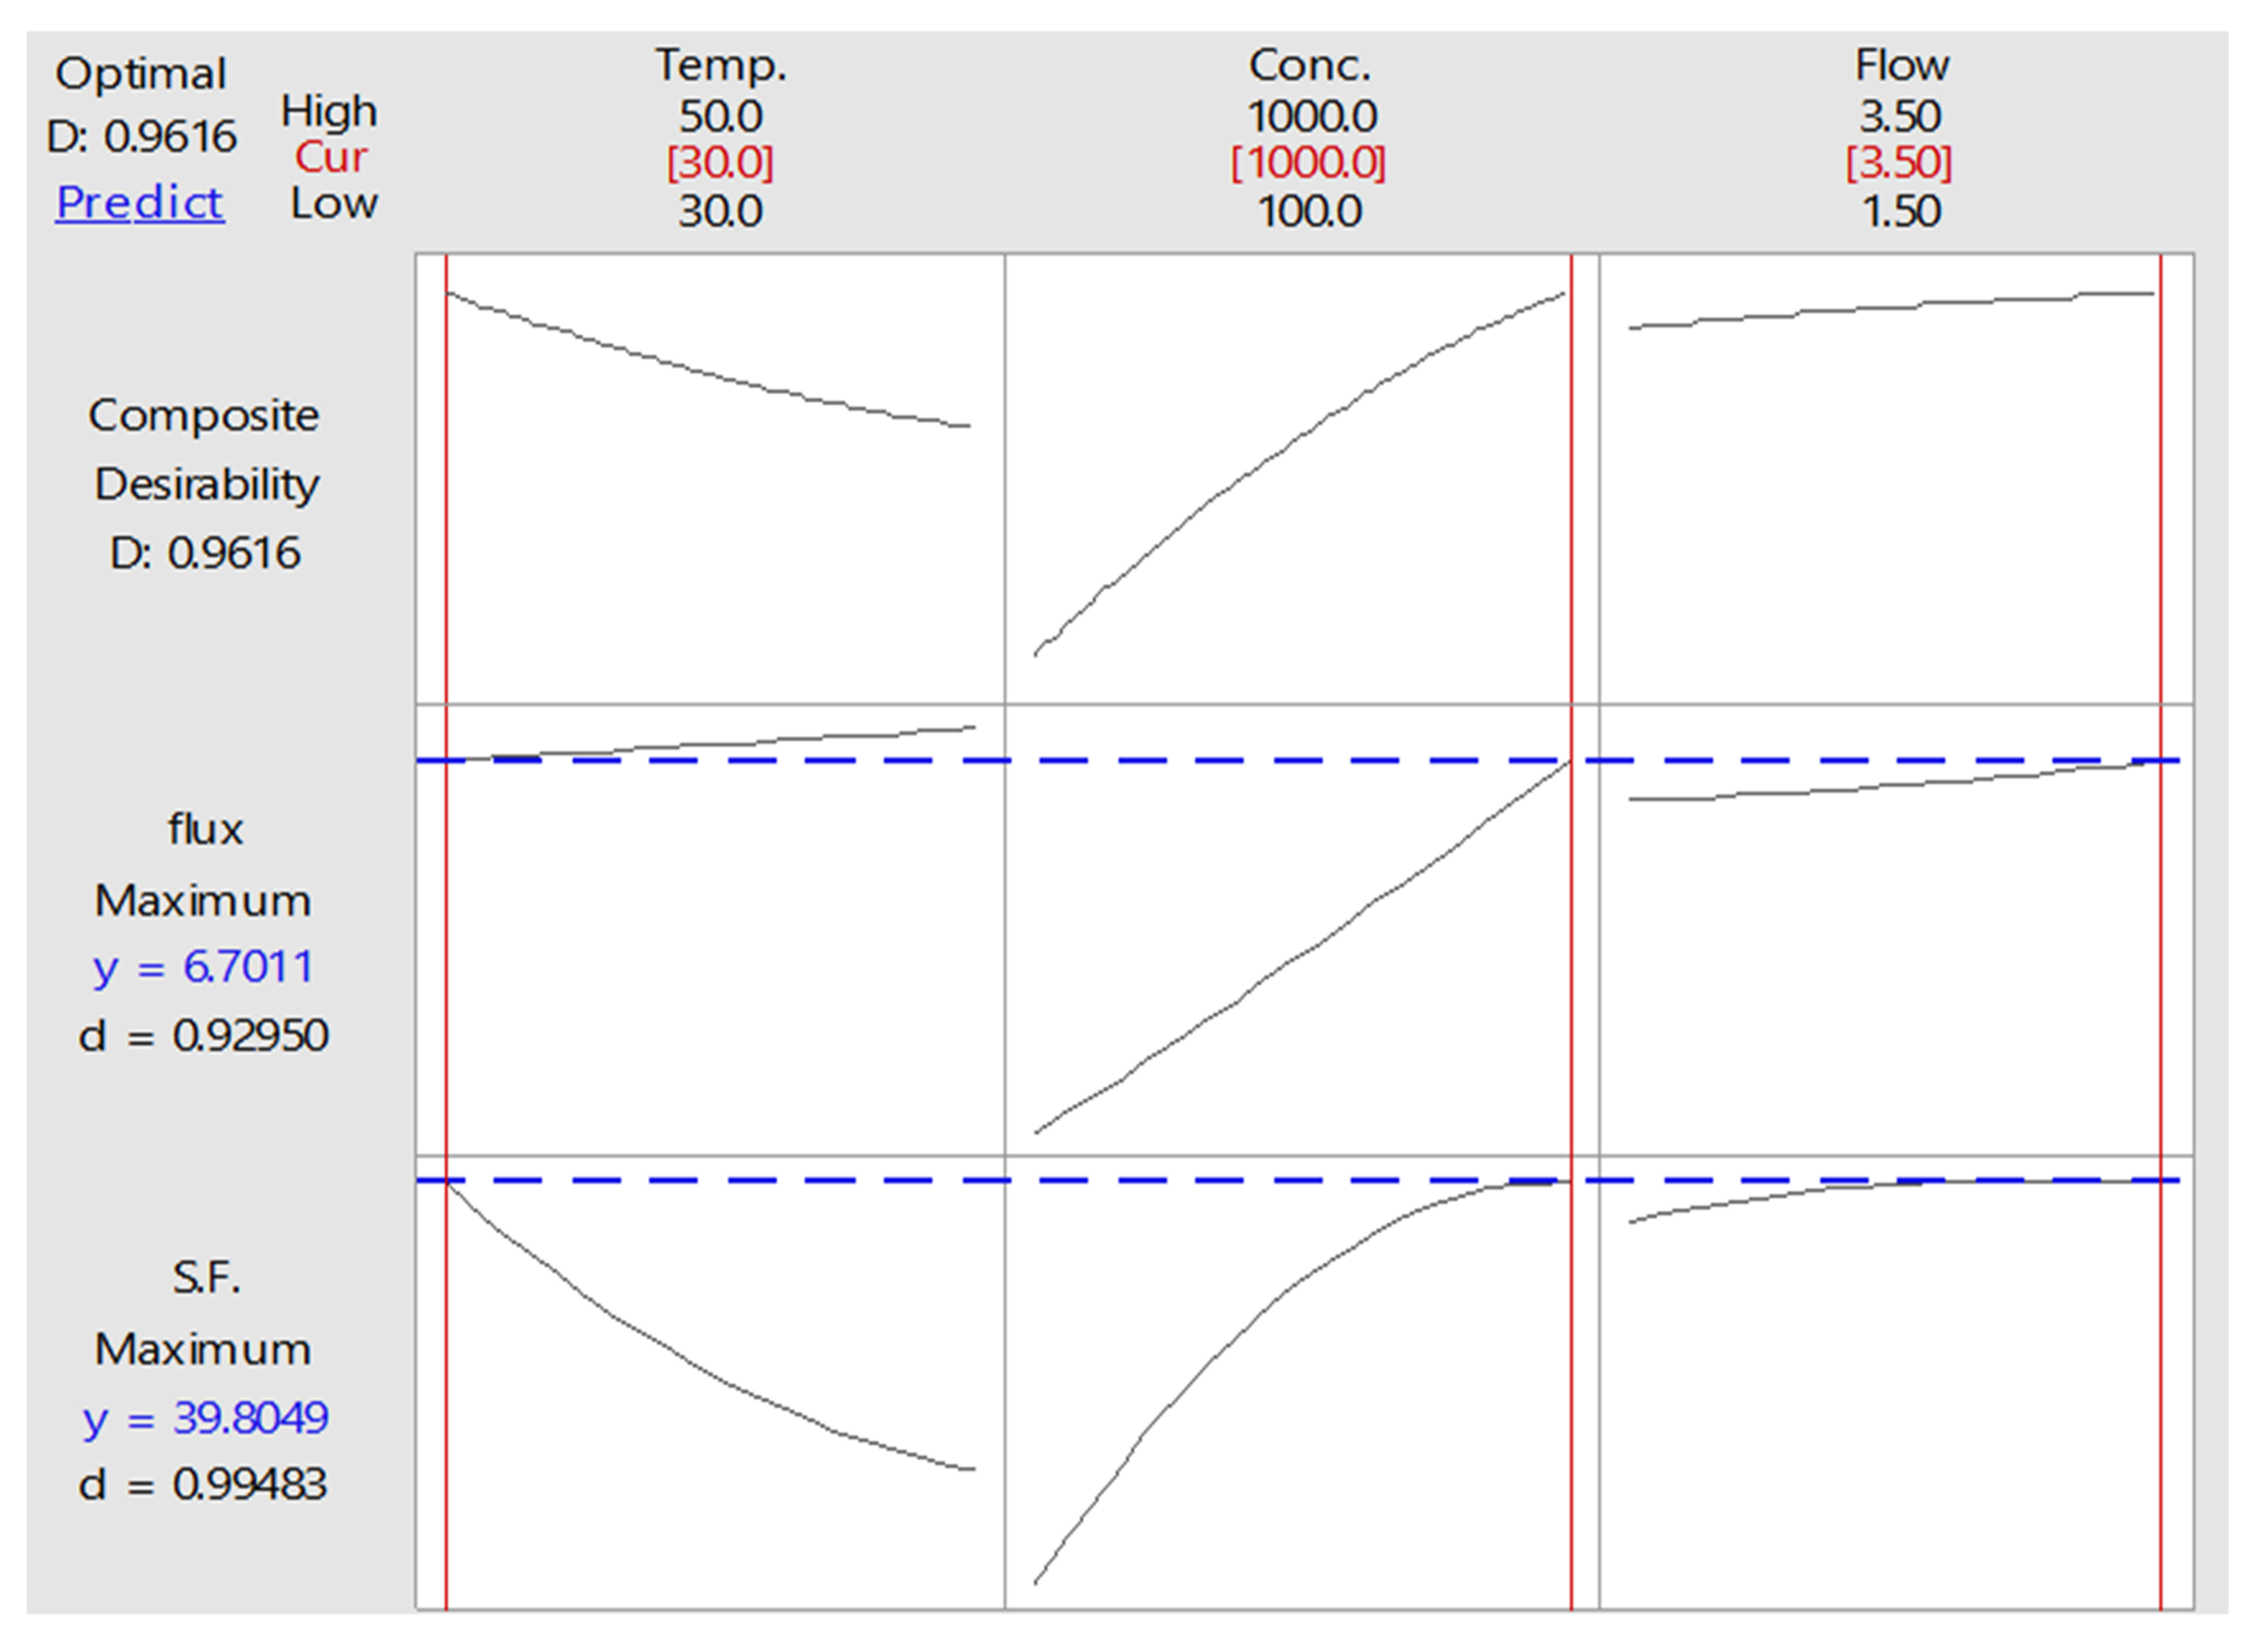
3.5.2. Optimization of PV Process

In the optimization of multiple response processes in the diverse field of applied science and engineering, the desirability function approach is one of the most widely used methods. This method combines the individual desirability of multiple responses into a single value ranging from 1.0 to 0. A value of 1 is the ideal case, so values nearer to 1 are the most desirable in terms of describing the optimal operating conditions. However, when this value is close to zero, it indicates that one or more responses fall outside the desirable limits [57,58,59,60,61,62,63]. Thus, by using Minitab 18, the calculation of the desirability function of the two present responses (the benzene flux and S.F) combined the individual desirability into a single number, as given in Table 8. This table identifies the best operating conditions studied (i.e., the temperature, concentration, and flow rate) because these three factors were estimated to have the greatest influence on maximizing the benzene permeation flux and separation factor. As such, Figure 8 and Table 8 show the results of the desirability function for the separation of benzene from the aqueous solution.

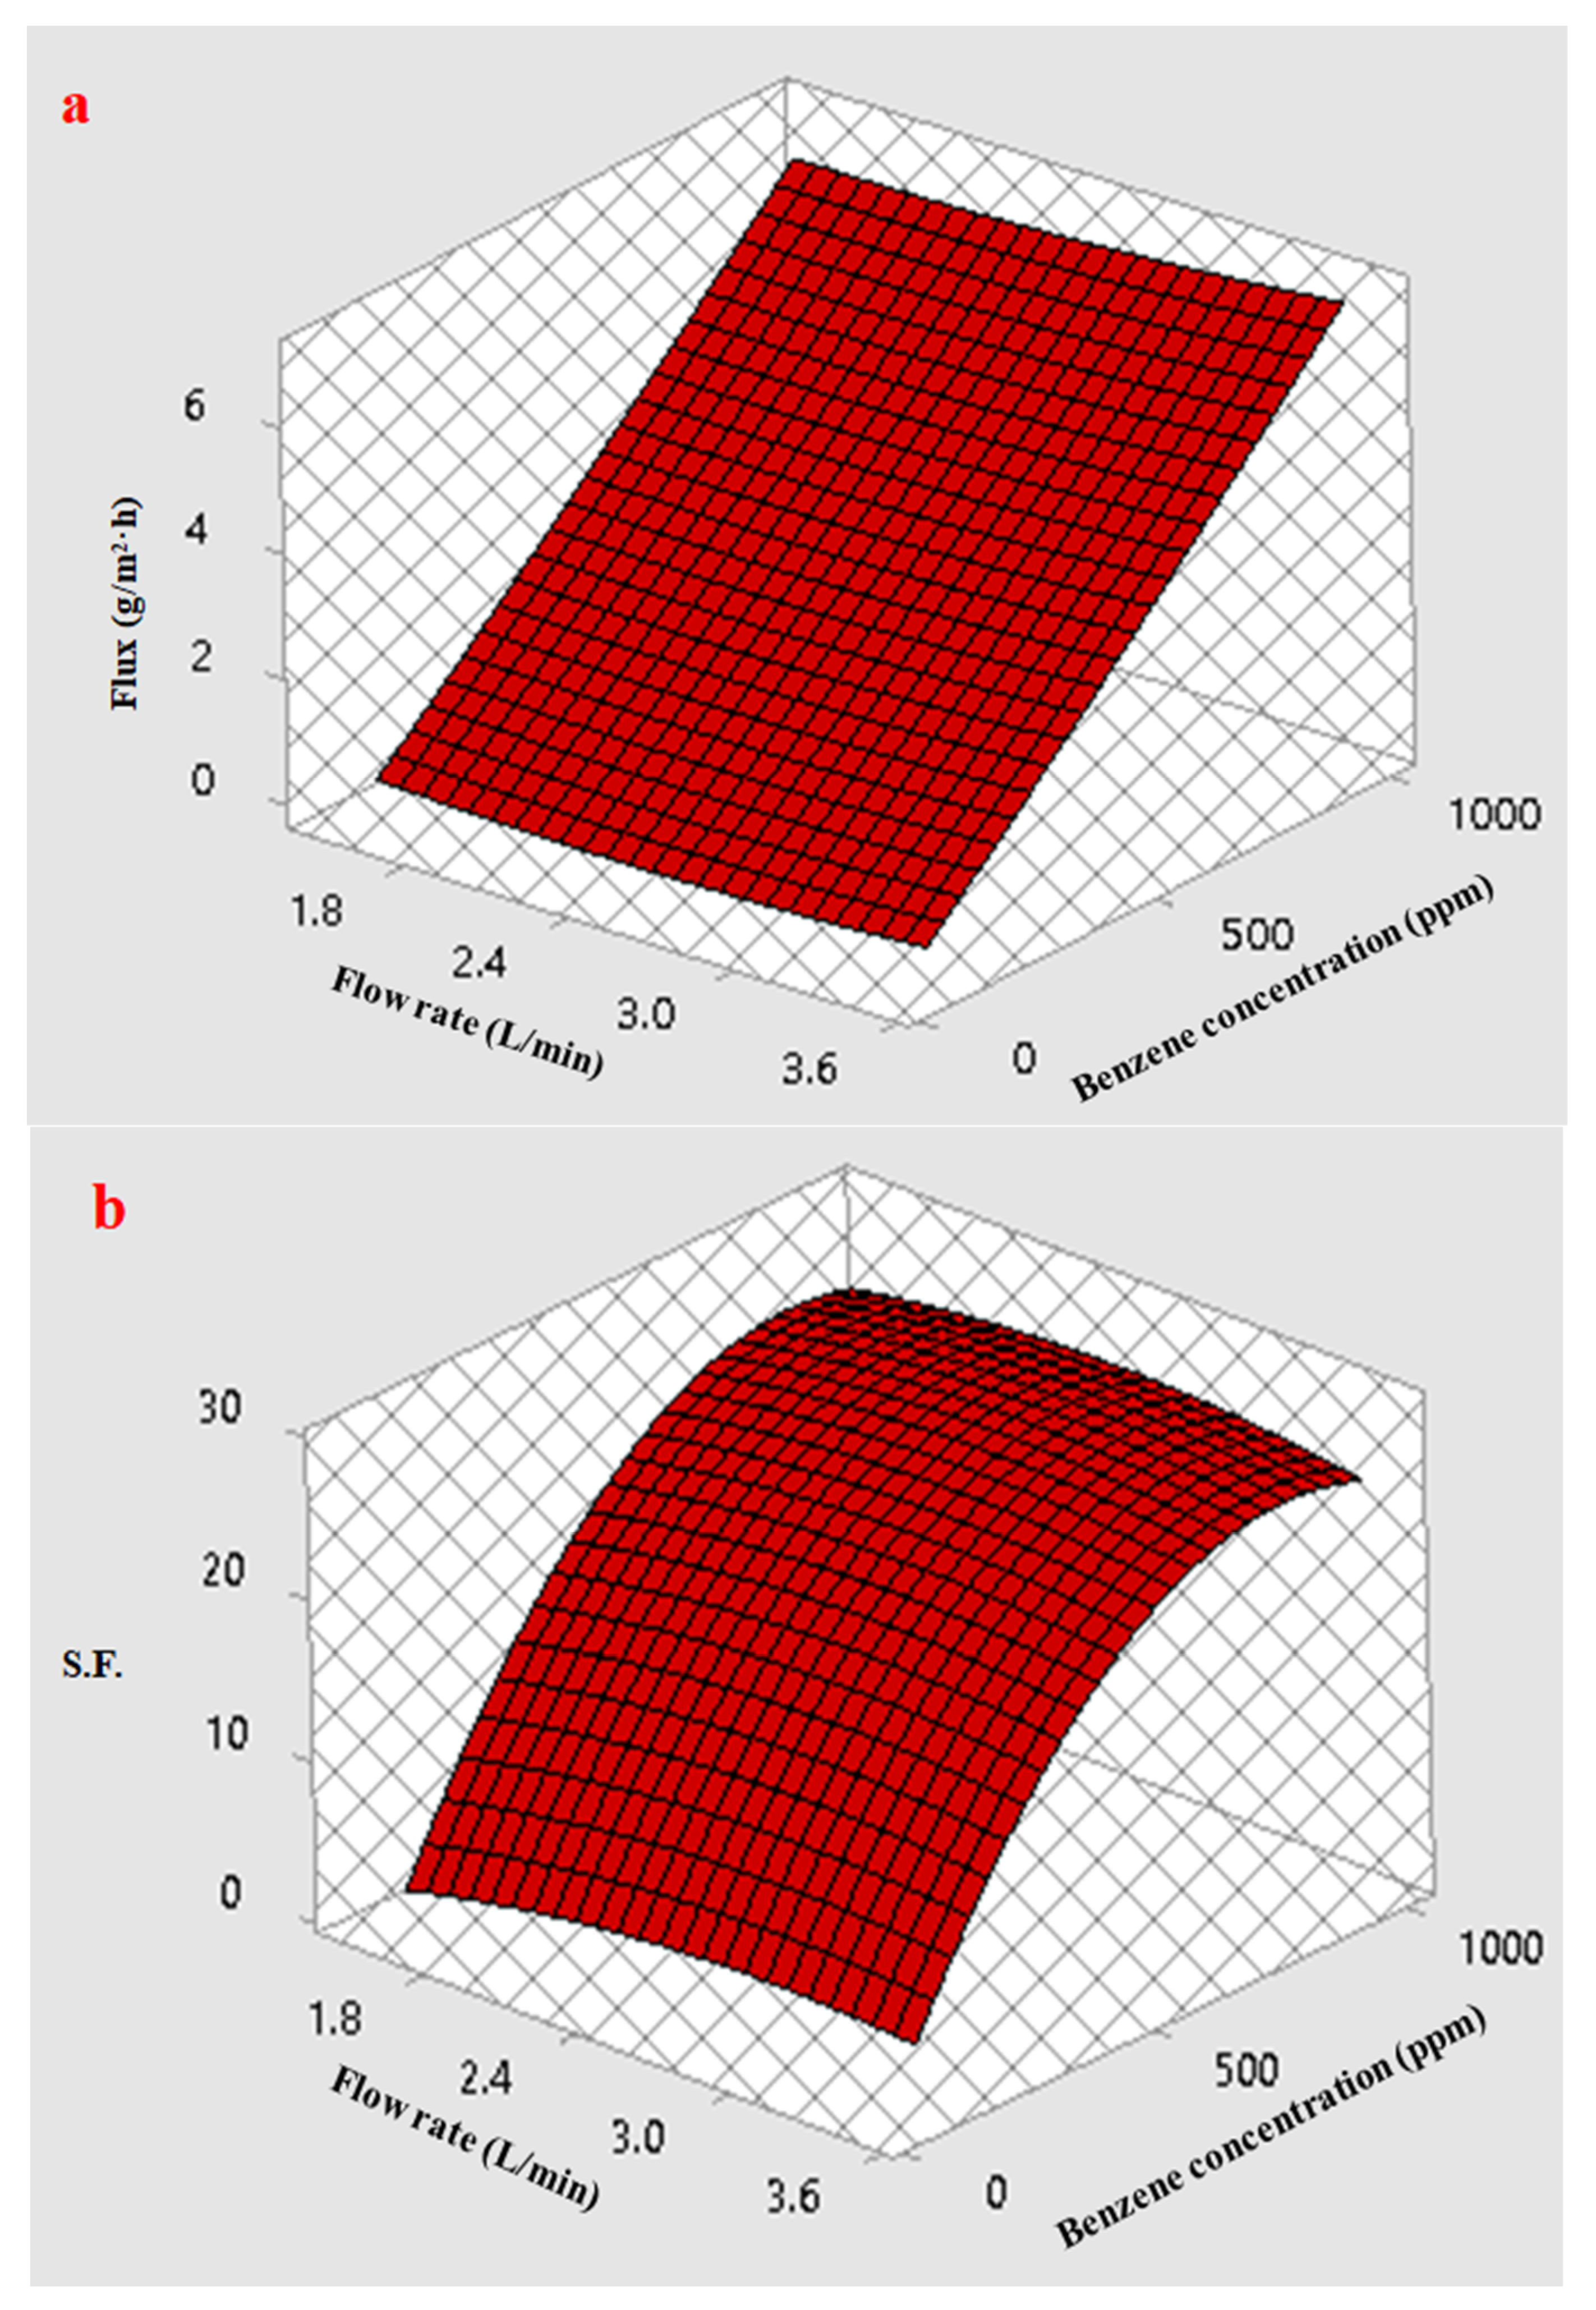
3.5.3. Response Surface Plots of Multiple Effects

Figure 9a presents the response surface plot that illustrates the effect of the initial benzene feed concentration and temperature on the benzene permeate flux. This figure shows that with increases in both the temperature of the feed and the initial benzene concentration the benzene permeation flux also increased. A rise in the temperature of the feed from 30 to 50 °C led to a slight improvement in the benzene flux, while an increase in the initial benzene concentration was more effective than the temperature of the feed and caused a clear increase in the benzene permeation flux.
The response surface plot in Figure 9b illustrates the effect of the initial benzene concentration in the feed as well as the effect of the feed temperature on the separation factor. Increasing the temperature led to an increase in the possibility of swelling of the membrane, which had a negative effect on the S.F. Thus, due to the swelling of the membrane when the temperature rose, the S.F. decreased, which means that the amount of water permeation through the membrane was greater than the benzene permeation; in contrast, an increase in the initial benzene concentration caused an increase in the S.F. The enhancement of the S.F. may be explained by the fact that the water molecules clustered due to the hydrogen bonding between the water molecules, which reduced their diffusivity and permeability. However, due to the interaction between the factors, an increase in the initial concentration of benzene in the feed improved the S.F. in spite of the temperature being higher.
The response surface plot in Figure 10a illustrates the effect of the feed flow and the feed temperature on the benzene flux. The benzene permeate flux increased linearly with temperature as a result of increasing the flexibility. However, the flexible character of PDMS, due to its shortage of double bonds, allows a high degree of rotation of the bonds, facilitating the diffusion of permeating species through the free volume, leading to an increase in the membrane permeability with temperature [50]. Moreover, the benzene permeate flux increased slightly with the flow rate of the feed because this reduced the boundary layer over the membrane surface. The influence of the feed flow rate was evident after increasing the feed temperature from 30 to 50 °C.
The response surface plot in Figure 10b illustrates the effect of the feed flow and the feed temperature on the S.F. for the benzene–water mixture. As mentioned previously, due to membrane swelling, there was a negative effect of temperature on the S.F. Thus, when the temperature was raised the S.F. decreased. As a result, the amount of benzene permeation through the membrane was lower than that of water, while an increased feed flow rate increased the S.F. by reducing the boundary layer thickness of the surface membrane. Because the resistance of the boundary layer against the mass transfer on the upstream membrane decreased, the permeation flux of benzene rose.
Figure 11a shows a three-dimensional display of the response surface plot for the benzene permeation flux with the coupling effect of the interaction between the feed concentration and the feed flow rate. Increasing the initial benzene concentration in the feed caused the benzene permeation flux to rise to a greater degree than did the feed flow rate. Generally, an increase in the benzene permeation flux results from the combined effect of an increase in the driving force (represented by the concentration difference across the membrane) and a weakening of the boundary layer adjacent to the membrane, where the total resistance against the permeation is composed of the boundary and membrane resistance. With an increase in the flow rate, the boundary layer thickness decreased, as did the boundary resistance.
The response surface plot in Figure 11b illustrates an effect of the initial concentration of benzene and the feed flow rate on the S.F. Increasing the benzene concentration in the feed increased the S.F. more than increasing the feed flow rate. This result may be explained by the fact that the water molecules clustered due to hydrogen bonding between water molecules, which reduced their diffusivity and permeability. However, increasing the initial concentration of benzene improved the S.F., even at a low feed flow rate.

4. Conclusions

Using PDMS membranes supplied by DeltaMem AG (Switzerland), soluble benzene was separated from water under various conditions of feed temperature, initial benzene concentration, and flow rate. This work evaluated the influences of these three factors on the permeate flux and separation factor. It was found that the flux increased with the temperature of the feed, the initial benzene concentration in the feed, and the feed flow rate, whereas the S.F. decreased with an increase in the feed temperature but rose with increases in the initial benzene concentration and feed flow rate. The separation of benzene compounds by the pervaporation process was studied using Minitab 18 and the RSM methodology. An analysis of variance and surface plots showed the combined effects of these factors on the permeate flux and separation factor and suggested a mathematical expression to calculate the flux and separation factor. Moreover, the optimized response was estimated based on composite desirability, where the feed temperature was 30 °C, the initial concentration of benzene was 1000 ppm, and the feed flow rate was 3.5 L/min. At these points, maximal output responses were both predicted and confirmed experimentally.

Author Contributions

Conceptualization, Q.F.A. and S.S.I.; methodology, Q.F.A., S.S.I. and S.H.R.; software, S.H.R.; validation, Q.F.A., S.S.I. and S.H.R.; formal analysis, Q.F.A., S.S.I. and S.H.R.; investigation, I.K.S. and S.H.R.; resources, I.K.S.; data curation, S.H.R.; writing—original draft preparation, S.S.I. and S.H.R.; writing—review and editing, Q.F.A., and S.S.I.; visualization, Q.F.A., S.S.I. and S.H.R.; supervision, Q.F.A., and S.S.I. All authors have read and agreed to the published version of the manuscript.

Funding

This research received no external funding.

Institutional Review Board Statement

Not applicable.

Informed Consent Statement

Not applicable.

Data Availability Statement

Not applicable.

Acknowledgments

The authors would like to thank the DeltaMem AG Company, Switzerland, and Wilfredo Yave for their support and for supplying the commercial membranes.

Conflicts of Interest

The authors of the current work do not have conflict of interest.

References

  1. Maddah, H.; Chogle, A. Biofouling in reverse osmosis: Phenomena, monitoring, controlling and remediation. Appl. Water Sci. 2017, 7, 2637–2651. [Google Scholar] [CrossRef] [Green Version]
  2. Kujawa, J.; Cerneaux, S.; Kujawski, W. Removal of hazardous volatile organic compounds from water by vacuum pervaporation with hydrophobic ceramic membranes. J. Membr. Sci. 2015, 474, 11–19. [Google Scholar] [CrossRef]
  3. Hömmerich, U.; Rautenbach, R. Design and optimization of combined pervaporation/distillation processes for the production of MTBE. J. Membr. Sci. 1998, 146, 53–64. [Google Scholar] [CrossRef]
  4. Sampranpiboon, P.; Jiraratananon, R.; Uttapap, D.; Feng, X.; Huang, R.Y.M. Pervaporation separation of ethyl butyrate and isopropanol with polyether block amide (PEBA) membranes. J. Membr. Sci. 2000, 173, 53–59. [Google Scholar] [CrossRef]
  5. Yoshida, W.; Cohen, Y. Removal of methyltert-butylether from water by pervaporation using ceramic-supported polymer membranes. J. Membr. Sci. 2004, 229, 27–32. [Google Scholar] [CrossRef]
  6. Zadaka-Amir, D.; Nasser, A.; Nir, S.; Mishael, Y.G. Removal of methyl tertiary-butyl ether (MTBE) from water by polymer-zeolite composites. Microporous Mesoporous Mater. 2012, 151, 216–222. [Google Scholar] [CrossRef]
  7. Zhou, K.; Zhang, Q.G.; Han, G.L.; Zhu, A.M.; Liu, Q.L. Pervaporation of water– ethanol and methanol–MTBE mixtures using poly(vinylalcohol)/cellulose acetate blended membranes. J. Membr. Sci. 2013, 448, 93–101. [Google Scholar] [CrossRef]
  8. Levchuk, I.; Bhatnagar, A.; Sillanpää, M. Overview of technologies for removal of methyl tert-butyl ether (MTBE) from water. Sci. Total Environ. 2014, 476–477, 415–433. [Google Scholar] [CrossRef]
  9. Rutkiewicz, I.; Kujawski, W.; Namiesnik, J. Pervaporation of volatile organohalogen compounds through polydimethylsiloxane membrane. Desalination 2010, 264, 160–164. [Google Scholar] [CrossRef]
  10. Perego, C.; Bagatin, R.; Tagliabue, M.; Vignola, R. Zeolites and related mesoporous materials for multi-talented environmental solutions. Microporous Mesoporous Mater. 2013, 166, 37–49. [Google Scholar] [CrossRef]
  11. Xia, S.; Dong, X.; Zhu, Y.; Wei, W.; Xiangli, F.; Jin, W. Dehydration of ethyl acetate-water mixtures using PVA/ceramic composite pervaporation membrane. Sep. Purif. Technol. 2011, 77, 53–59. [Google Scholar] [CrossRef]
  12. Peng, M.; Vane, L.M.; Liu, S.X. Recent advances in VOCs removal from water by pervaporation. J. Hazard. Mater. 2003, 98, 69–90. [Google Scholar] [CrossRef]
  13. Ortiz, I.; Urtiaga, A.; Ibáñez, R.; Gómez, P.; Gorri, D. Laboratory- and pilot plant-scale study on the dehydration of cyclohexane by pervaporation. J. Chem. Technol. Biotechnol. 2006, 81, 48–57. [Google Scholar] [CrossRef]
  14. Sadrzadeh, M.; Rezakazemi, M.; Mohammadi, T. Fundamentals and Measurement Techniques for Gas Transport in Polymers; Elsevier Inc.: Amsterdam, The Netherlands, 2018; ISBN 9780128098851. [Google Scholar]
  15. Shahverdi, M.; Baheri, B.; Rezakazemi, M.; Motaee, E.; Mohammadi, T. Pervaporation study of ethylene glycol dehydration through synthesized (PVA–4A)/polypropylene mixed matrix composite membranes. Polym. Eng. Sci. 2013, 53, 1487–1493. [Google Scholar] [CrossRef]
  16. Pearce, E.M. Kirk-Othmer encyclopedia of chemical technology, 3rd ed., Vol. I, Wiley-Interscience, New York, 1978. J. Polym. Sci. Part C Polym. Lett. 1978, 16, 248. [Google Scholar] [CrossRef]
  17. Malakar, S.; Saha, P.D. Estimation of VOC Emission in Petroleum Refinery ETP and Comparative Analysis with Measured VOC Emission Rate. Int. J. Eng. Sci. 2015, 4, 20–29. [Google Scholar]
  18. Maddah, H.A. Optimal operating conditions in designing photocatalytic reactor for removal of phenol from wastewater. ARPN J. Eng. Appl. Sci. 2016, 11, 1799–1802. [Google Scholar]
  19. Farhan, N.M.; Ibrahim, S.S.; Leva, L.; Yave, W.; Alsalhy, Q.F. The combination of a new PERVAPTM membrane and molecular sieves enhances the ethanol drying process. Chem. Eng. Process. Process Intensif. 2022, 174, 108863. [Google Scholar] [CrossRef]
  20. He, X.; Wang, T.; Huang, J.; Chen, J.; Li, J. Fabrication and characterization of superhydrophobic PDMS composite membranes for efficient ethanol recovery via pervaporation. Sep. Purif. Technol. 2020, 241, 116675. [Google Scholar] [CrossRef]
  21. Hamouni, S.; Arous, O.; Abdessemed, D.; Nezzal, G.; Bruggen, B. Van Der Alcohol and Alkane Organic Extraction Using Pervaporation Process. In Macromolecular Symposia; Wiley: Hoboken, NJ, USA, 2019. [Google Scholar] [CrossRef]
  22. Unlu, D. Concentration of aroma compounds by pervaporation process using polyvinyl chloride membrane. Flavour Fragr. J. 2019, 34, 493–505. [Google Scholar] [CrossRef]
  23. Kujawska, A.; Knozowska, K.; Kujawa, J.; Li, G.; Kujawski, W. Fabrication of PDMS based membranes with improved separation efficiency in hydrophobic pervaporation. Sep. Purif. Technol. 2020, 234, 116092. [Google Scholar] [CrossRef]
  24. Peng, P.; Lan, Y. Modified Silica Incorporating into PDMS Polymeric Membranes for Bioethanol Selection. Adv. Polym. Technol. 2019, 2019, 5610282. [Google Scholar] [CrossRef] [Green Version]
  25. Wang, Y.M.; Ma, X.; Xue, T.; Wu, C.; Ji, M.; Li, M.Y. Green recovery of hazardous acetonitrile from high-salt chemical wastewater by pervaporation. J. Clean. Prod. 2018, 197, 742–749. [Google Scholar] [CrossRef]
  26. Ye, H.; Yan, X.; Zhang, X.; Song, W. Pervaporation properties of oleyl alcohol - filled polydimethylsiloxane membranes for the recovery of phenol from wastewater. Iran. Polym. J. 2017, 26, 639–649. [Google Scholar] [CrossRef]
  27. Wu, Y.; Tan, H.; Li, D.; Jin, Y. Pervaporation of Aqueous Solution of Acetaldehyde Through ZSM-5 Filled PDMS Composite Membrane. Chin. J. Chem. Eng. 2012, 20, 625–632. [Google Scholar] [CrossRef]
  28. Aliabadi, M.; Aroujalian, A.; Raisi, A. Removal of styrene from petrochemical wastewater using pervaporation process. DES 2012, 284, 116–121. [Google Scholar] [CrossRef]
  29. Hilmioglu, N.D.; Yildirim, A.E.; Tulbentci, S. A Pervaporation Application for Treating Methyl tert-Butyl Ether (MTBE)-Contaminated Water/Wastewater. In Global Warming; Springer: Boston, MA, USA, 2010. [Google Scholar] [CrossRef]
  30. Khayet, M.; Cojocaru, C.; Zakrzewska-trznadel, G. Studies on pervaporation separation of acetone, acetonitrile and ethanol from aqueous solutions. Sep. Purif. Technol. 2008, 63, 303–310. [Google Scholar] [CrossRef]
  31. Uragami, T.; Matsuoka, Y.; Miyata, T. Removal of Dilute Benzene in Water through Ionic Liquid/Poly(Vinyl Chloride) Membranes by Pervaporation. 2016. Available online: www.msrjournal.com (accessed on 8 July 2015).
  32. Ohshima, T.; Matsumoto, M.; Miyata, T.; Uragami, T. Organic-inorganic hybrid membranes for removal of benzene from an aqueous solution by pervaporation. Macromol. Chem. Phys. 2005, 206, 473–483. [Google Scholar] [CrossRef]
  33. Peng, F.; Jiang, Z.; Hu, C.; Wang, Y.; Xu, H.; Liu, J. Removing benzene from aqueous solution using CMS-filled PDMS pervaporation membranes. Sep. Purif. Technol. 2006, 48, 229–234. [Google Scholar] [CrossRef]
  34. Salehi Shahrabi, S.; Mortaheb, H.R.; Barzin, J.; Ehsani, M.R. Pervaporative performance of a PDMS/blended PES composite membrane for removal of toluene from water. Desalination 2012, 287, 281–289. [Google Scholar] [CrossRef]
  35. Zhang, W.D.; Sun, W.; Yang, J.; Ren, Z.Q. The study on pervaporation behaviors of dilute organic solution through PDMS/PTFE composite membrane. Appl. Biochem. Biotechnol. 2010, 160, 156–167. [Google Scholar] [CrossRef]
  36. Cao, Z.; Xia, C.; Jia, W.; Qing, W.; Zhang, W. Enhancing bioethanol productivity by a yeast-immobilized catalytically active membrane in a fermentation-pervaporation coupling process. J. Membr. Sci. 2020, 595, 117485. [Google Scholar] [CrossRef]
  37. Li, S.; Qin, F.; Qin, P.; Karim, M.N.; Tan, T. Preparation of PDMS membrane using water as solvent for pervaporation separation of butanol-water mixture. Green Chem. 2013, 15, 2180–2190. [Google Scholar] [CrossRef]
  38. Wee, S.L.; Tye, C.T.; Bhatia, S. Process optimization studies for the dehydration of alcohol-water system by inorganic membrane based pervaporation separation using design of experiments (DOE). Sep. Purif. Technol. 2010, 71, 192–199. [Google Scholar] [CrossRef]
  39. Khayet, M.; Cojocaru, C.; Zakrzewska-Trznadel, G. Response surface modelling and optimization in pervaporation. J. Membr. Sci. 2008, 321, 272–283. [Google Scholar] [CrossRef]
  40. Catarino, M.; Ferreira, A.; Mendes, A. Study and optimization of aroma recovery from beer by pervaporation. J. Membr. Sci. 2009, 341, 51–59. [Google Scholar] [CrossRef]
  41. Kataoka, T.; Tsuru, T.; Nakao, S.I.; Kimura, S. Permeation equations developed for prediction of membrane performance in pervaporation, vapor permeation and reverse osmosis based on the solution-diffusion model. J. Chem. Eng. Jpn. 1991, 24, 326–333. [Google Scholar] [CrossRef] [Green Version]
  42. Lipnizki, F.; Trägårdh, G. Modelling of pervaporation: Models to analyze and predict the mass transport in pervaporation. Separation and Purification Methods. Sep. Purif. Methods 2001, 30, 45–125. [Google Scholar] [CrossRef]
  43. Knozowska, K.; Kujawska, A.; Li, G.; Kujawa, J.; Bryjak, M.; Kujawski, W.; Lipnizki, F.; Ahrn, L.; Petrini, I.; Kujawski, J.K. Membrane assisted processing of acetone, butanol, and ethanol (ABE) aqueous streams. Chem. Eng. Process.-Process Intensif. 2021, 166, 108462. [Google Scholar] [CrossRef]
  44. Safi, N.N.; Ibrahim, S.S.; Zouli, N.; Majdi, H.S.; Alsalhy, Q.F.; Drioli, E.; Figoli, A. A systematic framework for optimizing a sweeping gas membrane distillation (SGMD). Membranes 2020, 10, 254. [Google Scholar] [CrossRef]
  45. Rashid, K.T.; Rahman, S.B.A.; Alsalhy, Q.F. Optimum Operating Parameters for Hollow Fiber Membranes in Direct Contact Membrane Distillation. Arab. J. Sci. Eng. 2016, 41, 2647–2658. [Google Scholar] [CrossRef]
  46. Myers, R.H.; Montgomery, D.C.; Anderson-Cook, C.M. Response Surface Methodology: Process and Product Optimization Using Designed Experiments; John Wiley Sons: New York, NY, USA, 2002. [Google Scholar]
  47. Fadhil, S.; Alsalhy, Q.F.; Makki, H.F.; Ruby-Figueroa, R.; Marino, T.; Criscuoli, A.; Macedonio, F.; Giorno, L.; Drioli, E.; Figoli, A. Seawater desalination using PVDF-HFP membrane in DCMD process: Assessment of operating condition by response surface method. Chem. Eng. Commun. 2019, 206, 237–246. [Google Scholar] [CrossRef]
  48. Yahaya, G.O. Separation of volatile organic compounds (BTEX) from aqueous solutions by a composite organophilic hollow fiber membrane-based pervaporation process. J. Membr. Sci. 2008, 319, 82–90. [Google Scholar] [CrossRef]
  49. World Health Organization (WHO). Background Document for Development of WHO Guidelines for Drinking-Water Quality, 2nd ed.; WHO: Geneva, Switzerland, 1996. [Google Scholar]
  50. Basile, A.; Figoli, A.; Khayet, M. Pervaporation, Vapour Permeation and Membrane Distillation: Principles and Applications; Elsevier: Amsterdam, The Netherlands, 2015; ISBN 9781782422563. [Google Scholar]
  51. Feng, X.; Huang, R.Y.M. Separation of isopropanol from water by pervaporation using silicone-based membranes. J. Membr. Sci. 1992, 74, 171–181. [Google Scholar] [CrossRef]
  52. Peng, F.; Pan, F.; Li, D.; Jiang, Z. Pervaporation properties of PDMS membranes for removal of benzene from aqueous solution: Experimental and modeling. Chem. Eng. J. 2005, 114, 123–129. [Google Scholar] [CrossRef]
  53. Wu, H.; Liu, L.; Pan, F.; Hu, C.; Jiang, Z. Pervaporative removal of benzene from aqueous solution through supramolecule calixarene filled PDMS composite membranes. Sep. Purif. Technol. 2006, 51, 352–358. [Google Scholar] [CrossRef]
  54. Uragami, T.; Ohshima, T.; Miyata, T. Removal of benzene from an aqueous solution of dilute benzene by various cross-linked poly(dimethylsiloxane) membranes during pervaporation. Macromolecules 2003, 36, 9430–9436. [Google Scholar] [CrossRef]
  55. Kansara, A.M.; Jadav, G.L.; Chaudhri, S.G.; Singh, P.S. Preparation of Poly(dimethylsiloxane)-Polysulfone Composite Membrane by Sequential Absorption-Reaction-Evaporation Process and its Application in Treatment of Aqueous Solution Containing Volatile Organics. Sep. Sci. Technol. 2014, 49, 2834–2846. [Google Scholar] [CrossRef]
  56. Jadav, G.L.; Aswal, V.K.; Bhatt, H.; Chaudhari, J.C.; Singh, P.S. Influence of film thickness on the structure and properties of PDMS membrane. J. Membr. Sci. 2012, 415–416, 624–634. [Google Scholar] [CrossRef]
  57. Akhnazarova, S.; Kafarov, V. Experiment Optimization in Chemistry and Chemical Engineering; Mir publishers: Moscow, Russia, 1982. [Google Scholar]
  58. Chakraborty, S.; Bordoloi, R. Concurrent optimisation of a computer vision system’s multiple responses. Int. J. Adv. Manuf. Technol. 2006, 28, 577–583. [Google Scholar] [CrossRef]
  59. Hsu, C.M.; Su, C.T.; Liao, D. Simultaneous optimisation of the broadband tap coupler optical performance based on neural networks and exponential desirability functions. Int. J. Adv. Manuf. Technol. 2004, 23, 896–902. [Google Scholar] [CrossRef]
  60. Cuetos, M.J.; Gómez, X.; Escapa, A.; Morán, A. Evaluation and simultaneous optimization of bio-hydrogen production using 32 factorial design and the desirability function. J. Power Sources 2007, 169, 131–139. [Google Scholar] [CrossRef]
  61. Pasandideh, S.H.R.; Niaki, S.T.A. Multi-response simulation optimization using genetic algorithm within desirability function framework. Appl. Math. Comput. 2006, 175, 366–382. [Google Scholar] [CrossRef]
  62. Ferreira, S.L.C.; Bruns, R.E.; Ferreira, H.S.; Matos, G.D.; David, J.M.; Brandão, G.C.; da Silva, E.G.P.; Portugal, L.A.; dos Reis, P.S.; Souza, A.S.; et al. Box-Behnken design: An alternative for the optimization of analytical methods. Anal. Chim. Acta 2007, 597, 179–186. [Google Scholar] [CrossRef]
  63. Pasamontes, A.; Callao, P. Fractional factorial design and simplex algorithm for optimizing sequential injection analysis (SIA) and second order calibration. Chemom. Intell. Lab. Syst. 2006, 83, 127–132. [Google Scholar] [CrossRef]
Figure 1. Schematic diagram of the pervaporation process.
Membranes 12 01040 g001
Figure 2. (a) Contact angle of PDMS membrane and SEM image of PDMS membrane cross section (200 µm). (b) SEM image of PDMS membrane surface.
Membranes 12 01040 g002
Figure 3. (a) FTIR spectra of PDMS membranes. (b) EDS analysis of PDMS membranes.
Membranes 12 01040 g003
Figure 4. Effect of temperature on (a) the fluxes of benzene and water and (b) the separation factor, at an initial benzene feed concentration of 500 ppm and a 3 L/min feed flow rate.
Membranes 12 01040 g004
Figure 5. Effect of the initial benzene feed concentration on (a) the flux of benzene and water and (b) the separation factor at a feed temperature of 30 °C and a 3 L/min feed flow rate.
Membranes 12 01040 g005aMembranes 12 01040 g005b
Figure 6. Effect the feed flow rate on (a) the fluxes of benzene and water and (b) the separation factor at a 500 ppm initial benzene feed concentration and a 30 °C feed temperature.
Membranes 12 01040 g006
Figure 7. The relationship between the actual and predicted (a) benzene flux and (b) S.F.
Membranes 12 01040 g007
Figure 8. Optimization plot for benzene flux and S.F. for benzene–water solution.
Membranes 12 01040 g008
Figure 9. Effect of the feed temperature and the benzene concentration on (a) benzene flux and (b) separation factor (S.F.) at a feed flow rate 2.5 L/min.
Membranes 12 01040 g009aMembranes 12 01040 g009b
Figure 10. Effect of the feed temperature and feed flow on (a) benzene flux and (b) Separation factor (S.F.) at an initial benzene concentration of 550 ppm.
Membranes 12 01040 g010
Figure 11. Effect of the feed flow and concentration on (a) benzene flux and (b) Separation factor (S.F.) at a temperature of 40 °C.
Membranes 12 01040 g011
Table 1. The performance of previous PV processes using PDMS membranes for the recovery of various VOCs from aqueous solutions.
MembraneThAL
(µm)
ThSL
(µm)
VOCsT
(°C)
Con.PressureVOCs Flux (g/m2 h)S.F.Ref.
PDMS87.5 ± 10.3NoneEthanol305 %wt.@1110[23]
PDMS_plasma_C8126.5 ± 6.2None87
(PDMS)-NaCl167.5 ± 5.6None1311
PDMS_Al2O3_nat85.8 ± 11.2None1010
PDMS_Al2O3_mod._C8129.5 ± 10.9None2111
PDMS/PVDF177.3 ± 13.22489
PDMS (PervapTM4060)5.51782019
PDMS@@Acetonitrile405913 ppm4–15 mbar31.5628.2[25]
PDMS250NonePhenol400.5
%wt.
200 Pa415[26]
7073
PDMS + oleyl alcohol (5%)4033.5
70116.5
PDMS (PervapTM4060)5169Acetone303 %wt.5.5 kPa2.7100[30]
608.430
Acetonitrile301.211
604.210
Ethanol300.35
601.24
PDMS + PES20200Toluene30150 ppm1 mbar3.52200[34]
50300 ppm7.51300
PDMS + PTFE3515Acetone300.99 %wt.15 mmHg8
(kg µm /m2 h)
55[35]
Butanone10125
Cyclohexane685
Ethanol65
Isopropanol715
n-butyl alcohol940
Acetic acid62.5
Ethyl acetate1490
PDMS + PVDF3225Ethanol359 %wt.10 mmHg3676.6[36]
PDMS30NoneButanol551.5 %wt. 24043[37]
ThAL (thickness of active layer); ThSL (thickness of support layer); Con. (concentration); @ (unknown); S.F. (separation factor); PDMS (polydimethylsiloxane); PES (polyethersulfune); PVDF (polyvinylidene fluoride); PTFE (polytetrafluoroethylene).
Table 2. The performance of the present and previous PV processes for benzene recovery from an aqueous solution.
MembraneThAL
(µm)
ThSL
(µm)
T
(°C)
Con.PressureC6H6 Flux
(g/m2 h)
S.F.Ref.
PDMS140–200 None60750 ppm0.2 kPa1809000[52]
PDMS200None601400 ppm1–10 kPa1263302[53]
CA-f-PDMS 1501165604
PDMS (composite) 1001003654600
CA-f-PDMS composite 504075913
PDMS + DMMA 270None40500 ppm0.01 mmHg51.41853[54]
PDMS + DVB 31445.53099
PDMS + DVS 27670.92886
PDMS + EGDM 35749.62011
PDMS + PES11None25150ppm5 mbar66972[55]
PDMS + PES0.214025Benzene 2 %wt.
+
Methanol
50 %wt.
in water
@4.21[56]
0.571.5
26.42.5
374
87.37.5
358.115
1501020
PDMS (PervapTM4060)5.5178301000
ppm
2 kPa7.547The present work
ThAL (thickness of active layer); ThSL (thickness of support layer); Con. (concentration); @ (unknown); S.F. (separation factor); PDMS (polydimethylsiloxane); PES (polyethersulfune); DMMA (dimethyl methacrylate macromonomer); DVB (divinylbenzene); DVS (divinylsiloxane); EGDM (ethylene glycol dimethyl methacrylate); CA (calixarene).
Table 3. Experimental data points and responses.
Std OrderTemp.
(°C)
Conc.
(ppm)
Flow Rate
(L/min)
Flux
(g/m2·h)
S.F.
6501003.50.244426.5231
124010002.56.5381823.7613
17405502.53.2091723.7200
1301001.50.057332.2940
10505502.53.4000018.8843
9305502.53.0000032.3700
14405503.53.5000020.0000
45010001.57.0586719.7256
13405501.53.1240221.2793
33010001.56.0000036.9546
16405502.53.2091723.7200
20405502.53.2091723.7200
15405502.53.2091723.7200
19405502.53.2091723.7200
5301003.50.183338.8097
11401002.50.085834.1221
2501001.50.200356.2494
18405502.53.2091723.7200
73010003.56.7733340.0000
Table 4. The coefficients in Equations (4) and (5).
A0A1A2A3A4A5A6A7A8A9
J B −0.6620.01344.66 × 10−30.2360.001251 × 10−60.12453.6 × 10−5−0.008860.000208
S . F . 26−2.4670.1160113.340.03609−4 × 10⁻⁵−1.378−0.0011−0.1247−0.00123
Table 5. Analysis of variance for benzene permeate flux.
SourceDFAdj SSAdj MSF-Valuep-Value
Model9108.87112.0972393.220.000
Linear3108.26336.0887139.590.000
Temp.10.4390.43986.790.000
Conc.1107.610107.61021289.470.000
Flow10.2150.21542.500.000
Square30.2680.08917.650.000
Temp. × Temp.10.0000.0000.090.776
Conc. × Conc.10.0430.0438.440.016
Flow × Flow10.0430.0438.440.016
2-Way Interaction30.3400.11322.410.000
Temp. × Conc.10.2070.20740.910.000
Temp. × Flow10.0630.06312.430.005
Conc. × Flow10.0700.07013.900.004
Error100.0510.005--
Lack-of-Fit50.0510.010--
Pure Error50.0000.000--
Total19108.921---
DF = Degrees of freedom, Adj SS = Sum of squares, Adj MS = Mean square, × means the multiplication sign.
Table 6. Analysis of variance for separation factor.
SourceDFAdj SSAdj MSF-Valuep-Value
Model91975.38219.4980.030.000
Linear31499.05499.68182.190.000
Temp.1250.10250.1091.190.000
Conc.11242.761242.76453.120.000
Flow16.196.192.260.164
Square3262.8187.6031.940.000
Temp. × Temp.135.8235.8213.060.005
Conc. × Conc.1179.37179.3765.400.000
Flow × Flow15.225.221.900.198
2-Way Interaction3213.5271.1725.950.000
Temp. × Conc.1198.62198.6272.420.000
Temp. × Flow112.4412.444.540.059
Conc. × Flow12.462.460.900.366
Error1027.432.74--
Lack-of-Fit527.435.49--
Pure Error50.000.00--
Total192002.81---
Table 7. Model summary for benzene permeate flux and separation factor.
ParametersStand. Dev.R2R2(adj)R2(pred)
Permeate flux0.071095799.95%99.91%99.11%
Separation factor1.6561198.63%97.40%90.47%
Table 8. Response optimization of benzene flux and S.F. for benzene–water solution.
Temp.
(°C)
Conc.
(ppm)
Flow
(L/min.)
S.F.FitFlux Fit
(g/m2·h)
Composite
Desirability
3010003.539.80496.701110.961608
Publisher’s Note: MDPI stays neutral with regard to jurisdictional claims in published maps and institutional affiliations.

