
Analysis of Influencing Factors on the Gas Separation Performance of Carbon Molecular Sieve Membrane Using Machine Learning Technique


Abstract
:1. Introduction
2. Computational Methods
2.1. Data Collection
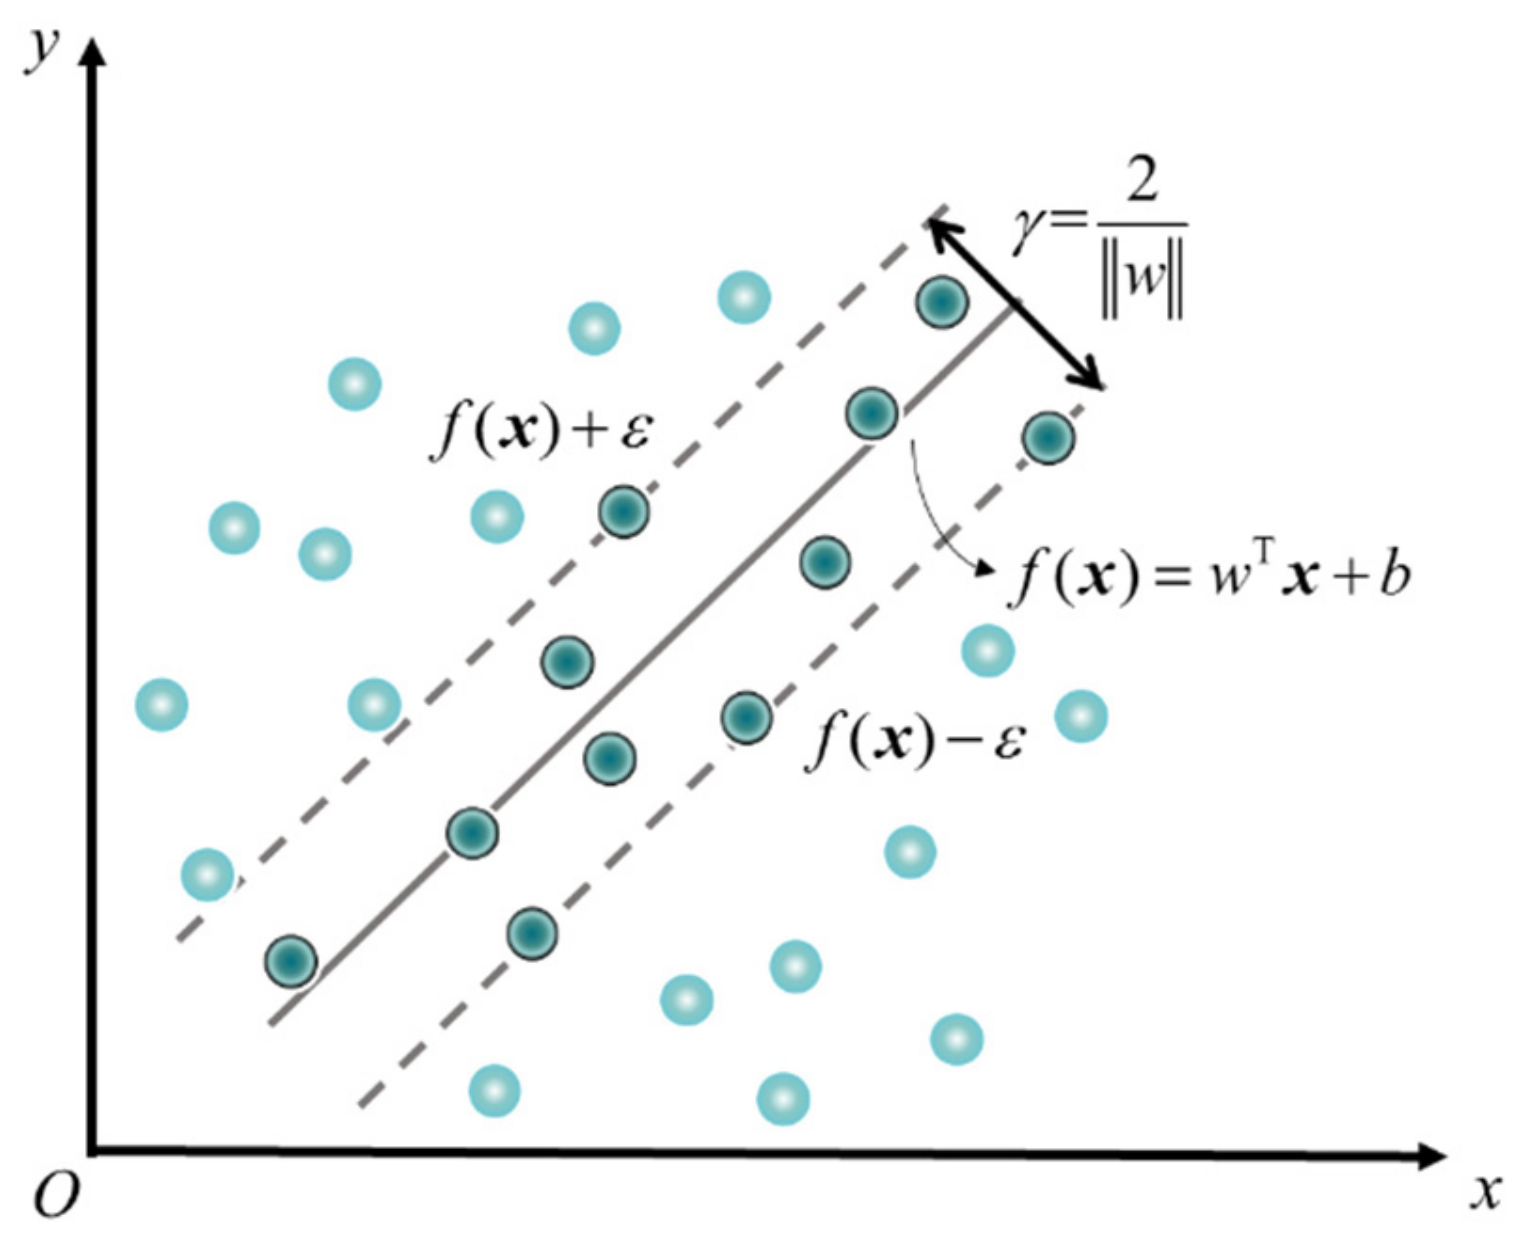
2.2. SVR Theorem
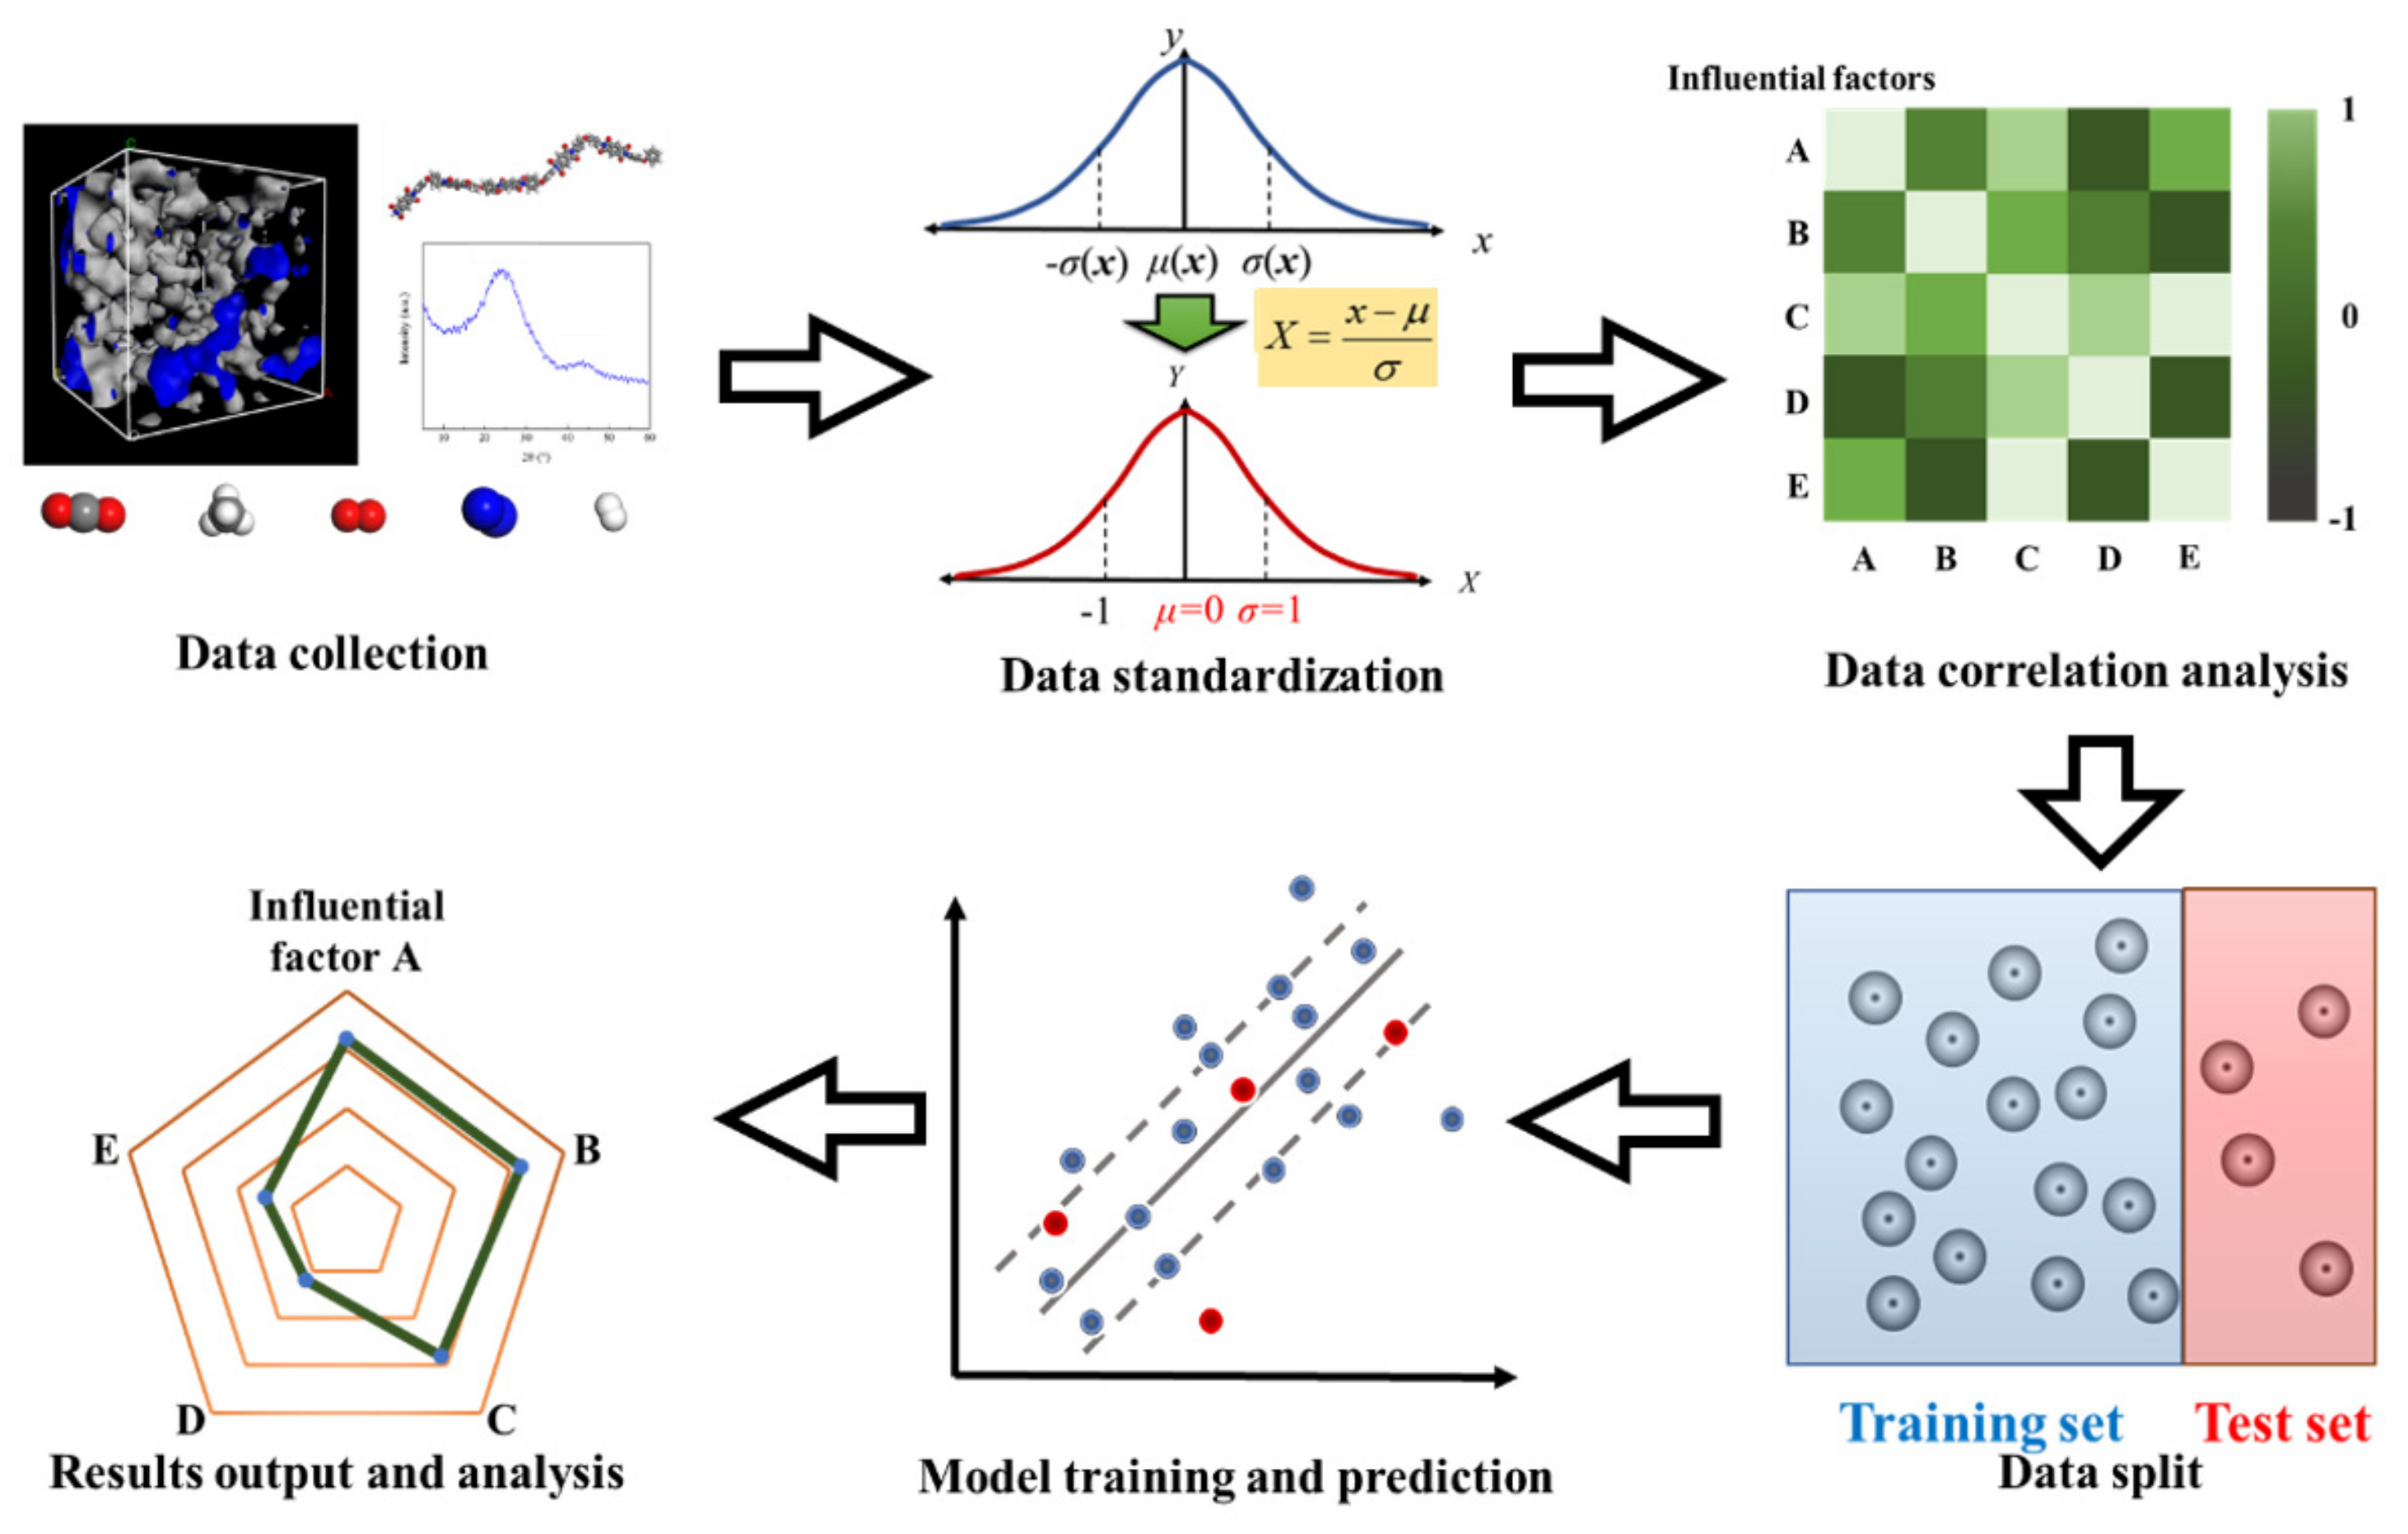
3. Analyzing Process of Influencing Factors
4. Results and Discussion
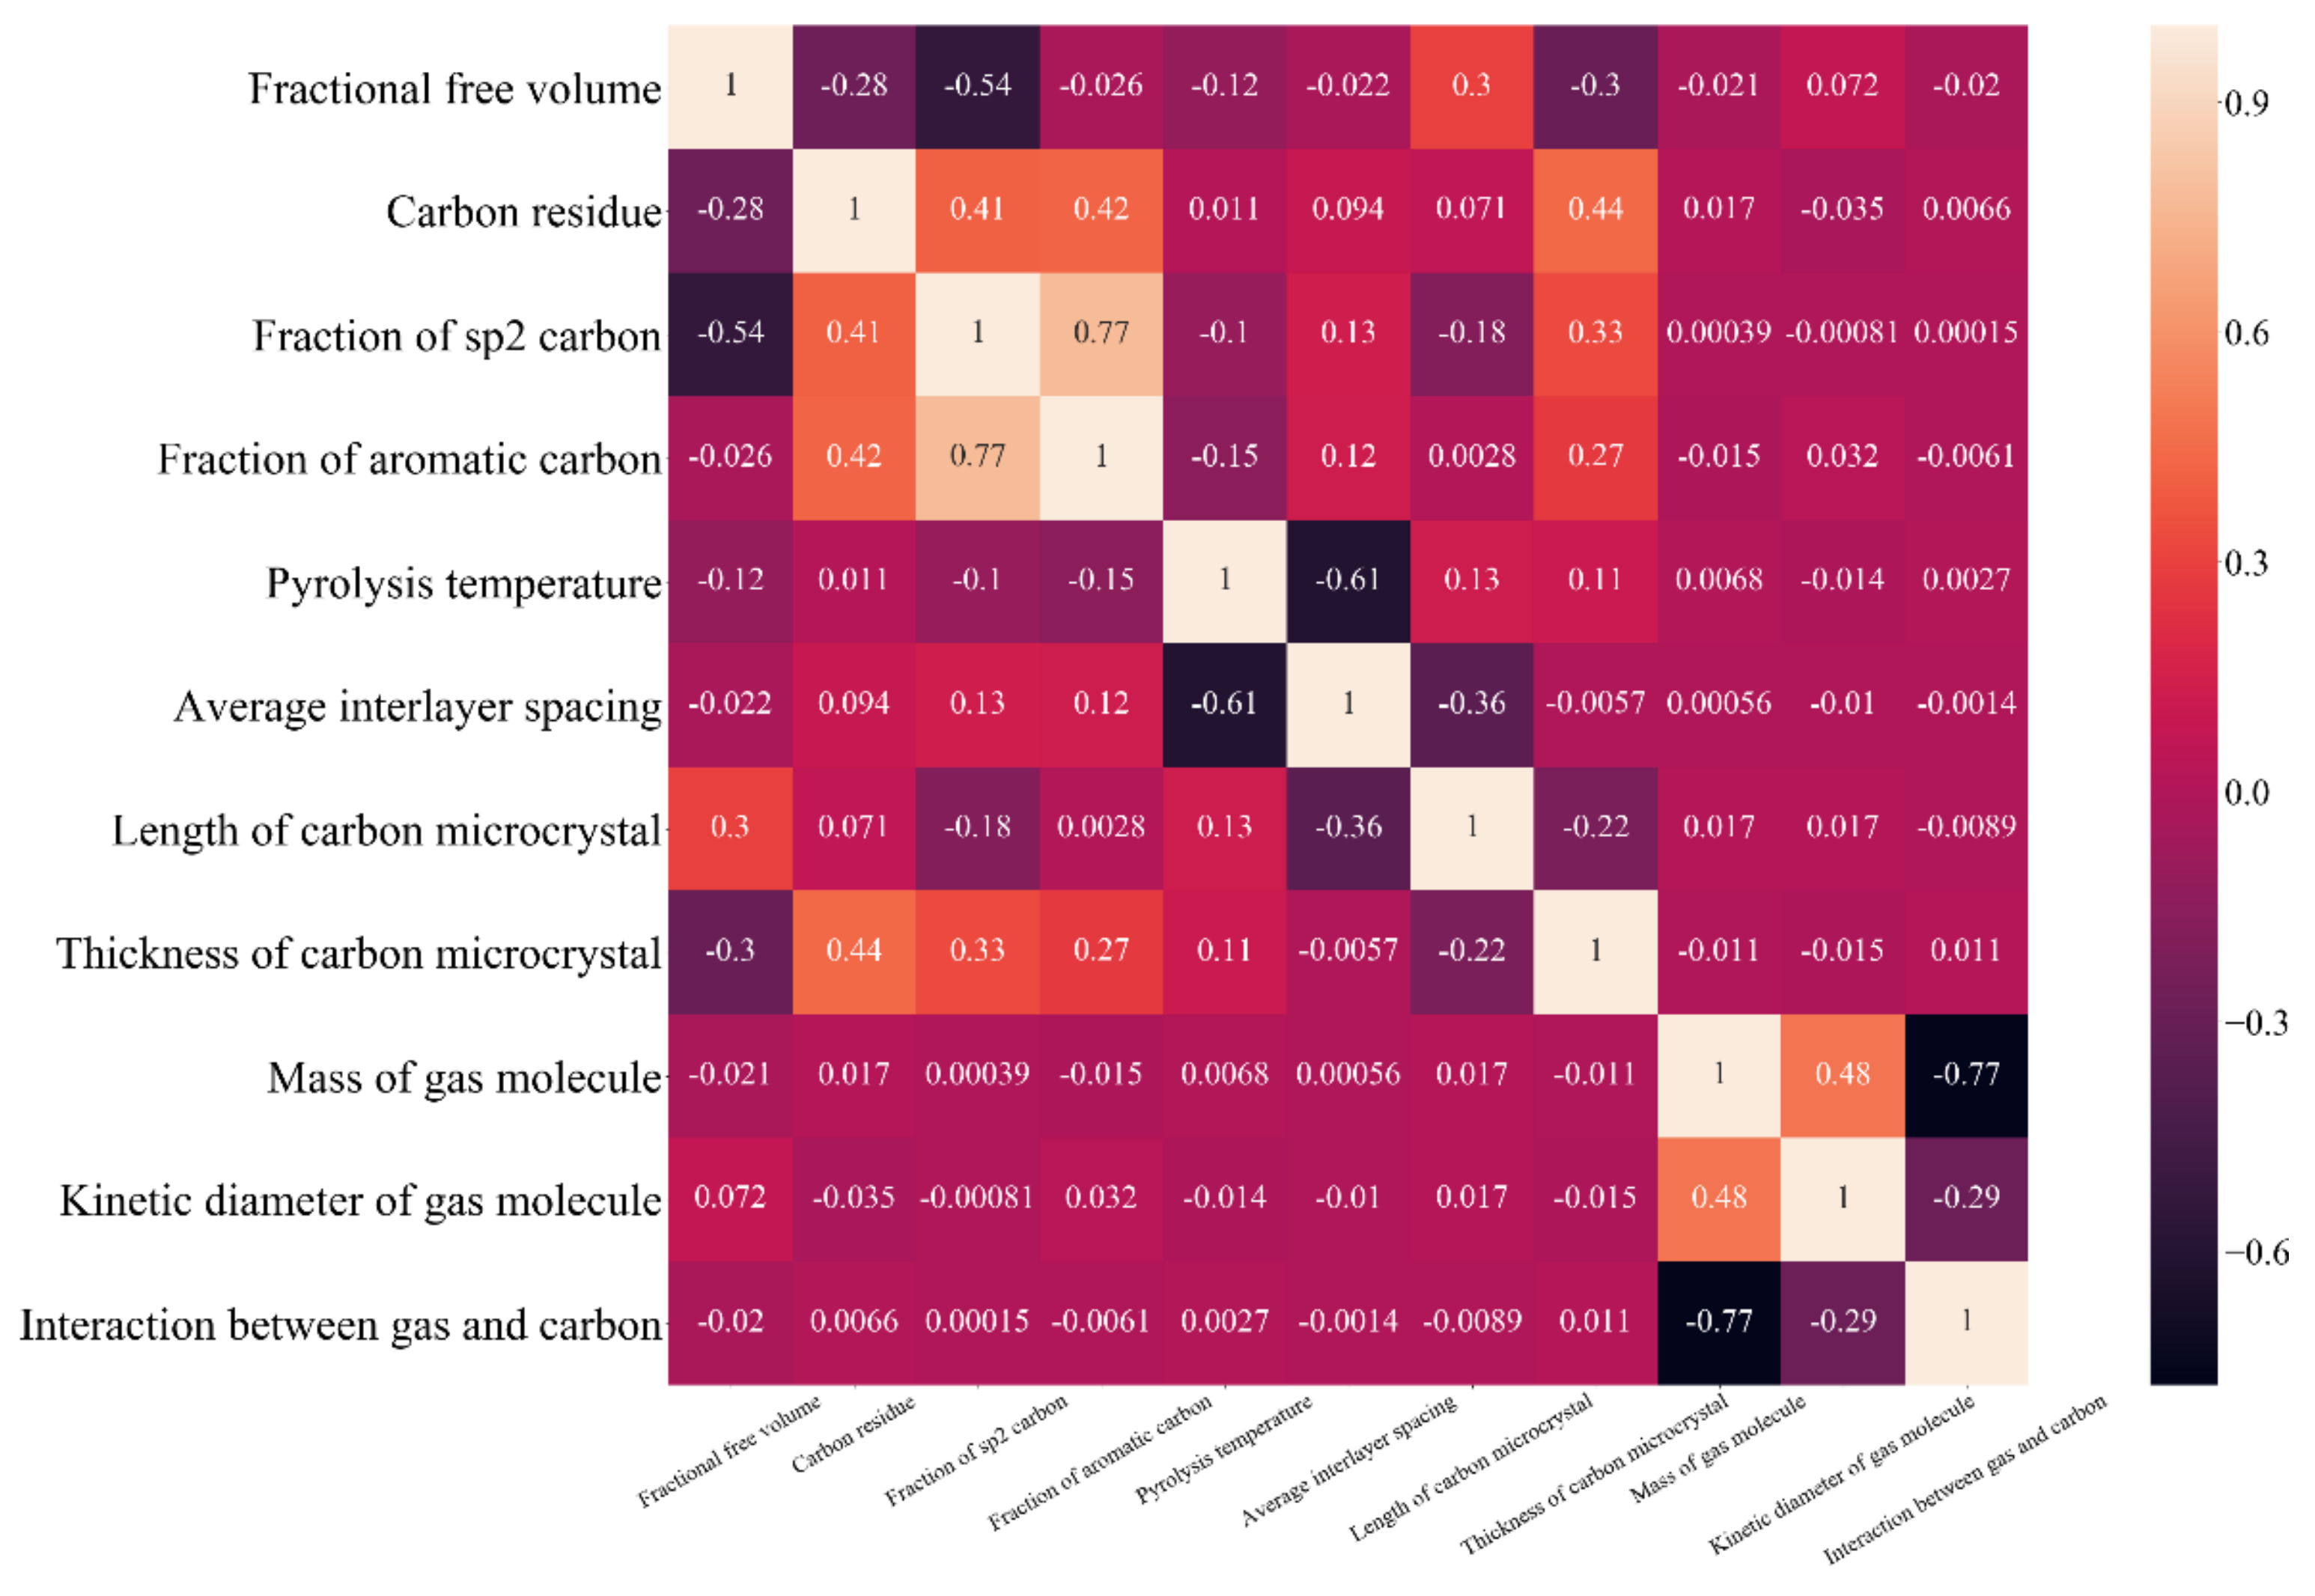
4.1. Correlation Analysis on the Independent Variables
4.2. Model Reliability and Parameter Optimization
4.3. Analysis of the Influencing Factors
4.3.1. Factors Influencing Gas Permeability
- 1.
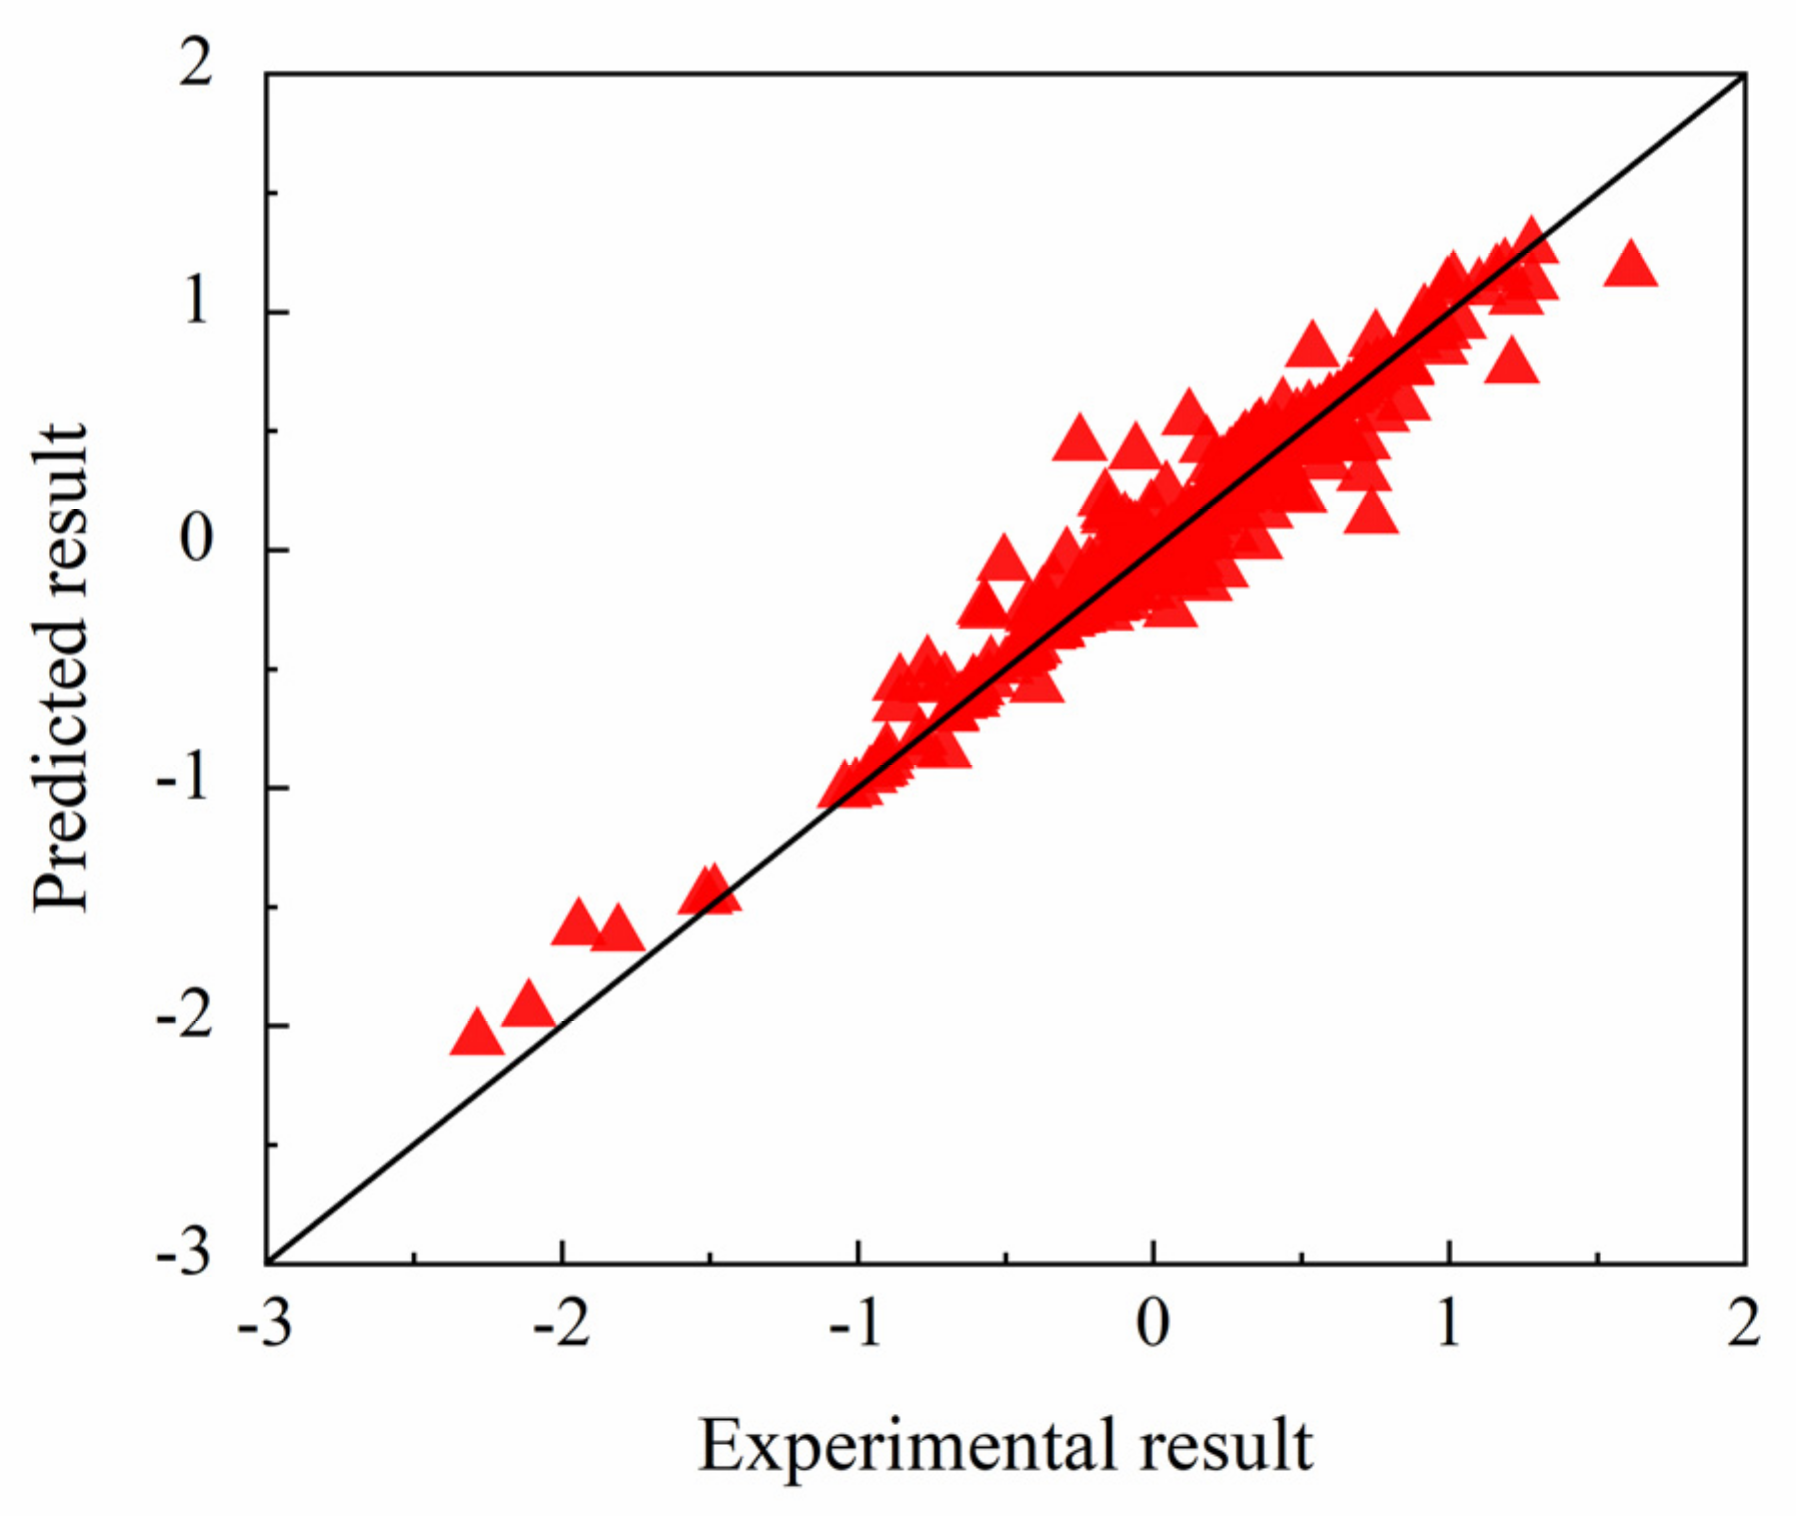
- Regression results
- 2.
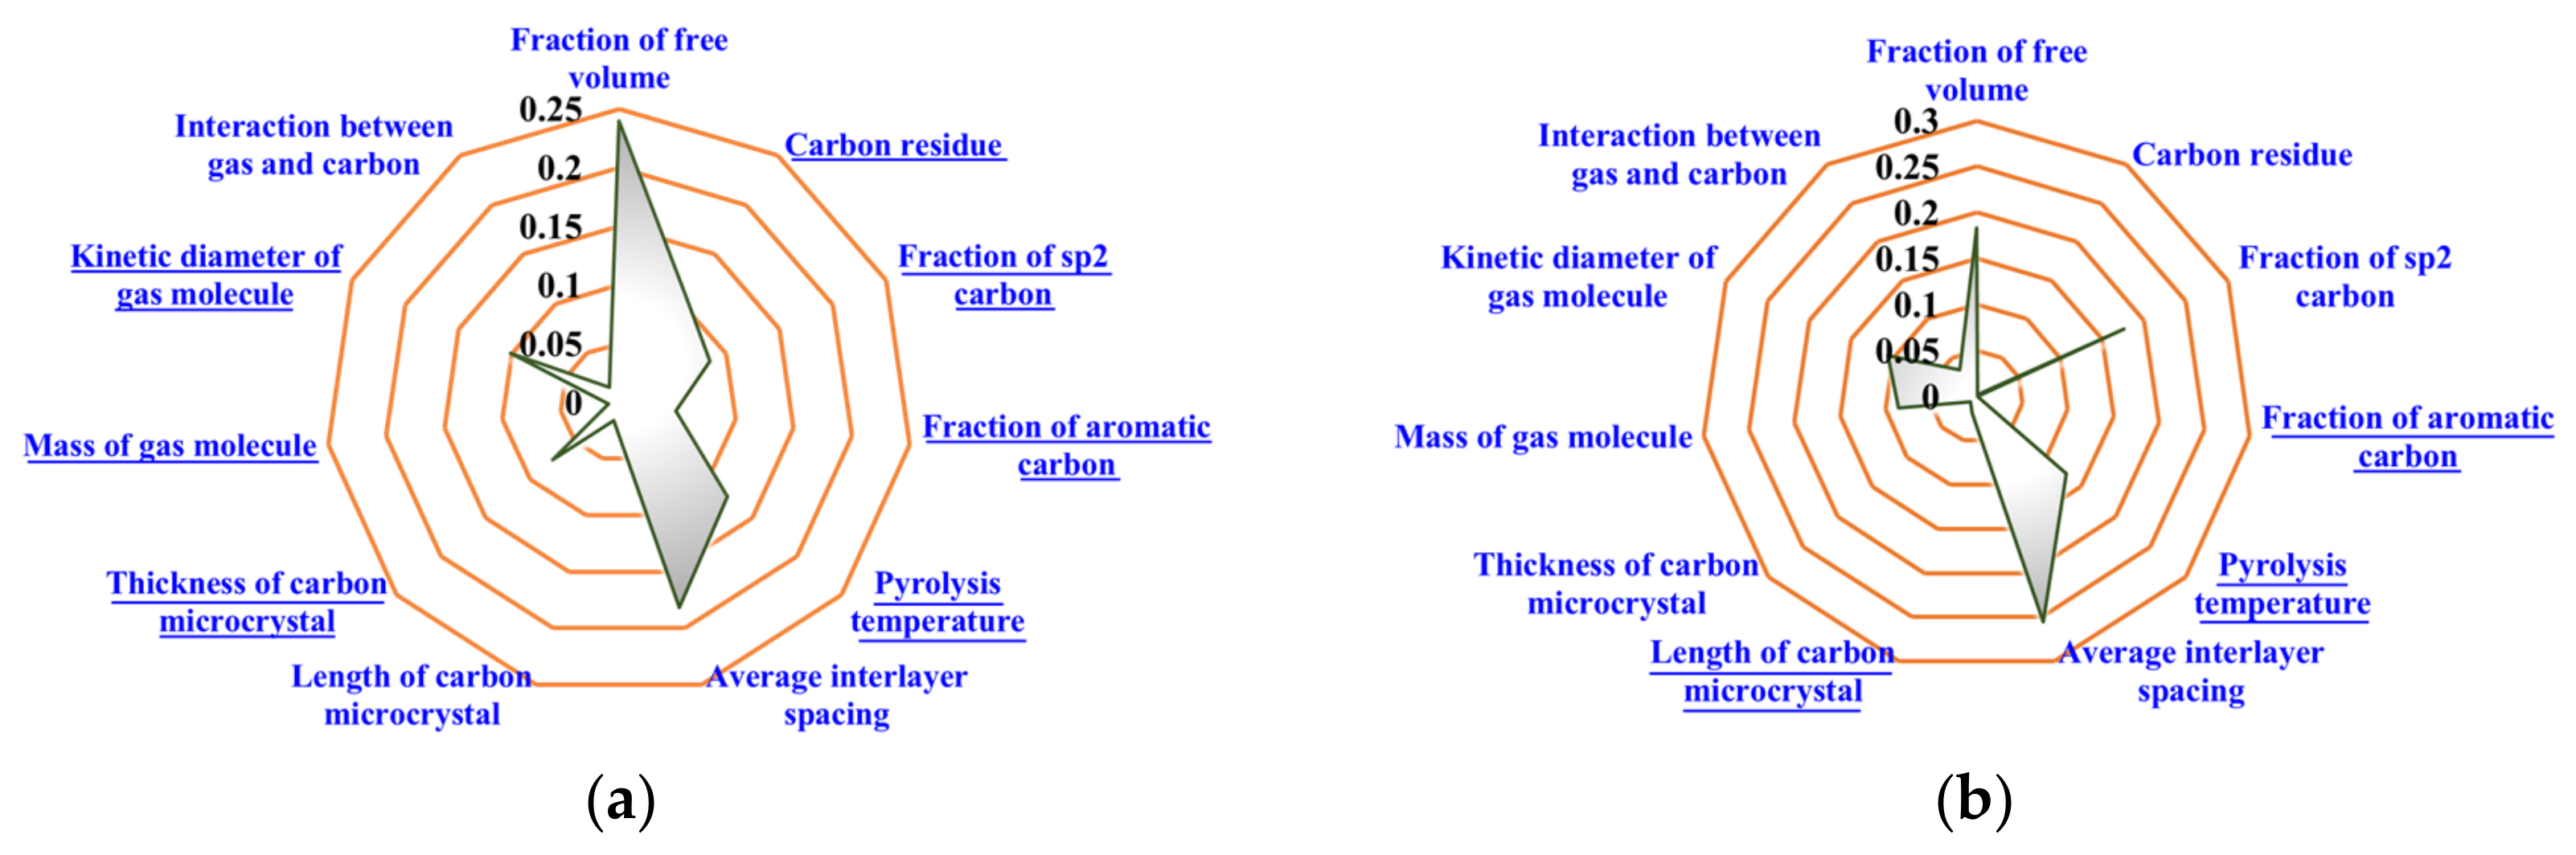
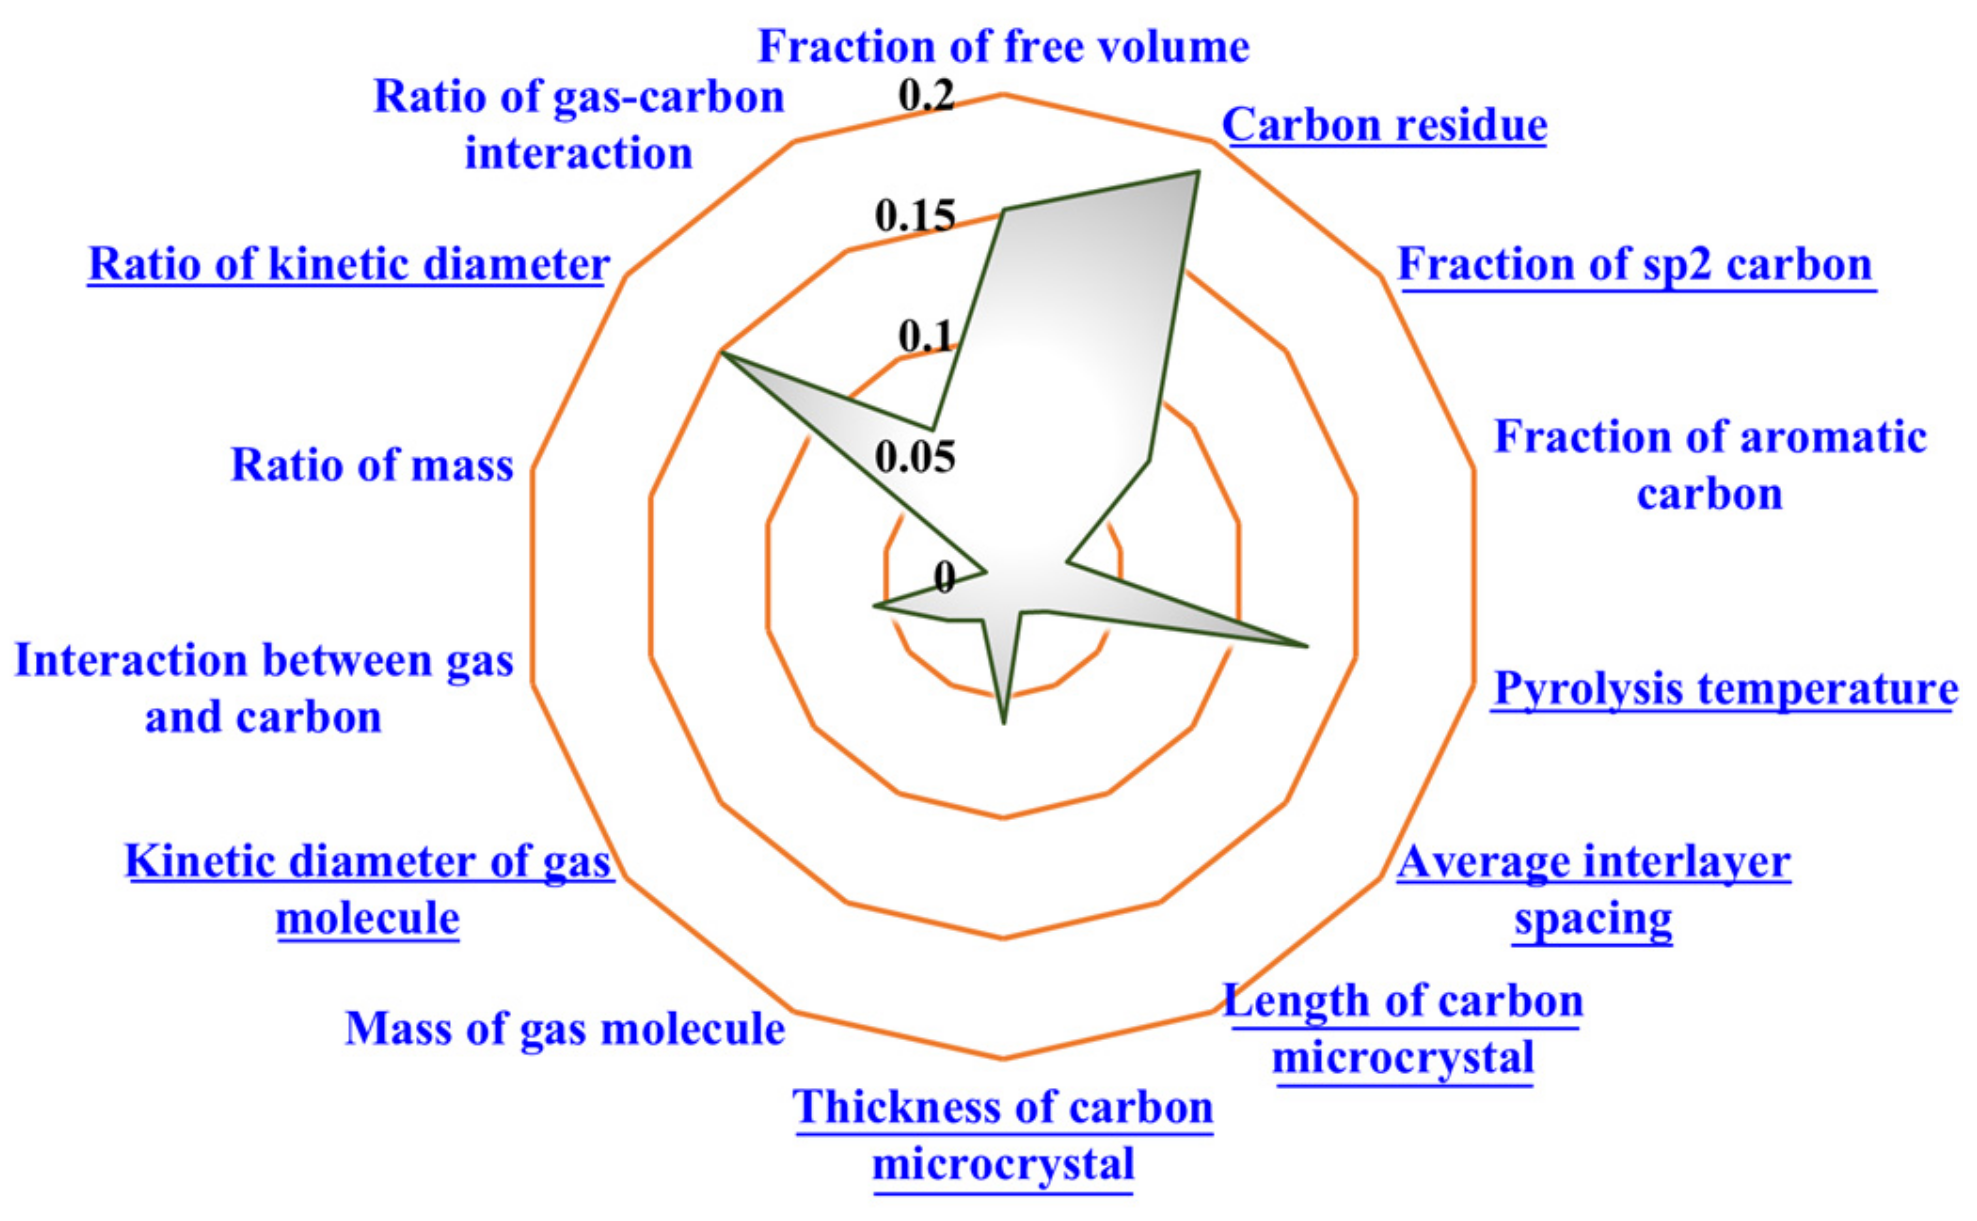
- Influencing factors analysis
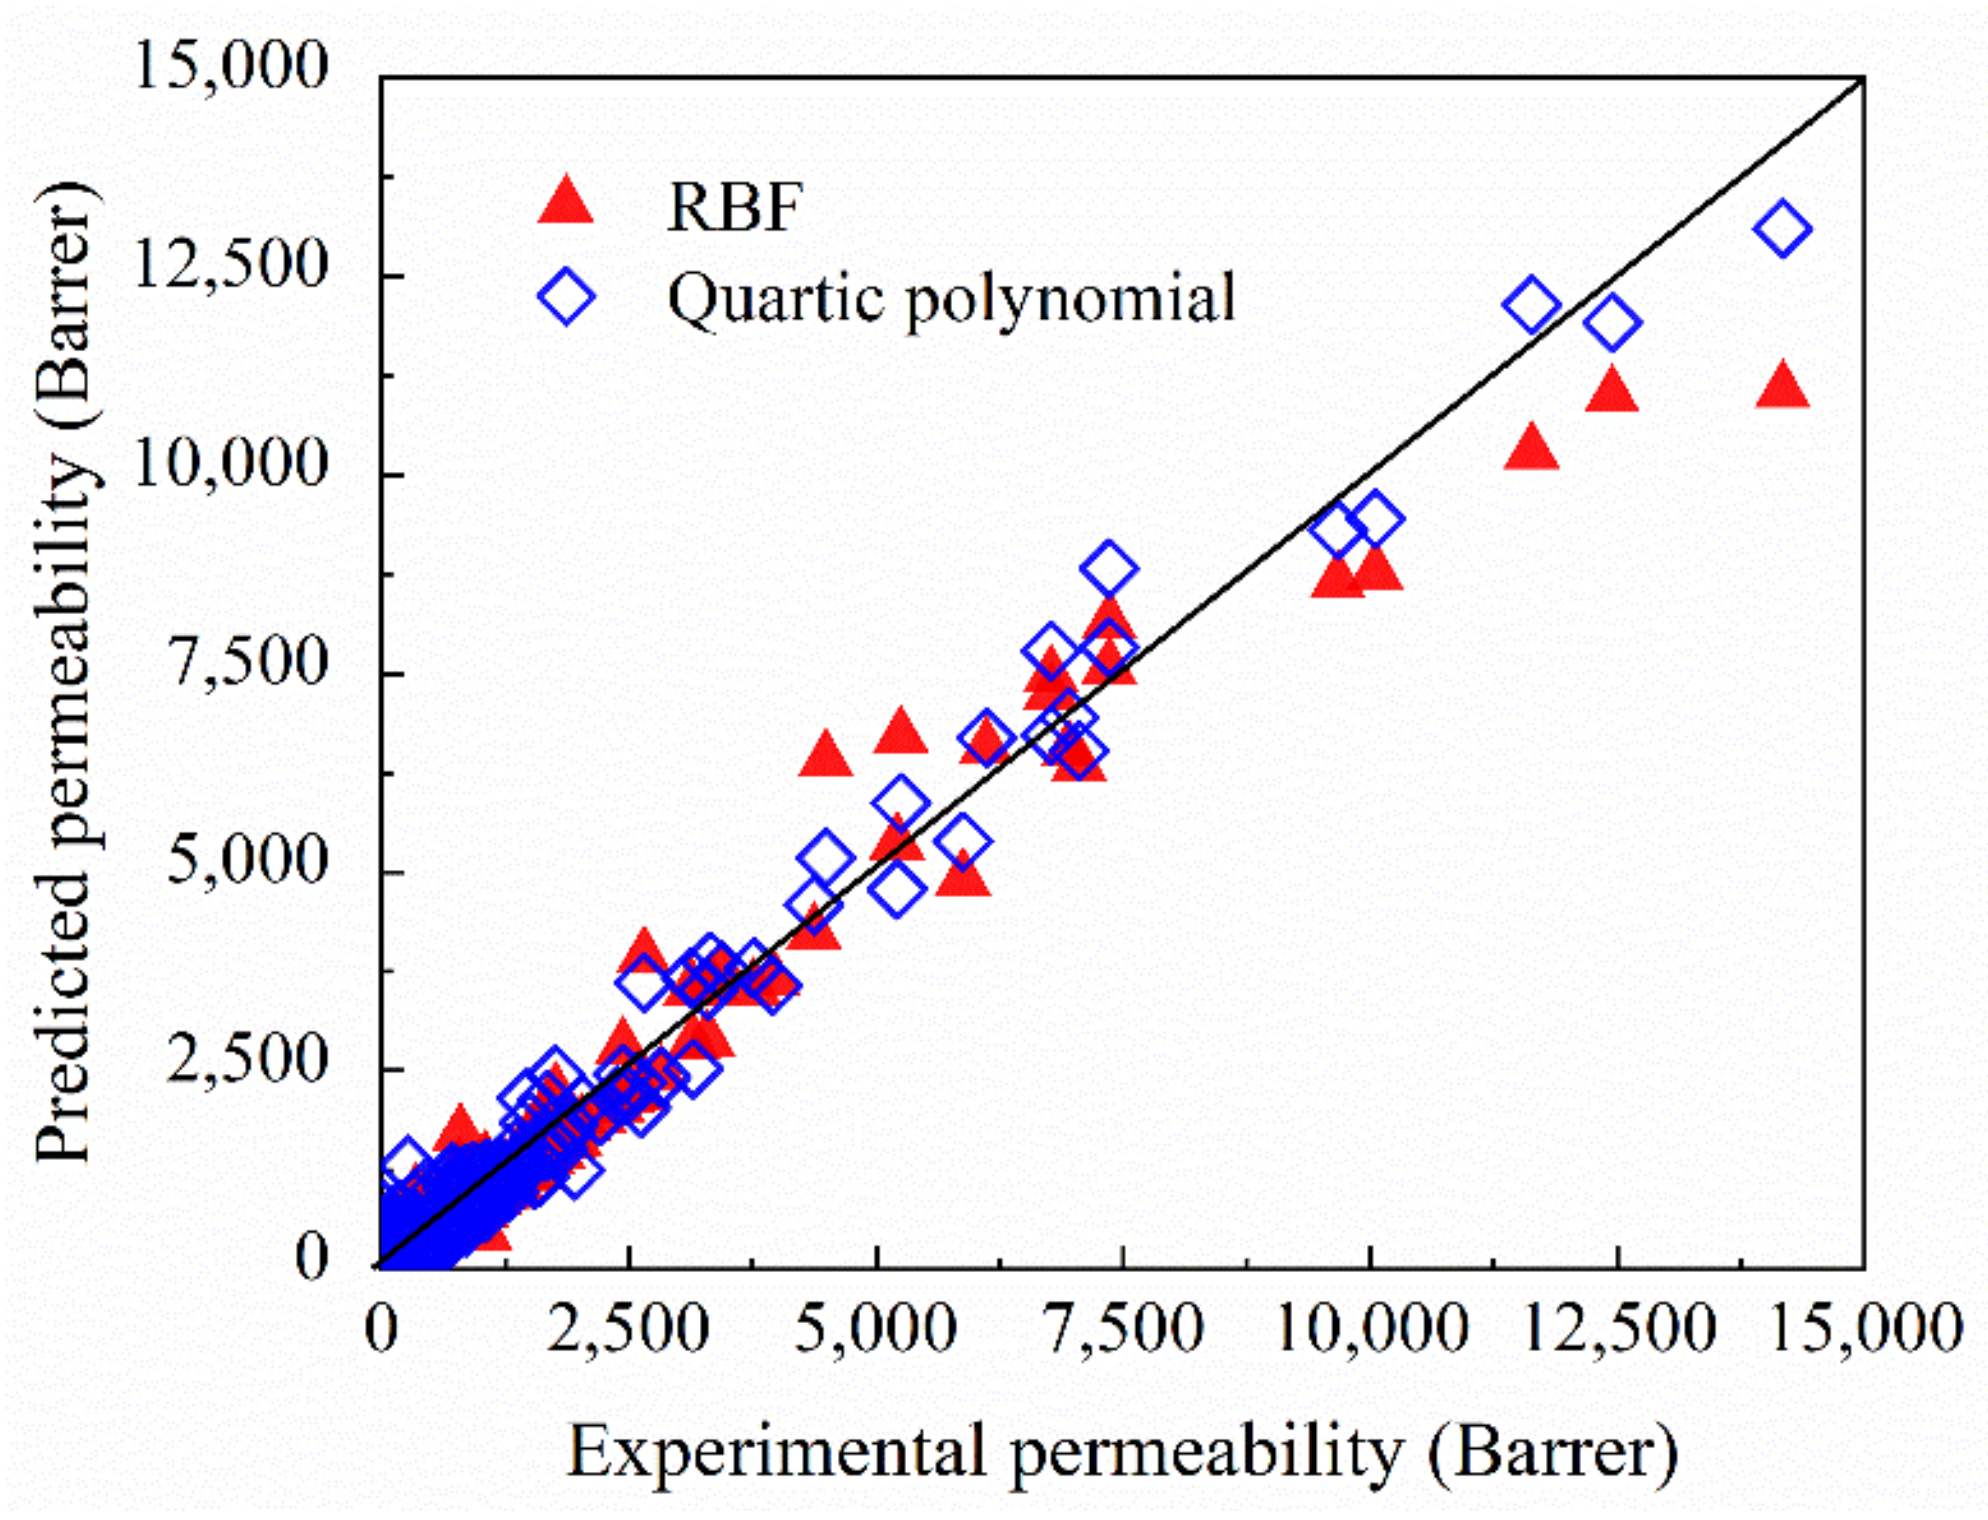
4.3.2. Factors Influencing Gas Separation Performance
- 1.
- Regression results
- 2.
- Influencing factors analysis
5. Conclusions
Supplementary Materials
Author Contributions
Funding
Institutional Review Board Statement
Informed Consent Statement
Data Availability Statement
Conflicts of Interest
References
- Miricioiu, M.G.; Niculescu, V.-C.; Filote, C.; Raboaca, M.S.; Nechifor, G. Coal Fly Ash Derived Silica Nanomaterial for MMMs-Application in CO2/CH4 Separation. Membranes 2021, 11, 78. [Google Scholar] [CrossRef] [PubMed]
- Nemestothy, N.; Bakonyi, P.; Lajtai-Szabo, P.; Belafi-Bako, K. The Impact of Various Natural Gas Contaminant Exposures on CO2/CH4 Separation by a Polyimide Membrane. Membranes 2020, 10, 324. [Google Scholar] [CrossRef] [PubMed]
- Li, L.; Xu, R.; Song, C.; Zhang, B.; Liu, Q.; Wang, T. A Review on the Progress in Nanoparticle/C Hybrid CMS Membranes for Gas Separation. Membranes 2018, 8, 134. [Google Scholar] [CrossRef] [PubMed] [Green Version]
- Kim, S.-J.; Kwon, Y.; Kim, D.; Park, H.; Cho, Y.H.; Nam, S.-E.; Park, Y.-I. A Review on Polymer Precursors of Carbon Molecular Sieve Membranes for Olefin/Paraffin Separation. Membranes 2021, 11, 482. [Google Scholar] [CrossRef]
- Adams, J.S.; Itta, A.K.; Zhang, C.; Wenz, G.B.; Sanyal, O.; Koros, W.J. New Insights into Structural Evolution in Carbon Molecular Sieve Membranes during Pyrolysis. Carbon 2019, 141, 238–246. [Google Scholar] [CrossRef]
- Hazazi, K.; Ma, X.; Wang, Y.; Ogieglo, W.; Alhazmi, A.; Han, Y.; Pinnau, I. Ultra-Selective Carbon Molecular Sieve Membranes for Natural Gas Separations Based on a Carbon-Rich Intrinsically Microporous Polyimide Precursor. J. Membr. Sci. 2019, 585, 1–9. [Google Scholar] [CrossRef]
- Chuah, C.Y.; Lee, J.; Song, J.; Bae, T.-H. Carbon Molecular Sieve Membranes Comprising Graphene Oxides and Porous Carbon for CO2/N-2 Separation. Membranes 2021, 11, 284. [Google Scholar] [CrossRef]
- Xu, R.S.; He, L.; Li, L.; Hou, M.; Wang, Y.; Zhang, B.; Liang, C.; Wang, T. Ultraselective Carbon Molecular Sieve Membrane for Hydrogen Purification. J. Energy Chem. 2020, 50, 16–24. [Google Scholar] [CrossRef]
- Wang, T.H.; Zhang, B.; Qiu, J.S.; Wu, Y.H.; Zhang, S.H.; Cao, Y.M. Effects of Sulfone/Ketone in Poly (Phthalazinone Ether Sulfone Ketone) on the Gas Permeation of Their Derived Carbon Membranes. J. Membr. Sci. 2009, 330, 319–325. [Google Scholar] [CrossRef]
- Pan, Y.; He, L.; Wang, W.; Wang, T.; Yu, L. Zigzag Pore Based Molecular Simulation on the Separation of CO2/CH4 Mixture by Carbon Membrane. Can. J. Chem. Eng. 2019, 97, 727–733. [Google Scholar] [CrossRef]
- He, L.; Pan, Y.; Wang, T.; Yu, L. Molecular Simulation and Optimization on the Microporous Structure in Carbon Molecular Sieve Membrane for CO2/CH4 Separation. Chem. Phys. Lett. 2020, 738, 136910. [Google Scholar] [CrossRef]
- Vapnik, V.N. Estimation of Dependencies Based on Empirical Data; Springer-Verlag: Berlin/Heidelberg, Germany, 1982. [Google Scholar]
- Vapnik, V.N. Statistical Learning Theory; Wiley: New York, NY, USA, 1998. [Google Scholar]
- Cherkassky, V.S.; Mulier, F.M. Learning From Data: Concepts, Theory, and Methods, 2nd ed.; John Wiley & Sons: Hoboken, NJ, USA, 2007. [Google Scholar]
- Ojha, P.K.; Roy, K. Development of a Robust and Validated 2D-QSPR Model for Sweetness Potency of Diverse Functional Organic Molecules. Food Chem. Toxicol. 2018, 112, 551–562. [Google Scholar] [CrossRef]
- Won, S.H.; Haas, F.M.; Dooley, S.; Edwards, T.; Dryer, F. Reconstruction of Chemical Structure of Real Fuel by Surrogate Formulation Based upon Combustion Property Targets. Combust. Flame 2017, 183, 39–49. [Google Scholar] [CrossRef]
- Yan, F.; He, W.; Jia, Q.; Wang, Q.; Xia, S.; Ma, P. Prediction of Ionic Liquids Viscosity at Variable Temperatures and Pressures. Chem. Eng. Sci. 2018, 184, 134–140. [Google Scholar] [CrossRef]
- Xu, X.Y.; Li, L.; Yan, F.Y.; Jia, Q.; Wang, Q.; Ma, P. Predicting Solubility of Fullerene C-60 in Diverse Organic Solvents using Norm Indexes. J. Mol. Liq. 2016, 223, 603–610. [Google Scholar] [CrossRef]
- Mansouri, K.; Grulke, C.M.; Judson, R.S.; Williams, A.J. OPERA Models for Predicting Physicochemical Properties and Environmental Fate Endpoints. J. Cheminform. 2018, 10, 10. [Google Scholar] [CrossRef] [Green Version]
- Ahmad, A.L.; Adewole, J.K.; Leo, C.P.; Ismail, S.; Sultan, A.S.; Olatunji, S.O. Prediction of Plasticization Pressure of Polymeric Membranes for CO2 Removal from Natural Gas. J. Membr. Sci. 2015, 480, 39–46. [Google Scholar] [CrossRef]
- Dehkordi, J.A.; Hosseini, S.S.; Kundu, P.K.; Tan, N.R. Mathematical Modeling of Natural Gas Separation Using Hollow Fiber Membrane Modules by Application of Finite Element Method through Statistical Analysis. Chem. Prod. Process Model. 2016, 11, 11–15. [Google Scholar] [CrossRef]
- Ng, L.Y.; Leo, C.P.; Mohammad, A.W. Optimizing the Incorporation of Silica Nanoparticles in Polysulfone/Poly(vinyl alcohol) Membranes with Response Surface Methodology. J. Appl. Polym. Sci. 2011, 121, 1804–1814. [Google Scholar] [CrossRef]
- Mubashir, M.; Yeong, Y.F.; Lau, K.K. Ultrasonic-Assisted Secondary Growth of Deca-Dodecasil 3 Rhombohedral (DD3R) Membrane and Its Process Optimization Studies in CO2/CH4 Separation using Response Surface Methodology. J. Nat. Gas Sci. Eng. 2016, 30, 50–63. [Google Scholar] [CrossRef]
- Chew, T.L.; Ahmad, A.L.; Bhatia, S. Microwave Heating-Synthesized Zeolite Membrane for CO2/CH4 Separation. Desalin. Water Treat. 2012, 47, 139–149. [Google Scholar] [CrossRef]
- Rezakazemi, M.; Azarafza, A.; Dashti, A.; Shirazian, S. Development of Hybrid Models for Prediction of Gas Permeation through FS/POSS/PDMS Nanocomposite Membranes. Int. J. Hydrog. Energy 2018, 43, 17283–17294. [Google Scholar] [CrossRef]
- Yang, W.; Liang, H.; Peng, F.; Liu, Z.; Liu, J.; Qiao, Z. Computational Screening of Metal-Organic Framework Membranes for the Separation of 15 Gas Mixtures. Nanomaterials 2019, 9, 467. [Google Scholar] [CrossRef] [PubMed] [Green Version]
- Behnia, N.; Pirouzfar, V. Effect of Operating Pressure and Pyrolysis Conditions on the Performance of Carbon Membranes for CO2/CH4 and O-2/N-2 Separation Derived from Polybenzimidazole/Matrimid and UIP-S Precursor Blends. Polym. Bull. 2018, 75, 4341–4358. [Google Scholar] [CrossRef]
- Yang, S.S.; Lu, W.C.; Chen, N.Y.; Hu, Q.N. Support Vector Regression Based QSPR for the Prediction of Some Physicochemical Properties of Alkyl Benzenes. J. Mol. Struct. THEOCHEM 2005, 719, 119–127. [Google Scholar] [CrossRef]
- Qin, Z.J.; Xi, Y.; Zhang, S.D.; Tu, G.P.; Yan, A.X. Classification of Cyclooxygenase-2 Inhibitors Using Support Vector Machine and Random Forest Methods. J. Chem Inf. Model. 2019, 59, 1988–2008. [Google Scholar] [CrossRef]
- Chau, Y.T.; Yap, C.W. Quantitative Nanostructure-Activity Relationship modelling of nanoparticles. RSC Adv. 2012, 2, 8489–8496. [Google Scholar] [CrossRef]
- Li, H.; Cui, Y.; Liu, Y.; Li, W.; Shi, Y.; Fang, C.; Li, H.; Gao, T.; Hu, L.; Lu, Y. Ensemble Learning for Overall Power Conversion Efficiency of the All-Organic Dye-Sensitized Solar Cells. IEEE Access 2018, 6, 34118–34126. [Google Scholar] [CrossRef]
- Shi, Z.; Liang, H.; Yang, W.; Liu, J.; Liu, Z.; Qiao, Z. Machine learning and In Silico Discovery of Metal-Organic Frameworks: Methanol as a Working Fluid in Adsorption-Driven Heat Pumps and Chillers. Chem. Eng. Sci. 2020, 214, 115430. [Google Scholar] [CrossRef]
- Yu, X.; Yu, R. Prediction of the Q–E Parameters from Transition State Structures. Polym. Eng. Sci. 2013, 53, 2151–2158. [Google Scholar] [CrossRef]
- Chen, A. The CO2 Adsorption and Diffusion Performances in Carbon Membrane. Master’s Thesis, Dalian University of Technology, Dalian, China, 2012. [Google Scholar]
- Qi, W. Effects of Precursor Chemical Structure on the Microstructure and Gas Permeability of Carbon Membrane. Master’s Thesis, Dalian University of Technology, Dalian, China, 2011. [Google Scholar]
- Song, J. Carbon Molecular Sieve Membranes Derived from Polyimides for Gas Separation. Master’s Thesis, Dalian University of Technology, Dalian, China, 2017. [Google Scholar]
- Xu, J. Effects of the Precursor Molecular Weight and ZSM-5 Addition on the Microstructure and Gas Permeability of Carbon Membrane. Master’s Thesis, Dalian University of Technology, Dalian, China, 2013. [Google Scholar]
- Li, L. Preparation, Pyrolysis Mechanism and Structure Modification of Polyimide Based Carbon Membrane. Ph.D. Thesis, Dalian Univversity of Technology, Dalian, China, 2013. [Google Scholar]
- Hu, L. The Studies of Polyetherimide-based Pyrolytic Membrane by Low-Temperature and Carbon Membrane. Master’s Thesis, Dalian University of Technology, Dalian, China, 2007. [Google Scholar]
- Liu, S. Preoxidation Mechanism of Poly(Phthalazione Ether Sulfone Ketone)s and Preparation Technology Optimization of Their Carbon Membranes. Ph.D. Thesis, Dalian University of Technology, Dalian, China, 2008. [Google Scholar]
- Pang, J. Effect of Different Solvents and Drying Methods on Structure and Gas Properties of Carbon Membranes. Master’s Thesis, Dalian University of Technology, Dalian, China, 2010. [Google Scholar]
- Zhang, B. Preparation, Microstructure and Gas Separation Performance of Molecular Sieving Carbon Membranes. Ph.D. Thesis, Dalian University of Technology, Dalian, China, 2007. [Google Scholar]
- Wang, X. The Preparation and Structure Properties of Carbon Membranes derived from Poly (Furfuryl Alcohol) for Gas Separation. Master’s Thesis, Dalian University of Technology, Dalian, China, 2007. [Google Scholar]
- Singh-Ghosal, A.; Koros, W.J. Air Separation Properties of Flat Sheet Homogeneous Pyrolytic Carbon Membranes. J. Membr. Sci. 2000, 174, 177–188. [Google Scholar] [CrossRef]
- Fu, S.; Sanders, E.S.; Kulkarni, S.S.; Koros, W.J. Carbon Molecular Sieve Membrane Structure-Property Relationships for Four Novel 6FDA Based Polyimide Precursors. J. Membr. Sci. 2015, 487, 60–73. [Google Scholar] [CrossRef]
- Rungta, M.; Xu, L.; Koros, W.J. Structure-Performance Characterization for Carbon Molecular Sieve Membranes using Molecular Scale Gas Probes. Carbon 2015, 85, 429–442. [Google Scholar] [CrossRef]
- Sazali, N.; Salleh, W.N.W.; Nordin, N.A.H.M.; Harun, Z.; Ismail, A.F. Matrimid-Based Carbon Tubular Membranes: The Effect of the Polymer Composition. J. Appl. Polym. Sci. 2015, 132, 132. [Google Scholar] [CrossRef]
- Hu, C.-P.; Polintan, C.K.; Tayo, L.L.; Chou, S.-C.; Tsai, H.-A.; Hung, W.-S.; Hu, C.-C.; Lee, K.-R.; Lai, J.-Y. The Gas Separation Performance Adjustment of Carbon Molecular Sieve Membrane Depending on the Chain Rigidity and Free Volume Characteristic of the Polymeric Precursor. Carbon 2019, 143, 343–351. [Google Scholar] [CrossRef]
- Fu, S.; Wenz, G.B.; Sanders, E.S.; Kulkarni, S.S.; Qiu, W.; Ma, C.; Koros, W.J. Effects of Pyrolysis Conditions on Gas Separation Properties of 6FDA/DETDA:DABA(3:2) Derived Carbon Molecular Sieve Membranes. J. Membr. Sci. 2016, 520, 699–711. [Google Scholar] [CrossRef] [Green Version]
- Rungta, M.; Wenz, G.B.; Zhang, C.; Xu, L.; Qiu, W.; Adams, J.S.; Koros, W.J. Carbon Molecular Sieve Structure Development and Membrane Performance Relationships. Carbon 2017, 115, 237–248. [Google Scholar] [CrossRef] [Green Version]
- Bird, R.B.; Stewart, W.E.; Lightfoot, E.N. Transport Phenomena, 2nd ed.; John Wiley & Sons: New York, NY, USA, 2002. [Google Scholar]
- Laurendeau, N.M. Statistical Thermodynamics: Fundamentals and Applications; Cambridge University Press: Cambridge, UK, 2005. [Google Scholar]
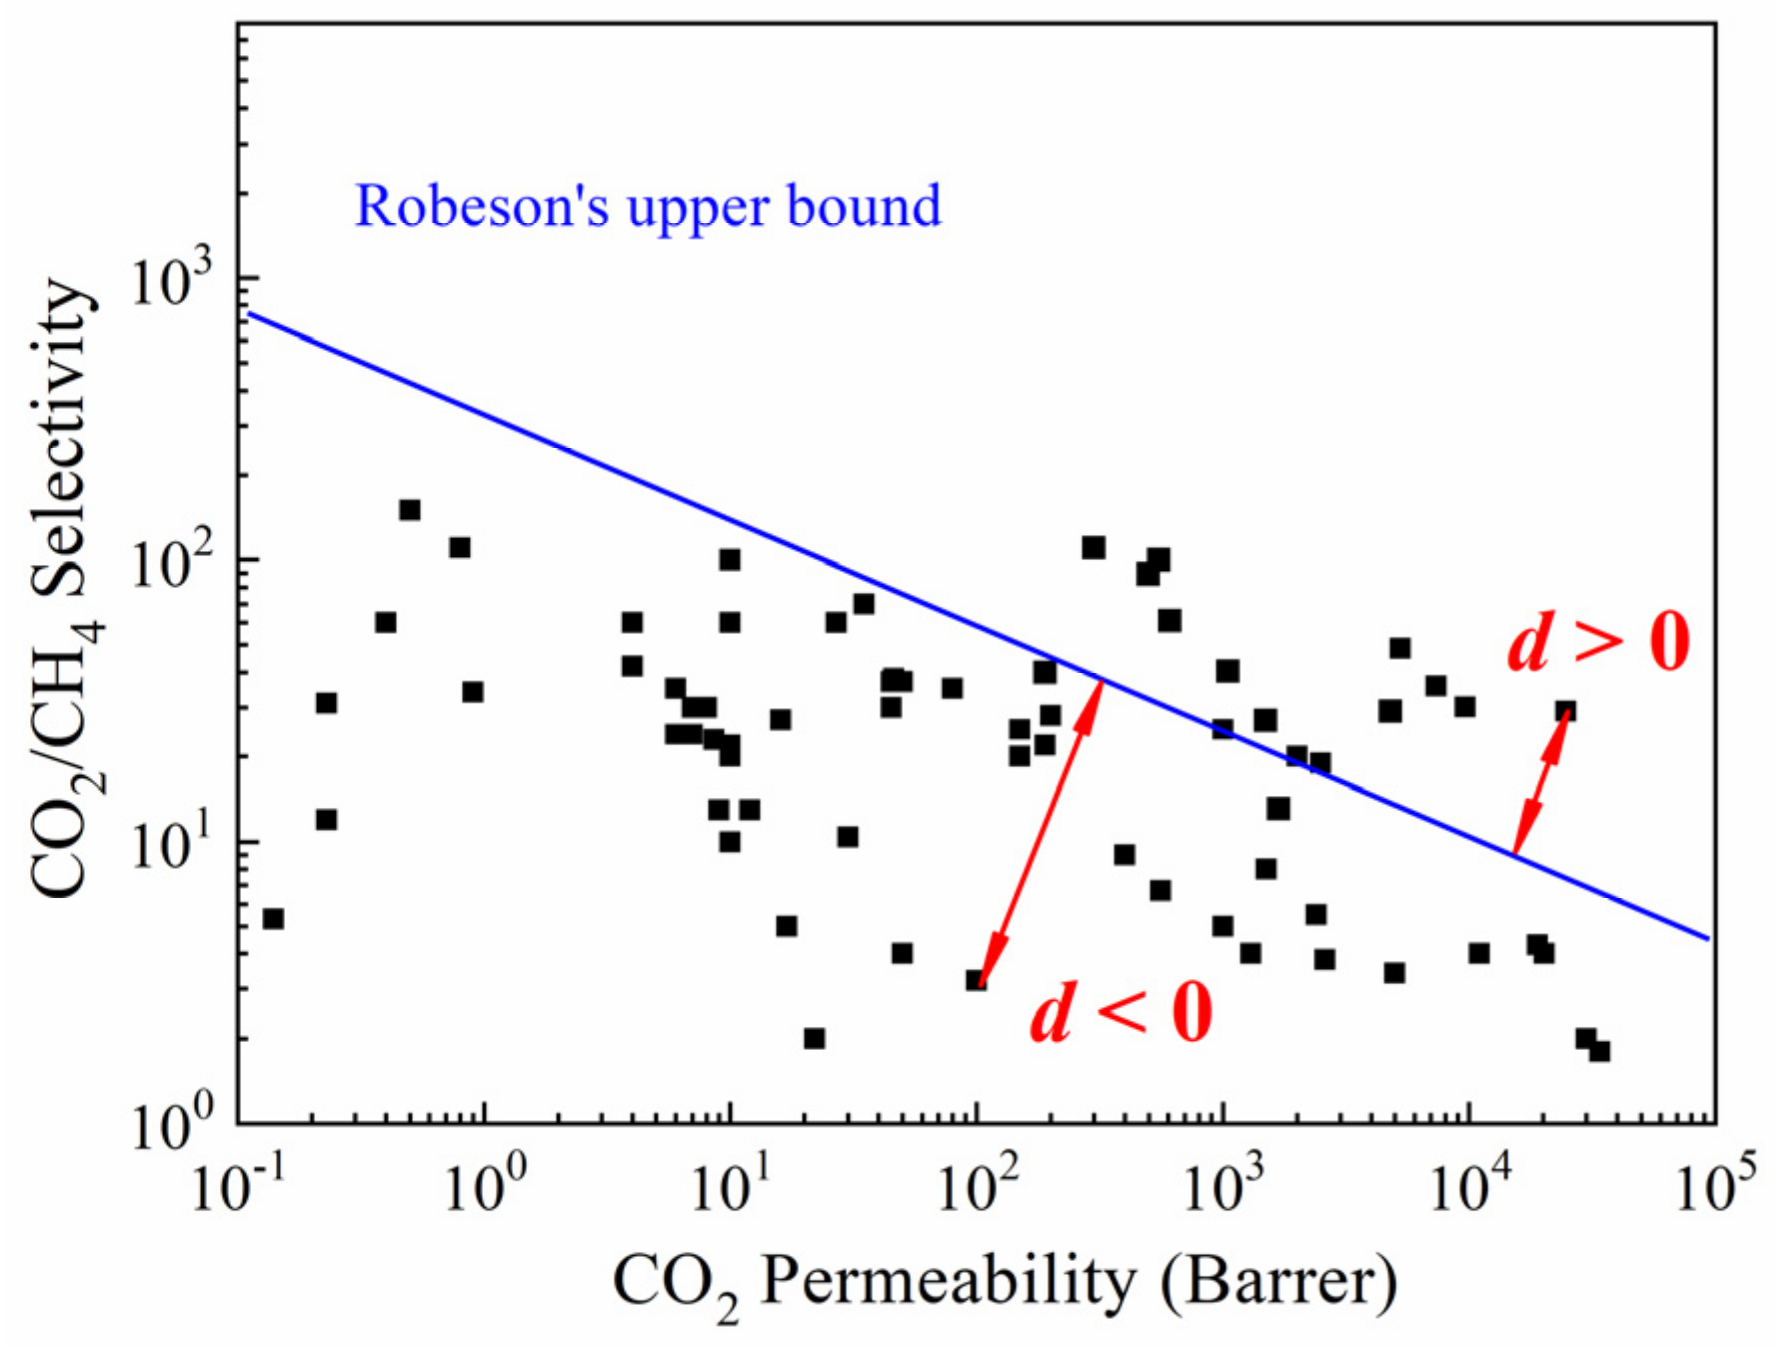
- Robeson, L.M. Correlation of Separation Factor Versus Permeability for Polymeric Membranes. J. Membr. Sci. 1991, 62, 165–185. [Google Scholar] [CrossRef]
- Robeson, L.M. The Upper Bound Revisited. J. Membr. Sci. 2008, 320, 390–400. [Google Scholar] [CrossRef]
- Tang, F.; Chen, M.; Wnag, Z. New Approach to Training Support Vector Machine. J. Syst. Eng. Electron. 2006, 17, 200–205. [Google Scholar] [CrossRef]
- Ambe, K.; Ishihara, K.; Ochibe, T.; Ohya, K.; Tamura, S.; Inoue, K.; Yoshida, M.; Tohkin, M. In Silico Prediction of Chemical-Induced Hepatocellular Hypertrophy Using Molecular Descriptors. Toxicol. Sci. 2017, 162, 667–675. [Google Scholar] [CrossRef] [PubMed]
- Dashtbozorgi, Z.; Golmohammadi, H.; Khooshechin, S. QSPR Models for Prediction of Bovine Serum Albumin-Water Partition Coefficients of Organic Compounds and Drugs Based on Enhanced Replacement Method and Support Vector Machine. Comput. Toxicol. 2017, 4, 1–10. [Google Scholar] [CrossRef]
- Yang, Q.; Sun, D.-W.; Cheng, W. Development of Simplified Models for Nondestructive Hyperspectral Imaging Monitoring of TVB-N Contents in Cured Meat during Drying Process. J. Food Eng. 2017, 192, 53–60. [Google Scholar] [CrossRef]
- Utts, J.M.; Heckard, R.F. Mind on Statistics, 5th ed.; Cengage Learning: Stamford, CT, USA, 2013. [Google Scholar]


| Category | Contents |
|---|---|
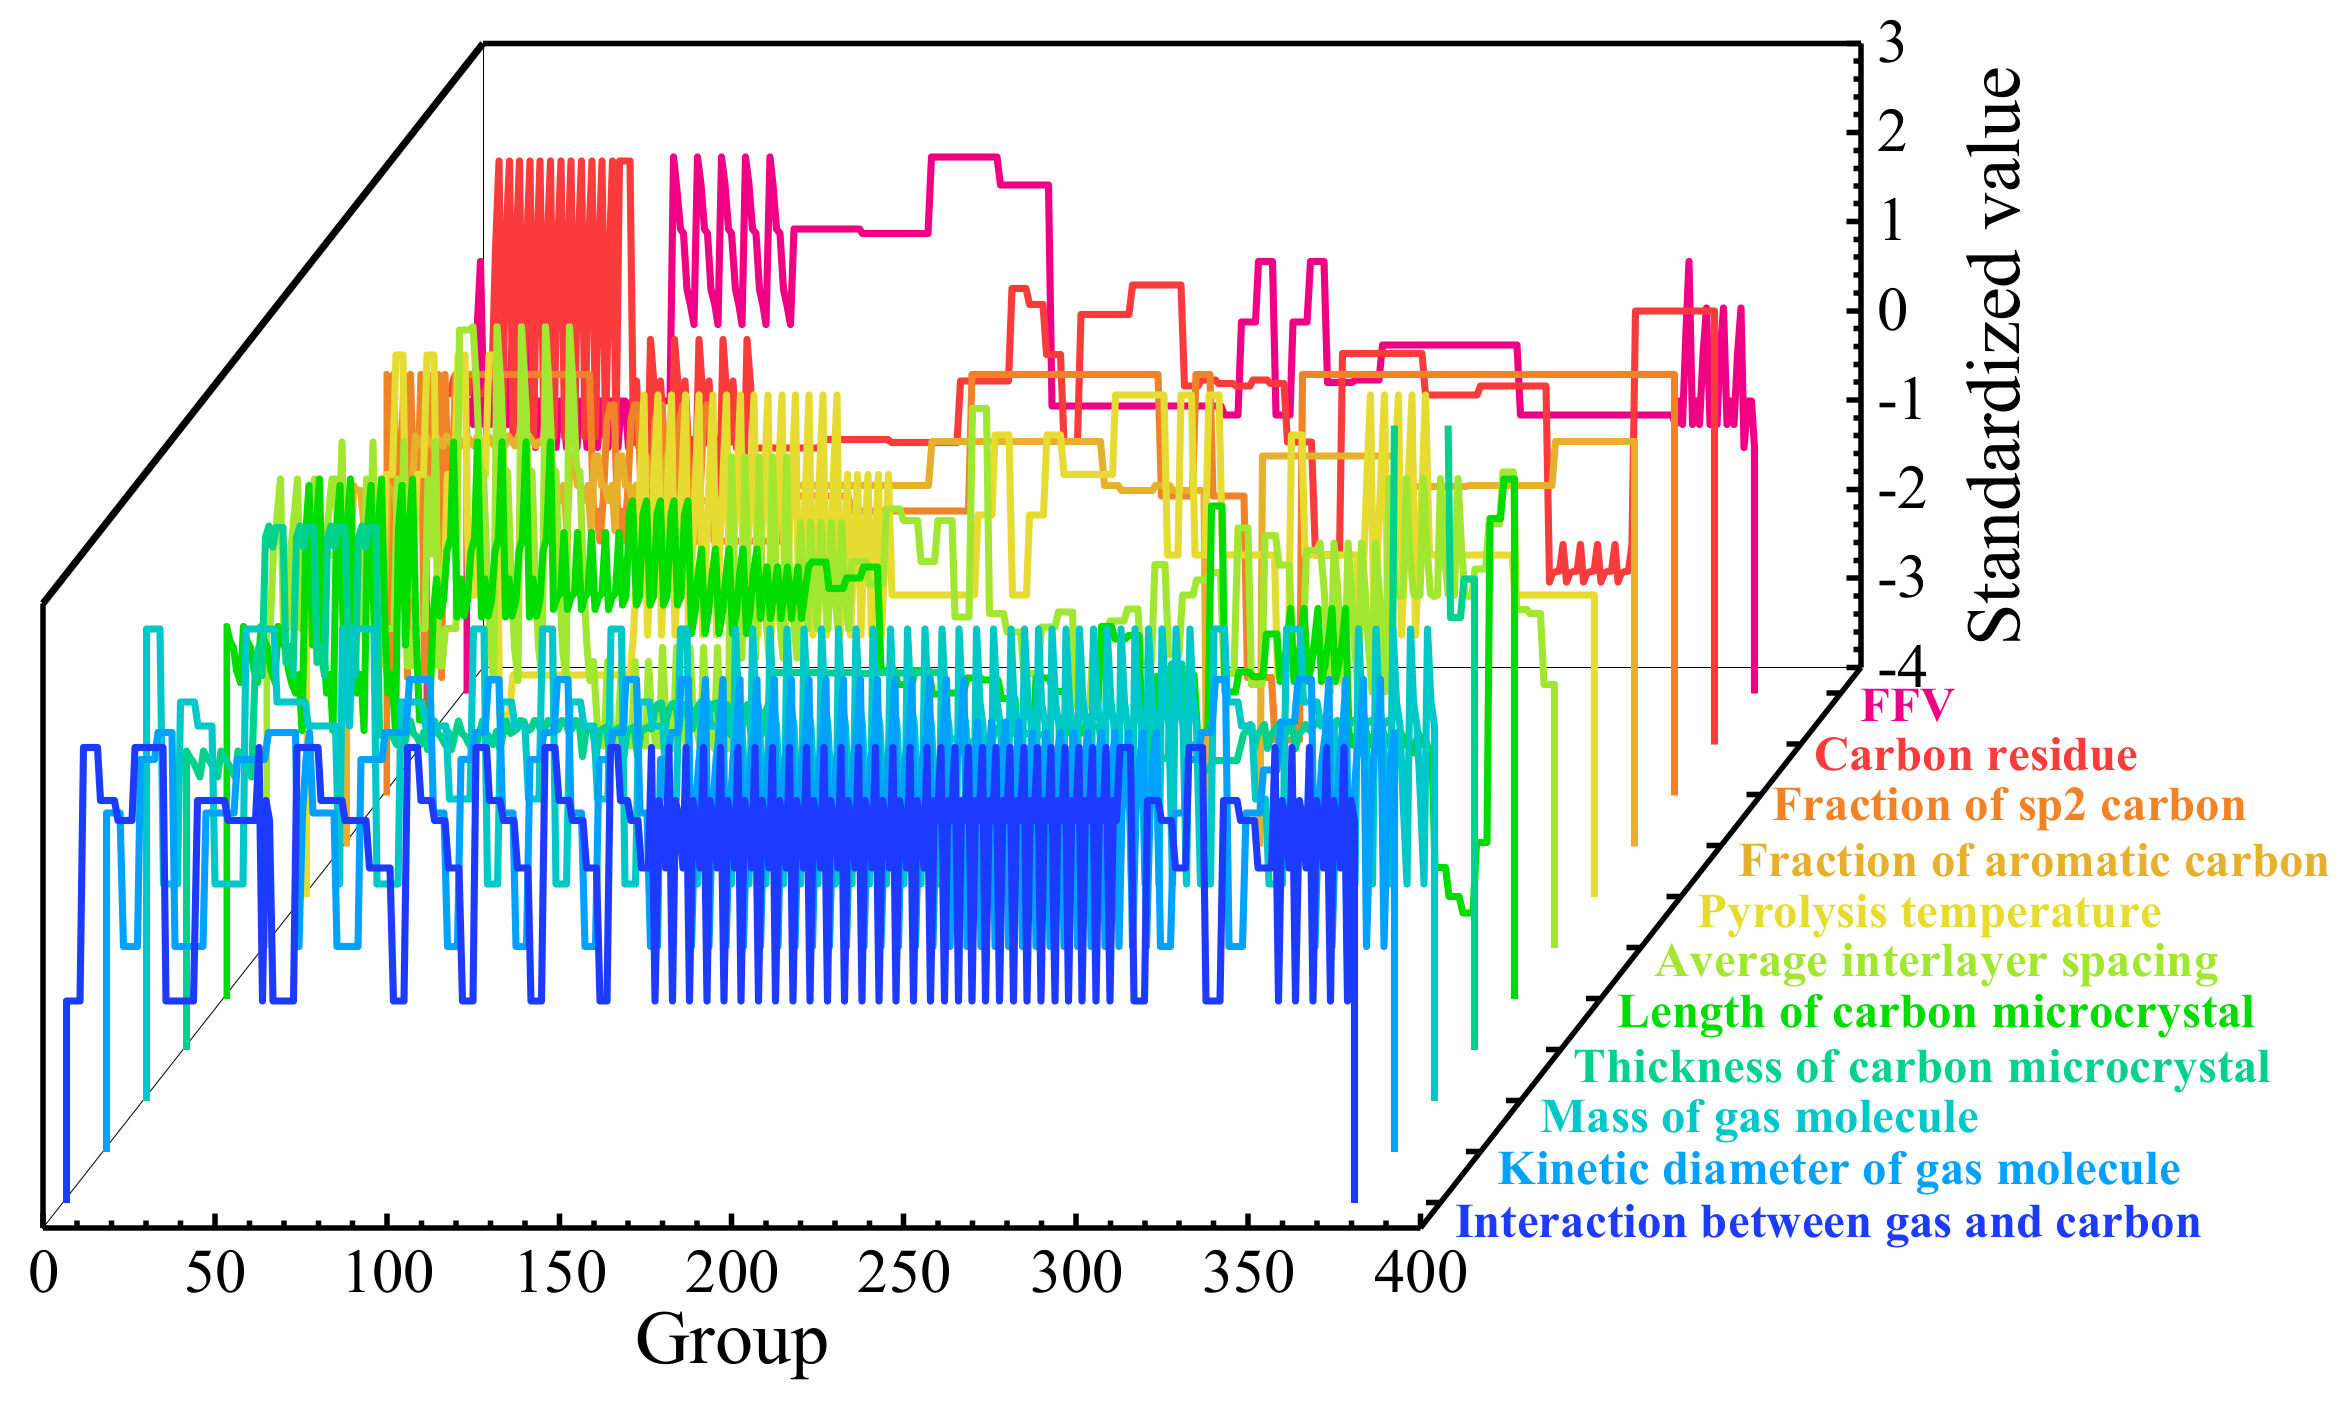
| Precursor structure | Fractional free volume (FFV); carbon residue; fraction of sp2-hybrid carbon; fraction of carbon in aromatic rings |
| Carbonation condition | Pyrolysis temperature |
| Carbon microcrystal structure | Average interlayer spacing; length of carbon microcrystal; thickness of carbon microcrystal |
| Properties of permeated gas molecules | Mass; kinetic diameter; van der Waals potential between gas and carbon |
| Kernel Function | R2 | RMSE | MAE |
|---|---|---|---|
| RBF | 0.794 | 0.281 | 0.139 |
| Polynomial | 0.730 | 0.321 | 0.181 |
| Linear | 0.303 | 0.516 | 0.209 |
| Sigmoid | –8.562 | 1.913 | 1.375 |
| Regression Method | R2 | RMSE | MAE |
|---|---|---|---|
| Linear | 0.201 | 0.553 | 0.387 |
| Ringe | 0.204 | 0.552 | 0.386 |
| Lasso | –0.060 | 0.637 | 0.409 |
| Kernel Function | R2 | RMSE | MAE |
|---|---|---|---|
| RBF | 0.841 | 0.413 | 0.129 |
| Quartic polynomial | 0.809 | 0.419 | 0.156 |
Publisher’s Note: MDPI stays neutral with regard to jurisdictional claims in published maps and institutional affiliations. |
© 2022 by the authors. Licensee MDPI, Basel, Switzerland. This article is an open access article distributed under the terms and conditions of the Creative Commons Attribution (CC BY) license (https://creativecommons.org/licenses/by/4.0/).
Share and Cite
Pan, Y.; He, L.; Ren, Y.; Wang, W.; Wang, T. Analysis of Influencing Factors on the Gas Separation Performance of Carbon Molecular Sieve Membrane Using Machine Learning Technique. Membranes 2022, 12, 100. https://doi.org/10.3390/membranes12010100
Pan Y, He L, Ren Y, Wang W, Wang T. Analysis of Influencing Factors on the Gas Separation Performance of Carbon Molecular Sieve Membrane Using Machine Learning Technique. Membranes. 2022; 12(1):100. https://doi.org/10.3390/membranes12010100
Chicago/Turabian StylePan, Yanqiu, Liu He, Yisu Ren, Wei Wang, and Tonghua Wang. 2022. "Analysis of Influencing Factors on the Gas Separation Performance of Carbon Molecular Sieve Membrane Using Machine Learning Technique" Membranes 12, no. 1: 100. https://doi.org/10.3390/membranes12010100