Article

Computational Fluid Dynamics (CFD) Modeling and Simulation of Flow Regulatory Mechanism in Artificial Kidney Using Finite Element Method

School of Chemical and Materials Engineering, National University of Sciences and Technology, Islamabad 44000, Pakistan
*
Author to whom correspondence should be addressed.
Membranes 2020, 10(7), 139; https://doi.org/10.3390/membranes10070139
Submission received: 11 June 2020 / Revised: 29 June 2020 / Accepted: 2 July 2020 / Published: 3 July 2020

Abstract

:
There is an enormous need in the health welfare sector to manufacture inexpensive dialyzer membranes with minimum dialysis duration. In order to optimize the dialysis cost and time, an in-depth analysis of the effect of dialyzer design and process parameters on toxins (ranging from tiny to large size molecules) clearance rate is required. Mathematical analysis and enhanced computational power of computers can translate the transport phenomena occurring inside the dialyzer while minimizing the development cost. In this paper, the steady-state mass transport in blood and dialysate compartment and across the membrane is investigated with convection-diffusion equations and tortuous pore diffusion model (TPDM), respectively. The two-dimensional, axisymmetric CFD model was simulated by using a solver based on the finite element method (COMSOL Multiphysics 5.4). The effect of design and process parameters is analyzed by solving model equations for varying values of design and process parameters. It is found that by introducing tortuosity in the pore diffusion model, the clearance rate of small size molecules increases, but the clearance rate of large size molecules is reduced. When the fiber aspect ratio (db/L) varies from 900 to 2300, the clearance rate increases 37.71% of its initial value. The results also show that when the pore diameter increases from 10 nm to 20 nm, the clearance rate of urea and glucose also increases by 2.09% and 7.93%, respectively, with tolerated transport of albumin molecules.

Graphical Abstract

1. Introduction

During the development of end-stage renal disease (ESRD), a considerable amount of toxins (ranging from small to large size molecules), naturally filtered by human kidneys, begins to accumulate in ESRD patient’s blood. When the patient is suffering from ESRD, hemodialysis is the most inexpensive and effective therapy to remove these solutes (toxins) from the blood. In this therapy, the blood flows from the patient’s body to an extracorporeal circuit that mimics the function of the human kidney with the help of a hollow fiber dialyzer. The hollow fibers are made of semi-permeable porous membranes with an active surface area of 0.8−2.5 m2 and a diameter of nearly 200 nm [1]. These fibers allow convective and diffusive transport of uremic solutes, but resist the transport of albumin and blood cells towards the dialysate compartment. Low molecular weight solute (i.e., urea, glucose) transport is governed by diffusion. The transfer of middle molecular weight solutes (i.e., endothelin, β2-Microglobulin, β2-microglobulin, complement factor D, albumin) requires convection (ultrafiltration). This transport phenomenon’s efficiency depends on hollow fiber geometry, membrane characteristics, and operating variables [2,3,4].
In the past 30 years, numerous mathematical models have been proposed to mimic the transport phenomena occurring in vivo. Kunitomo et al. performed in-vitro and in-vivo experiments with polymethyl methacrylate (PMMA) hollow fiber units. He established that post-dilution of blood to compensate for the excessive removal of fluid is the most effective way to enhance the clearance of middle size molecules [5]. Jaffrin et al. and Chang et al. developed a one-dimensional model for combine diffusive and convective transport of solutes through membranes. In-vitro verification of the model shows that values of urea clearance are closer to the experimental result [6,7]. Werynski et al. have reviewed the one-dimensional convection-diffusion model, typically used to explain mass transport in membrane equipped clinical devices [8]. He concluded that the one-dimensional model is not applicable for studying the impact of module geometry and shape on clearance efficiency. Wüpper et al. theoretically analyzed the clinical data to determine density changes in radial direction and change in the concentration of large molecules in an axial direction [9]. Annan et al. presented a two-dimensional axisymmetric model to analyze the effect of mismatch flow in the blood and dialysate compartment [10].
The previous studies have presented a simplified description of solute transport across the membrane by assuming uniform convective flux that permits to solve the model equations analytically [5,6,7]. However, the analytical solution provides the results only at the inlet and outlet of the hollow fibers. Therefore, in the current study, a CFD model is solved with the finite element method that provides solutions on a large number of points present in the computational domain. Some mathematical models established the solute transport from blood to the dialysate side and across the membrane with an overall mass transfer coefficient [4,5,7,8,9,10,11,12,13,14,15,16]. The use of the overall mass transfer coefficient without considering the tortuosity and porosity of porous media introduces the difference between the in vitro and in silico clearance rates. To fill this void, TPDM is used in this study that incorporates the effect of membrane tortuosity and porosity to give better estimation of overall mass transfer coefficient [17].
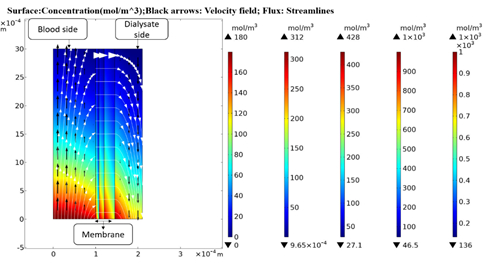
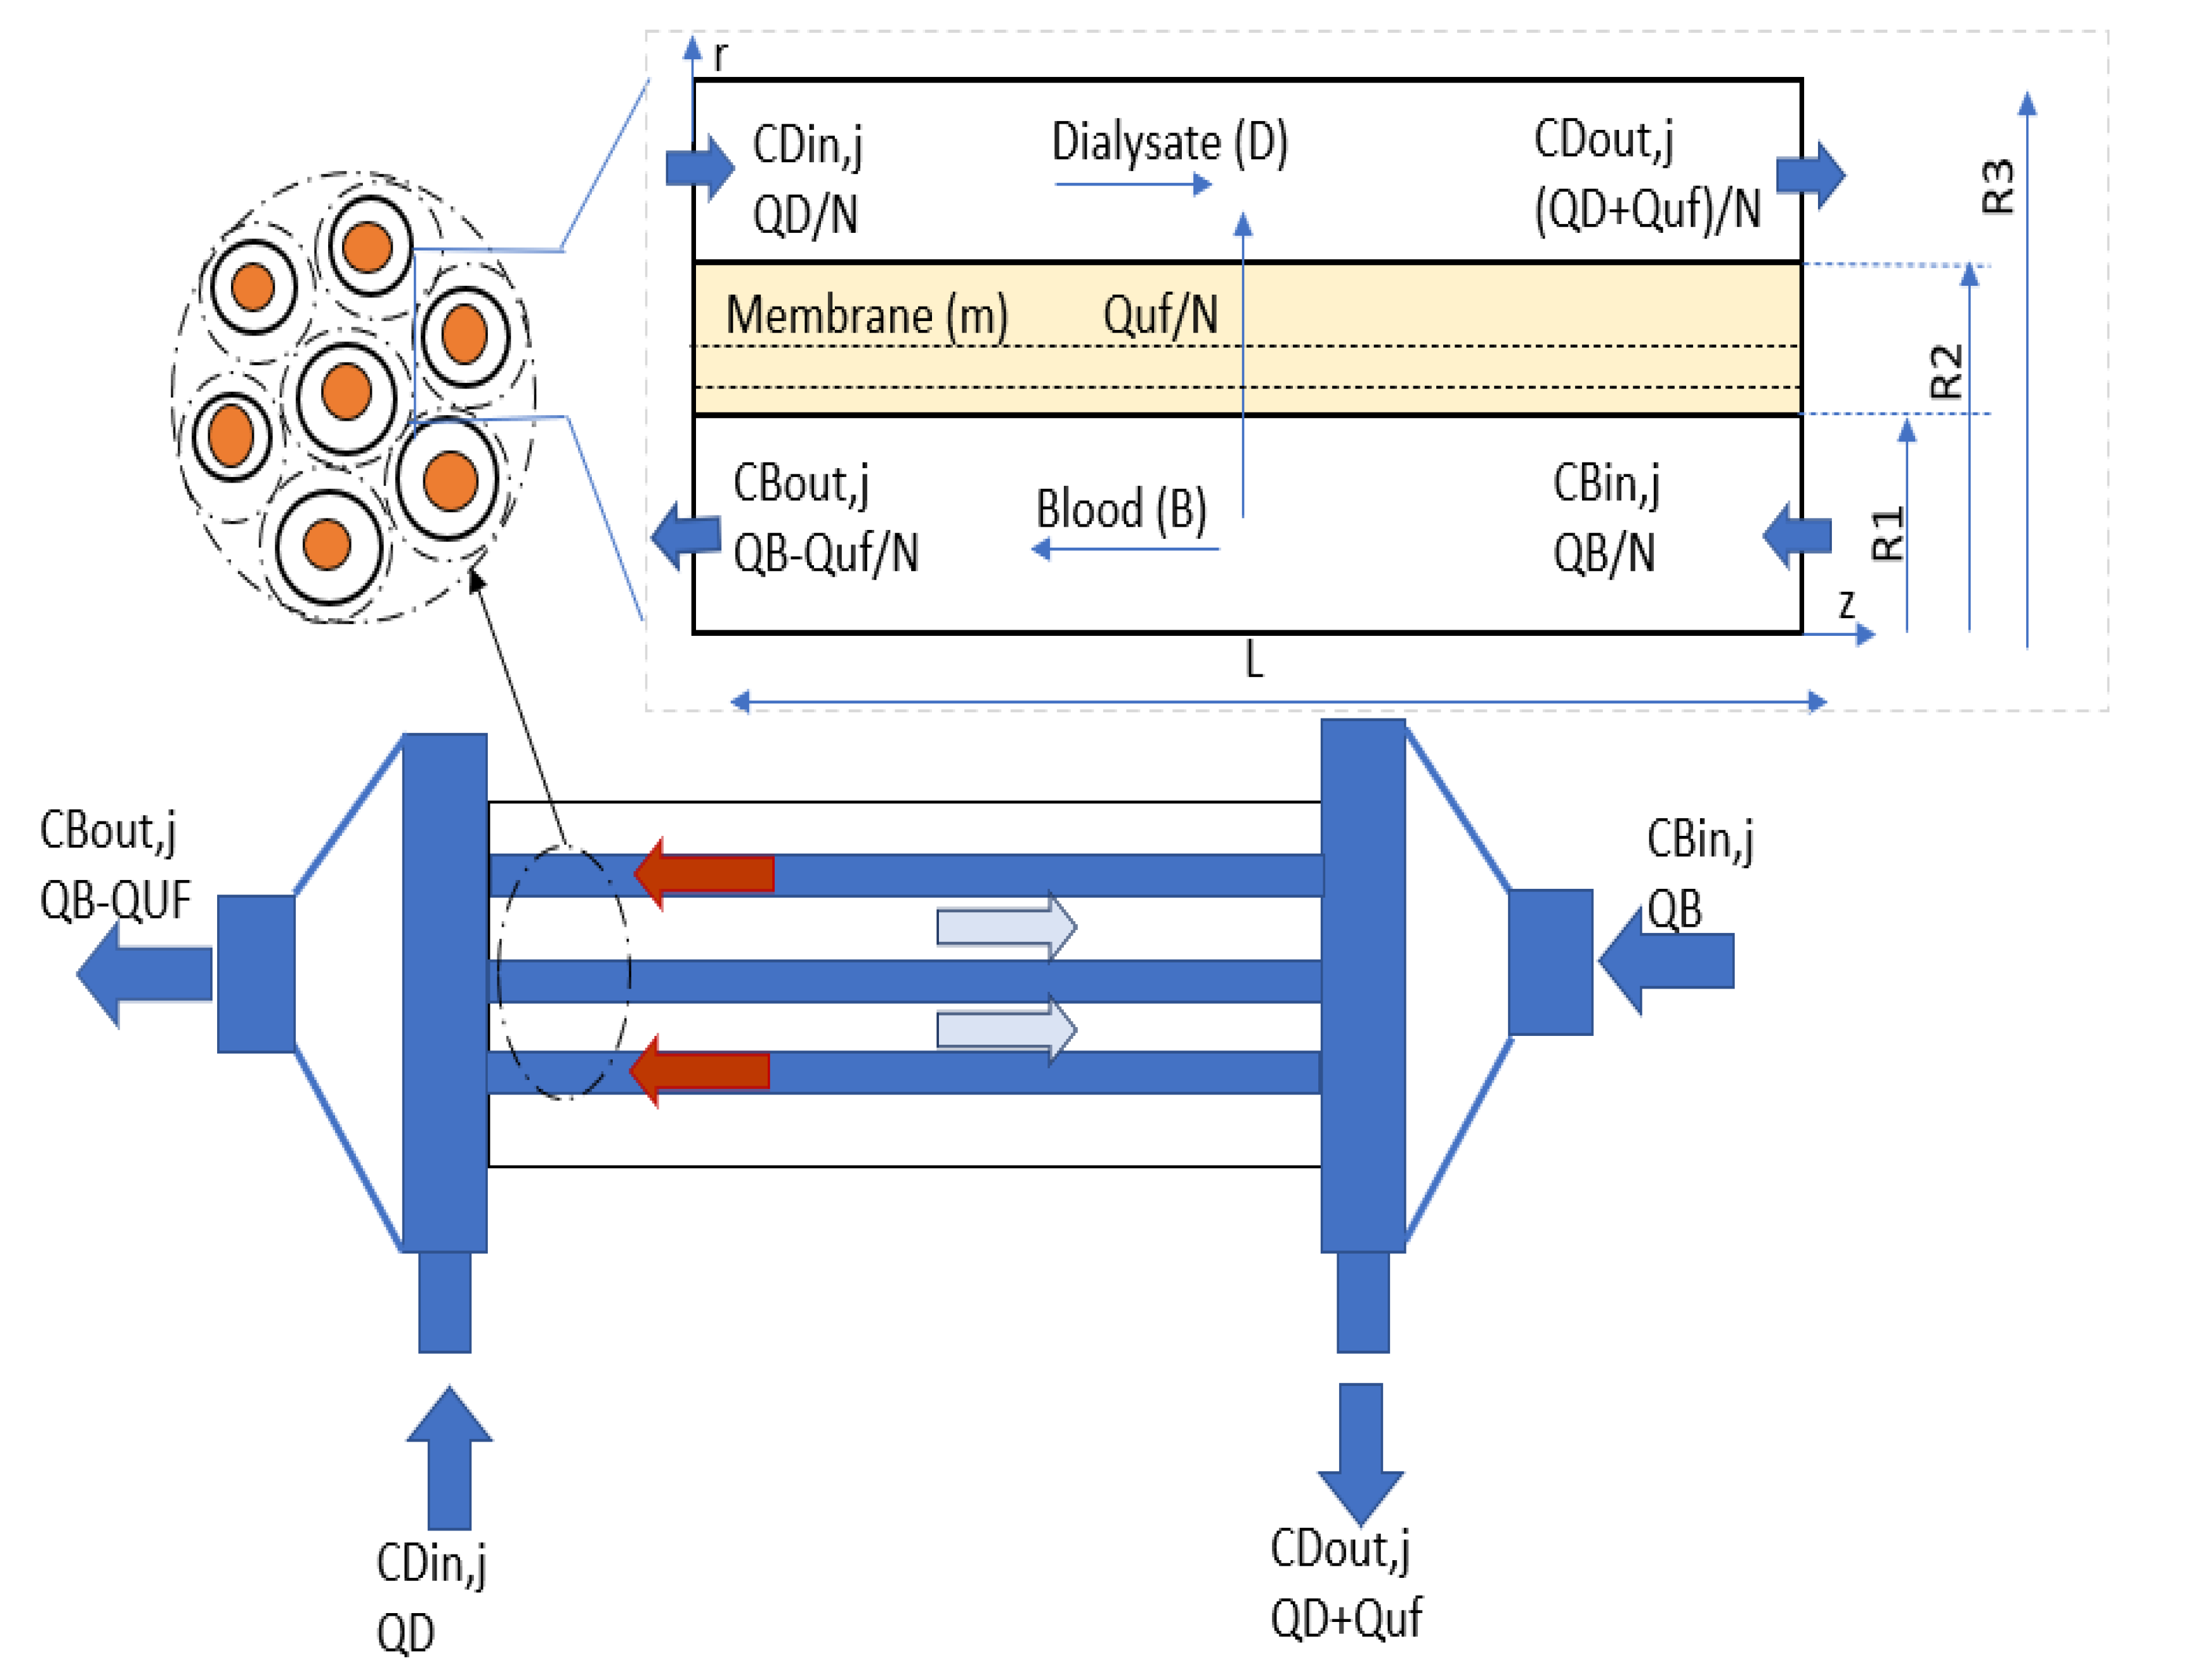
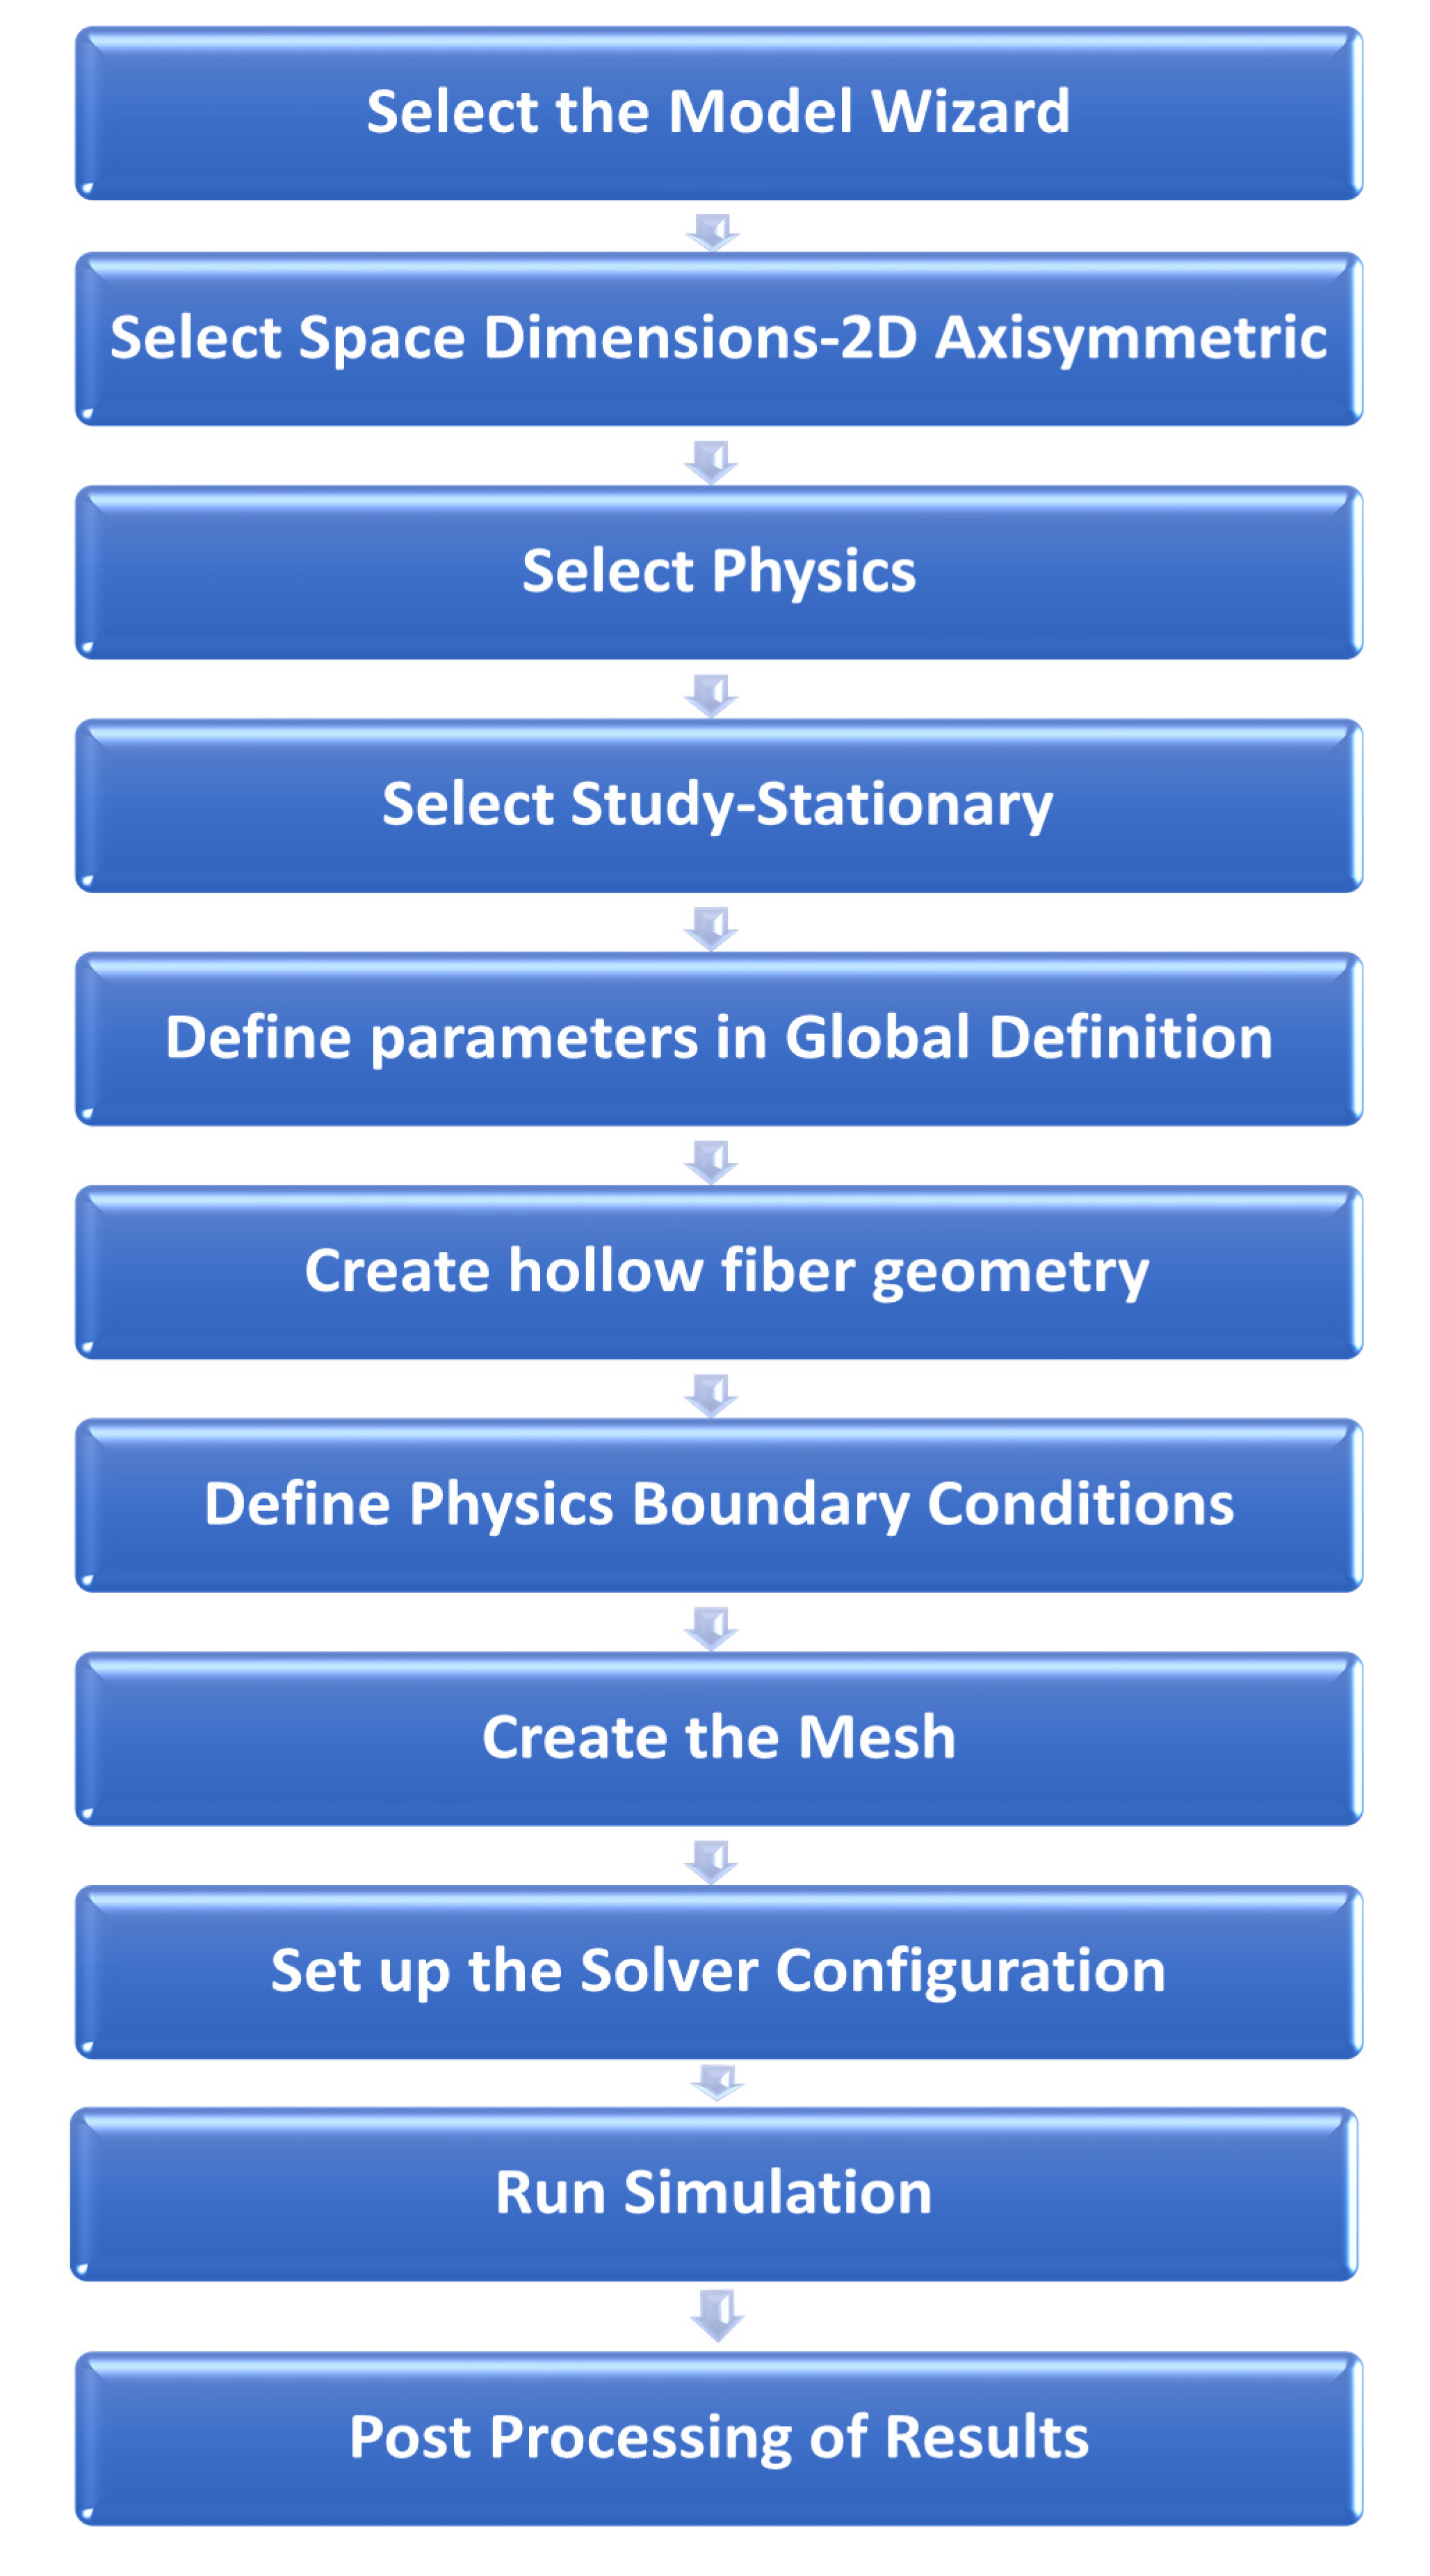
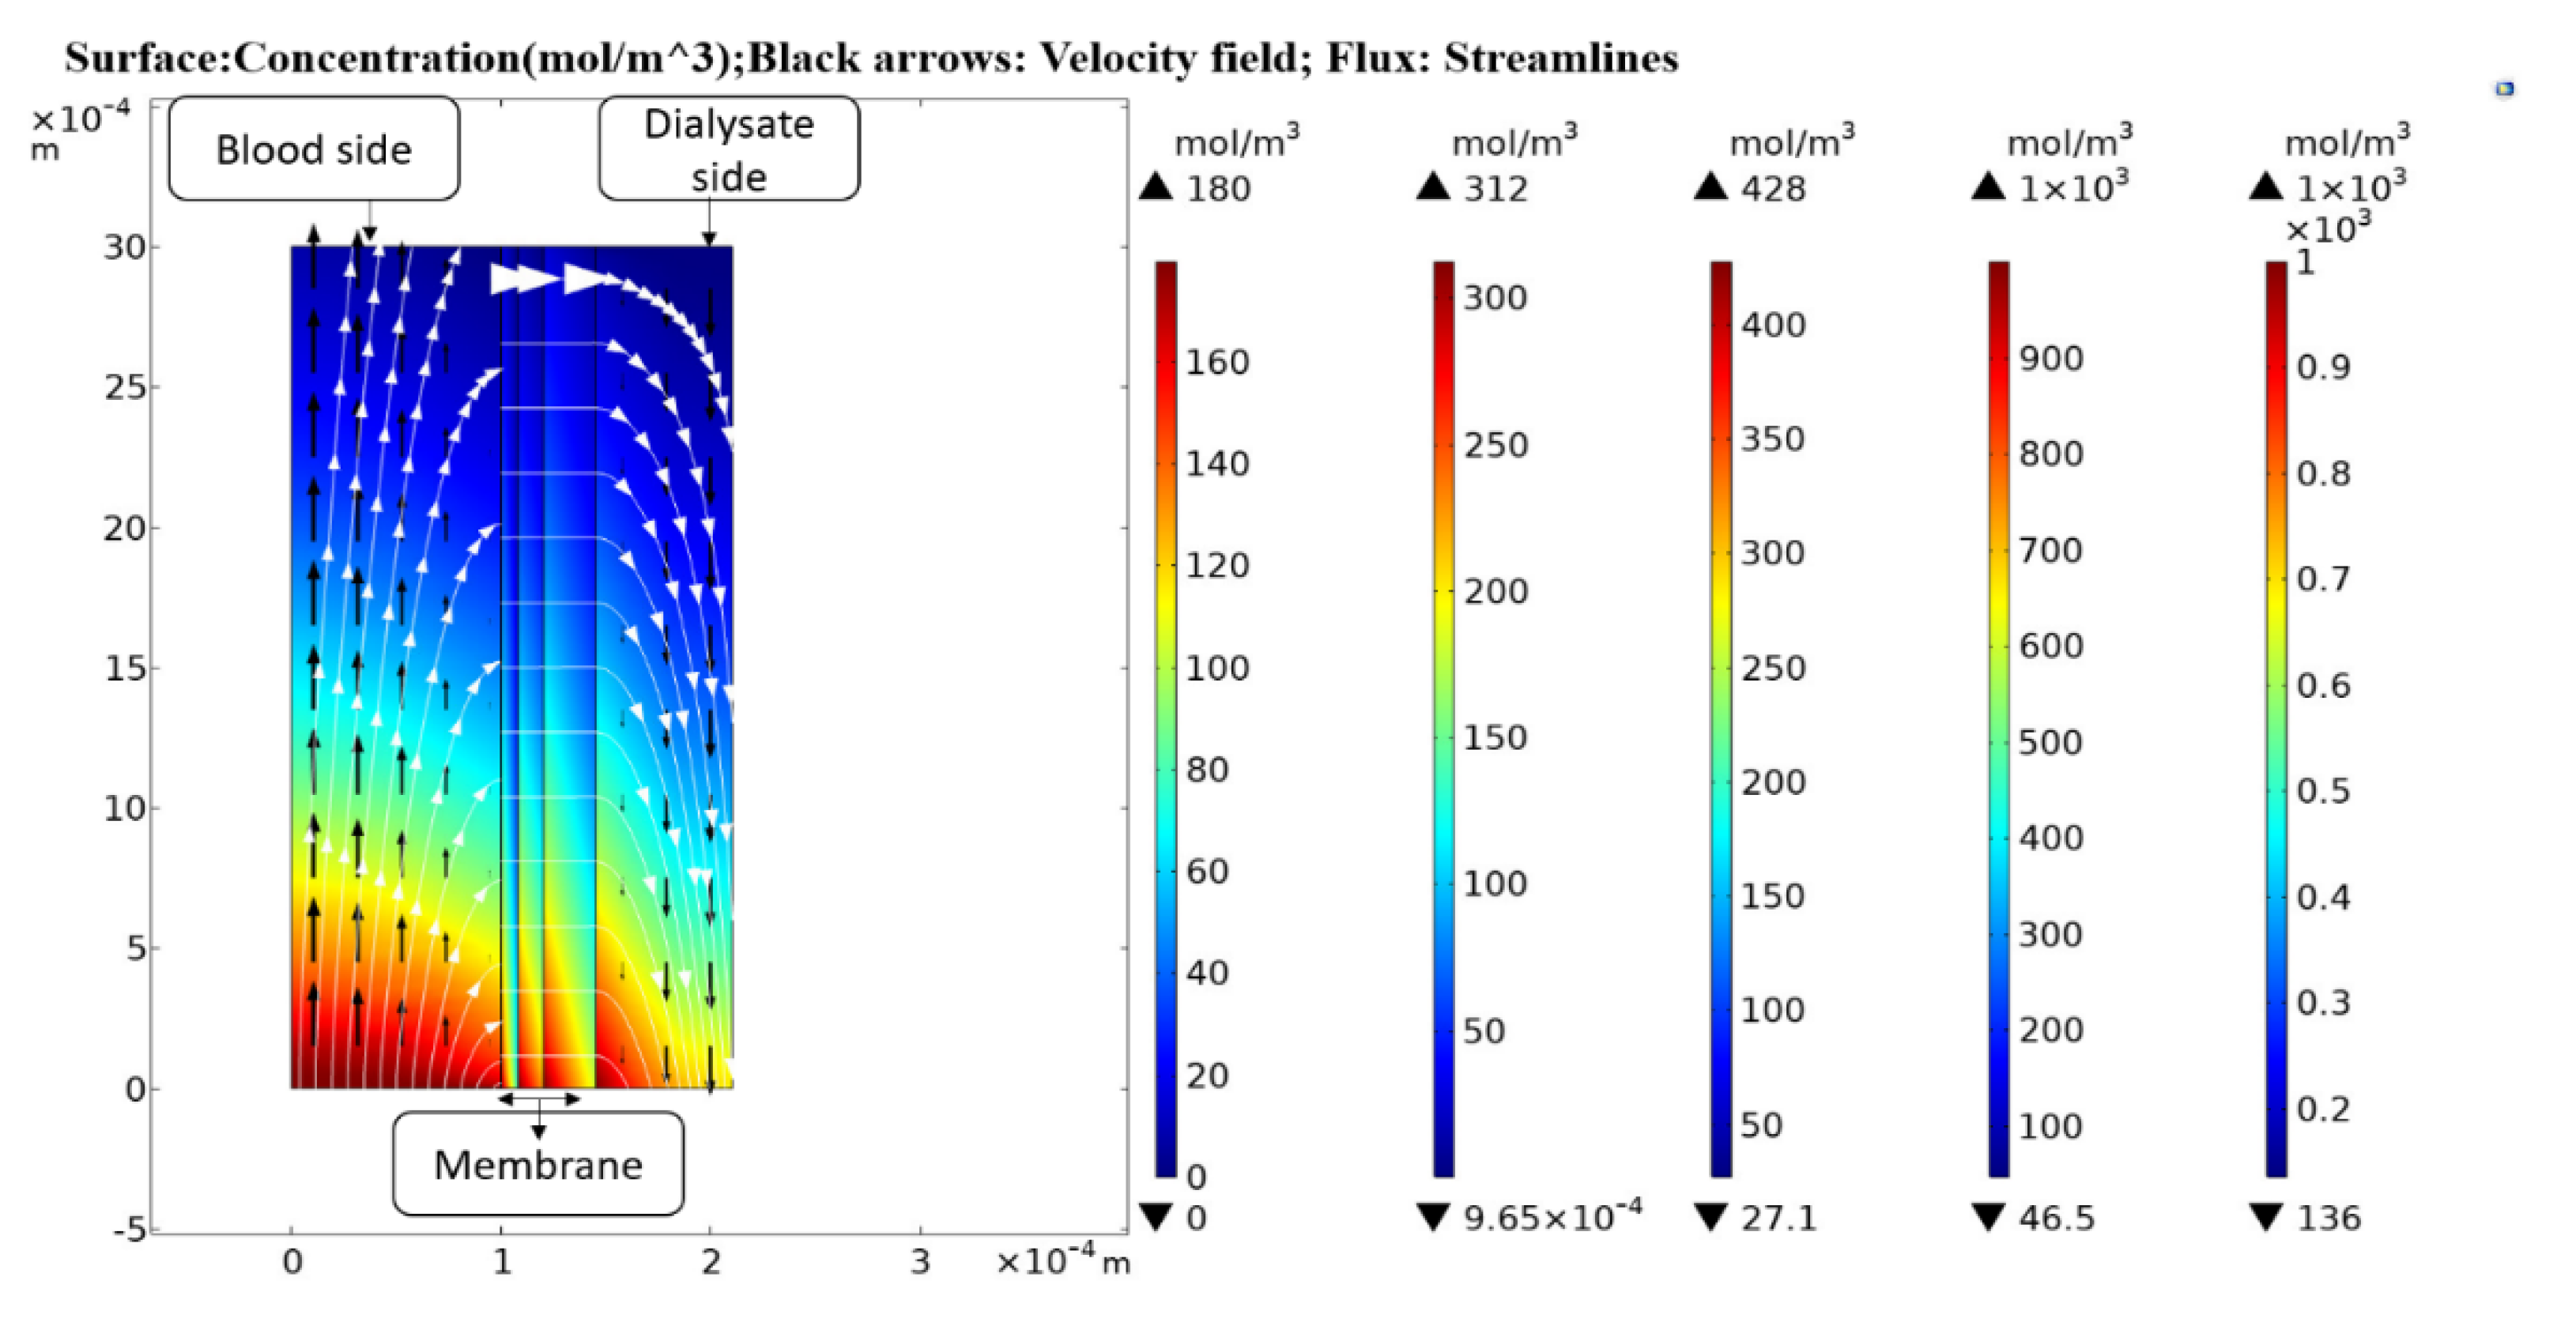
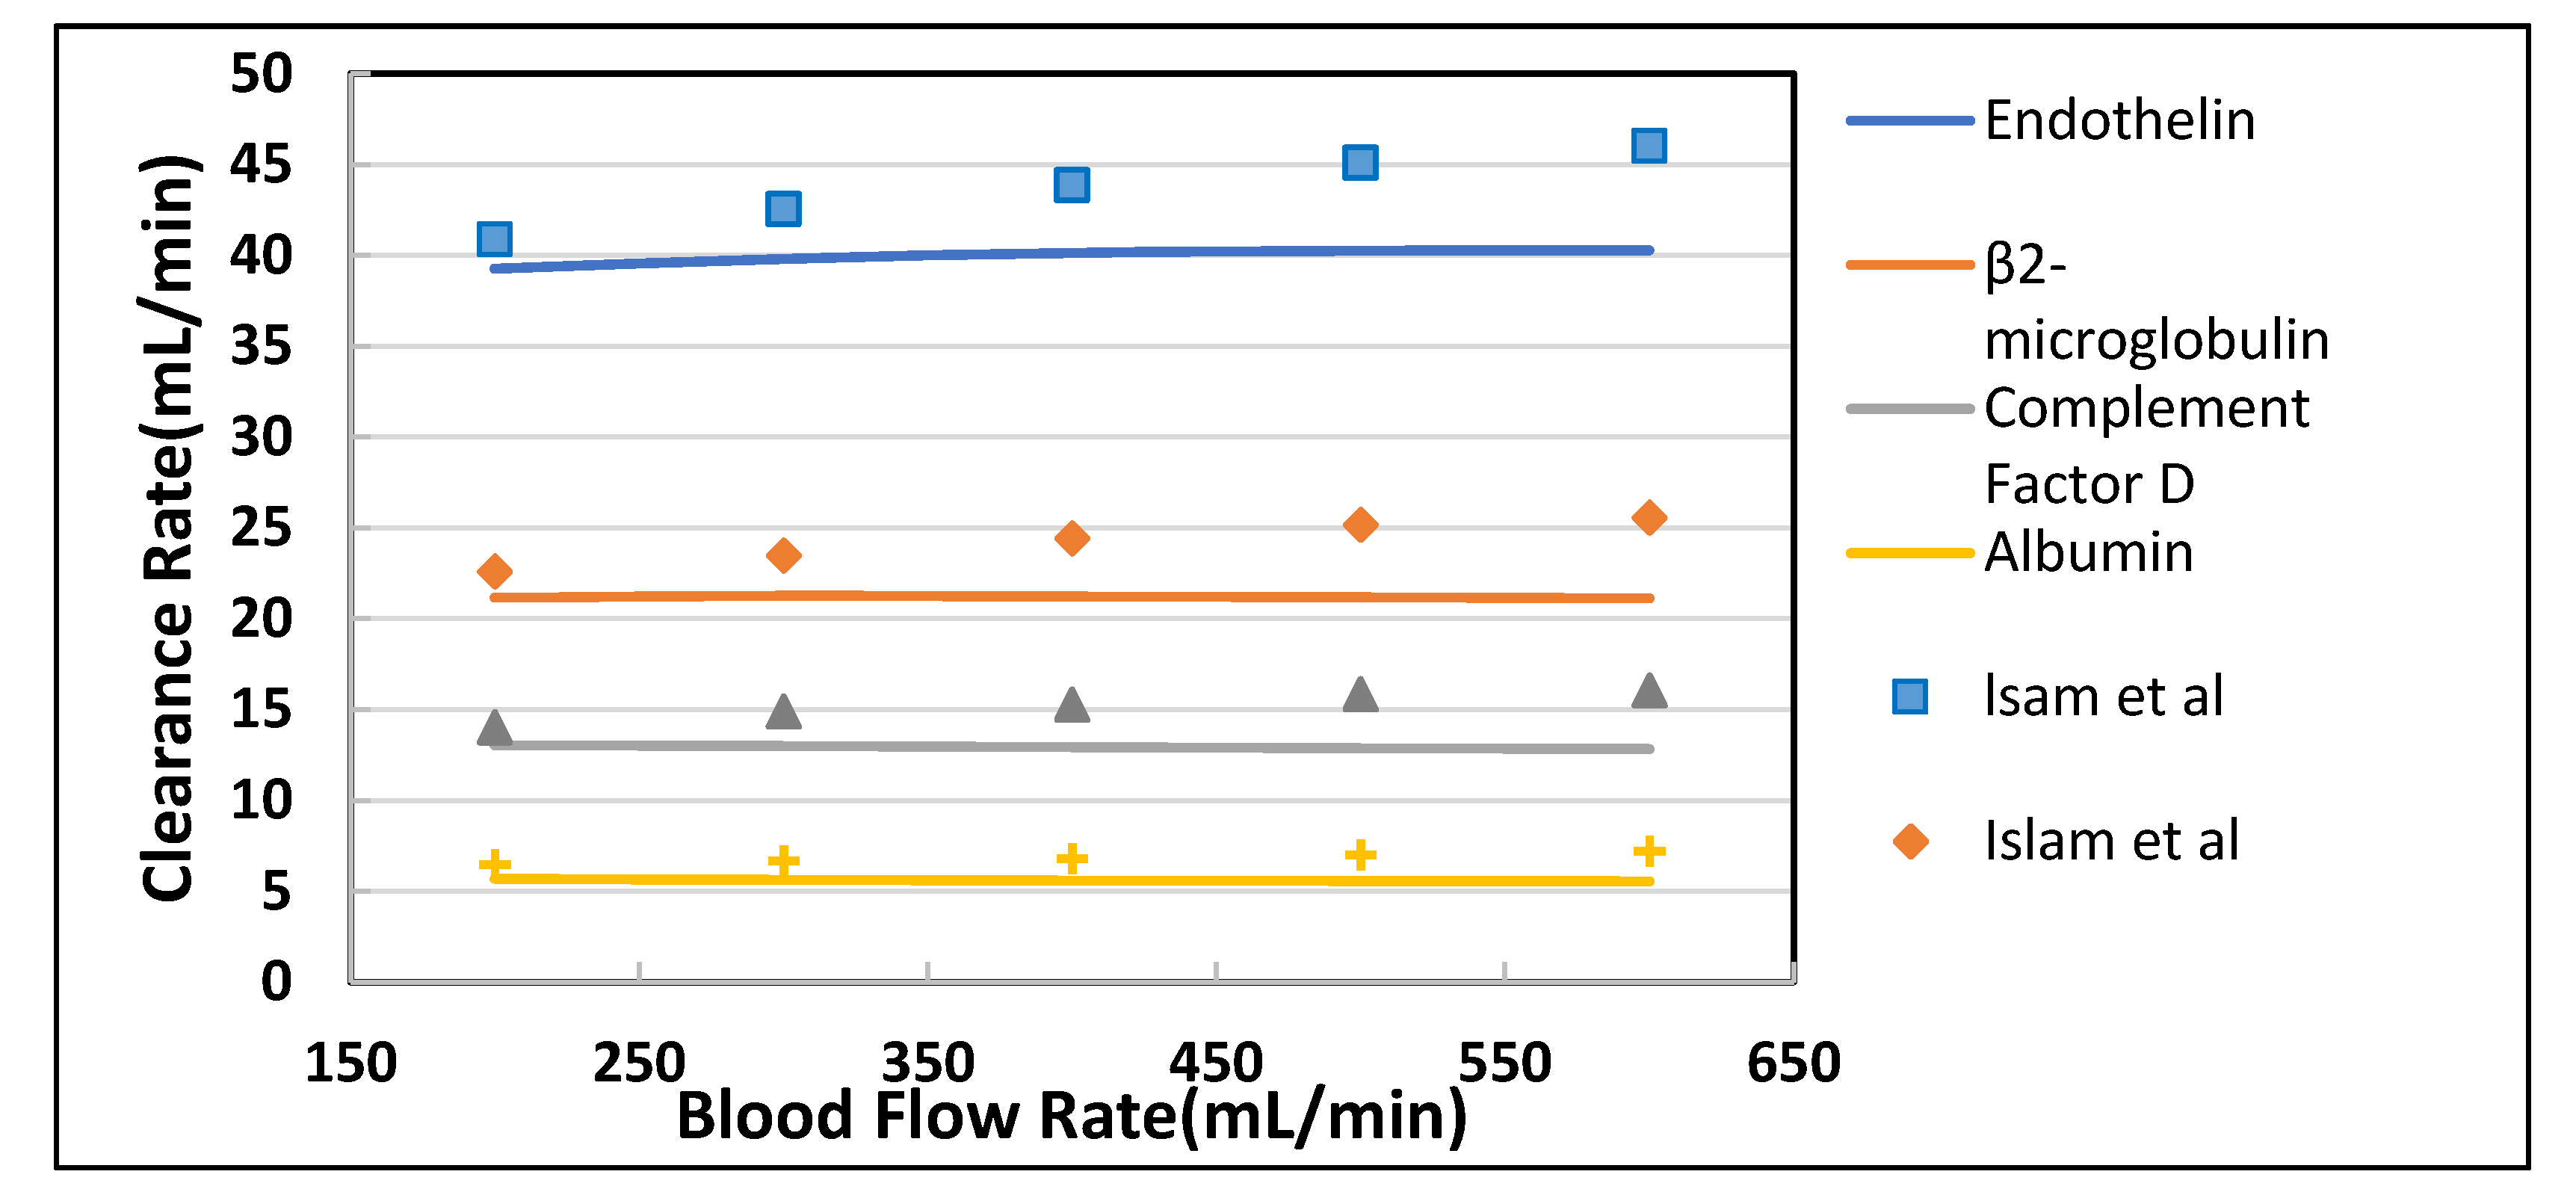
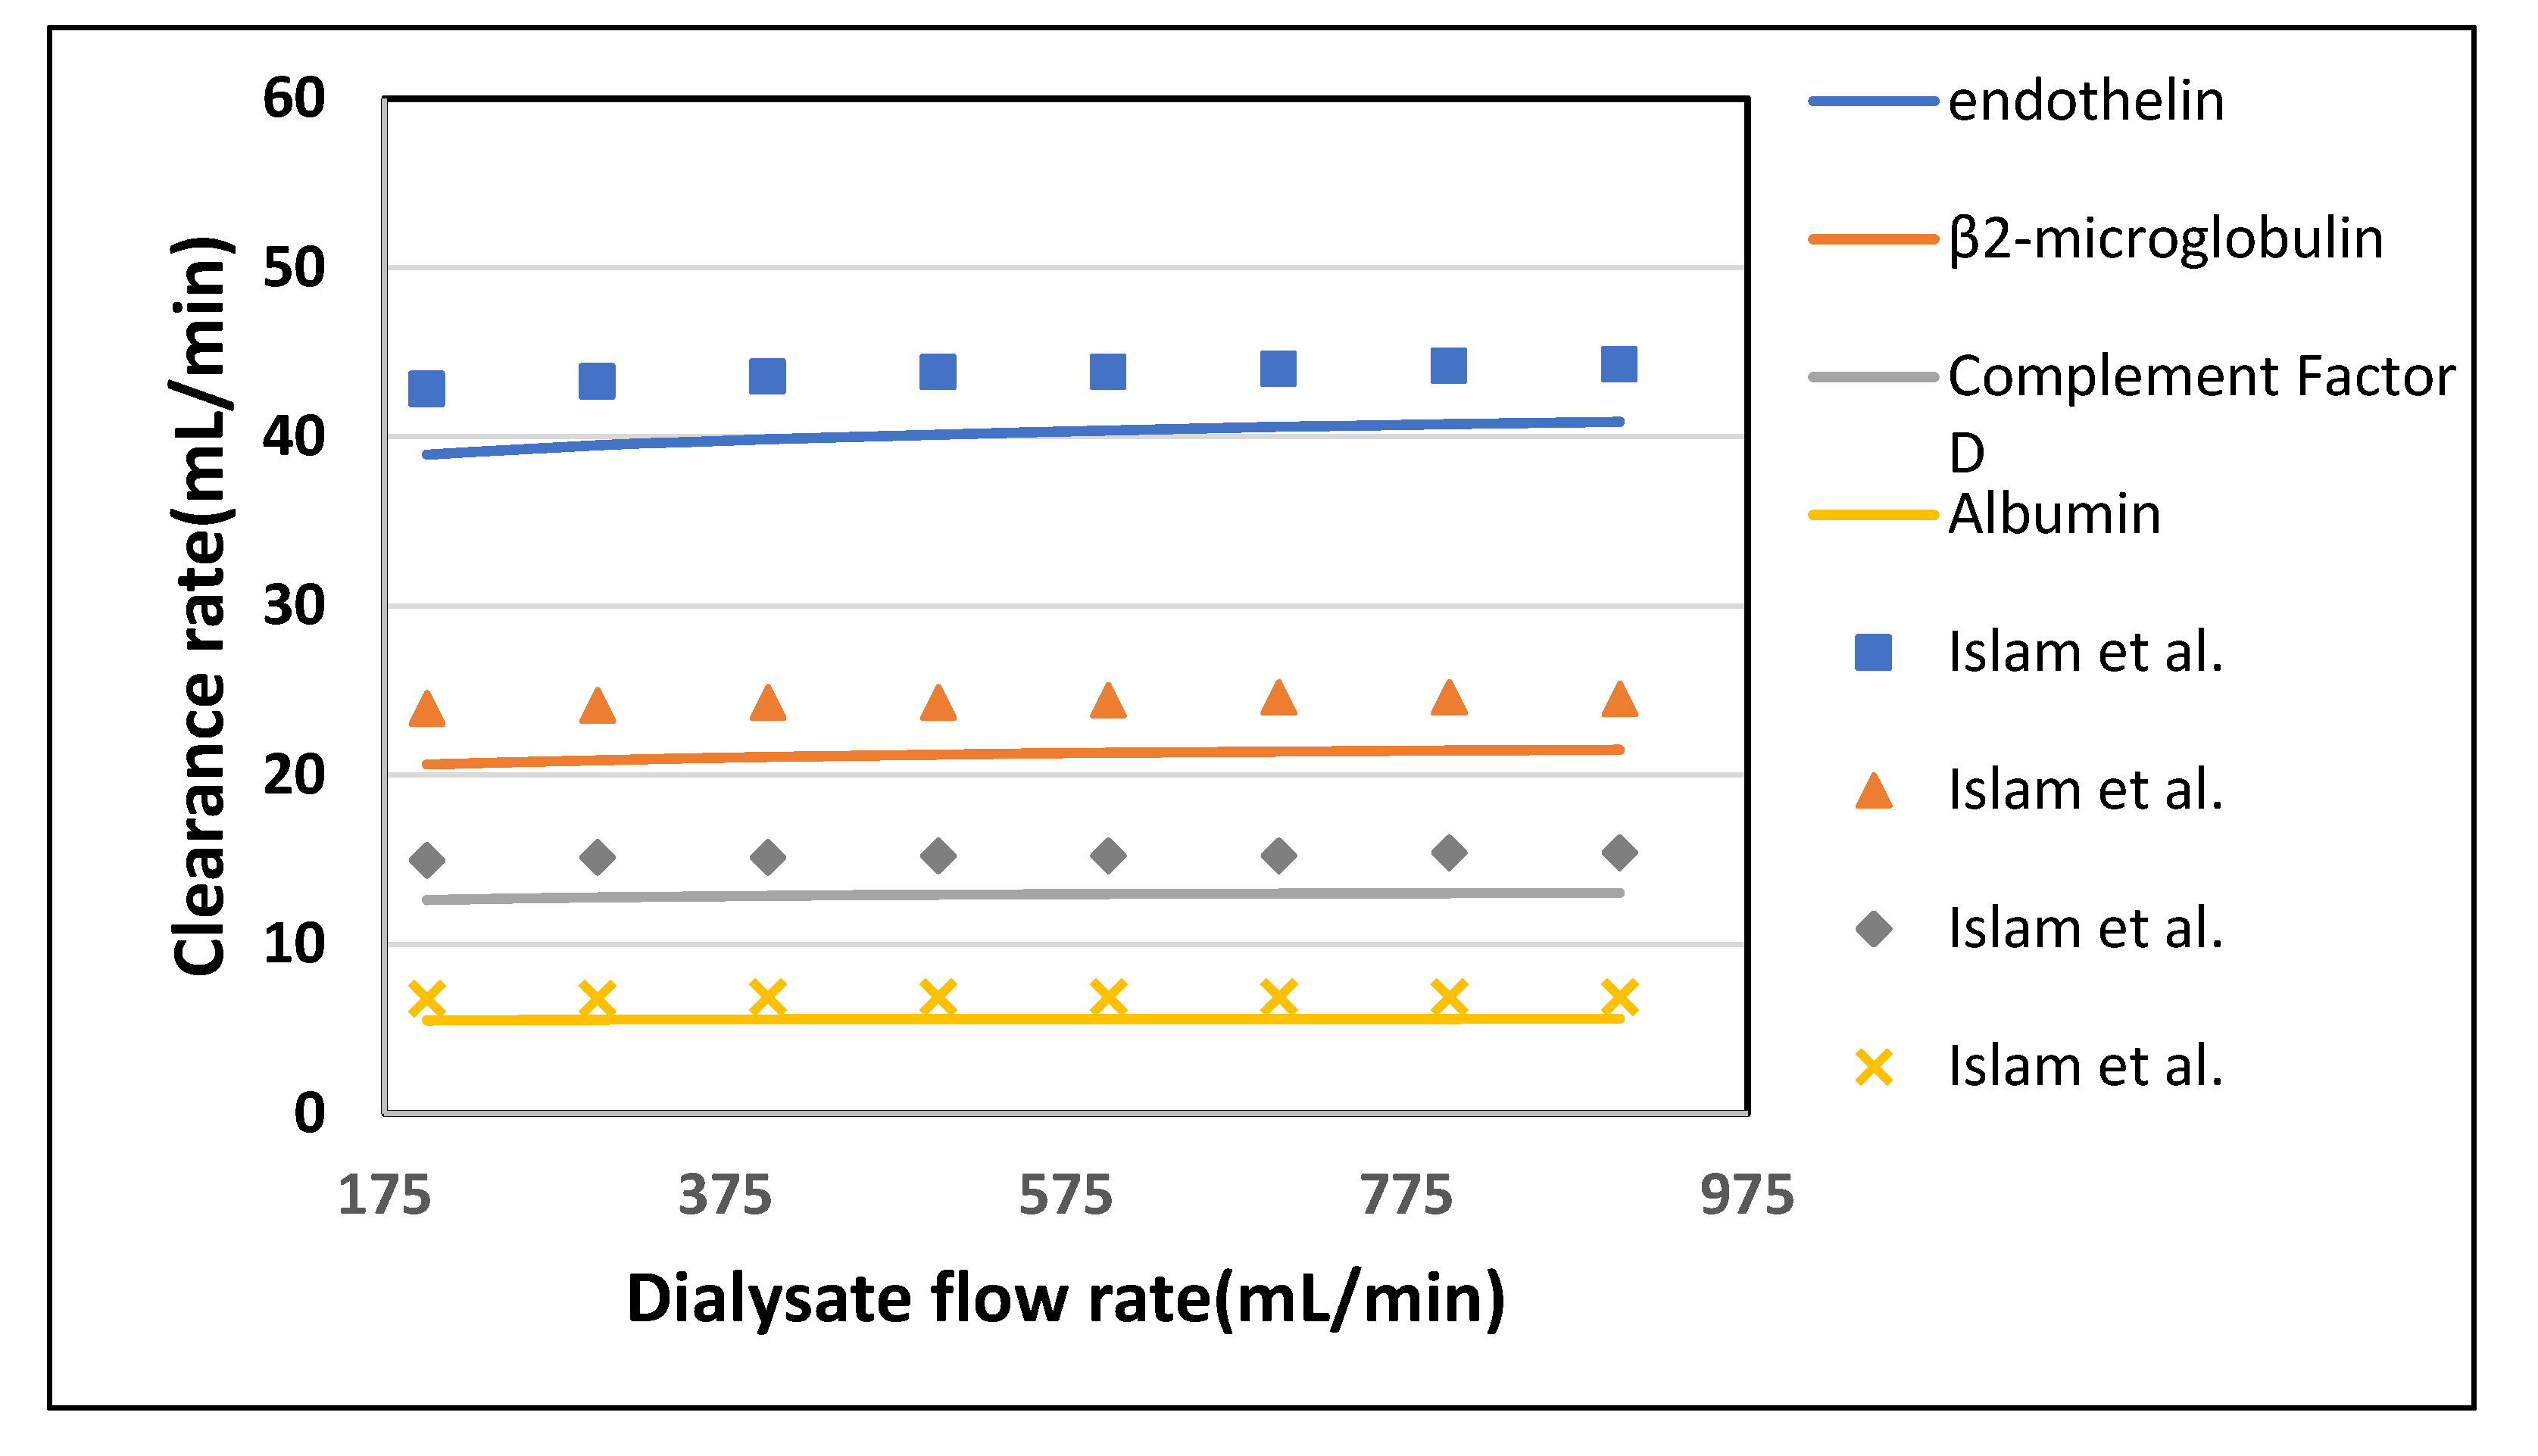
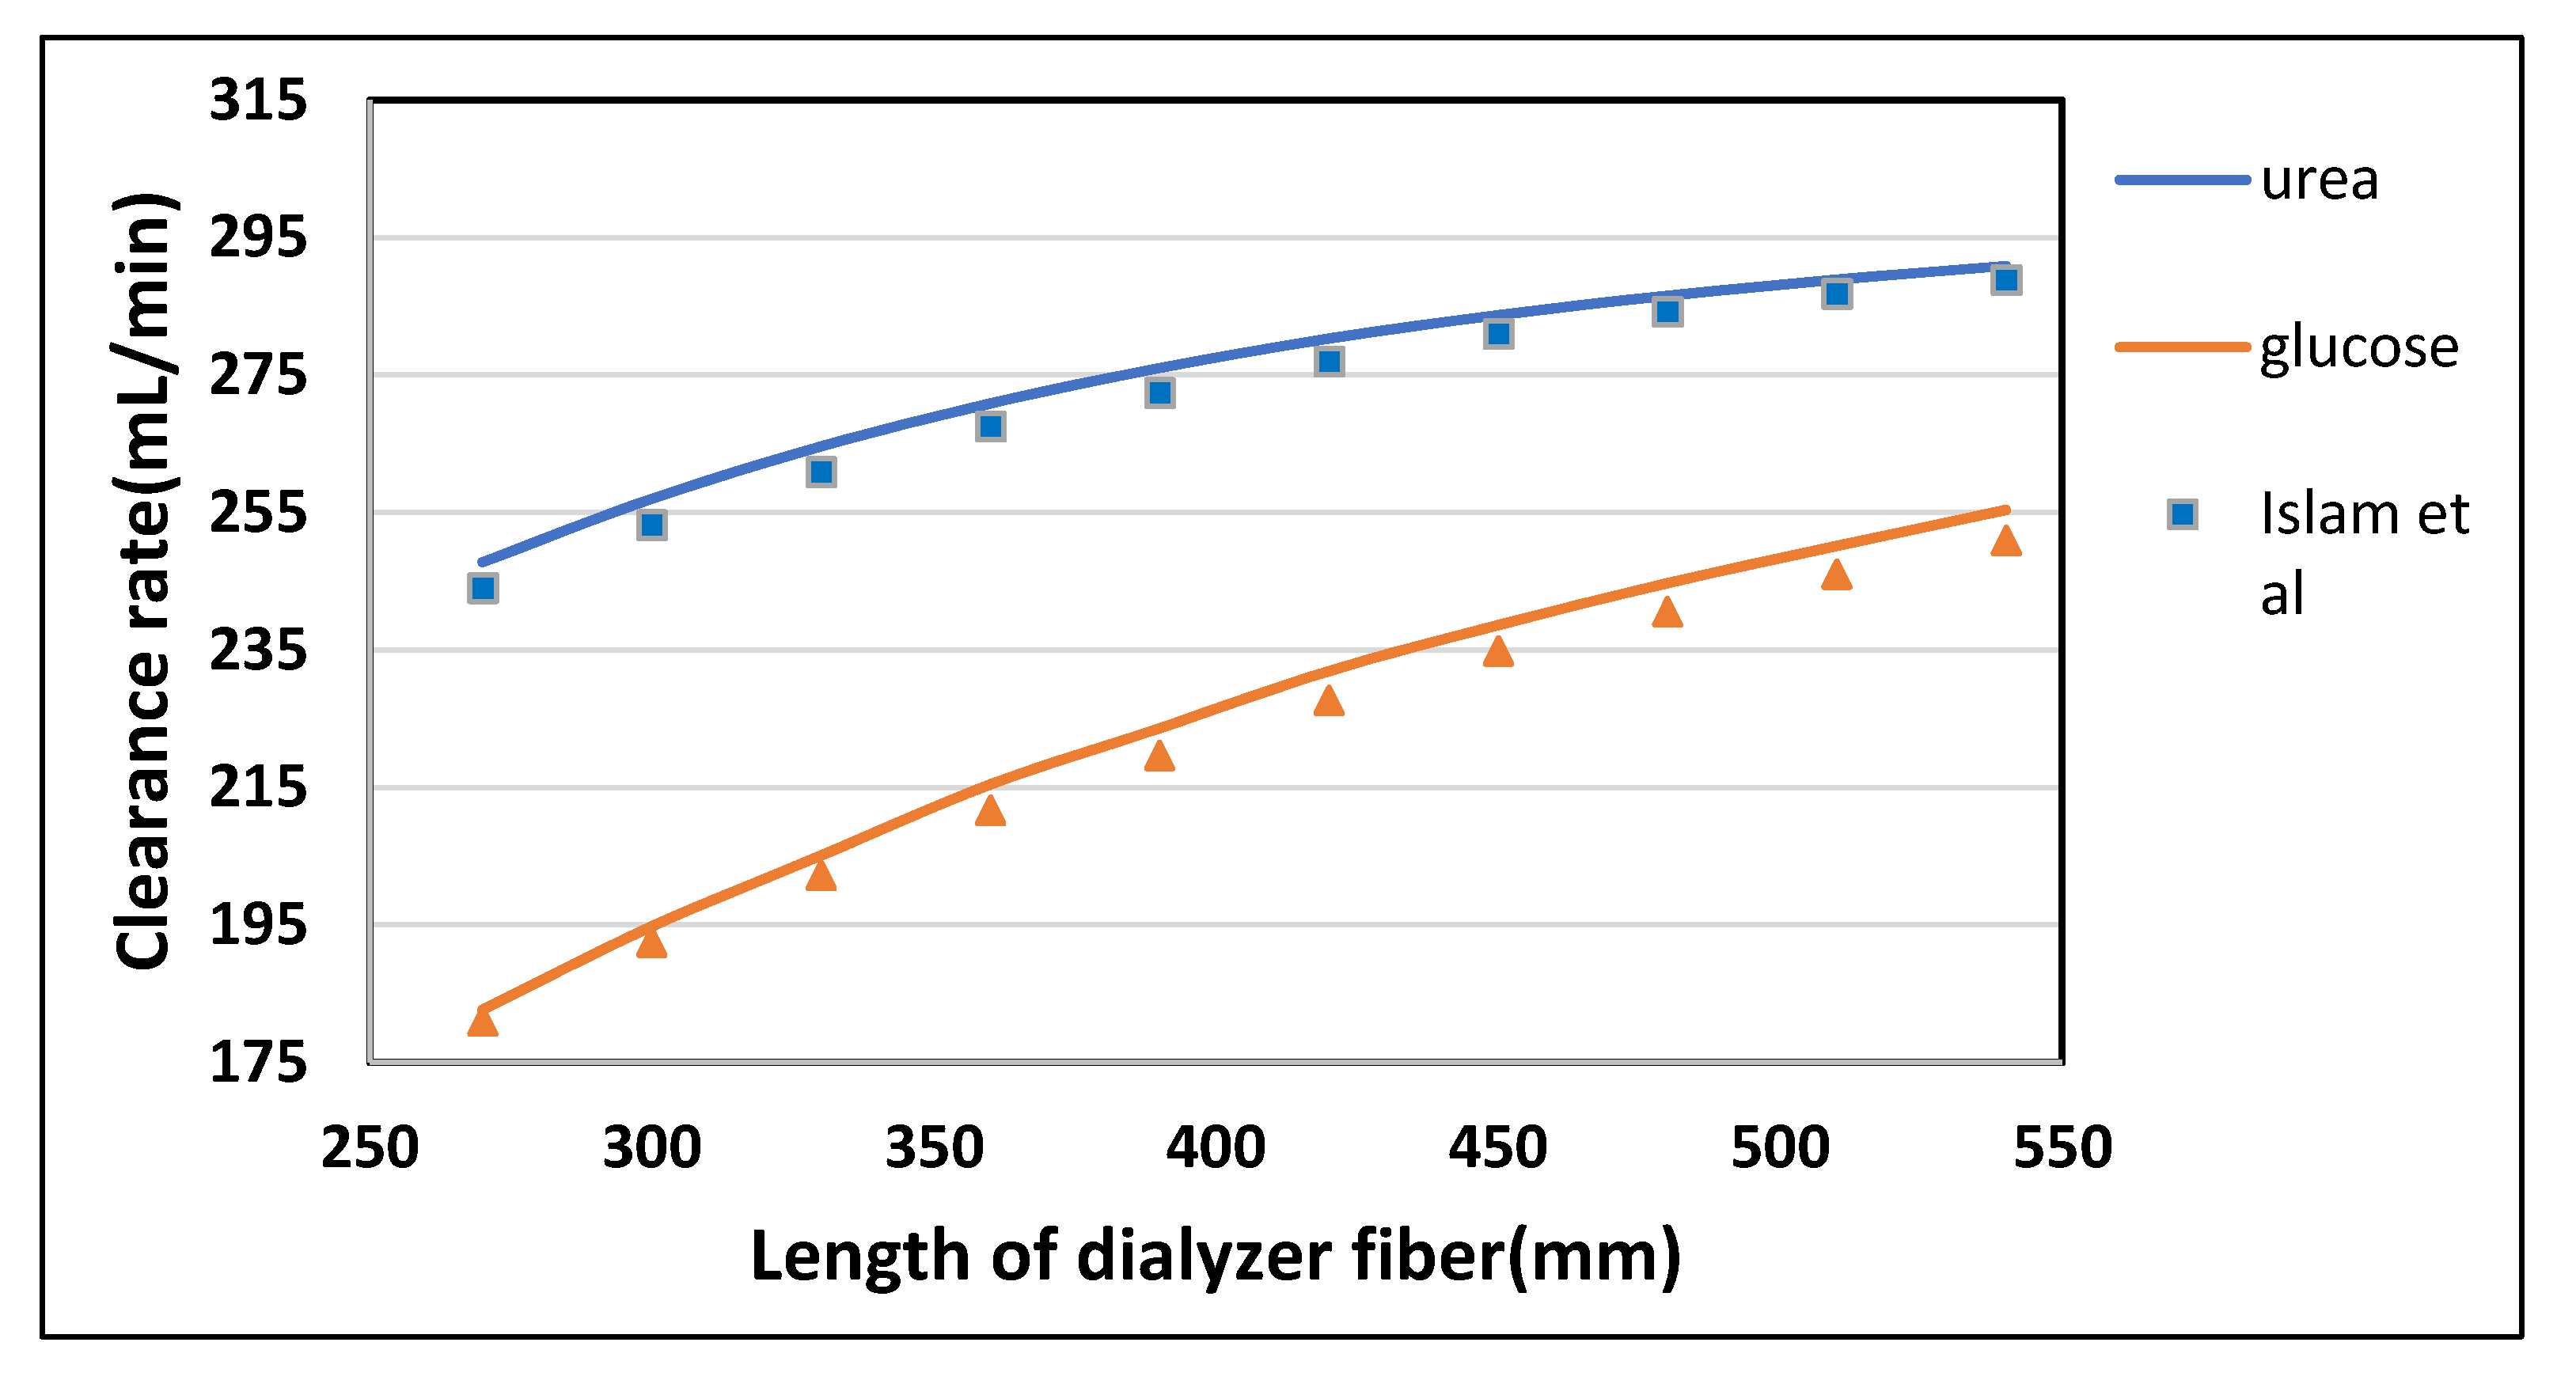
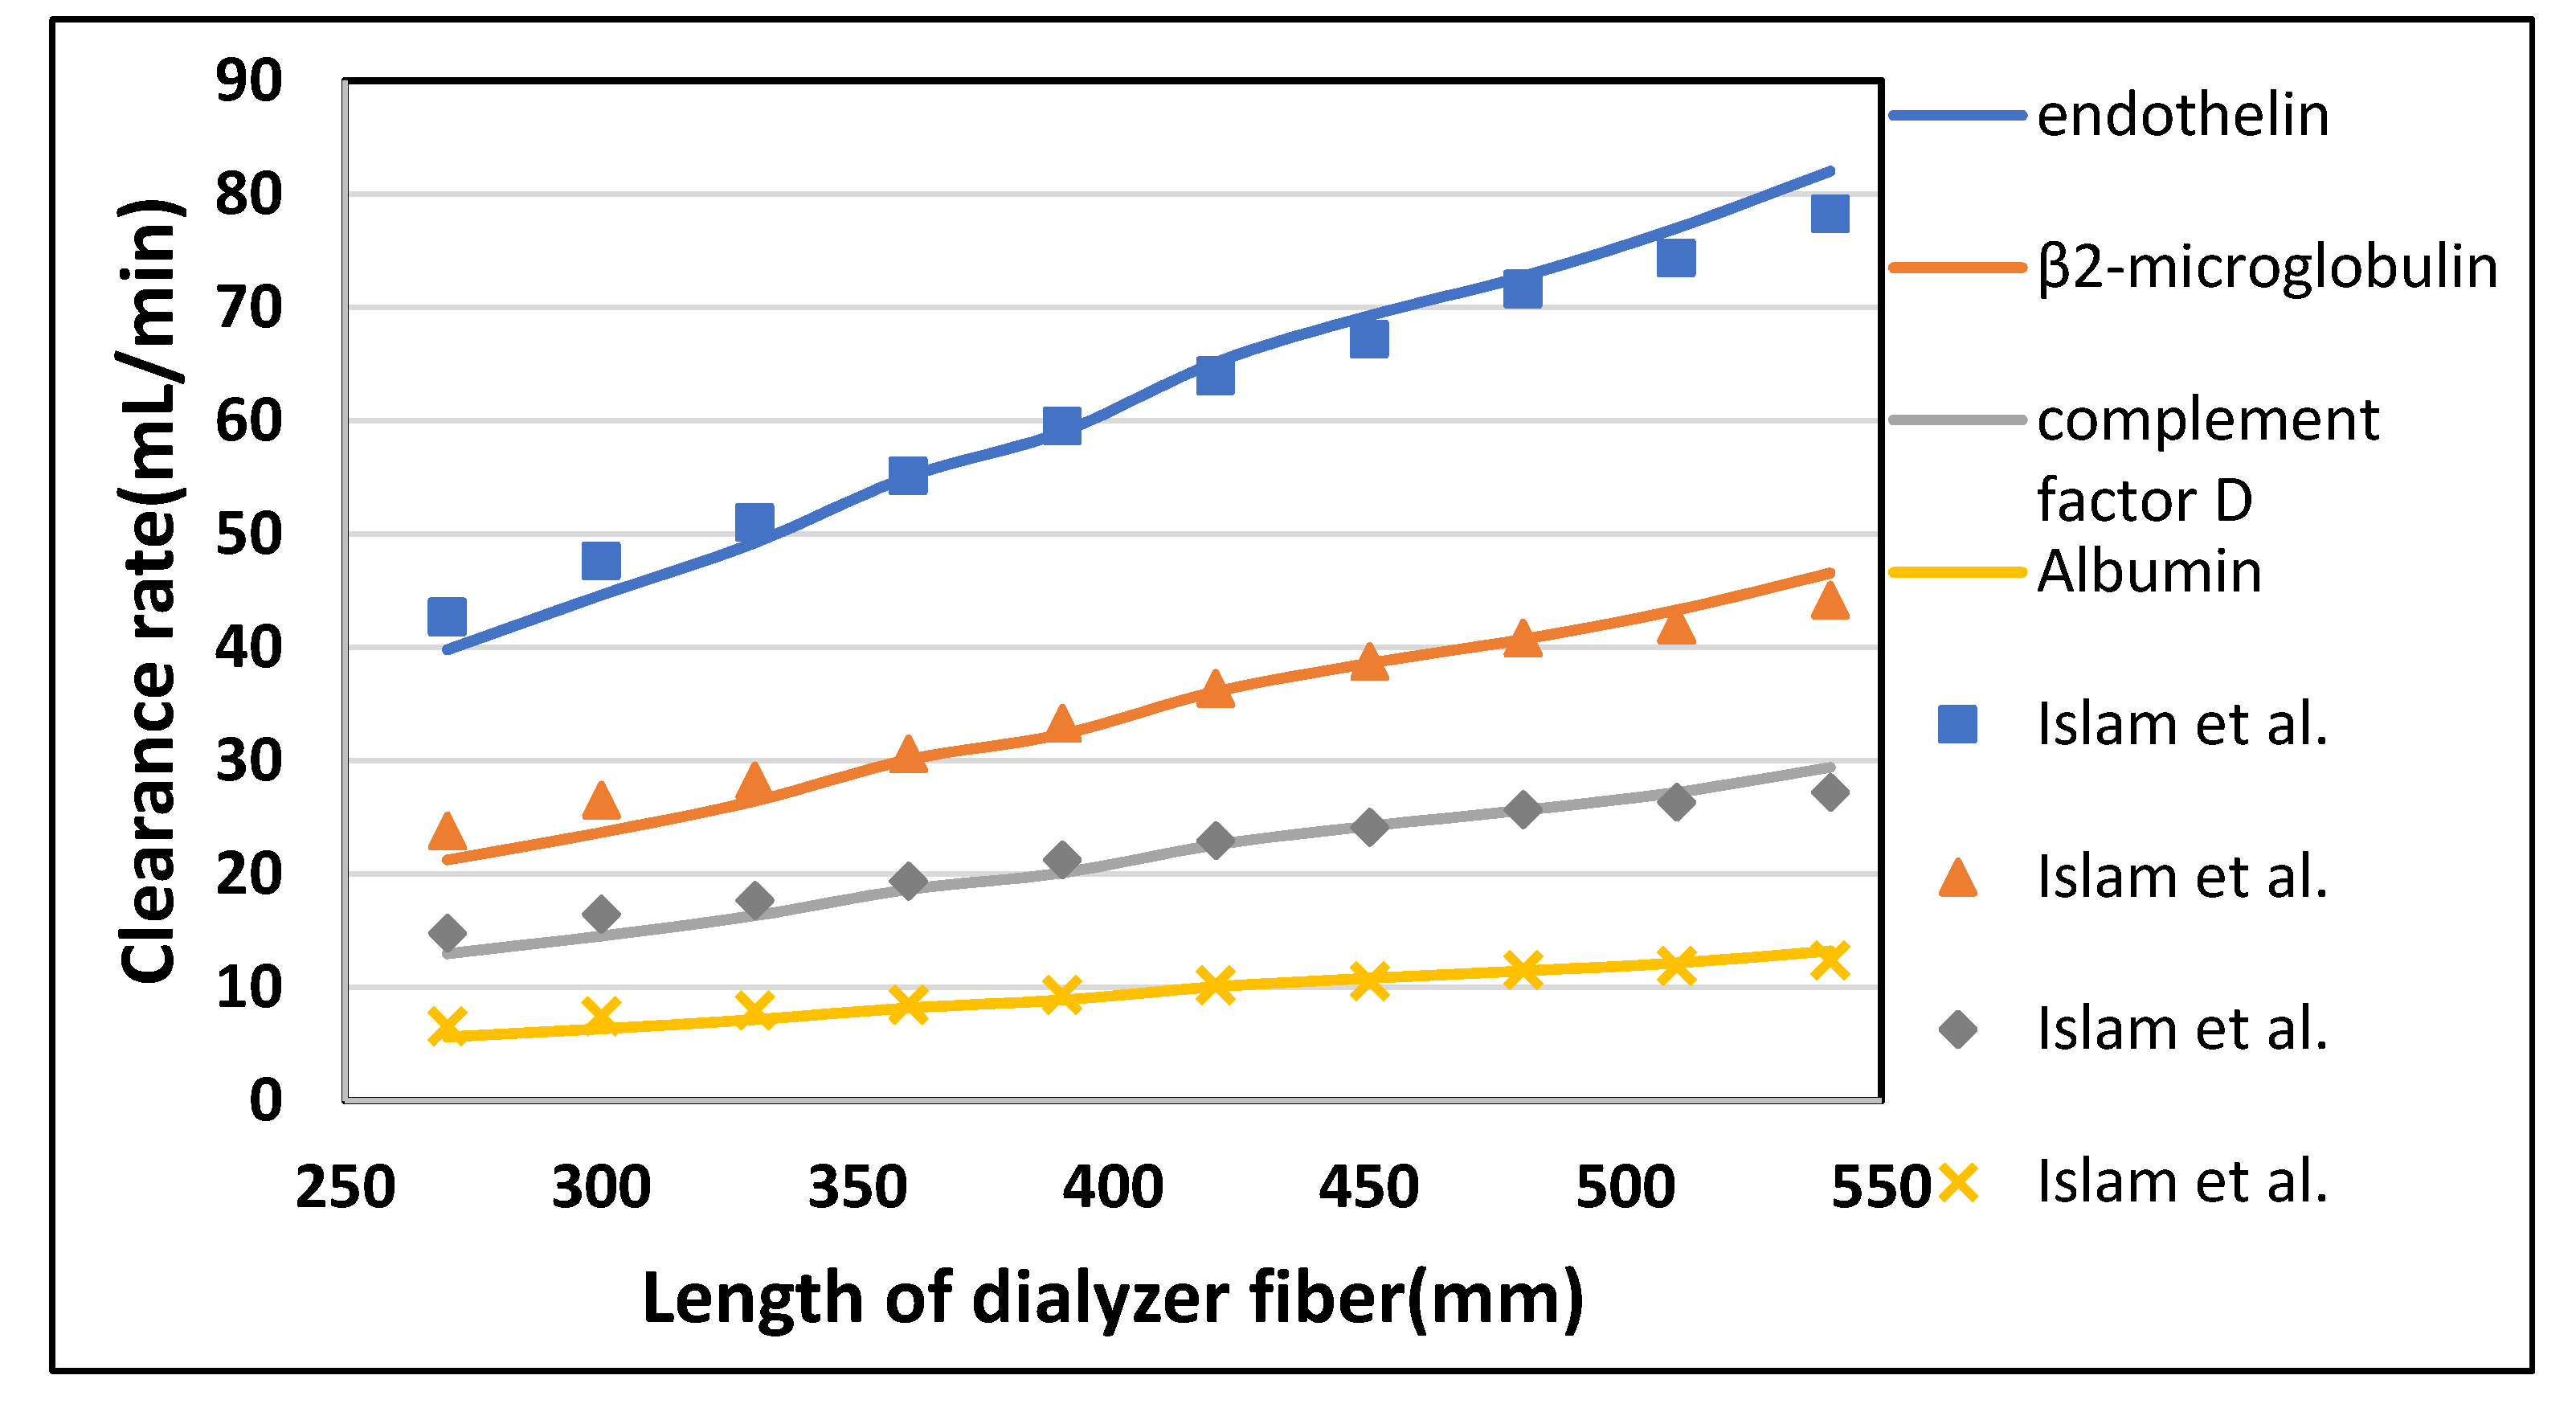
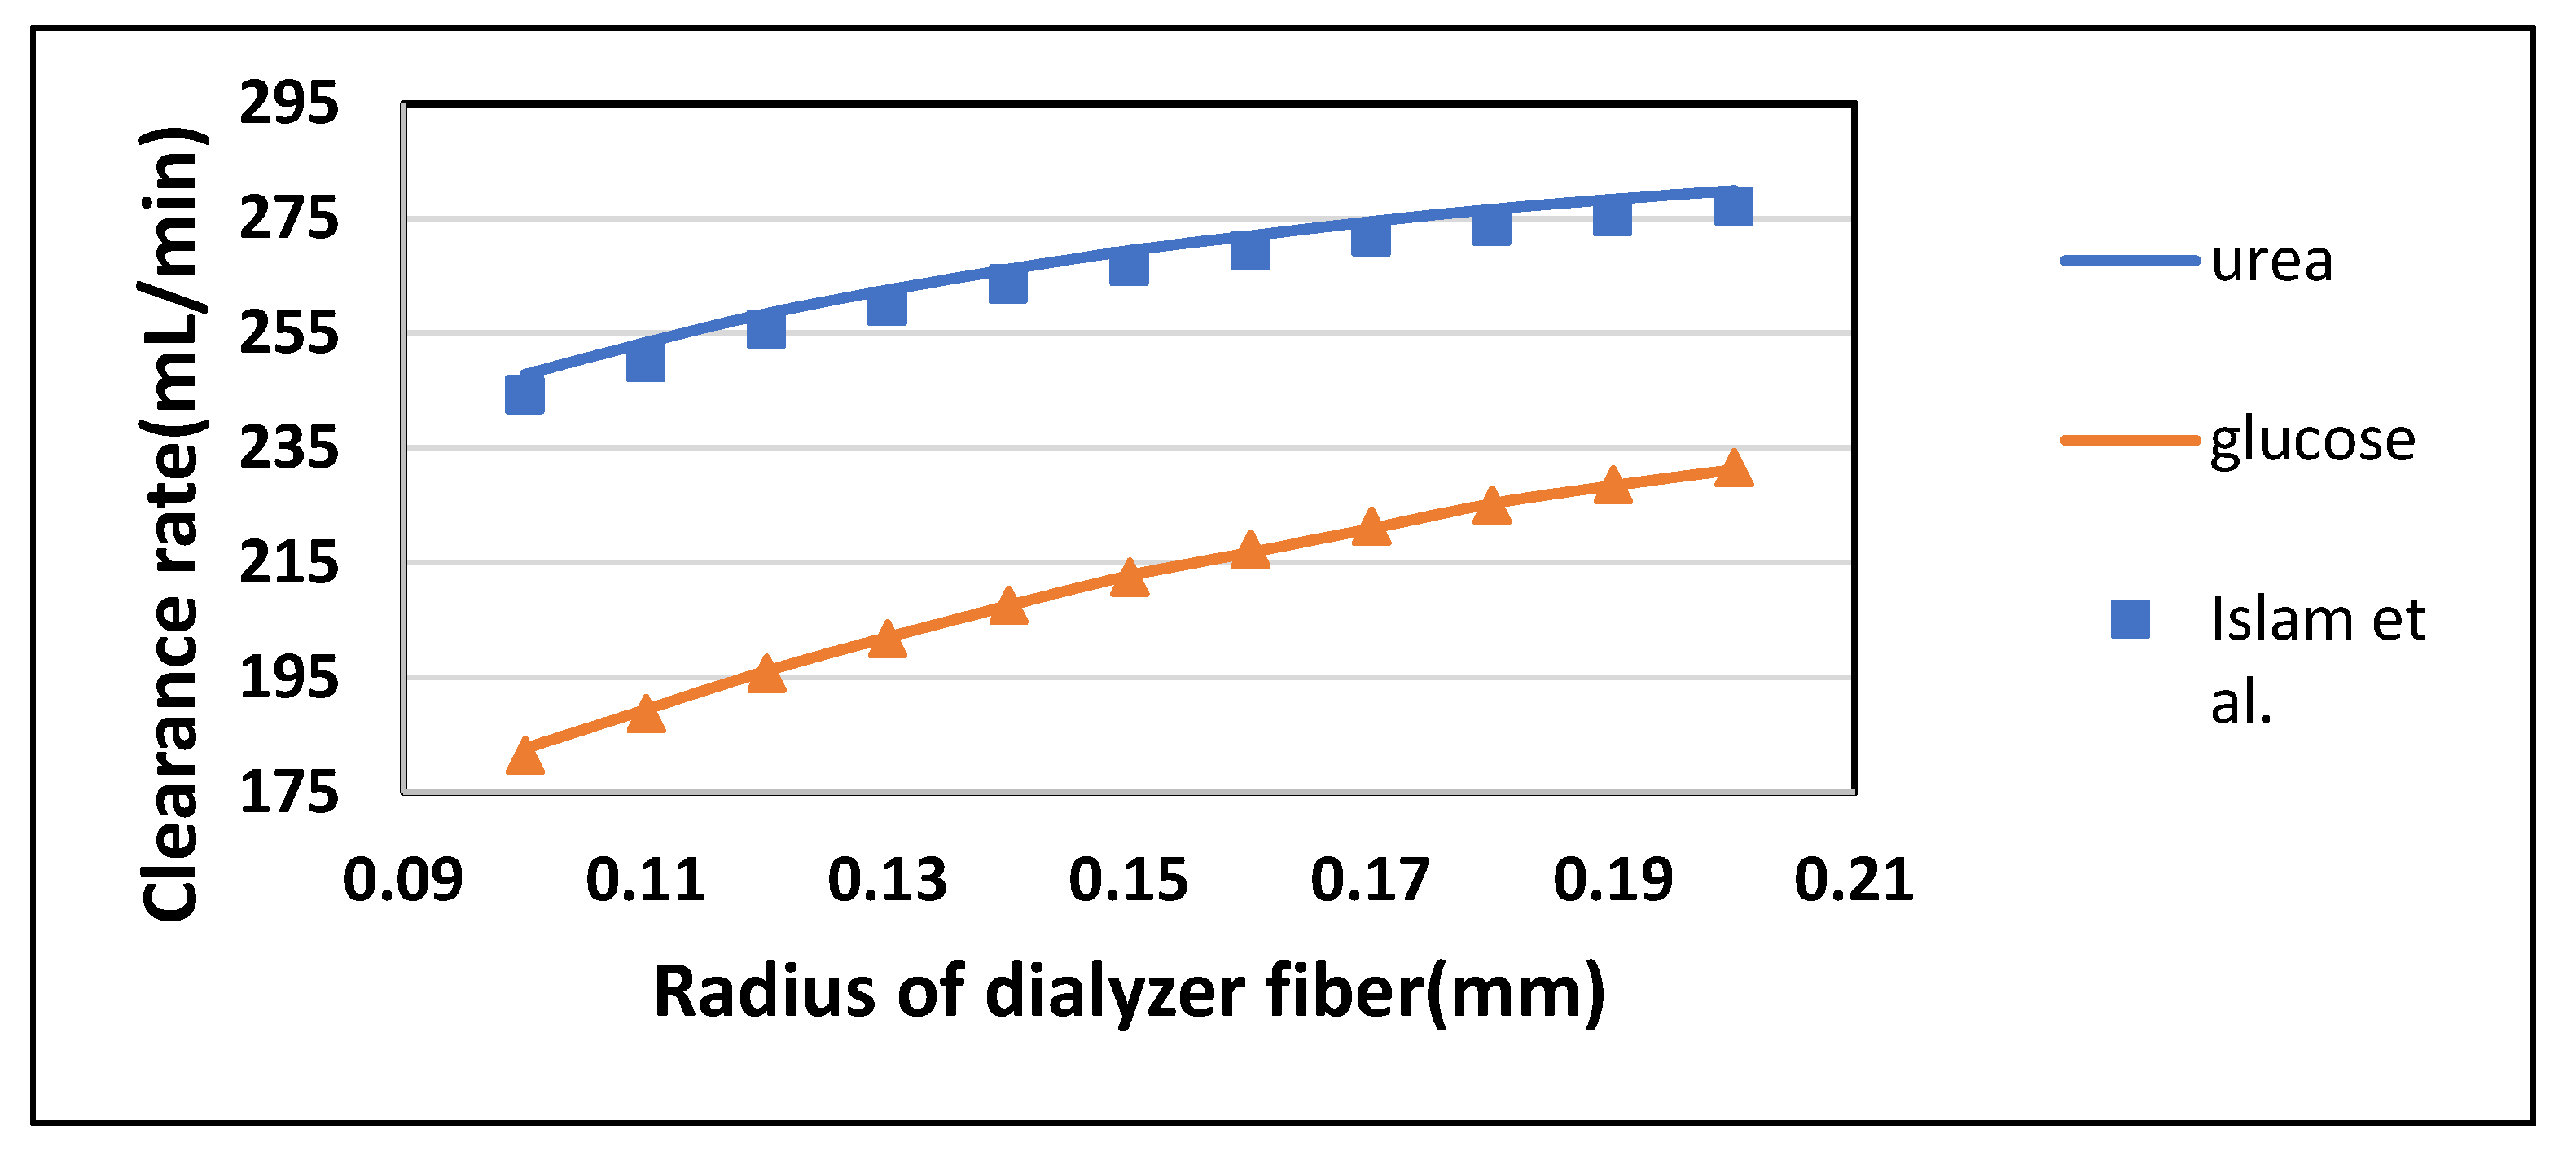
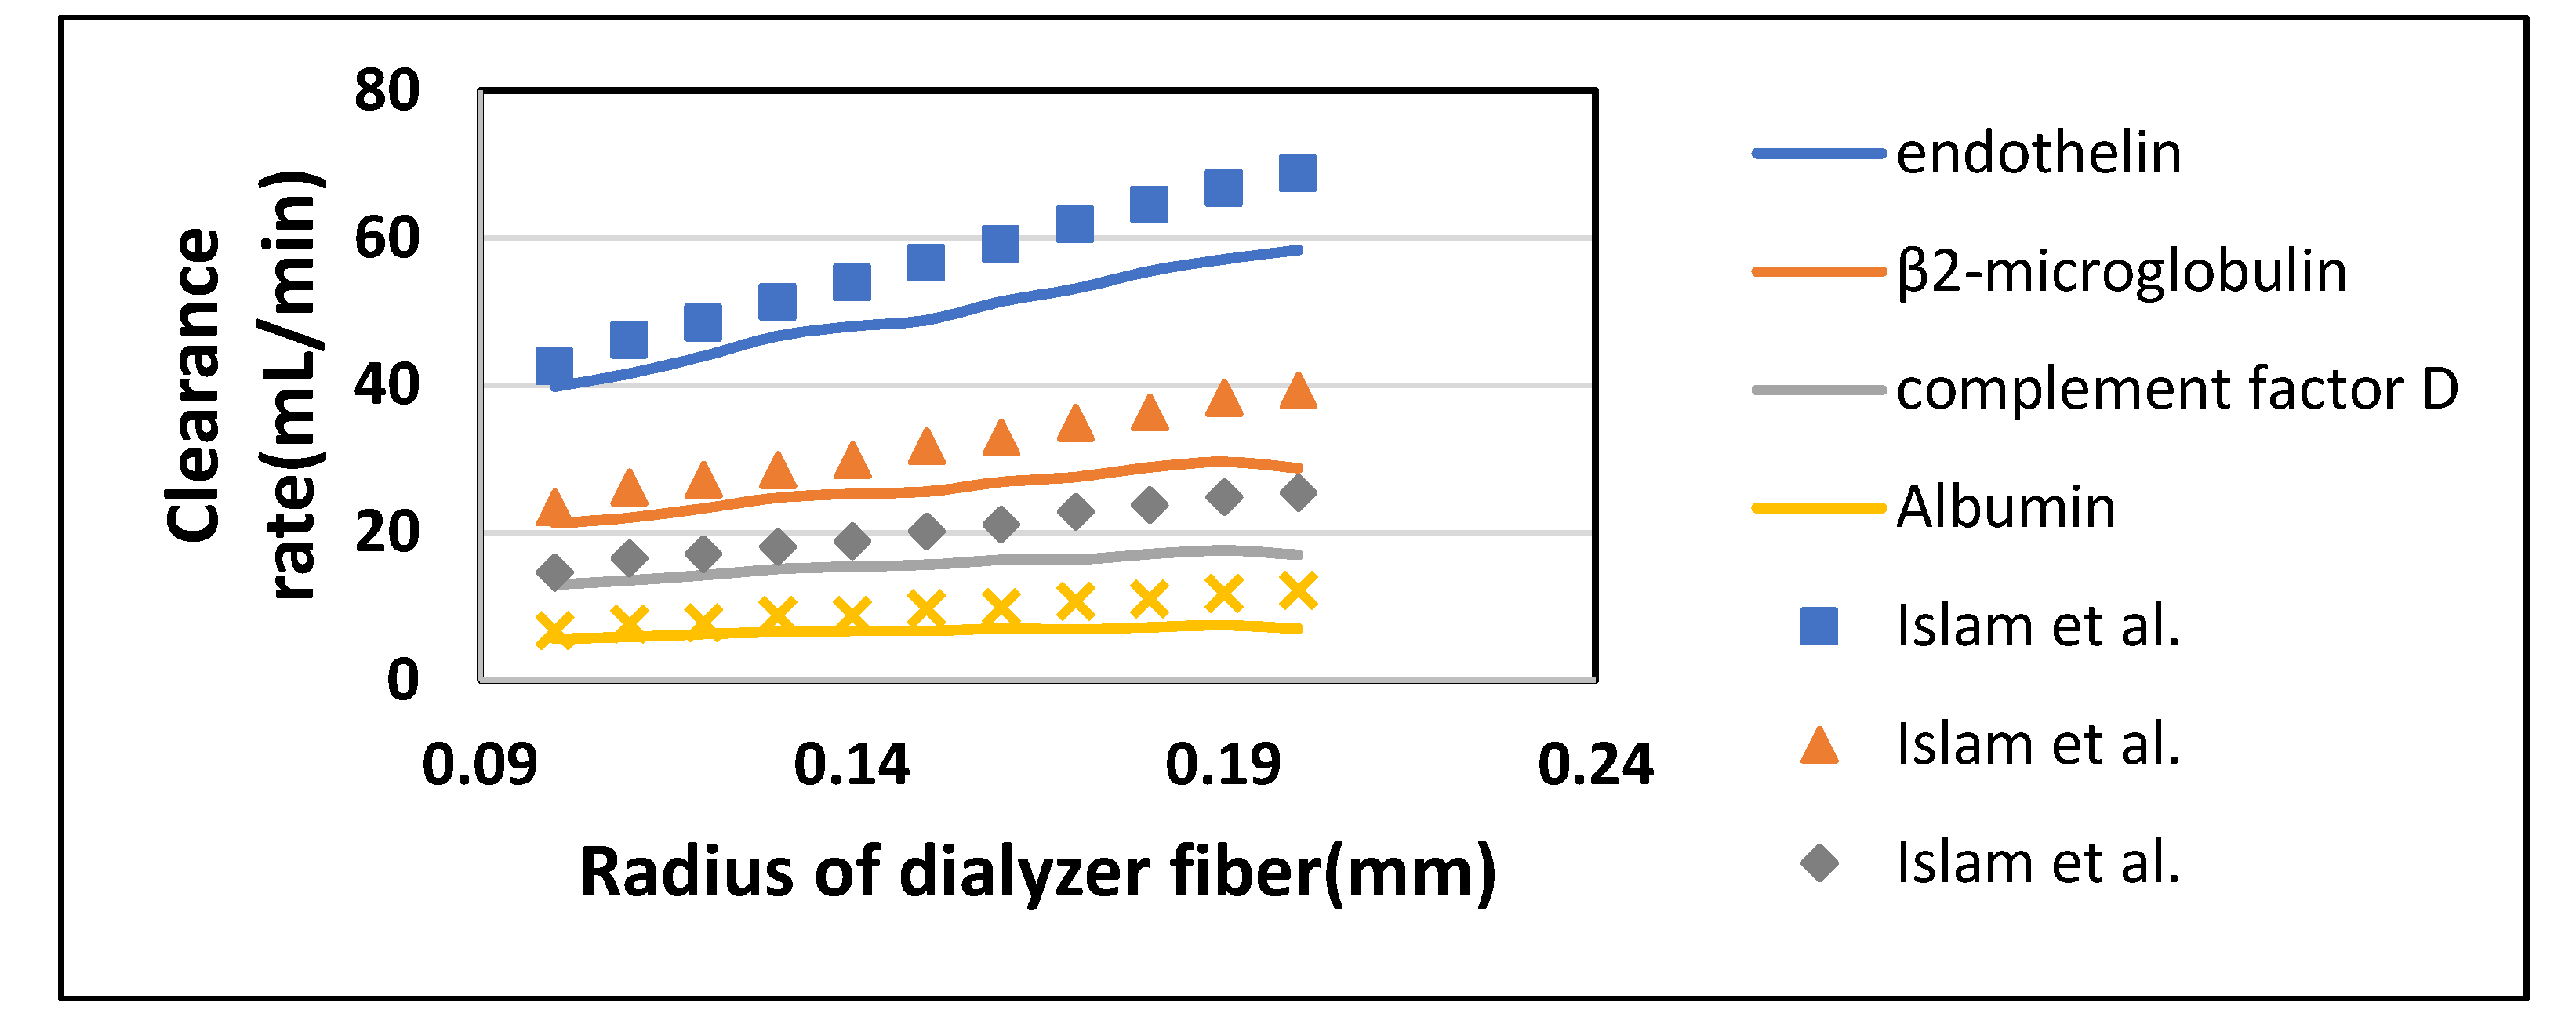
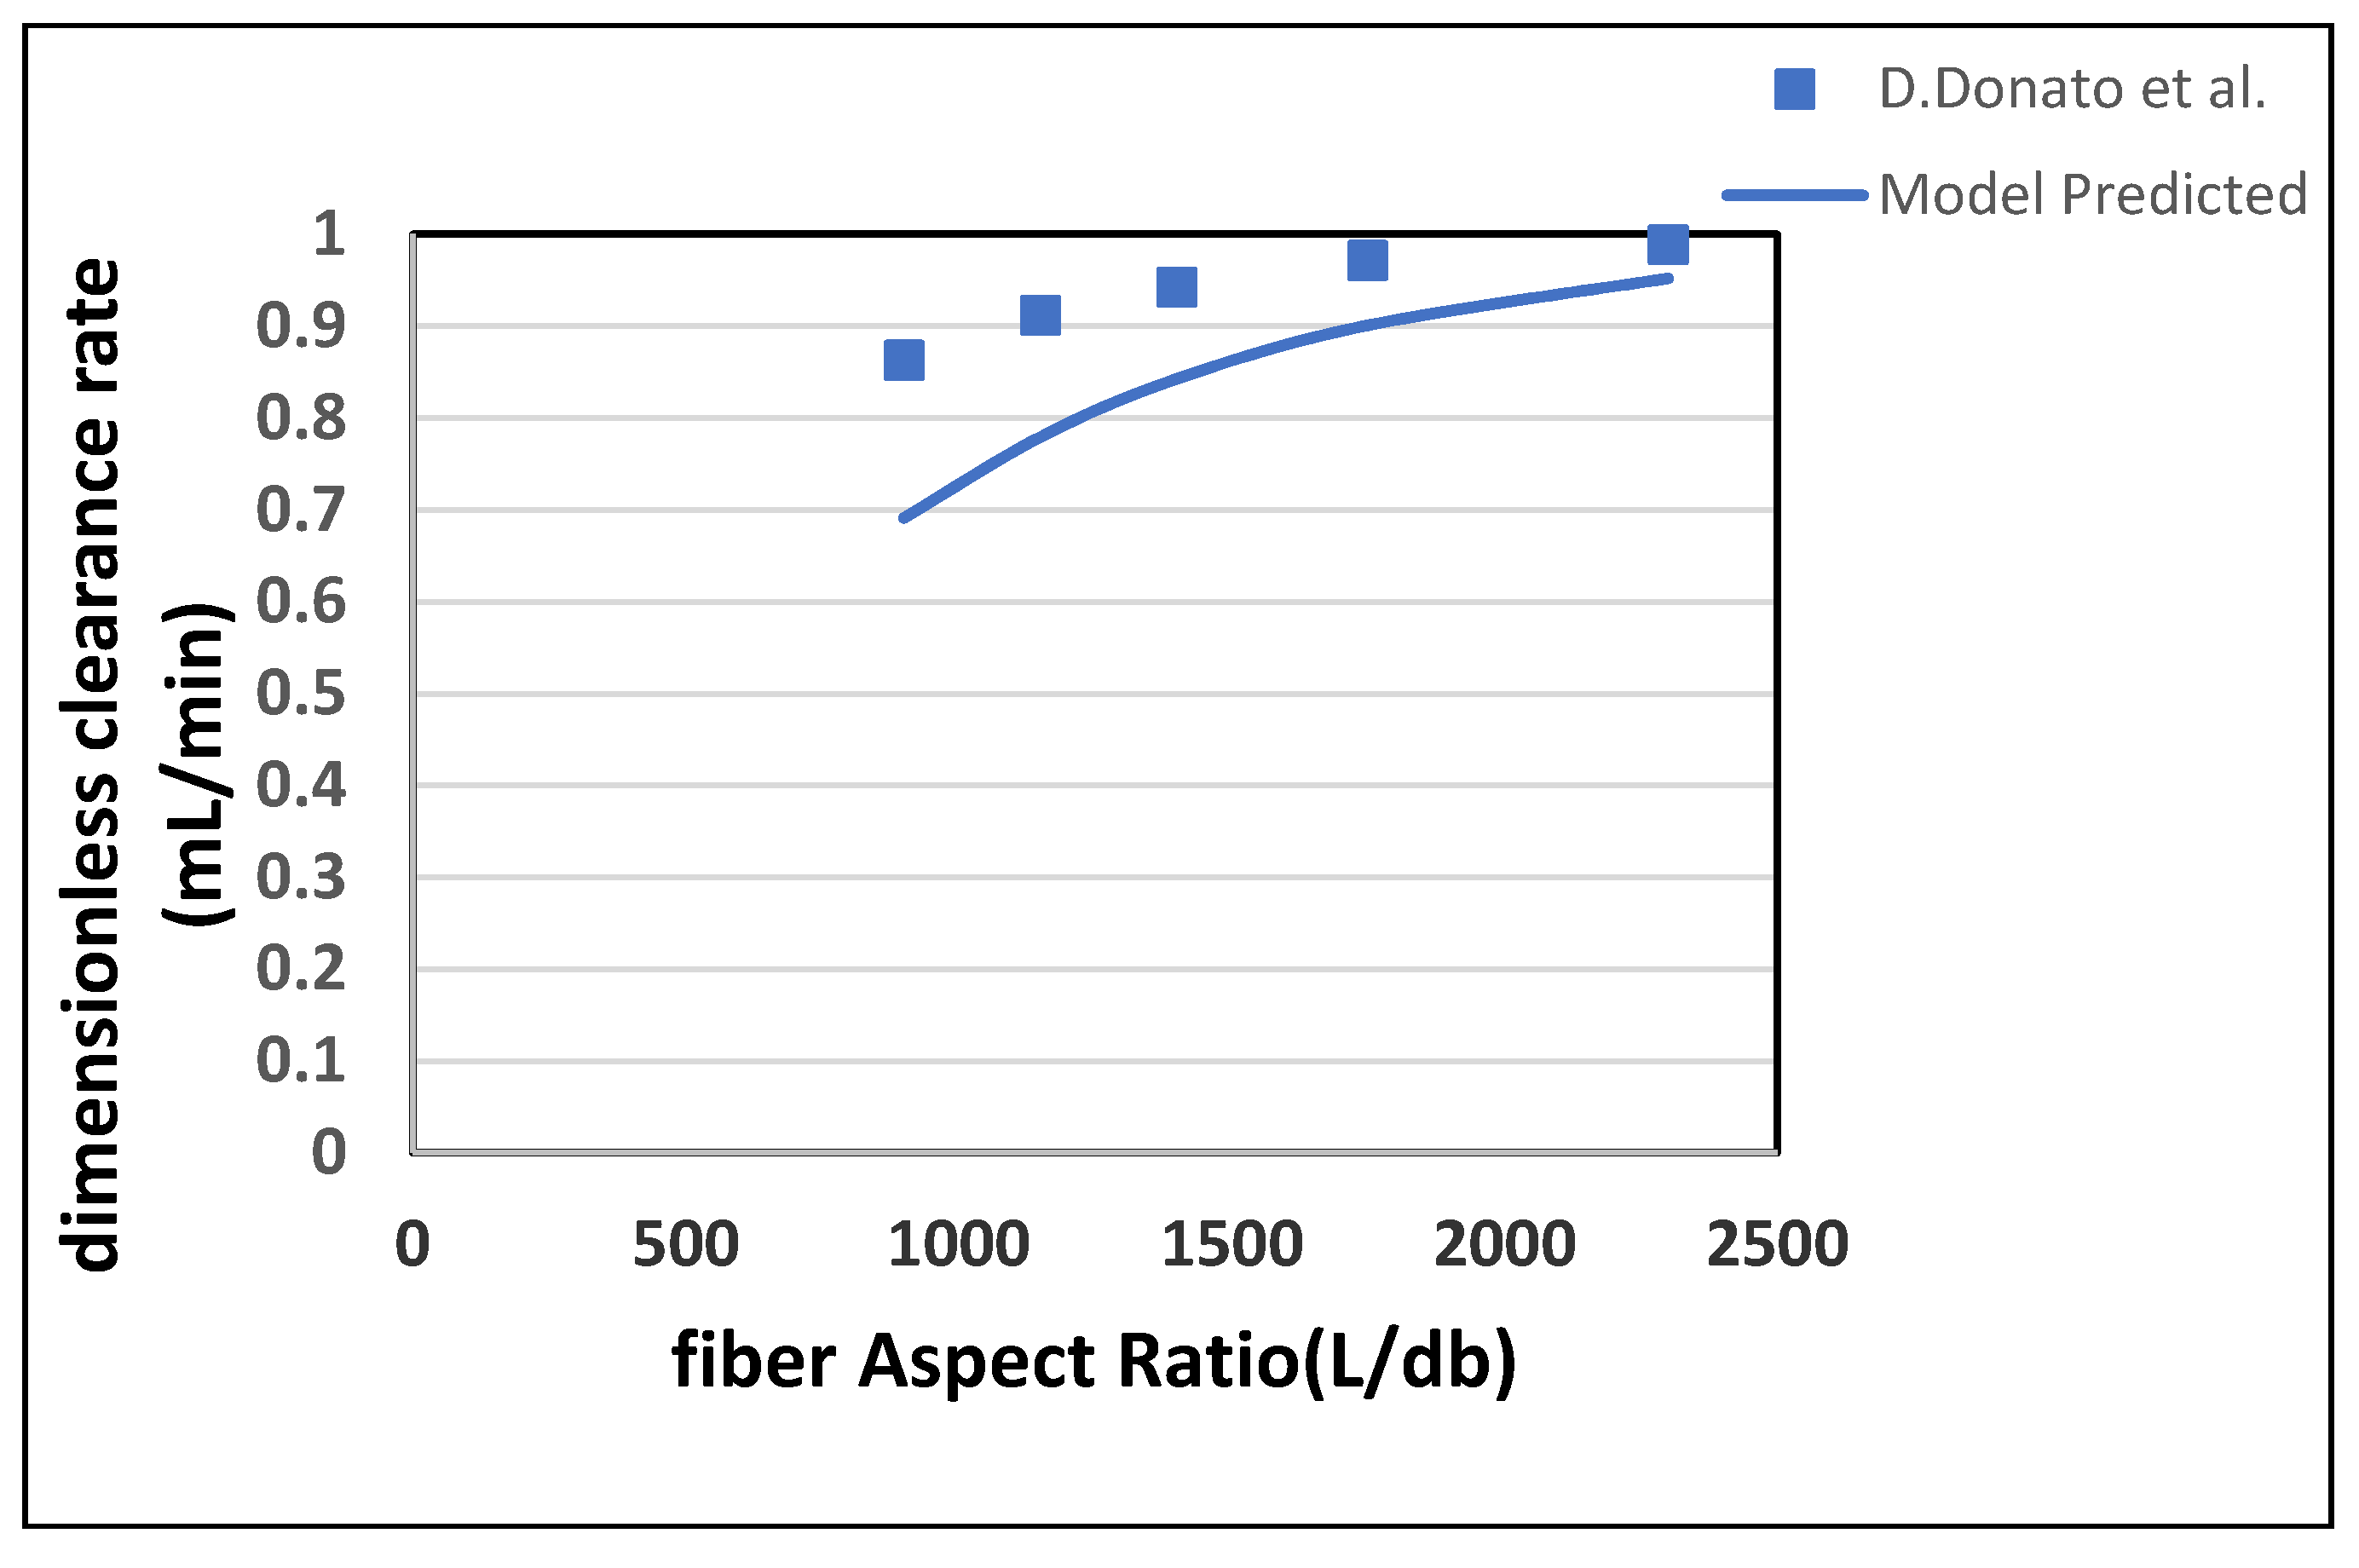
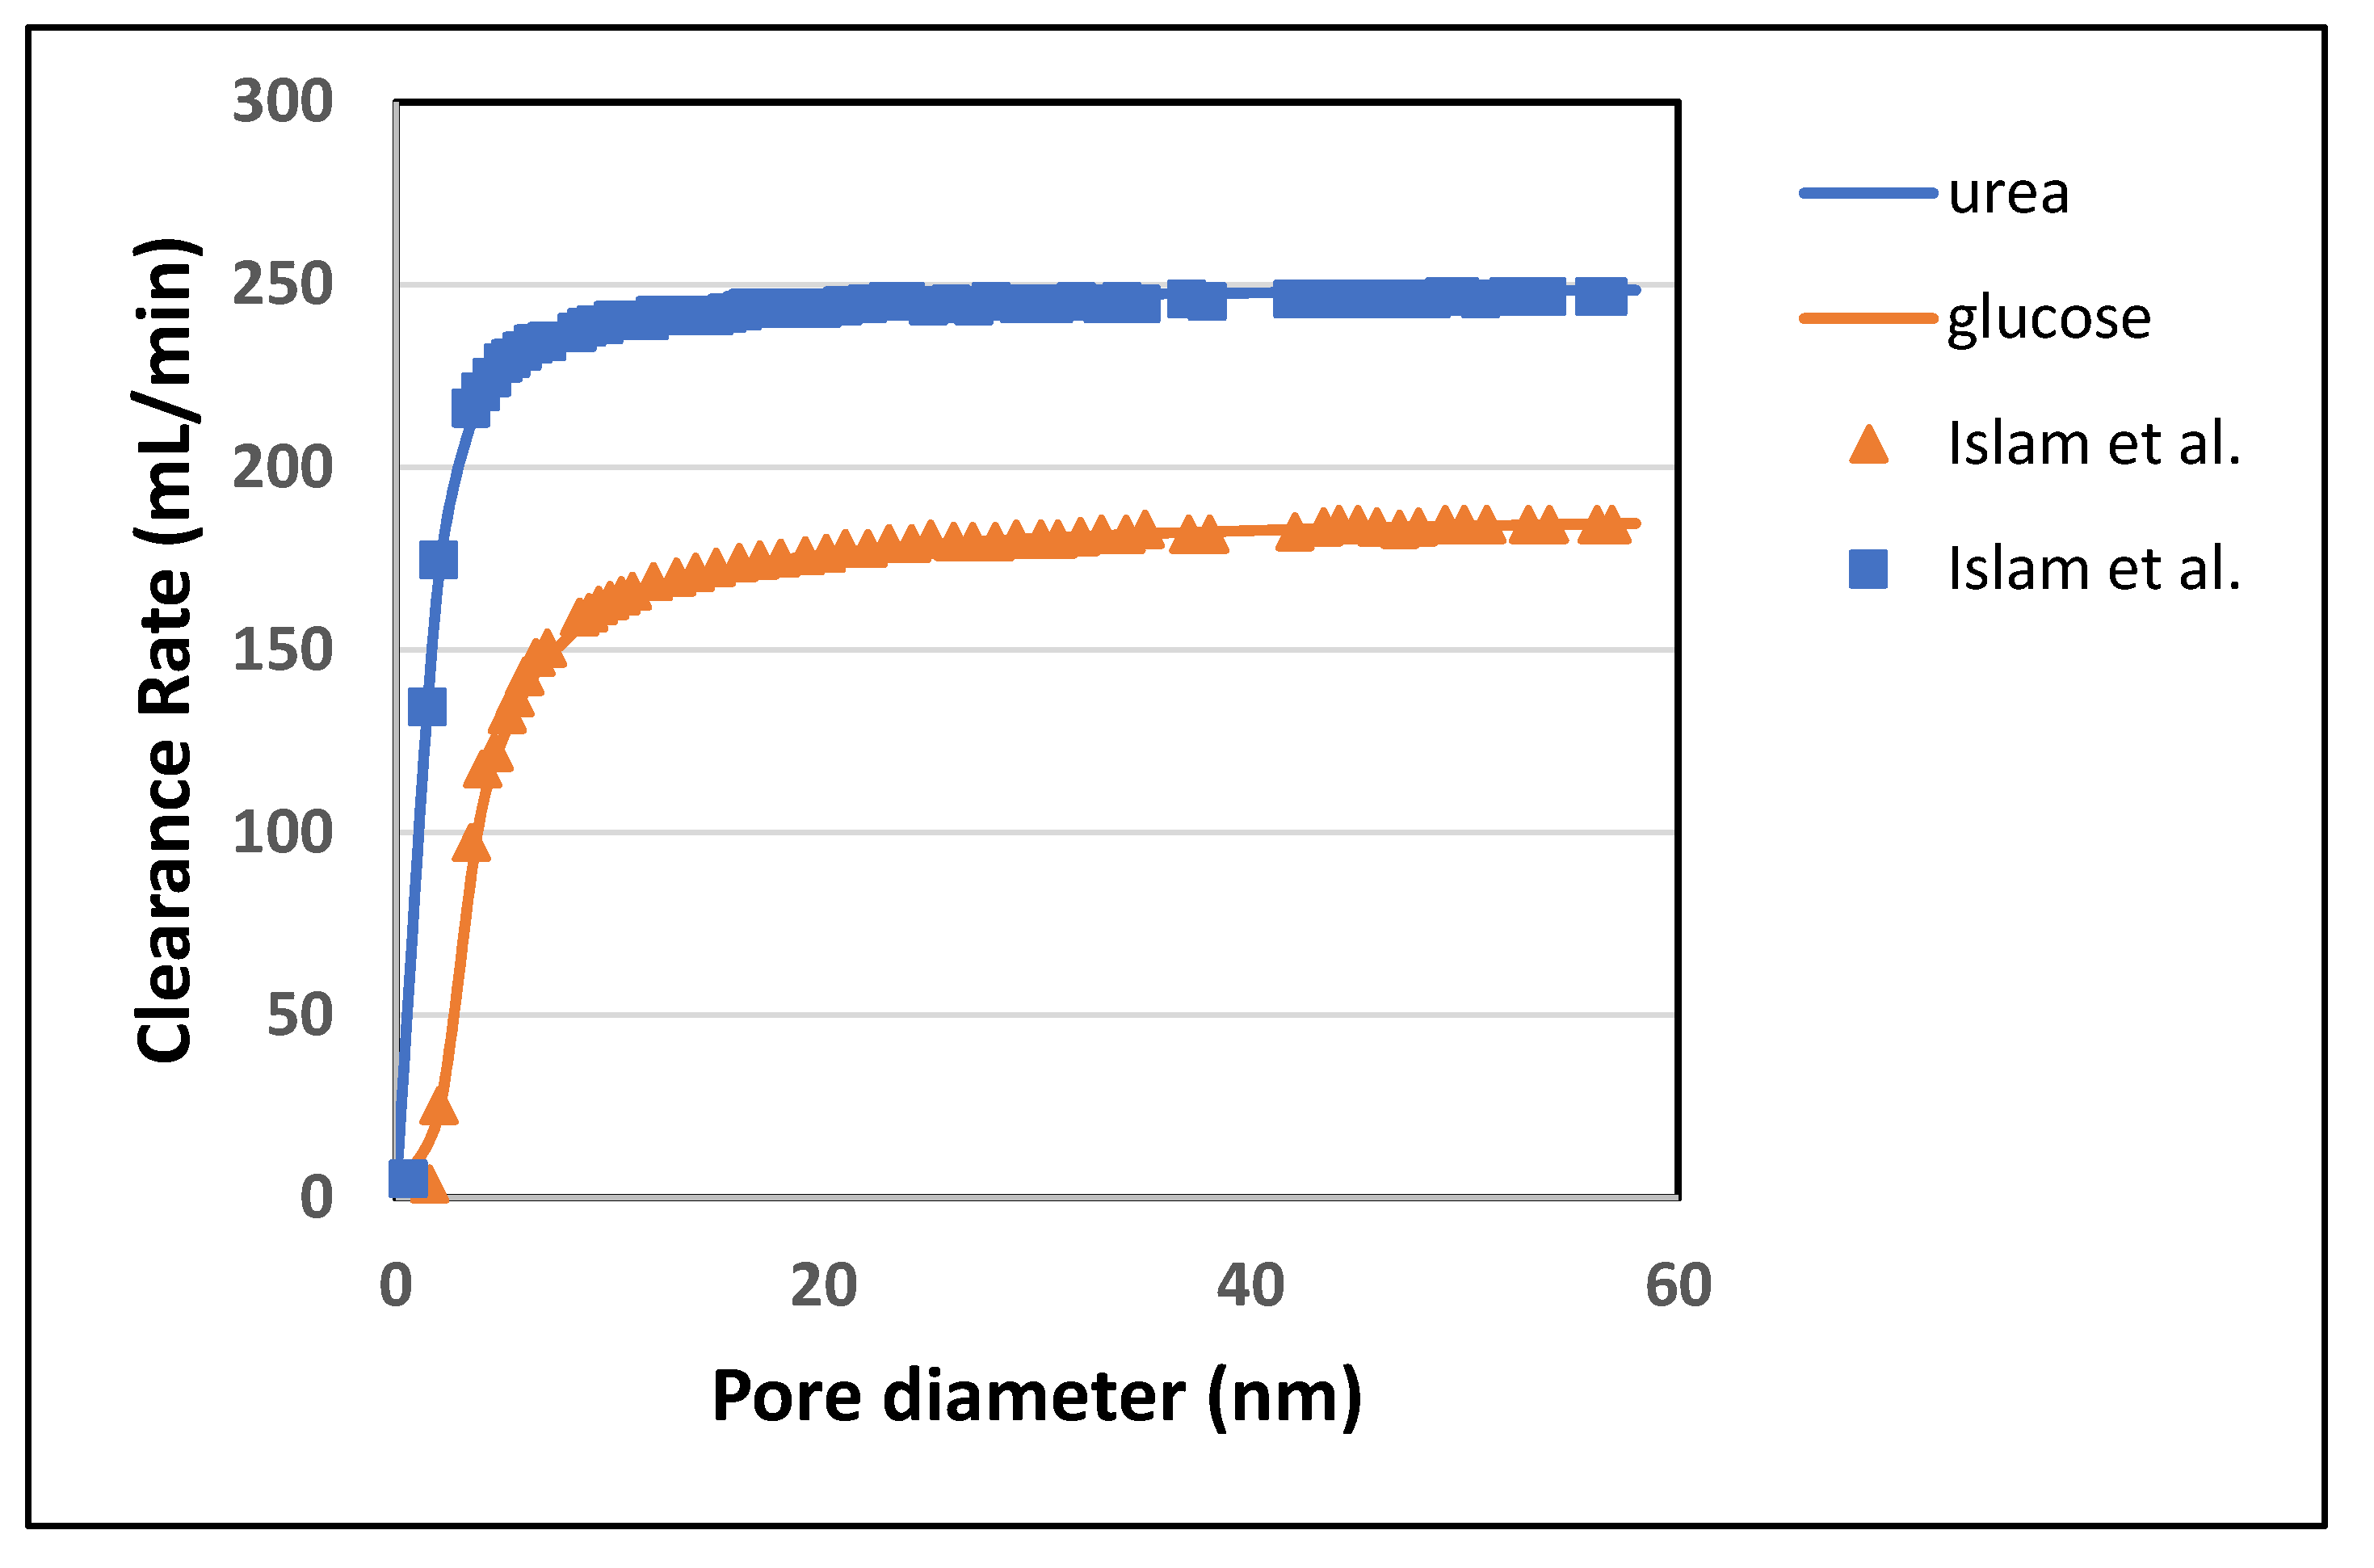
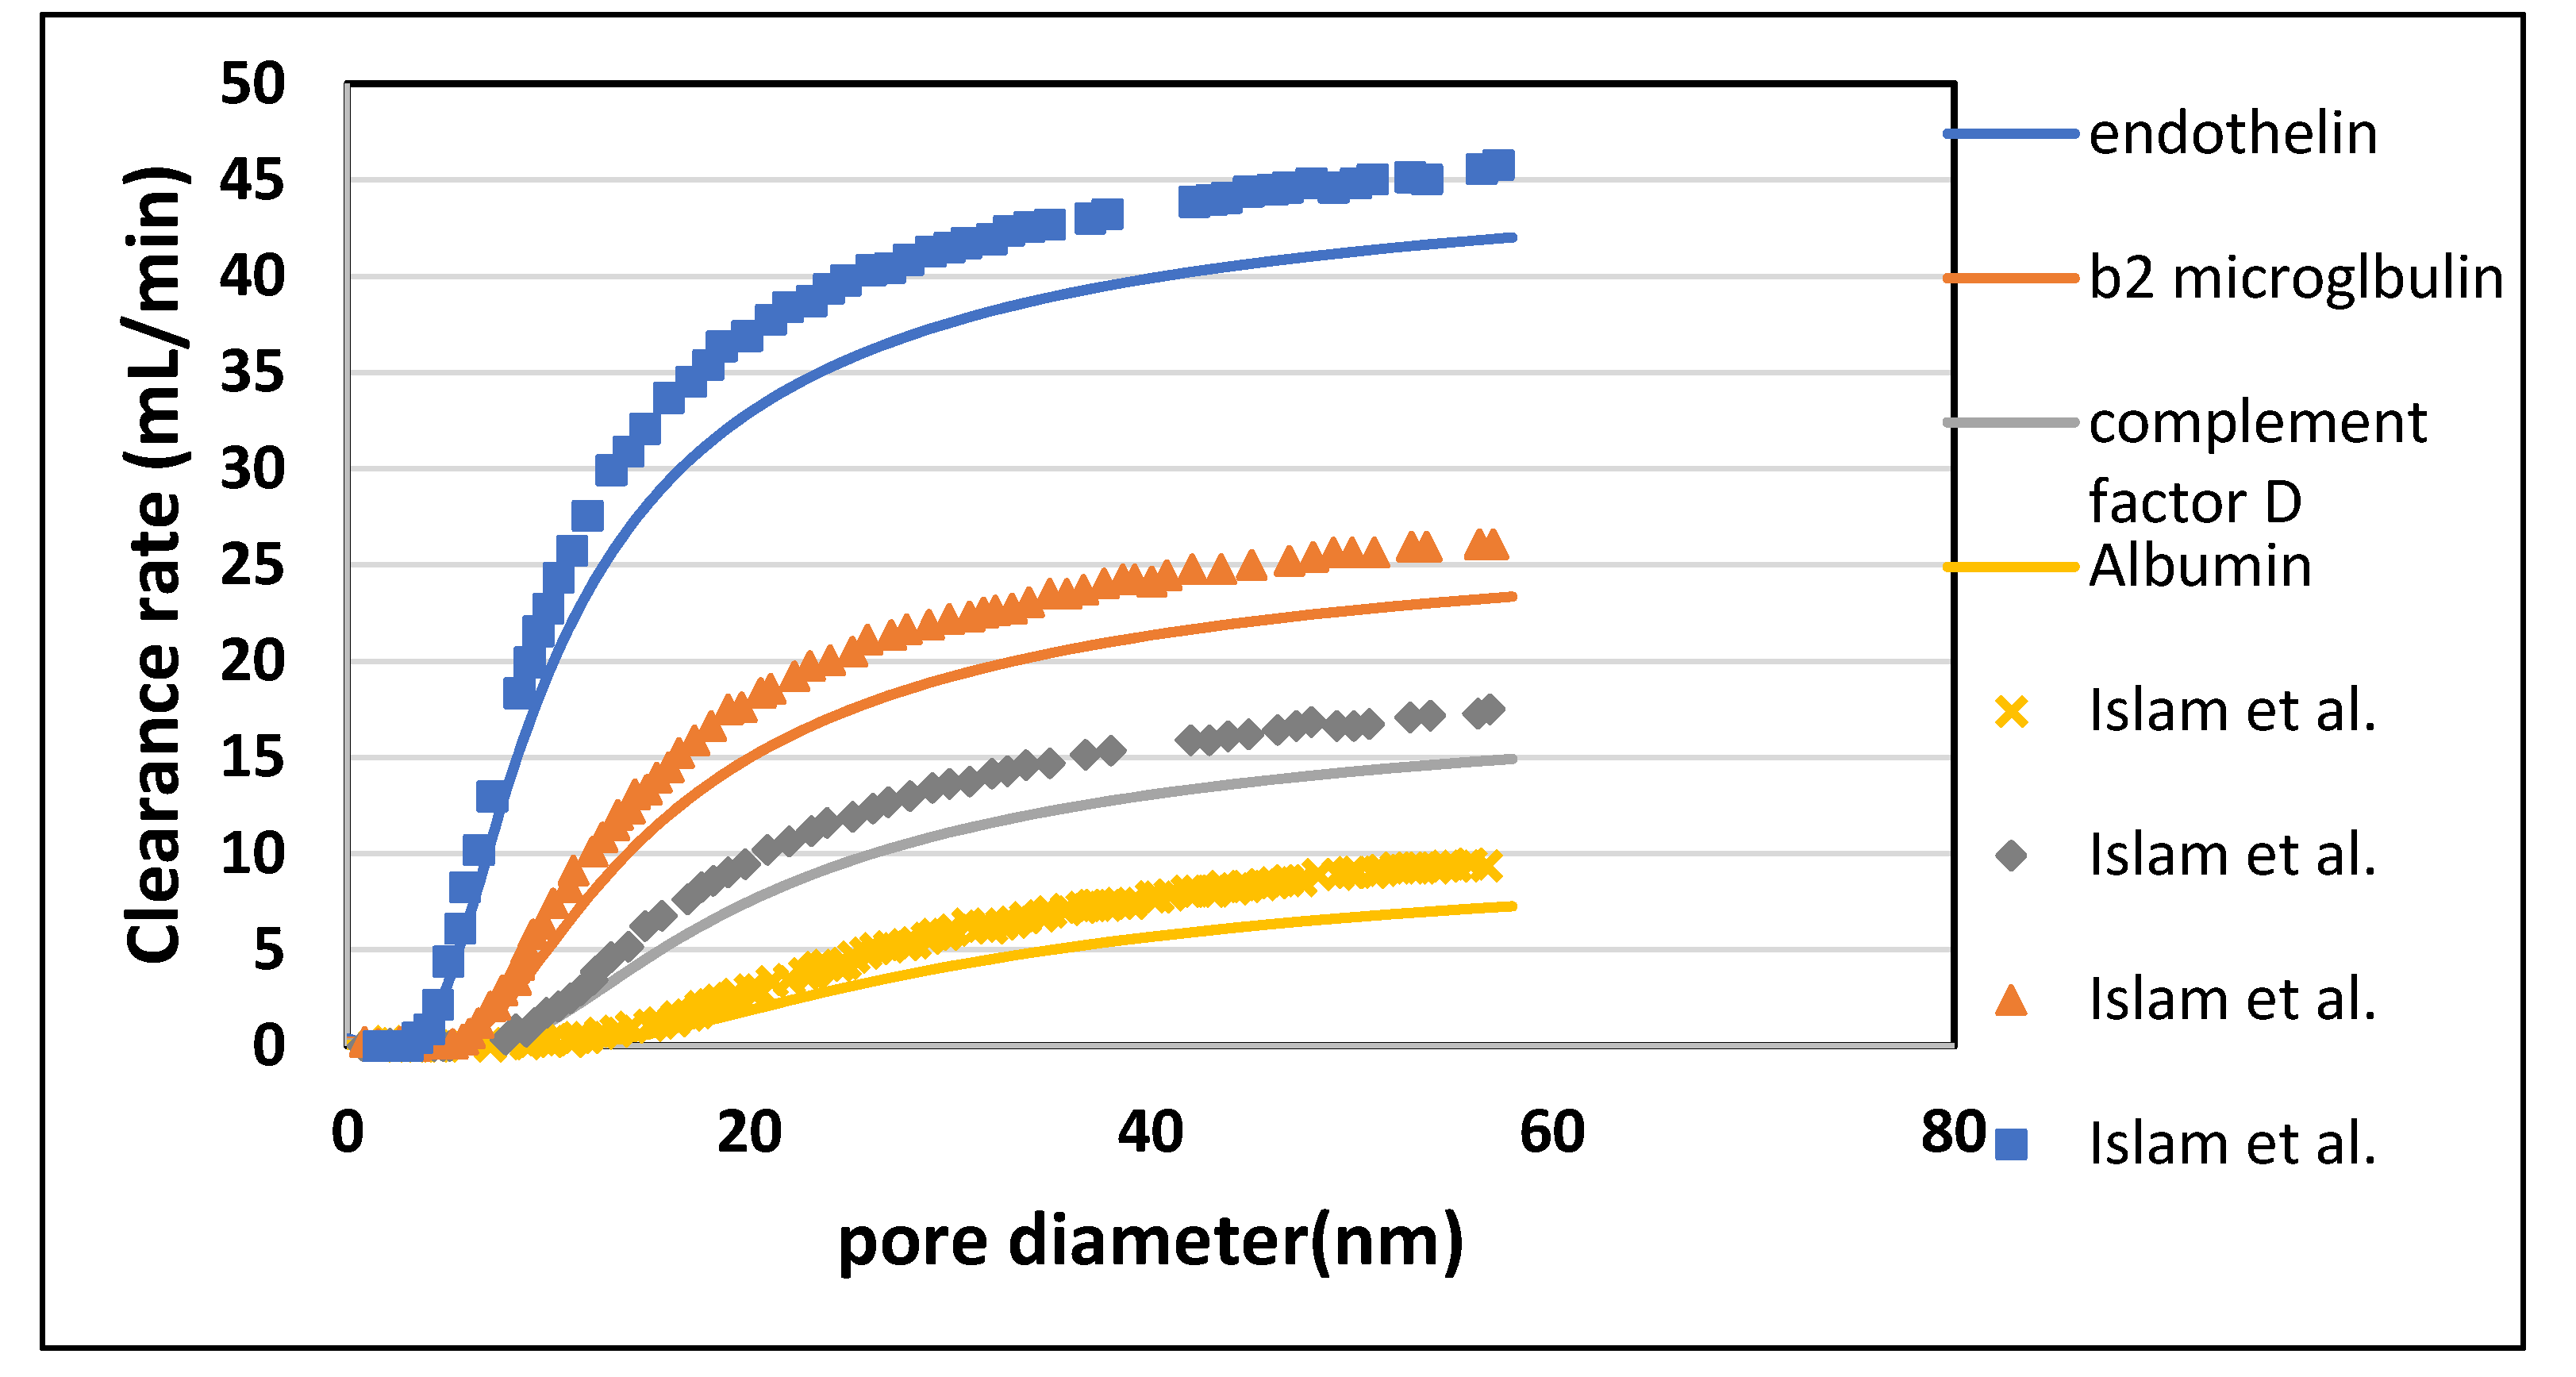
In this study, a two-dimensional axisymmetric mathematical model was developed to simulate the convective and diffusive transport of low molecular weight (LMW) solutes, i.e., urea and glucose and middle molecular weight (MMW) solutes, i.e., endothelin and β2-Microglobulin inside the dialyzer. Mass transfer in blood and dialysate compartment was modeled with convection diffusion equations. The blood and dialysate compartments were coupled with a multi-layer membrane by using TPDM. Computational analysis is performed with the finite element method to figure out those factors that play a vital role in enhancing the dialyzer clearance. Numerical results showed that the clearance efficiency of the dialyzer could be improved by increasing the blood and dialysate flow rate, and the fiber aspect ratio; but the clearance of large size molecules (i.e., endothelin, β2-Microglobulin, β2-microglobulin, complement factor D, albumin) does not increase much due to tortuosity τ of the porous medium. The enhanced clearance efficiency will ultimately reduce the dialysis cost and duration.

2. Mathematical Modeling

2.1. Development of a Model

A framework of the hollow fiber module is presented in Figure 1. A collection of about 12,000 hollow fibers is enclosed in an external shell. Blood passes through the cavity of hollow fibers and dialysate, an aqueous solution of electrolytes, circulates counter-currently at the exterior of the fibers. The transfer of molecules between the blood and dialysate compartment and across the semi-permeable membrane is governed by diffusion and convection. In the presented model, the fibers are assumed to be uniformly spaced, organized in a hexagonal order, and interstice among the adjacent annuli are neglected. It is essential to mention that uneven spacing among fibers would lower the overall mass transfer coefficient on the shell side, leading to a decline of dialyzer efficiency due to the non-uniform distribution of dialysate streams therein. However, the increase of the dialyzer flow rate in some areas of the shell side partially counterbalances the impact of non-uniform distribution in other areas. The solutes considered to study the transport phenomena inside the dialyzer are shown in Table 1.
In this model, a two-dimensional transport of mass and momentum across a three-layer isotropic semi-permeable membrane with a skin, middle and bulk layer is considered. The velocity profiles on both the blood and dialysate side are portrayed with the Navier-Stokes equations [18]. Steady-state, isothermal conditions (T = 37 °C) and laminar flow prevail on both blood and dialysate side with high dilution of solutes [20,21]. It is assumed that the viscosity of both blood and dialysate does not change with applied share. Therefore, these fluids are considered incompressible and Newtonian fluids.
The governing equations and boundary conditions which describe momentum and mass transport in blood and dialysate compartments and across the membrane are as follows:

2.2. Governing Equations—Blood Side (i = B)

A cylindrical coordinate system with two dimensions (r and z) is considered, where dialyzer length (i.e., 0 z L ) is taken along the z-direction and radius ( i . e . ,   0 r r 3 ) is taken along r-direction. The steady fully developed flow of blood can be described with the continuity equation (Equation (1)) and the Navier Stokes equation (Equations (2) and (3)). Equations (2) and (3) are written for radial and axial velocity components, respectively.
1 r r ( rv i ) + u i z = 0
(r)
v B v B r + u B v B z = 1 ρ B P B r + μ B ρ B [ 1 r r ( r v B r ) v B r 2 + 2 v B z 2 ]
(z)
v B u B r + u B u B z = 1 ρ B P B z + μ B ρ B [ 1 r r ( r u B r ) + 2 u B z 2 ]
At z = 0 and 0 < r < r 1 , a fully developed inlet velocity profile for N number of fibers obtained by solving Equations (1)–(3) is:
v B ( r ) = 0   and   u B ( r ) = 2 Q B N π r 1 2 [ 1 ( r r 1 ) 2 ]
In Equation (4), Q B ( mL / min ) is the blood flow rate in each of the hollow fiber and π r 1 2 is a cross-sectional area of the fiber. Equations (5) and (6) represent that the axial velocity is maximum at r = 0 and no-slip conditions prevail at the walls of the membrane, respectively.
v B = u B r = 0   a t   r = 0   ;   0 z L
v B = u B = 0
The convection-diffusion equation that governs the mass transfer of solutes s present in the blood is:
u B c s z + v B c s r = D s ( 2 c s r 2 + 1 r c s r + 2 c s z 2 )
Here, c s ( kg / m 3 ) and Ds(m2/s) are the concentration and the bulk diffusivity of solutes s, respectively. The boundary conditions to solve Equation (7) are:
z   at   r = 0   and   r = r 1   c s , i ( r , 0 ) = c s , in  
and
c s , i r = 0   where   i = B

2.3. Transfer of Solutes across the Multilayer Membrane (j = Skin, Middle, Bulk)

During the dialysis process, the thin porous membrane selectively allows the low molecular weight solutes to diffuse into a low concentration region. The flux of solutes is proportional to the concentration gradient. The general equation to calculate the solute flux across the membrane is:
J s = K s ( C s , B C s , D   )
Here, Js ( m 3 / m 2 s ) and K s ( m / s ) presents the solute s flux across the membrane and membrane overall mass transfer coefficient, respectively. C s , B and C s , D are the concentration of solute s in the blood and dialysate compartment. Considering the boundary layers on each side of the membrane the interfacial resistances can be taken in series as:
1 K s = 1 k s , B + 1 k s , mj + 1 k s , D
Here, 1 k s , B and 1 k s , D account for the blood and dialysate side boundary layer resistance, respectively. 1 k s , mj presents the resistance offered by three consecutive layers of membrane. In order to calculate the mass transfer coefficients of blood and dialysate sides, i.e., k s , B   ( m / s ) and k s , D ( m / s ), following a generic correlation was used [21]. For annulus, the hydraulic diameter was used for the calculation of the Reynold number.
N Sh , i = 1.62 ( N Re , i N Sc , i d i z ) 1 / 3   where   i = B , D
and
N Re , i = u i d i ρ i μ i   ;   Sc i = μ i ρ i D i
Here, N Sh , i , N Re , i and N Sc , i are presenting Sherwood number, Reynold number and Schmidt number, respectively.

2.4. Tortuous Pore Diffusion Model (TPDM) for Membrane Transfer Coefficient

The mass transfer coefficient of solute s in jth layer of the membrane k s , mj   ( m / s ) is determined by TPDM. The transfer of solutes s within the membrane is hindered by the tortuosity and porosity of the multi-layer membrane. Actually, the pores do not present a straight path for molecules, and its tortuosity quantifies the curved shape of the path. Tortuous pore diffusion model (TPDM) used to account for all the hindrance causing factors of the porous medium is presented below.
k s , mj = D es , j δ j
D es , j = ( D s , i ɛ mj τ ) F ( p ) H D
where,
F ( p ) = 1 2.1050 p + 2.0865 p 3 1.7068 p 5 + 0..72603 p 6 1 0.75857 p 5
p = R s R p
H D = ( 1 p ) 2
The Equation (13) presents the tortuous pore diffusion model (TPDM) used to calculate the effective diffusivity D es , j (m2/s) of solutes s in the porous medium which is less than the bulk diffusivity D s , i (m2/s). Friction coefficient F ( p ) account for the friction that exists between the pore wall and the solute molecules, and p is the ratio of solute radius R s to the pore radius R p . The steric hindrance factor H D presents the volume fraction available for the solute molecules in the cylindrical pore. Tortuosity τ defined by the ratio of pore length to the membrane thickness and the experimentally determined values of tortuosity were taken from Yamamoto et al. [17]. ɛ mj presents the porosity of jth layer of the membrane and its experimentally determined values were taken from Islam et al. [22].

2.5. Governing Equations—Dialysate Side (i = D)

In hollow fiber dialyzer, the fibers were surrounded by a uniform annulus, as shown in Figure 1. The radius of the annulus r3 is larger than the fiber radius r1. The velocity of dialysate is also determined by solving continuity Equation (8) and Navier Stokes Equations (9) and (10) with specified boundary conditions of u z = 0 at r = 0 and r = r 2 . Here, r2 is the outer radius of the membrane.
1 r r ( rv i ) + u i z = 0
(r)
v D v D r + u D v D z = 1 ρ D P D r + μ D ρ D [ 1 r r ( r v D r ) v D r 2 + 2 v D z 2 ]
(z)
v D u D r + u D u D z = 1 ρ D P D z + μ D ρ D [ 1 r r ( r u D r ) + 2 u D z 2 ]
The fully developed axial velocity profile of dialysate is:
v D = 2 Q D N π ( 3 r 3 4 4 + r 2 4 4 r 2 2 r 3 2 r 3 4 ln ( r 3 r 2 ) ) [ r 2 r 2 2 2 r 3 2   ln ( r r 2 ) ]
Here, v D ( m / s ) and QD (mL/min) are representing the velocity and volumetric flow rate of dialysate, respectively. The governing equation for dialysate side of solutes s transport can be written similar to the Equation (7):
u D c s z + v D c s r = D s ( 2 c s r 2 + 1 r c s r + 2 c s z 2 )
After simulating the mathematical model, the efficiency of the dialyzer (artificial kidney) was determined by calculating the clearance rate of toxins. The dialyzer clearance rate is measured by the following Equation [22]:
Cl s = Q B ( c s , in c s , out ) c s , in

2.6. Computational Method

For numerical integration of the mathematical model, the finite element method was applied with COMSOL Multiphysics 5.4. Free triangular meshing was used to perform the discretization of the computational domain with more than 40,000 triangular elements. The maximum and minimum element size was kept 2.1 × 10⁻⁴ and 9 × 10⁻⁷, respectively, with a maximum growth rate of 1.3 and a curvature factor of 0.3. At the blood and dialysate inlets and outlets, and at the interfaces of the membrane with blood and dialysate compartment, local mesh refinement was applied due to the higher complexity of model equations in these areas. Two study nodes were included in the solver configuration, i.e., fully coupled and direct. Fully coupled node combines multi-physics domains, i.e., blood, dialysate, and different membrane layers, while applying the Newton’s method damped version. Under direct node MUMPS (multifrontal massively parallel sparse) method was chosen to enhance the computational efficiency. This method performs the factorization of linear systems in the form of Ax = b, where matrix A is factorized to determine the solution ‘x’. By using the literature-reported values of model parameters, as listed in Table 2, steady-state 2D profiles of velocity and solute concentration were determined. In order to determine the solutes s concentration at the outlet of the fiber, the surface average was taken at the outer cross-sectional area. The solution procedure followed to solve the CFD model using Finite Element Method solver is shown in Figure 2.

2.7. Validation

The mathematical model developed was simulated in COMSOL Multiphysics with inlet, outlet, and boundary conditions. The concentration contour of urea in the blood and dialysate compartment and across the membrane is shown in Figure 3.
In order to validate the proposed mathematical model, the model-predicted urea clearance rate was compared with Islam et al. (in-silico) [22] and experimental data reported in the literature at increasing blood flow rates [23]. In Figure 4, the clearance rate of urea is compared with Polyflux 210H data provided by the manufacturer [23]. The values of the experimental clearance rate, in Figure 4, are reported in the literature with the combined effect of diffusion and ultrafiltration. In Table 3, the percentage difference between experimental data and the model predicted values is because the ultrafiltration flux across the membrane was not included in the current model. However, the model predicted values for diffusive transport of solute across the membrane are in good agreement with the Islam et al. (in silico) results.

3. Results and Discussion

The aim of developing this mathematical model was to investigate the impact of module geometry and operating conditions on clearance efficiency and to provide a model that can be simulated at different values of parameters to optimize the clearance rate.

3.1. Effect of Operating Conditions on Clearance Efficiency

For model parameters, manufacturer data of Polyflux 210H (Gambro Dialysatoren GmbH, Germany, a subsidiary of Baxter International Inc.) was used and predicted clearance rate of different solutes were compared with Islam et al. [22], Theranova 400 MCO AA (Gambro Dialysatoren GmbH, Germany, a subsidiary of Baxter International Inc.), Polyflux 210H [23] and FX CorDiax 80 (Fresenius Medical Care, Bad Homburg, Germany) [24]. The blood flow rate was varied from 300 to 500 mL/min keeping dialysate flow rate constant (QD = 500 mL/min). In-silico and in-vivo clearance rates plotted against increasing blood flow rate, were found in good agreement. It is evident from Figure 5 and Figure 6 that the increase in blood flow rate increases the clearance of low molecular weight (LMW) solutes (urea, glucose) but does not affect the clearance of solutes with high molecular weight. The clearance rate of albumin is nearly constant. The increase in clearance with the blood flow rate can be attributed to the rise of concentration difference across the membrane. The concentration gradient across the membrane drives the transport of solutes. By increasing the blood flow rate, the concentration gradient was increased that ultimately enhance the clearance rate of solutes. On the other hand, the clearance of large size molecules shown in Figure 6 was not affected much due to the higher value of steric hindrance H and friction coefficient F(p). Due to the high value of steric hindrance H, the lesser volume is available for the large size molecules to pass through the cylindrical pore. The effect of steric hindrance H and friction coefficient F(p) was pronounced in Figure 6 while moving from β2 microglobulin to albumin due to an increase in the size of molecules.
Table 4 shown the maximum percentage difference of this model with literature data at varying blood flow rate. Figure 7 and Figure 8 show the variation in clearance rate with dialysate flow rate. A good agreement was found between the model-predicted and Islam et al. in-silico results [22]. The trend of increase in clearance with dialysate flow is also validated by comparing with the Revaclear Max dialyzer experimental (reported in Bhimani et al. [25]) and Donato et al. in-silico results [21]. The difference between Revaclear Max and model-predicted data is due to the lack of a comprehensive dataset of module parameter values needed for model predictions. The concentration gradient also increases by increasing the dialysate flow rate QD that ultimately enhances the clearance rate of urea and glucose, as observed in Figure 7. The behavior of large size molecules in Figure 8 is similar to their behavior in Figure 6. The reason for the low diffusivity of large size molecules across the membrane despite high concentration gradient lies in the high values of steric hindrance H and friction coefficient F(p).
For each solute, the clearance ultimately achieves a maximum, independent of the flow rate, as solutes concentration in the boundary layer CS* approaches Cg, gel concentration or solubility limit. This maximum clearance value is achieved faster for high molecular weight solutes. Table 5 shown the maximum percentage difference of this model with literature data at varying dialysate flow rate.

3.2. Effect of Module Geometry on Solute Clearances

The effect of different module dimensions on the clearance rate of solute was investigated. It was observed that fiber length, radius, and pore size have a significant impact on the clearance rate. Therefore, these parameters are discussed in detail.

3.2.1. Effect of Fiber Length

The fiber length was varied from 270 mm to 540 mm while keeping blood flow rate QB = 300 mL/min and dialysate flow rate QD = 540 mL/min. From Figure 9, it is evident that the clearance rate of urea and glucose rises rapidly by increasing the length of the fiber. Similarly, in Figure 10, the clearance rate of endothelin and β2-microglobulin is doubled by varying the length from 270 mm to 540 mm. This increase has to be wholly attributed to a rise in the total surface area of the hollow fibers. However, the albumin clearance is not affected much due to the large size of its molecules. Table 6 shown the maximum percentage difference of this model with literature data at varying dialyzer fiber length.

3.2.2. Effect of Fiber Radius on Clearance Rate

Radius determines the size of the fiber cavity throughout the fiber length in an axial direction. It was varied from 0.1 mm to 0.2 mm while keeping the blood flow rate QB = 300 mL/min and dialysate flow rate QD = 500 mL/min. From Figure 11, it was observed that the clearance rate of solutes also increased by increasing the radius of fibers. This can also be attributed to an overall increase in the surface area of the membrane. Figure 12 shows that clearance of middle to large size molecules (from endothelin to albumin) also rises with an increase in the radius of the fiber. Still, the effect becomes negligible as the size of the molecule increases. Table 7 shown the maximum percentage difference of this model with literature data at a varying radius of dialyzer fiber.

3.2.3. Effect of Fiber Aspect Ratio

The ratio between fiber length and pore diameter depicts the interplay between fiber dimensions and clearance rates. This ratio is called the fiber aspect ratio, and it is an important parameter to determine the optimum length to diameter ratio of the fiber. Figure 13 shows that as the fiber aspect ratio increases, the clearance rate also increases. Here, the fiber length is increased while keeping the radius constant. The increase in the clearance rate happens due to the rise in surface area. The difference between the values predicted by this model and Donato et al. is due to the impact of ultrafiltration, which is not included in this model. Table 8 shown the maximum percentage difference of this model with literature data at a varying aspect ratio of dialyzer fiber.

3.2.4. Effect of Skin Layer Pore Size on Dimensionless Clearance

In Figure 14, the clearance rate increases more rapidly from 10 nm to 20 nm. After 20 nm, as the pore size of the skin layer becomes equal to the middle layer, the clearance rate becomes independent of pore diameter. Since the pore size increases from the inner (skin) layer to the outer (bulk) layer, therefore inner layer, which is directly in contact with blood, plays a vital role in improving the permeability of different solutes. The skin layer has the smallest average pore size among the three layers. A small change in the skin layer pore size produces an enormous impact on the clearance of toxins. Although increasing the pore size of the inner(skin) layer enhances the clearance of small size molecules (urea and glucose), but it also adds a considerable increment to the diffusion of Albumin. This happens due to the decrease in steric hindrance SD and friction coefficient F(p) of the inner layer.
Figure 15 shows that when pore diameter increased beyond 20 nm, the albumin molecules escaped more rapidly. However, albumin rejection is still very high in the limit of 1 to 20 nm with improved clearances of middle size molecules. This shows that increasing pore size up to 20 nm (but not beyond that) provides better clearance of the toxins, with bearable loss of albumin. Table 9 shown the maximum percentage difference of this model with literature data at a varying pore diameter of dialyzer fiber

4. Conclusions

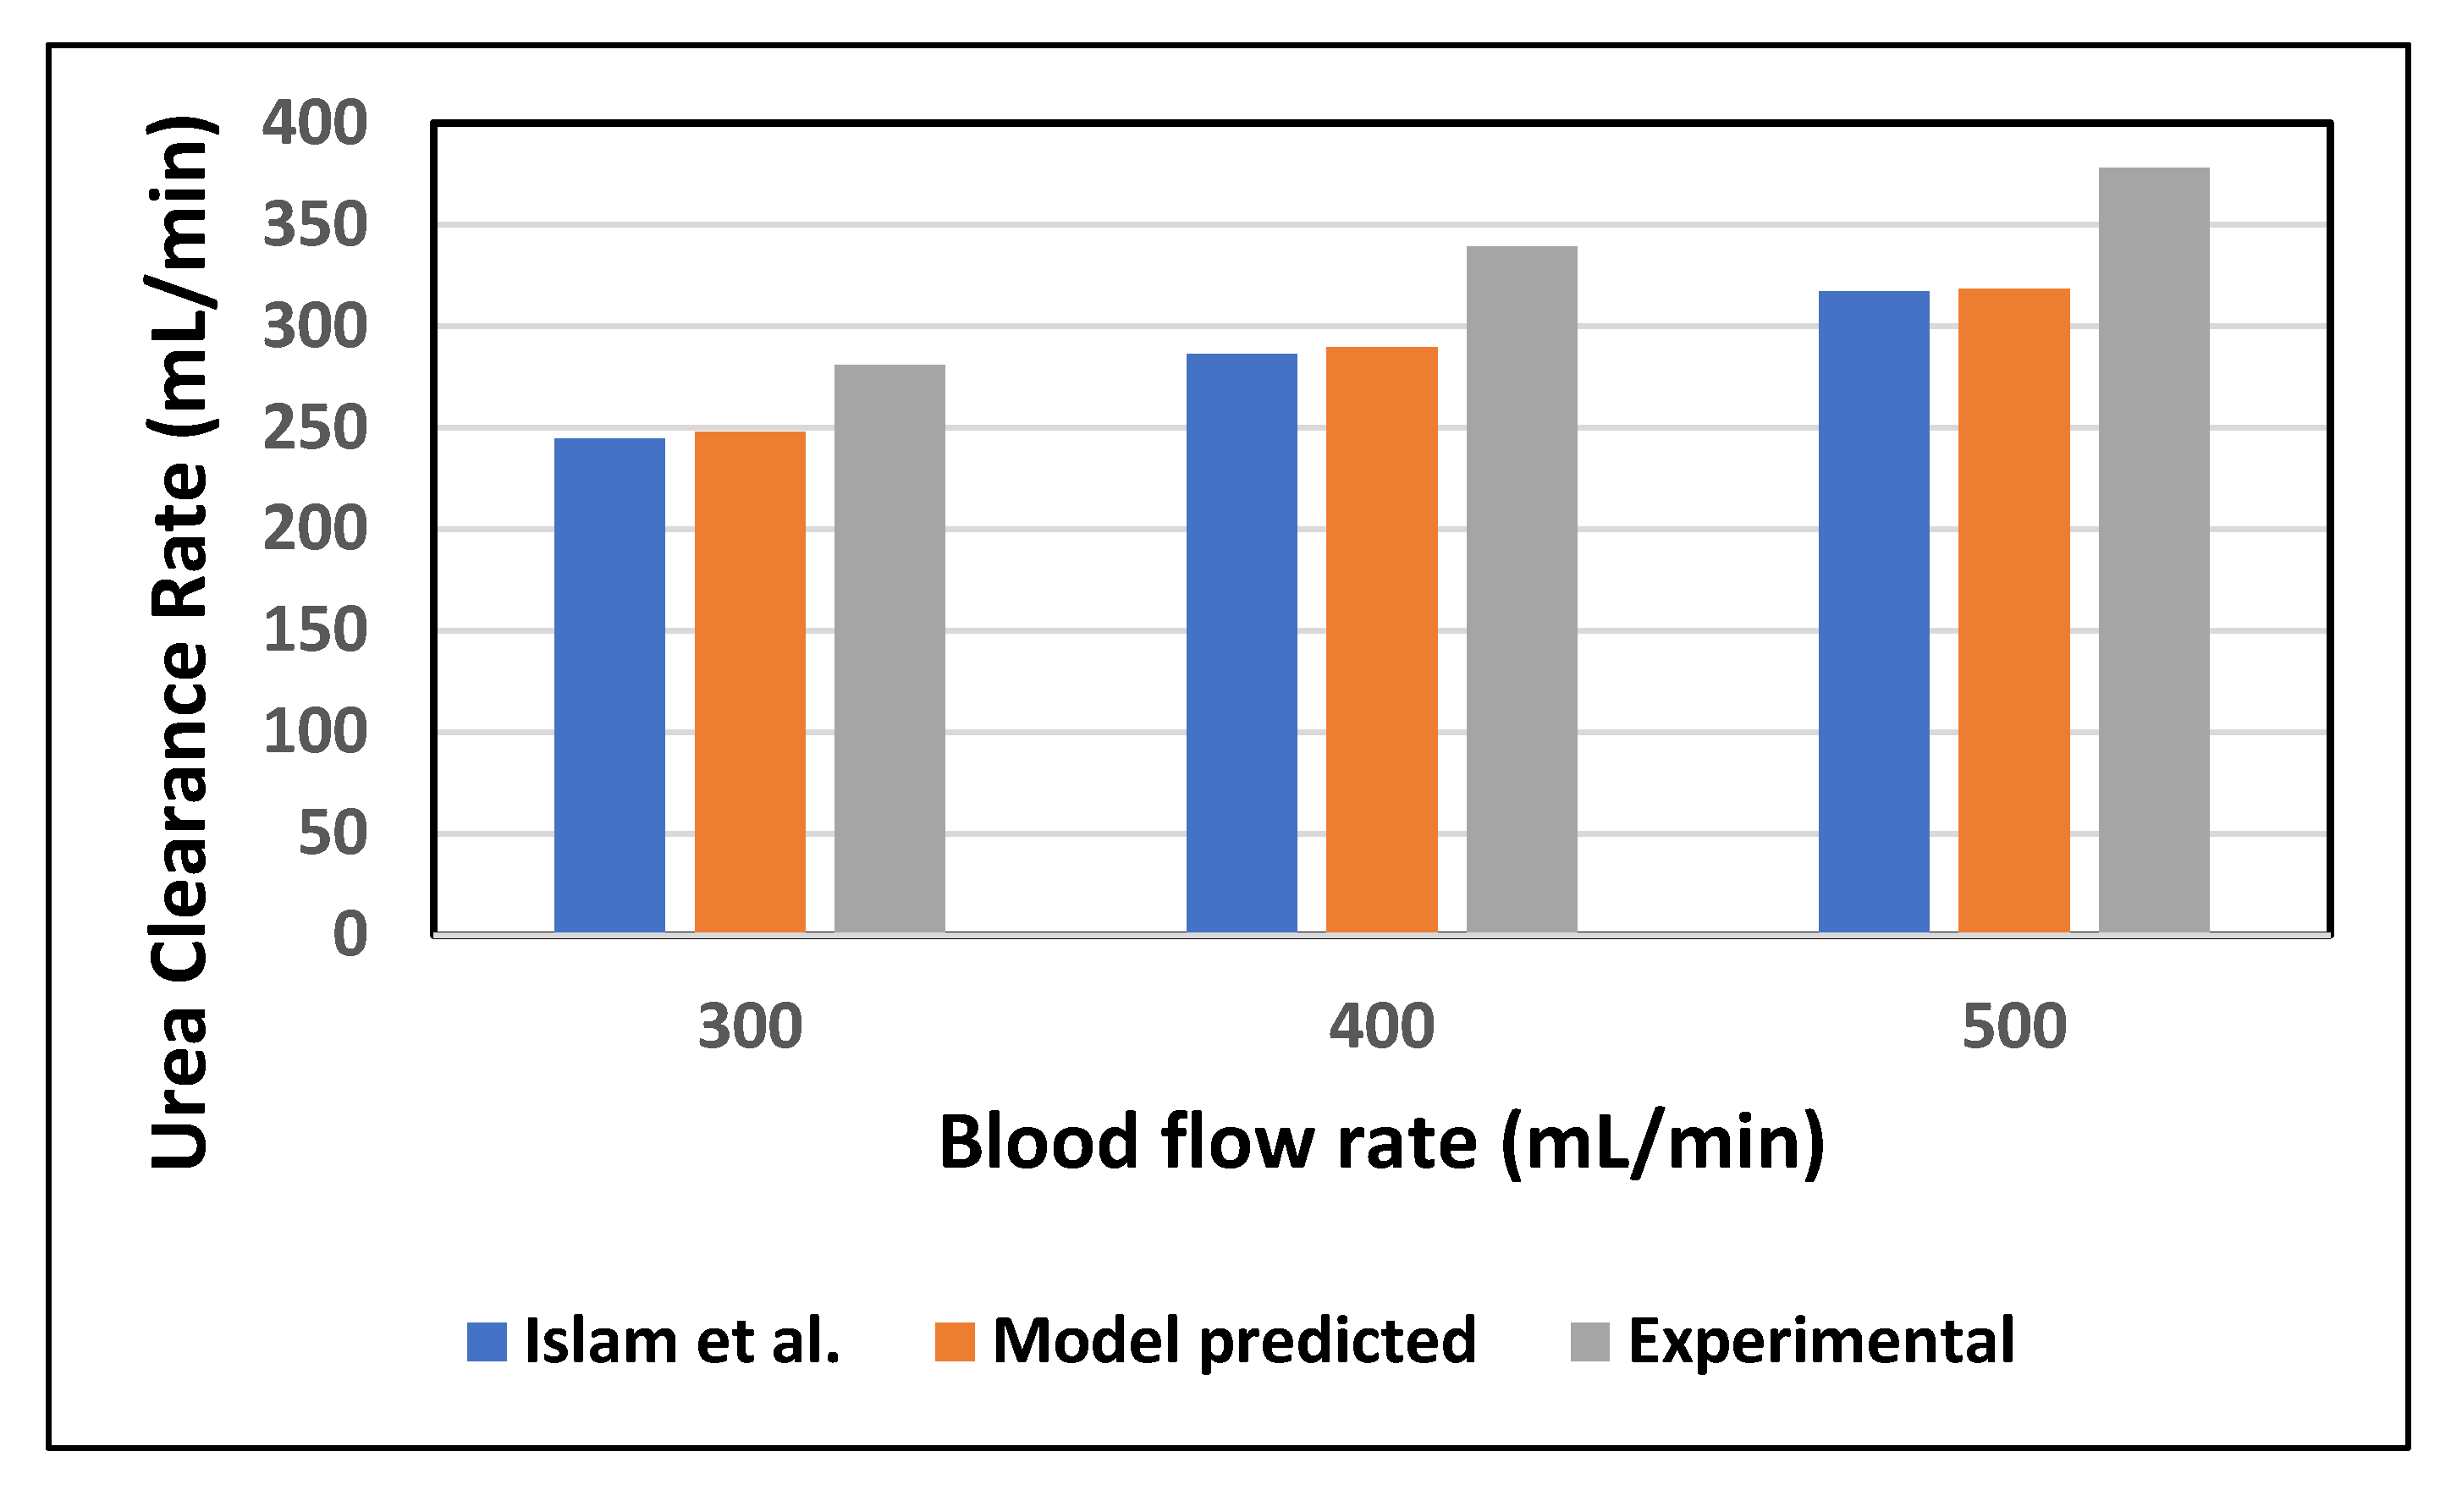
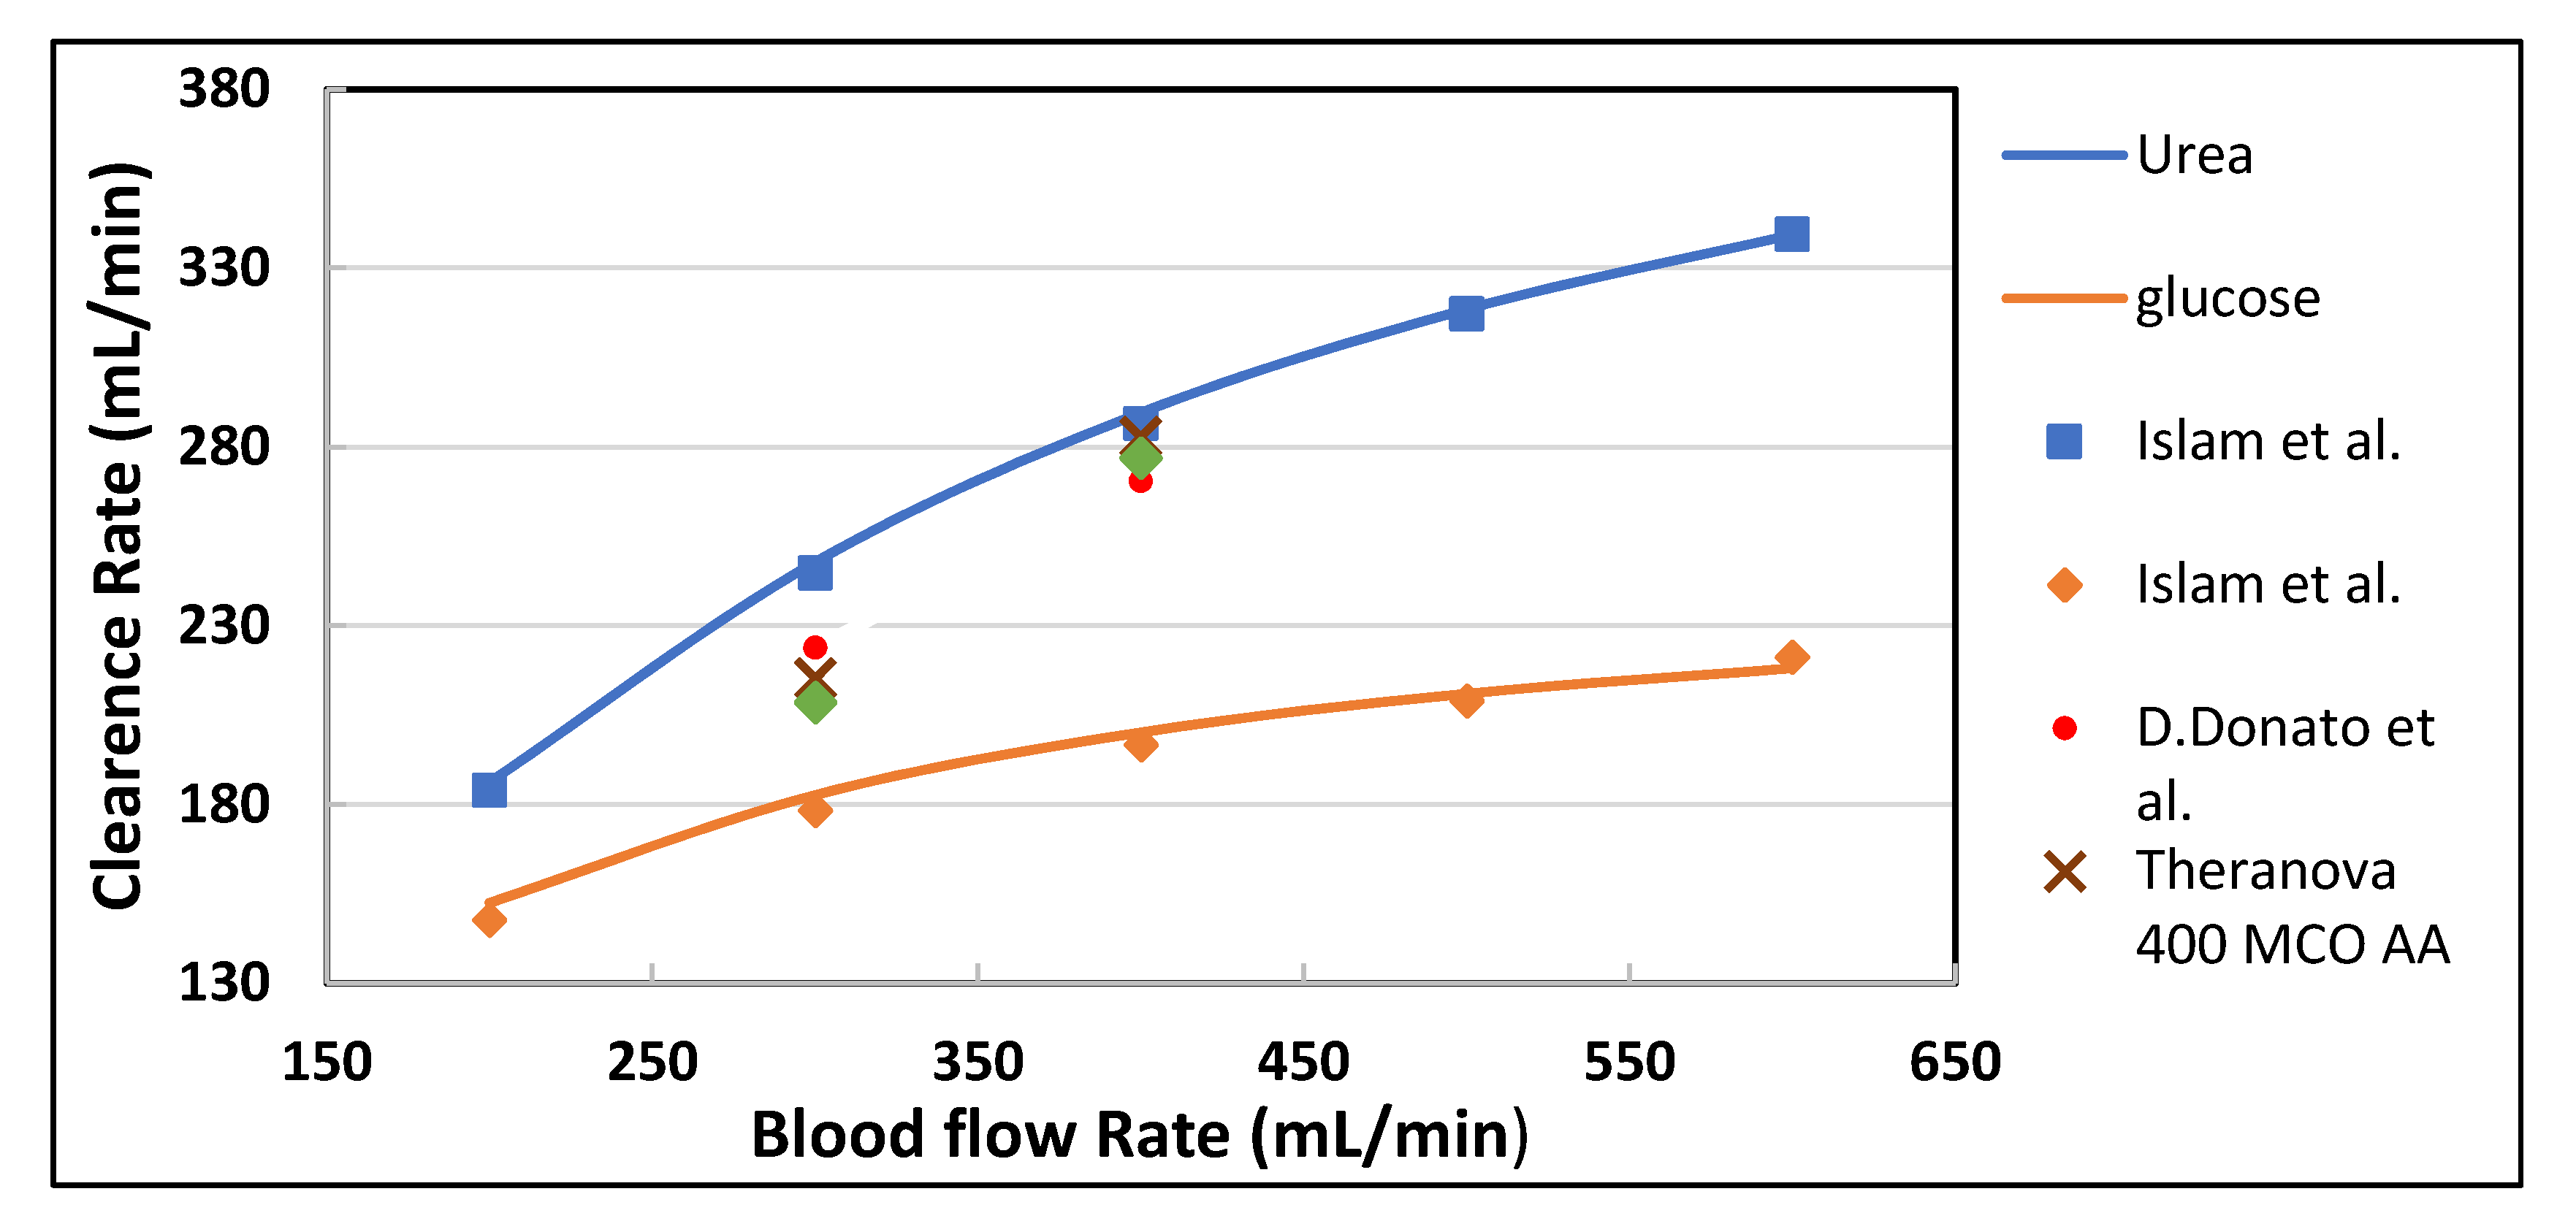
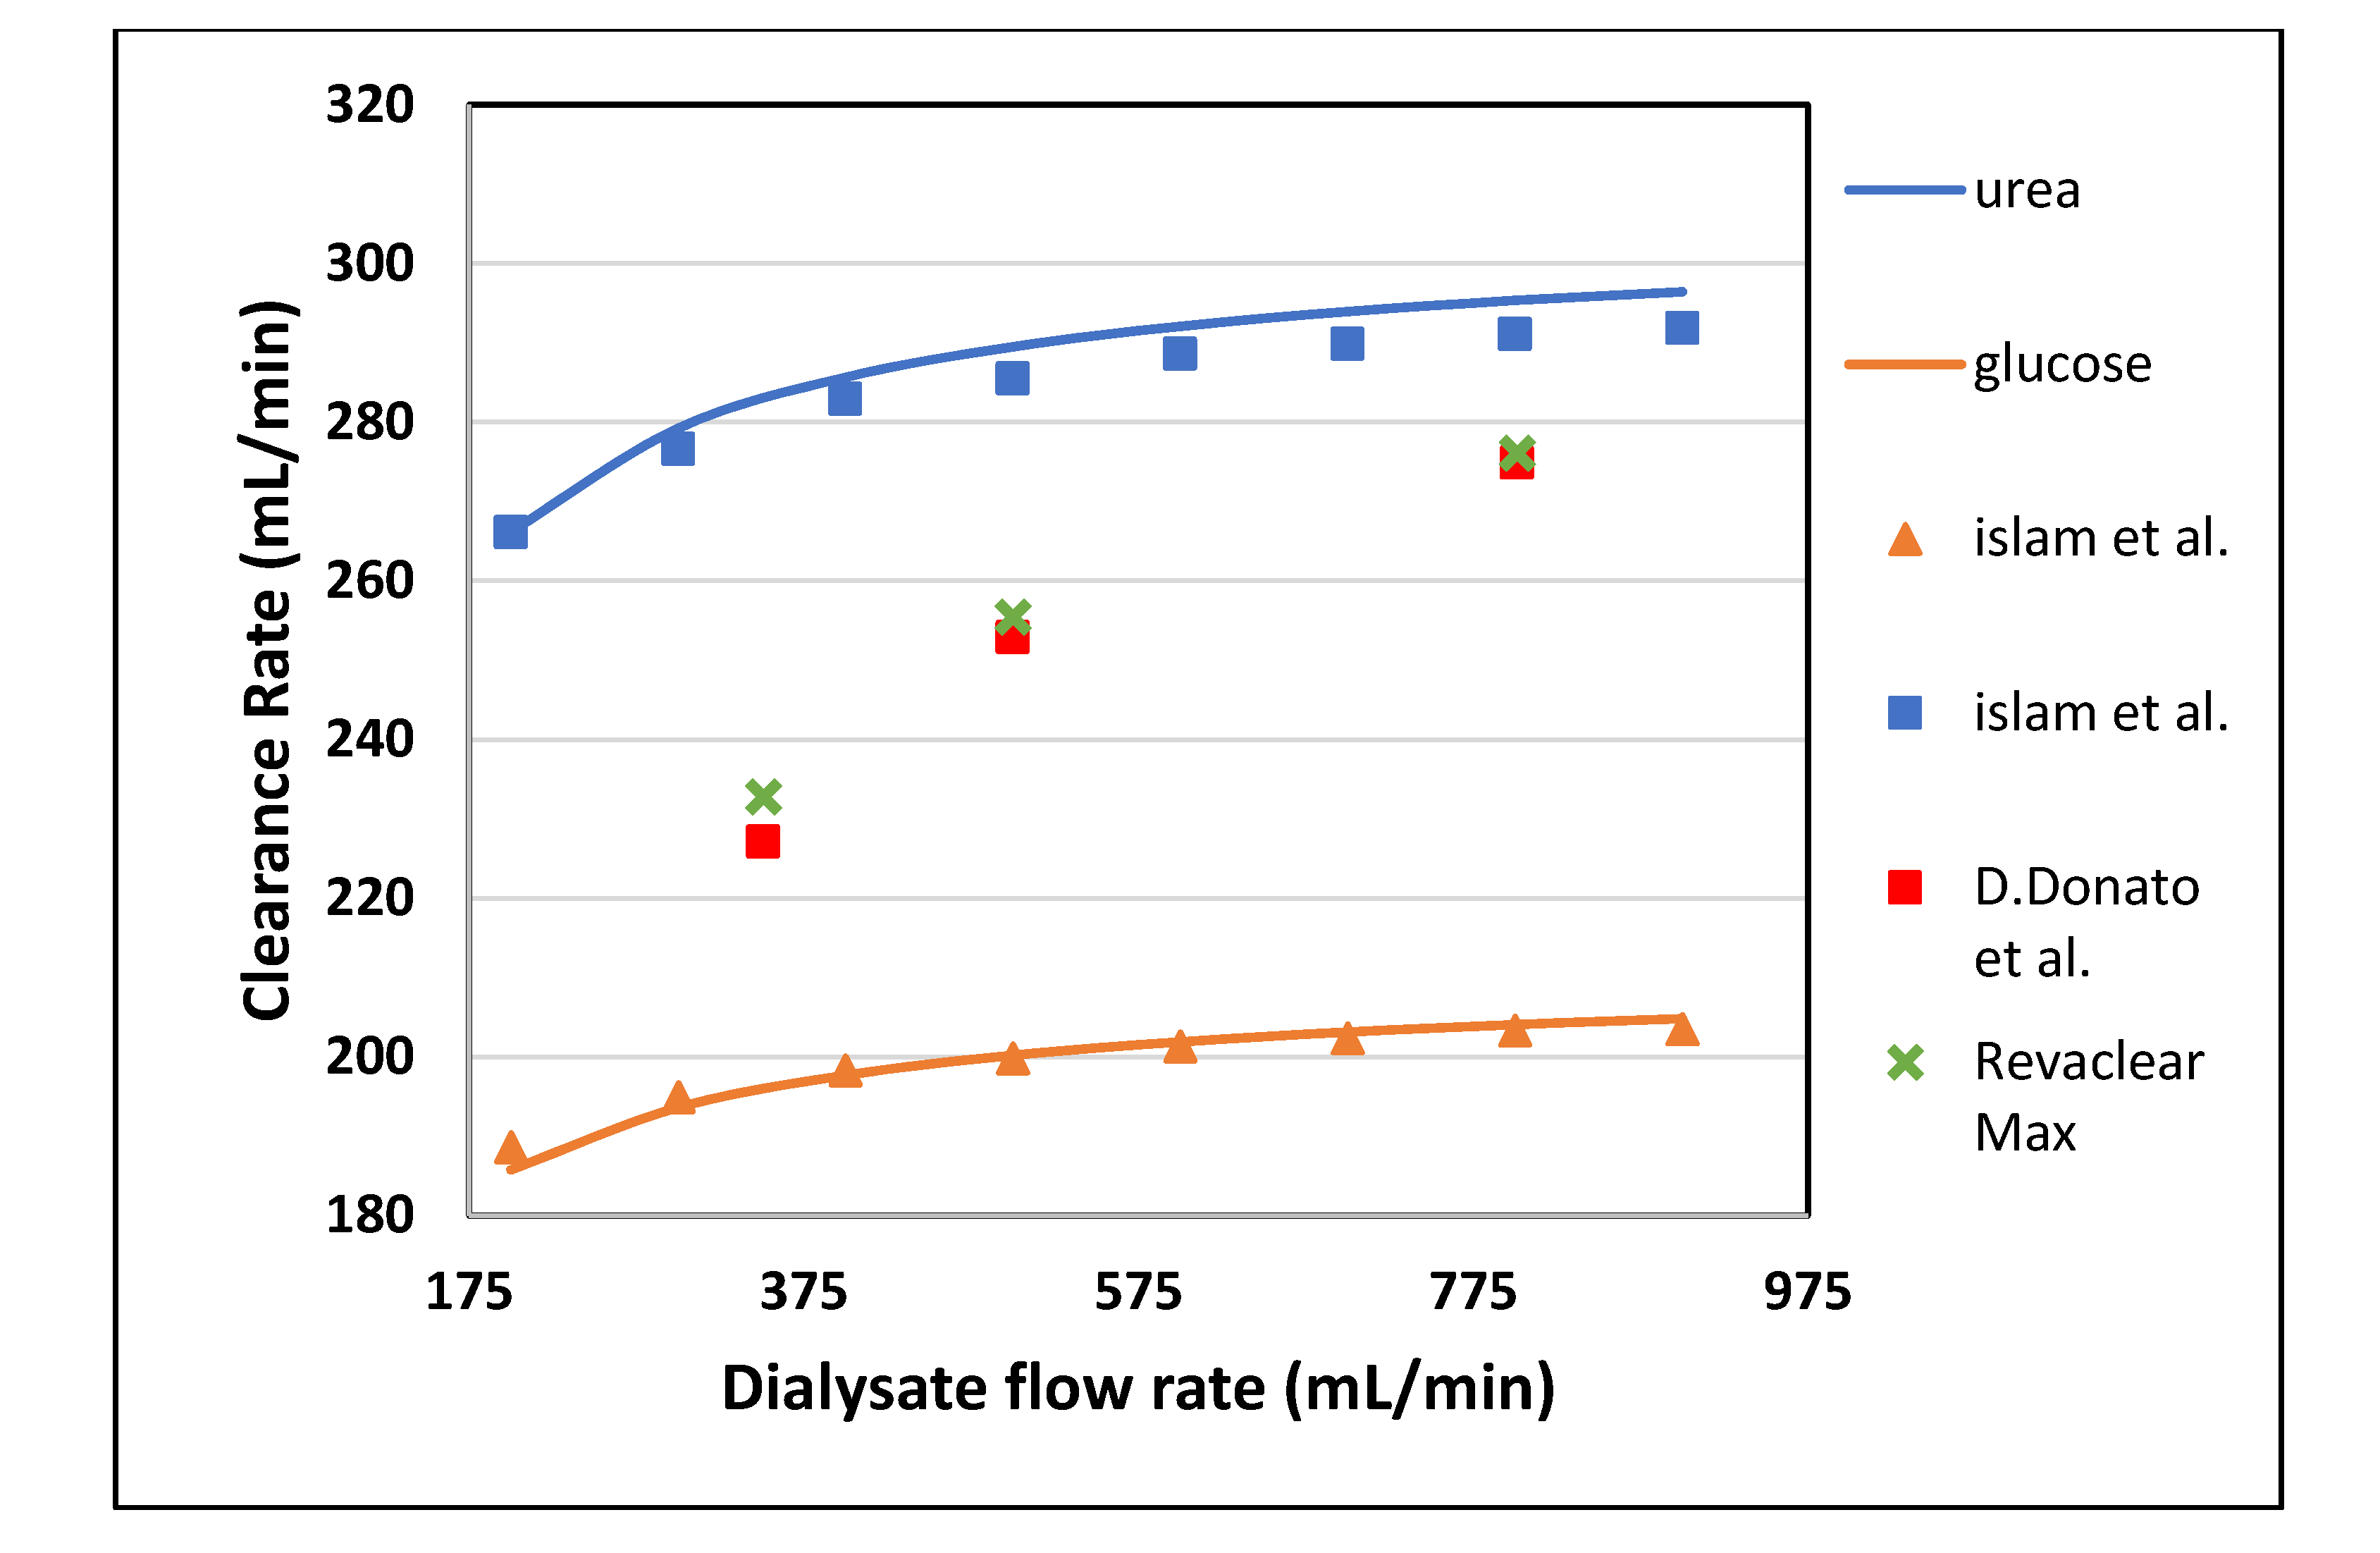
Tortuous pore diffusion model (TPDM) was used to describe mass transport through the dialyzer membrane. Porosity and tortuosity were incorporated in this model to achieve a better estimation of solute clearance across the membrane. The numerical results obtained from this model were found in good agreement with the experimental results. This observation suggests that this model can be used to optimize the design and process parameters of the dialyzer module. The proposed model gave an insight into the effect of porous medium tortuosity on the diffusion of different solutes. By increasing the blood flow, the model predicted values of urea and glucose clearance were found 1.28% and 3.26% more than the Islam et al. predicted values. Similarly, the percentage increase found in urea and glucose clearance rate by increasing the dialysate flow, fiber length, and fiber radius was 1.55% and 0.4%; 1.54 and 1.86%; 1.47 and 0.6%, respectively. The clearance rate of urea was increased by 37.71% of its initial value by increasing the fiber aspect ratio. Due to the high steric hindrance H and friction coefficient F(p) the diffusion of large size molecules (i.e., endothelin, β2-microglobulin, complement factor D and albumin) do not increase much. When the pore diameter increases from 10 to 20 nm, the clearance rate of urea and glucose rise by 2.09% and 7.93% of their initial values. The results suggest that the pore diameter cannot be increased beyond 20 nm as it leads to loss of albumin molecules, which cannot be tolerated.

Author Contributions

A.H. and M.A. proposed the main idea and methodology; T.Y. performed the CFD analysis and wrote the manuscript; M.A. and I.A. provided key suggestions and improved the manuscript. All authors have read and agreed to the published version of the manuscript.

Funding

This research received no external funding.

Acknowledgments

The authors are grateful to Sana Yaqoob, Medical Officer, Bakhtawar Amin Trust and Teaching Hospital, Multan, Pakistan for her guidance and support during the preparation of this paper.

Conflicts of Interest

The authors declare no conflict of interest.

Nomenclature

c s , i   molar concentration of the s-th solute in the i-th compartment [mol/liter]
C l s   Clearance rate of the j-th solute [mL/min]
D e , s   Diffusivity of s-th solute in the i-th compartment [m2/s]
d i   diameter of the i-th compartment [mm]
F   friction coefficient
K s   overall mass transfer coefficient of s-th solute [m/s]
k s , i   mass transfer coefficient of s-th solute in the i-th compartment [m/s]
k s , m j   mass transfer coefficient of s-th solute in the j-th membrane layer
L   length of the fiber [mm]
N  total number of fibers [-]
NSh,i  Sherwood number in the i-th compartment [-]
NRe,i  Reynold number in the i-th compartment [-]
p  the ratio of solute radius to the pore radius
QB  the blood flow rate in the blood compartment [mL/min]
QD  the dialysate flow rate in the dialysate compartment [mL/min]
r 1   the inner radius of the fiber [mm]
r 2   the radius up to the outer layer of the fiber [mm]
r 3   the radius of the concentric permeate channel [mm]
SD  steric hindrance factor at pore inlet
ui  axial velocity in the i-th compartment [m/s]
vi  radial velocity in the i-th compartment [m/s]
z  axial co-ordinate [m]
Subscript and superscript
B  blood
D  dialysate
e  effective
i  i-th compartment (B,m,D)
i n   inlet
j  j-th membrane layer (skin, middle, bulk)
m  membrane
Greek symbols
δ j   the thickness of the j-th membrane layer [mm]
ɛ m j   membrane j-th layer porosity [-]
μ i   fluid viscosity in the i-th compartment [kg/ms]
ρ i   fluid density in the i-th compartment

References

  1. Eloot, S.; Vierendeels, J.; Verdonck, P. Optimisation of solute transport in dialysers using a three-dimensional finite volume model. Comput. Methods Biomech. Biomed. Eng. 2006, 9, 363–370. [Google Scholar] [CrossRef] [PubMed]
  2. Conrad, S.A. Hemodialysis and hemofiltration. Wiley Encycl. Biomed. Eng. 2006. [Google Scholar] [CrossRef]
  3. Galach, M.; Ciechanowska, A.; Sabalińska, S.; Waniewski, J.; Wójcicki, J.; Weryńskis, A. Impact of convective transport on dialyzer clearance. J. Artif. Organs 2003, 6, 0042–0048. [Google Scholar] [CrossRef] [PubMed]
  4. Legallais, C.; Catapano, G.; Von Harten, B.; Baurmeister, U. A theoretical model to predict the in vitro performance of hemodiafilters. J. Membr. Sci. 2000, 168, 3–15. [Google Scholar] [CrossRef]
  5. Kunitomo, T.; Lowrie, E.; Kumazawa, S.; O’Brien, M.; Lazarus, J.; Gottlieb, M.; Merrill, J. Controlled ultrafiltration (uf) with hemodialysis (hd): Analysis of coupling between convective and diffusive mass transfer in a new hd-uf system. Trans Am. Soc. Artif. Intern. Organs 1977, 23, 234–243. [Google Scholar] [CrossRef]
  6. Jaffrin, M.; Gupta, B.; Malbrancq, J. A one-dimensional model of simultaneous hemodialysis and ultrafiltration with highly permeable membranes. J. Biomech. Eng. 1981, 103, 261. [Google Scholar] [CrossRef]
  7. Chang, Y.-L.; Lee, C.-J. Solute transport characteristics in hemodiafiltration. J. Membr. Sci. 1988, 39, 99–111. [Google Scholar] [CrossRef]
  8. Werynski, A.; Waniewski, J. Theoretical description of mass transport in medical membrane devices. Artif. Organs 1995, 19, 420–427. [Google Scholar] [CrossRef]
  9. Wüpper, A.; Woermann, D.; Dellanna, F.; Baldamus, C. Retrofiltration rates in high-flux hollow fiber hemodialyzers: Analysis of clinical data. J. Membr. Sci. 1996, 121, 109–116. [Google Scholar] [CrossRef]
  10. Annan, K. Mathematical modeling for hollow fiber dialyzer: Blood and HCO3- dialysate flow characteristics. Int. J. Pure Appl. Math. 2012, 79, 425–452. [Google Scholar]
  11. Wüpper, A.; Dellanna, F.; Baldamus, C.; Woermann, D. Local transport processes in high-flux hollow fiber dialyzers. J. Membr. Sci. 1997, 131, 181–194. [Google Scholar] [CrossRef]
  12. Raff, M.; Welsch, M.; Göhl, H.; Hildwein, H.; Storr, M.; Wittner, B. Advanced modeling of highflux hemodialysis. J. Membr. Sci. 2003, 216, 1–11. [Google Scholar] [CrossRef]
  13. Eloot, S.; De Wachter, D.; Van Tricht, I.; Verdonck, P. Computational flow modeling in hollow-fiber dialyzers. Artif. Organs 2002, 26, 590–599. [Google Scholar] [CrossRef]
  14. Eloot, S.; D’asseler, Y.; De Bondt, P.; Verdonck, P. Combining spect medical imaging and computational fluid dynamics for analyzing blood and dialysate flow in hemodialyzers. Int. J. Artif. Organs 2005, 28, 739–749. [Google Scholar] [CrossRef]
  15. Ding, W.; He, L.; Zhao, G.; Zhang, H.; Shu, Z.; Gao, D. Double porous media model for mass transfer of hemodialyzers. Int. J. Heat Mass Transf. 2004, 47, 4849–4855. [Google Scholar] [CrossRef]
  16. Ding, W.; Li, W.; Sun, S.; Zhou, X.; Hardy, P.A.; Ahmad, S.; Gao, D. Three-dimensional simulation of mass transfer in artificial kidneys. Artif. Organs 2015, 39, E79–E89. [Google Scholar] [CrossRef]
  17. Yamamoto, K.-I.; Hayama, M.; Matsuda, M.; Yakushiji, T.; Fukuda, M.; Miyasaka, T.; Sakai, K. Evaluation of asymmetrical structure dialysis membrane by tortuous capillary pore diffusion model. J. Membr. Sci. 2007, 287, 88–93. [Google Scholar] [CrossRef]
  18. Ouseph, R.; Hutchison, C.A.; Ward, R.A. Differences in solute removal by two high-flux membranes of nominally similar synthetic polymers. Nephrol. Dial. Transplant. 2008, 23, 1704–1712. [Google Scholar] [CrossRef] [PubMed]
  19. Hedayat, A.; Szpunar, J.; Kumar, N.; Peace, R.; Elmoselhi, H.; Shoker, A. Morphological characterization of the polyflux 210h hemodialysis filter pores. Int. J. Nephrol. 2012, 2012. [Google Scholar] [CrossRef]
  20. Bird, R.B. Transport phenomena. Appl. Mech. Rev. 2002, 55, R1–R4. [Google Scholar] [CrossRef]
  21. Donato, D.; Boschetti-de-Fierro, A.; Zweigart, C.; Kolb, M.; Eloot, S.; Storr, M.; Krause, B.; Leypoldt, K.; Segers, P. Optimization of dialyzer design to maximize solute removal with a two-dimensional transport model. J. Membr. Sci. 2017, 541, 519–528. [Google Scholar] [CrossRef]
  22. Islam, M.S.; Szpunar, J. Study of dialyzer membrane (polyflux 210h) and effects of different parameters on dialysis performance. Open J. Nephrol. 2013, 3, 161–167. [Google Scholar] [CrossRef] [Green Version]
  23. Gambro. Polyfluxtm H—Gambro. Available online: www.gambro.com/PageFiles/7431/HCEN2489_5%20Polyflux_H.pdf?epslanguage=en (accessed on 8 January 2020).
  24. Kirsch, A.H.; Lyko, R.; Nilsson, L.-G.; Beck, W.; Amdahl, M.; Lechner, P.; Schneider, A.; Wanner, C.; Rosenkranz, A.R.; Krieter, D.H. Performance of hemodialysis with novel medium cut-off dialyzers. Nephrol. Dial. Transplant. 2017, 32, 165–172. [Google Scholar] [CrossRef] [PubMed] [Green Version]
  25. Bhimani, J.P.; Ouseph, R.; Ward, R.A. Effect of increasing dialysate flow rate on diffusive mass transfer of urea, phosphate and β2-microglobulin during clinical haemodialysis. Nephrol. Dial. Transplant. 2010, 25, 3990–3995. [Google Scholar] [CrossRef] [Green Version]
Figure 1. A framework of the geometry of the dialyzer module (lower panel) with its model developed in this work (upper panel).
Membranes 10 00139 g001
Figure 2. Simulation workflow in COMSOL Multiphysics 5.4.
Membranes 10 00139 g002
Figure 3. Axisymmetric concentration contour of urea at both blood and dialysate side and across the membrane.
Membranes 10 00139 g003
Figure 4. The urea clearance rate for in-silico and in-vitro cases at varying blood flow rate with constant dialysate flow rate (QD = 500 mL/min).
Membranes 10 00139 g004
Figure 5. The model predicted (solid lines) vs. in vivo and in silico (symbols) solute clearances plotted against varying blood flow rate at QD = 500 mL/min.
Membranes 10 00139 g005
Figure 6. The model predicted (solid lines) vs. in vivo and silico (symbols) solute clearances plotted against varying blood flow rate at QD = 500 mL/min.
Membranes 10 00139 g006
Figure 7. The model predicted (solid lines) vs. in vivo and in silico (symbols) solute clearances plotted against varying dialysate flow rate at QB = 400 mL/min.
Membranes 10 00139 g007
Figure 8. The model predicted (solid lines) vs. in vivo and silico (symbols) solute clearances plotted against varying dialysate flow rate at QB = 400 mL/min.
Membranes 10 00139 g008
Figure 9. The clearance rate of low molecular weight solutes (urea, glucose) plotted against varying length of the dialyzer at QB = 300 mL/min and QD = 500 mL/min.
Membranes 10 00139 g009
Figure 10. The clearance rate of high molecular weight solutes plotted against varying length of the dialyzer at QB = 300 mL/min and QD = 500 mL/min.
Membranes 10 00139 g010
Figure 11. The clearance rate of low molecular weight solutes plotted against varying radius of the dialyzer at QB = 300 mL/min and QD = 500 mL/min.
Membranes 10 00139 g011
Figure 12. The clearance rate of high molecular weight solutes plotted against varying radius of the dialyzer at QB = 300 mL/min and QD = 500 mL/min.
Membranes 10 00139 g012
Figure 13. Dimensionless urea clearance rate plotted with the varying fiber aspect ratio.
Membranes 10 00139 g013
Figure 14. Effect of pore diameter on the clearance rate of urea and glucose.
Membranes 10 00139 g014
Figure 15. Effect of pore diameter on the clearance rate of large molecular weight (LMW) molecules.
Membranes 10 00139 g015
Table 1. Molecules that were examined in the computational analysis with their molecular weight [18] and diameter [19].
MoleculeMolecular Mass (Da)Radius (nm)
Urea600.24
Glucose1800.5
Endothelin4282.81.30
β2-Microglobulin11,8001.94
Complement Factor D24,0002.56
Albumin66,0003.9
Table 2. A comprehensive dataset of model parameters used for model predictions [17,22].
ParametersValuesUnits
Inner radius of the fiber, r10.10mm
Radius up to the outer layer, r20.145mm
Radius of the concentric permeate channel, r30.210mm
Length of the fiber, L270mm
Tortuosity, τ2.27
Inlet concentration, cs,in1mol/liter
Inlet blood flow rate, QB300mL/min
Inlet dialysate flow rate, QD500mL/min
Total number of fibers, N12,000
Porosity of skin layer, ɛs0.1
Porosity of middle layer, ɛm0.27
Porosity of bulk layer, ɛb0.4
Average size of skin layer pores, ds39.5nm
Average size of middle layer pores, dm450nm
Average size of bulk layer pores, db20,400nm
Table 3. Comparison of this model results with literature data [21,22].
Blood Flow Rate (mL/min)Model PredictedIslam et al.Experimental Data (Polyflux 210H) Percentage Difference of Model-Predicted and Manufacturer DataPercentage Difference of Islam et al. and Manufacturer Data
300247.77244.6228111.8212.94
400289.52286.4033914.5915.51
500318.44317.0437815.7516.12
Table 4. Maximum percentage difference of this model with literature data at varying blood flow rate [21].
SolutesBlood Flow Rate (mL/min)Model-Predicted Clearance (mL/min)Islam et al. Clearance (mL/min) Percentage Difference
Urea300247.77244.621.28
Glucose200152.50147.683.26
Endothelin60040.2846.0812.52
β2-Microglobulin60021.1325.5717.39
Complement Factor D60012.8116.0720.28
Albumin6005.547.2223.33
Table 5. Maximum percentage difference of this model with literature data at varying dialysate flow rate [22].
SolutesDialysate Flow Rate (mL/min)Model-Predicted Clearance (mL/min)Islam et al. Clearance (mL/min)Percentage Difference
Urea 900296.45291.841.57
Glucose 900203.48204.480.4
Endothelin20038.9542.829.03
β2-Microglobulin20020.6323.9513.85
Complement Factor D30012.7715.1515.71
Albumin4005.566.8919.28
Table 6. Maximum percentage difference of this model with literature data at varying dialyzer fiber length [22].
SolutesFiber Length (mm)Model-Predicted Clearance (mL/min)Islam et al. Clearance (mL/min)Percentage Difference
Urea 270247.772441.54
Glucose 420231.93227.681.86
Endothelin27039.8042.706.79
β2-Microglobulin30023.6726.5410.81
Complement Factor D27012.8914.8012.30
Albumin2705.616.6315.34
Table 7. Maximum percentage difference of this model with literature data at a varying radius of dialyzer fiber [22].
SolutesFiber Radius (mm)Model-Predicted Clearance (mL/min)Islam et al. Clearance (mL/min)Percentage Difference
Urea 0.1247.77244.181.46
Glucose 0.1182.65181.480.64
Endothelin0.258.3468.7515.13
β2-Microglobulin0.228.7739.30226.78
Complement Factor D0.216.9825.3933.11
Albumin0.26.9712.2342.95
Table 8. Maximum percentage difference of this model with literature data at a varying aspect ratio of dialyzer fiber [22].
SolutesFiber Aspect Ratio (-)Model-Predicted Clearance (mL/min)Islam et al. Clearance (mL/min)Percentage Difference
Urea 9000.69110.862515.52
Table 9. Maximum percentage difference of this model with literature data at a varying pore diameter of dialyzer fiber [22].
SolutesPore Dia (nm)Model-Predicted Clearance (mL/min)Islam et al. Clearance (mL/min) Percentage Difference
Urea ----
Glucose ----
Endothelin5842.0045.818.32
β2-Microglobulin5623.1826.0811.12
Complement Factor D5614.7617.2914.63
Albumin567.139.3523.74

