Article

Reduced Graphene Oxide-Based Foam as an Endocrine Disruptor Adsorbent in Aqueous Solutions

by
Jeanne N’Diaye
1,
Sujittra Poorahong
1,†,
Ons Hmam
1,
Gastón Contreras Jiménez
1,2,
Ricardo Izquierdo
3 and
Mohamed Siaj
1,*
1
Department of Chemistry and Biochemistry, Université du Québec à Montréal, Montréal, QC H3C 3P8, Canada
2
Laboratorio de Microdisección Láser, Instituto de Ecología, Universidad Nacional Autónoma de Mexico, Ciudad de Mexico 04510, Mexico
3
École de technologie supérieure, Université du Québec à Montréal, Montréal, QC H3C 1K3, Canada
*
Author to whom correspondence should be addressed.
Current position: Functional Materials and Nanotechnology Center of Excellence, Walailak University, Thasala, Nakhon Si Thammarat 80160, Thailand.
Membranes 2020, 10(11), 340; https://doi.org/10.3390/membranes10110340
Submission received: 15 October 2020 / Revised: 7 November 2020 / Accepted: 9 November 2020 / Published: 13 November 2020
(This article belongs to the Special Issue Advancements of 2D Materials-Based Membranes)

Abstract

:
A stable and magnetic graphene oxide (GO) foam–polyethyleneimine–iron nanoparticle (GO–PEI–FeNPs) composite has been fabricated for removal of endocrine disruptors—bisphenol A, progesterone and norethisterone—from aqueous solution. The foam with porous and hierarchical structures was synthesized by reduction of graphene oxide layers coupled with co-precipitation of iron under a hydrothermal system using polyethyleneimine as a cross linker. The presence of magnetic iron nanoparticles facilitates the separation process after decontamination. The foam was fully characterized by surface and structural scanning electron microscopy, Fourier transform infrared spectroscopy, Raman spectroscopy and X-ray photoelectron spectroscopy. The foam exhibits a high adsorption capacity, and the maximum adsorption percentages are 68%, 49% and 80% for bisphenol A, progesterone and norethisterone, respectively. The adsorption process of bisphenol A is explained according to the Langmuir model, whereas the Freundlich model was used for progesterone and norethisterone adsorption.

Graphical Abstract

1. Introduction

Endocrine disruptors are substances affecting the primary communication network of the body, which is responsible for controlling multiple body functions. This network is named the endocrine system and includes different organs such as ovaries, testes, adrenal glands, pituitary gland, thyroid, and the pancreas. These chemicals harm human and wildlife by causing tumors, birth defects and disorders in development of the fetus. In addition to these effects on the human body, these disruptors can also mimic or interfere with the function of hormones in the body due to similarity in their structure and activity by influencing sexual development of humans or wildlife. The best example is feminization of males or masculinization effects on females [1,2,3]. One of the major endocrine disruptors, called bisphenol A (BPA), possesses hormone-like behavior and is contained in epoxy resins that are used to line water pipes. Furthermore, natural hormones such as progesterone, β-Estradiol and norethisterone when in excess can also act on the endocrine system, thus causing a disorder in the regular hormonal process of living beings.
Various techniques have been developed throughout the years to adsorb and remove BPA and other endocrine disruptors from water. Yuan and Al used composite electrodes such as Pd/Ti and RuO2/Ti to degrade BPA in a soil matrix [4,5]. Another approach is to utilize carbon materials such as activated carbon and carbon nanotubes to remove BPA. Although these materials have been found to be very effective at absorbing BPA, with an adsorption capacity reported to be 182 mg g−1, an issue remains in terms of recyclability [6,7,8].
Graphene is one of the most studied carbon nanomaterials, discovered in 2004 by Novoselov and Geim [9]. This two-dimensional carbon material with a honeycomb lattice structure exhibits tremendous properties including a high surface area of 2630 m2.g−1, outstanding mechanical properties with a high Young’s modulus (1 TPa), a high thermal conductivity (5000 W mK−1) and an electron mobility higher than those of most semi-conductor materials (2.5 × 105 cm2 V−1 s−1) [10,11,12].
One method to produce high-quality graphene is chemical vapor deposition (CVD); however, this method only gives a few layers of graphene. Therefore, researchers have developed alternative synthesis methods for large-scale production of graphene via chemical exfoliation of graphite. Multiple synthesis paths have been developed since the 19th century, starting with Brodie who was able to oxidize graphite [13] and then Staudenmaier who improved the synthesis by reducing the number of oxidation steps [14]. The last enhancement of graphene oxide (GO) synthesis was developed by Hummers who used potassium permanganate, which is a strong oxidizing agent, and sulfuric acid instead of fume nitric acid, which was used previously [15]. Others have made modification to this synthesis, but the mechanism to form GO remains the same [16].
Many applications have been developed based on graphene material such as preparation of nanocomposites with polymers fillers, e.g., polyvinyl alcohol (PVA), poly(methyl methacrylate) (PMMA) or polyethyleneimine (PEI) [17,18,19]. These composite materials were synthesized in order to enhance mechanical, electrical or structural properties of the polymers. Graphene oxide can be used for preparation of thin conductive films by using various deposition techniques, [20,21,22,23,24] fabrication of electrochemical sensors and biosensors [25,26], preparation of 3D graphene oxide assembly for dyes and gas adsorption [27,28], and as an electrode for energy storage applications like supercapacitors [29,30]. Researchers have worked toward investigating and developing models for understanding the adsorption mechanism of large macromolecules. For instance, the Langmuir and Freundlich models have been used to investigate removal of dye using different substrates [31,32]. The Langmuir model often assumes adsorption of a monolayer on a homogenous surface, while the Freundlich isotherm is based on adsorption of multilayers on a heterogeneous surface [33].
In this paper, fabrication of a magnetic reduced graphene oxide 3D foam is presented. Graphene oxide was synthesized using a modified Hummers method. The composite material was fabricated using PEI as a polymer binder and iron nanoparticles under hydrothermal condition. The iron nanoparticles (FeNPs) were included in the composite material to introduce magnetic properties. After synthesis, the material was characterized by scanning electron microscopy, X-ray photoelectron spectroscopy (XPS), X-ray diffraction (XRD) and Raman spectroscopy. The foam is structurally stable and exhibits magnetic properties. The material was used to adsorb endocrine disruptors such as BPA, progesterone and norethisterone, and a comparison of adsorption behavior between the former molecules is presented. Evaluation of the adsorption ability of the GO composite foam toward endocrine disruptor compounds was carried out using UV–VIS spectroscopy. It is capable of attracting and adsorbing large molecules through π–π stacking, van der Waals forces or hydrogen bonding. This is the first attempt to adsorb high molecular weight molecules with a graphene-based membrane in an aqueous medium, showing that these types of material are good candidates for these types of application.

2. Materials and Methods

2.1. Materials

Natural flakes of graphite with an average particle diameter of 300 μm (99 wt% purity), sulfuric acid (98 wt%), hydrogen peroxide (30 wt%), phosphoric acid, potassium permanganate, hydrochloric acid (37 wt%), ethanol (100 wt%), ethyl ether, PEI (linear, Mw ≈ 50,000 g mol−1), iron nanoparticles (FeNPs) [34], bisphenol A, progesterone and norethisterone were all purchased from Sigma Aldrich (Oakville, ON, Canada). All chemicals were used without further purification. Ultrapure water (18 MΩ∙cm) was used in all experiments.

2.2. Graphene Oxide Synthesis

Graphene oxide was prepared using natural graphite powder through a modified Hummers method [16]. In a typical experiment, graphite (3 g, 500 mesh), 360 mL of H2SO4 and 40 mL of H3PO4 were put into a 1 L flask. The mixture was stirred for 30 min at 55 °C. After this step, 18 g of KMnO4 was added in small portions to prevent rapid temperature rise. The mixture was stirred continuously for 4.30 h and the temperature was kept at 55 °C. Several ultrasonication periods of 30 min were applied during the stirring time to exfoliate graphite oxide into graphene oxide sheets [21]. The suspension was further treated in order to convert the residual permanganate and MnO2 into soluble MnSO4 by adding it to a mixture of H2O2 (10 mL, 30%) and water (600 mL) at 0 °C and stirred. The resulting suspension had a bright yellow color. This suspension was further cleaned with water, and a mixture of water, 37% HCl and 100% ethanol. The mixture was then washed with ethyl ether and filtrated on a Teflon filter. The obtained GO is dried in an oven at 30 °C under vacuum. Then the GO was resuspended in water at a concentration of 1.76 mg mL−1 and the obtained yellow-brown aqueous suspension of GO was stored at room temperature for further use.

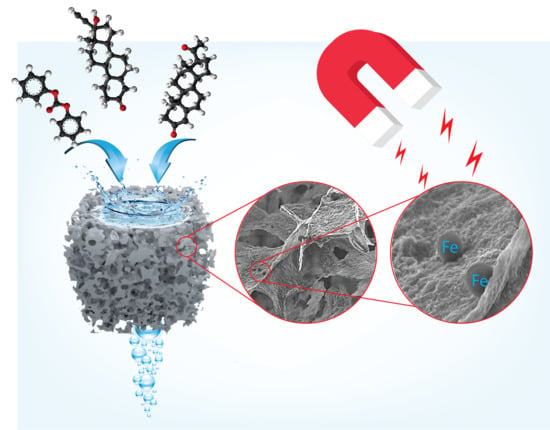
2.3. 3D Porous Materials Preparation (GO–PEI–FeNPs)

Fabrication of 3D porous GO–PEI–FeNPs was adapted from Han and co-workers [17]. Next 5 mL of GO hydrogel was functionalized with 200 mg of PEI. After the solution was mixed by firmly shaking, aggregates were formed. Then 120 mg of iron nanoparticles powder was added to the mixture and sonicated in an ultrasound bath for 3 h. The solution was placed in an oil bath overnight at 90 °C. The obtained gel was centrifuged at 4000 rpm for 10 min. The hydrogel solution was transferred to a template, and the composite material was frozen at −80 °C for 4 h, and then freeze-dried under vacuum for 24 h.

2.4. Instrumental Characterization

The GO–PEI–FeNPs composite was imaged with a JEOL JSM7600F (Peabody, MA, USA) scanning electron microscope (SEM). Raman spectroscopy was conducted using a Renishaw InVia Raman microscope (Ulm, Germany) with a 488 nm laser to confirm the integrity of the GO structure. Attenuated total reflectance–Fourier transform infrared spectra (ATR–FTIR) were recorded with a Nicolet 6700 (Madison, WI, USA) to identify bonding between PEI and GO. X-ray diffraction (XRD) with a Bruker D8 Advance (D-5000) (Bruker, MA, USA) was performed to study the phase composition of the iron nanoparticles. The chemical composition of the sample was investigated by X-ray photoelectron spectroscopy using XPS (PHI 5600-ci, Physical Electronics, Eden Prairie, MN, USA). The adsorption behavior of endocrine disruptors from the GO–PEI–FeNPs composite was studied by measuring unabsorbed amounts of analyte in solution via UV–VIS with a LAMBDA 750 UV/Vis/NIR spectrometer (Perkin Elmer, Waltham, MA, USA).

2.5. Adsorption of BPA, Progesterone and Norethisterone

The adsorption capacity of the foam for BPA, progesterone and norethisterone was studied in aqueous solution. In a typical experiment, the GO–PEI–FeNPs foam was immersed in a beaker containing 100 mL of 15 ppm of each analyte solution: BPA, progesterone and norethisterone. Adsorption was carried out at room temperature. The solution was sampled at various adsorption times and the adsorption ability of the foam was quantified with UV–VIS spectroscopy. The effects of immersion time and concentration of the analyte were studied by calculating the percentage of compounds (%) adsorbed by the graphene-based membrane using Equation (1) for each GO–PEI–FeNPs foam immersion into a specific analyte solution at a determined time.
%   adsorbed   compounds t   =   ( C i C f C i ) × 100
where Ci and Cf (mg∙L−1) represent the initial and final concentrations, respectively, at a determined time, t, of BPA, progesterone and norethisterone aqueous solutions.
As the adsorption of analyte onto GO–PEI–FeNPs foam obeys a binding isotherm, the % removal for each set of incubations was plotted vs. the time (t) of each incubation. Later the rectangular hyperbola function form in Equation (2) was used to determine the maximum % adsorbed compounds (% Rmax) for each analyte through non-linear regression analysis. The k’ is a constant related to desorption [35,36,37].
Rectangular hyperbola function form:
%   adsorbed   compounds = % R max · t k + t

3. Results and Discussion

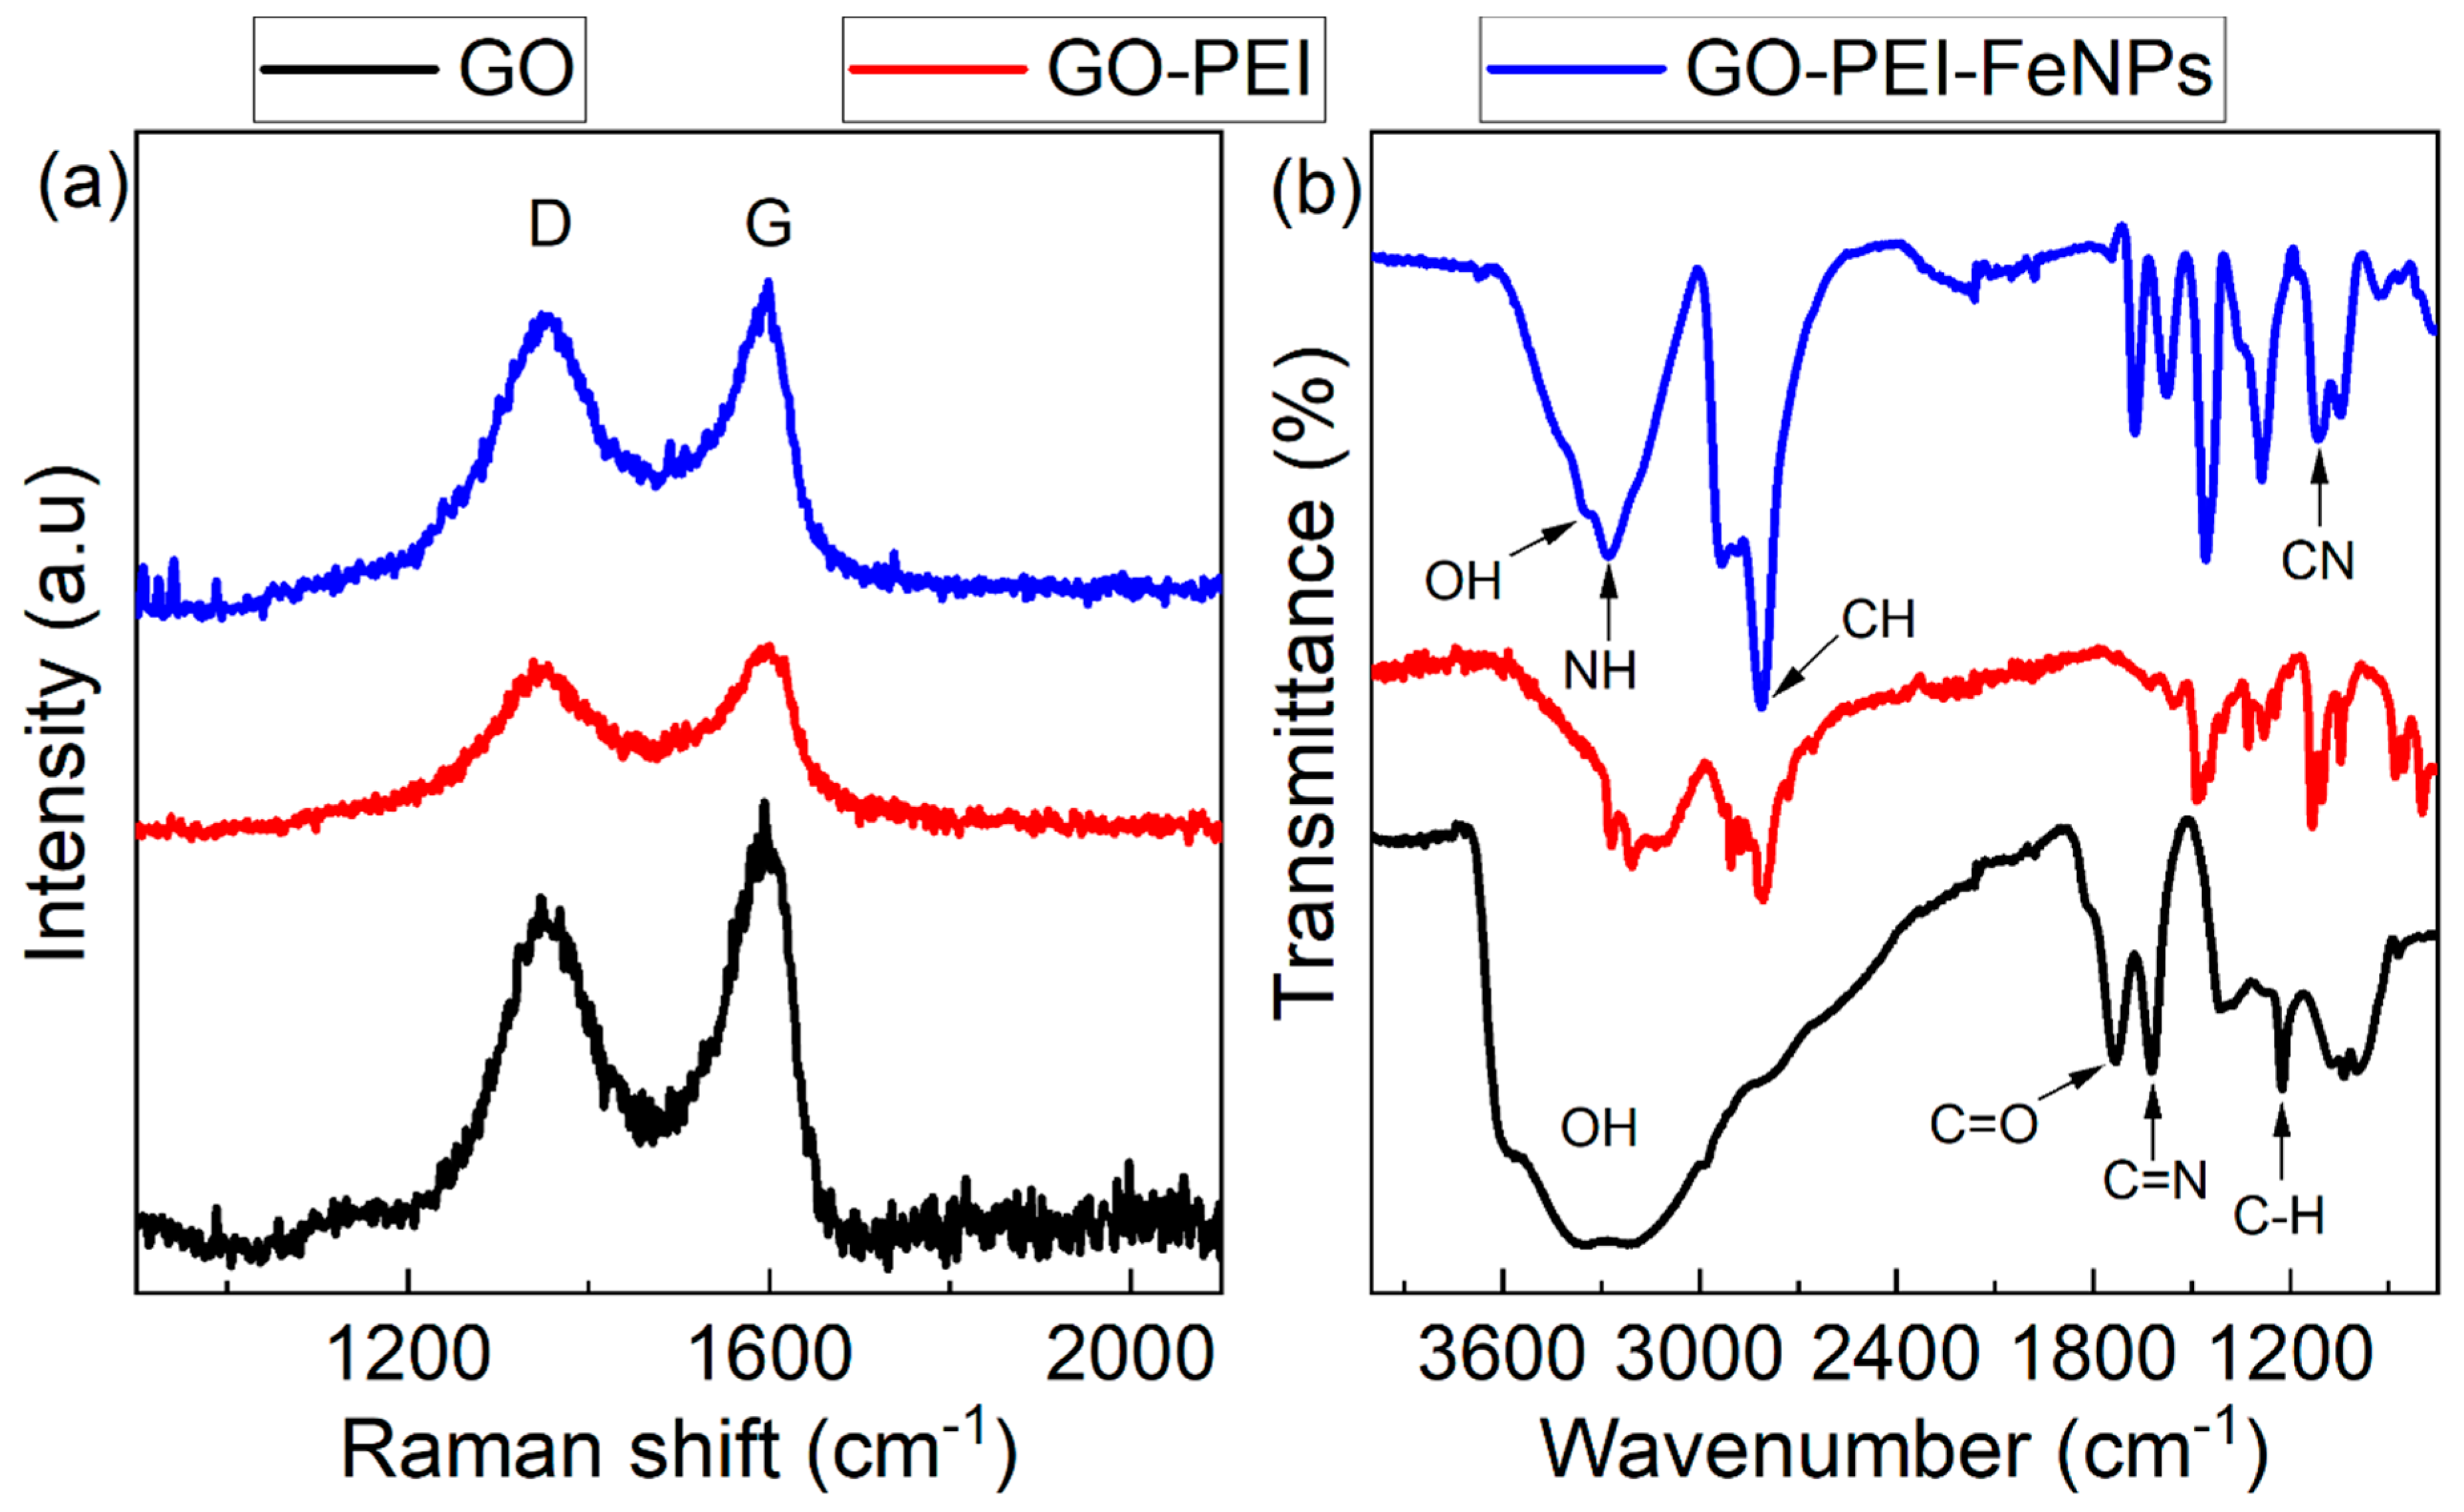
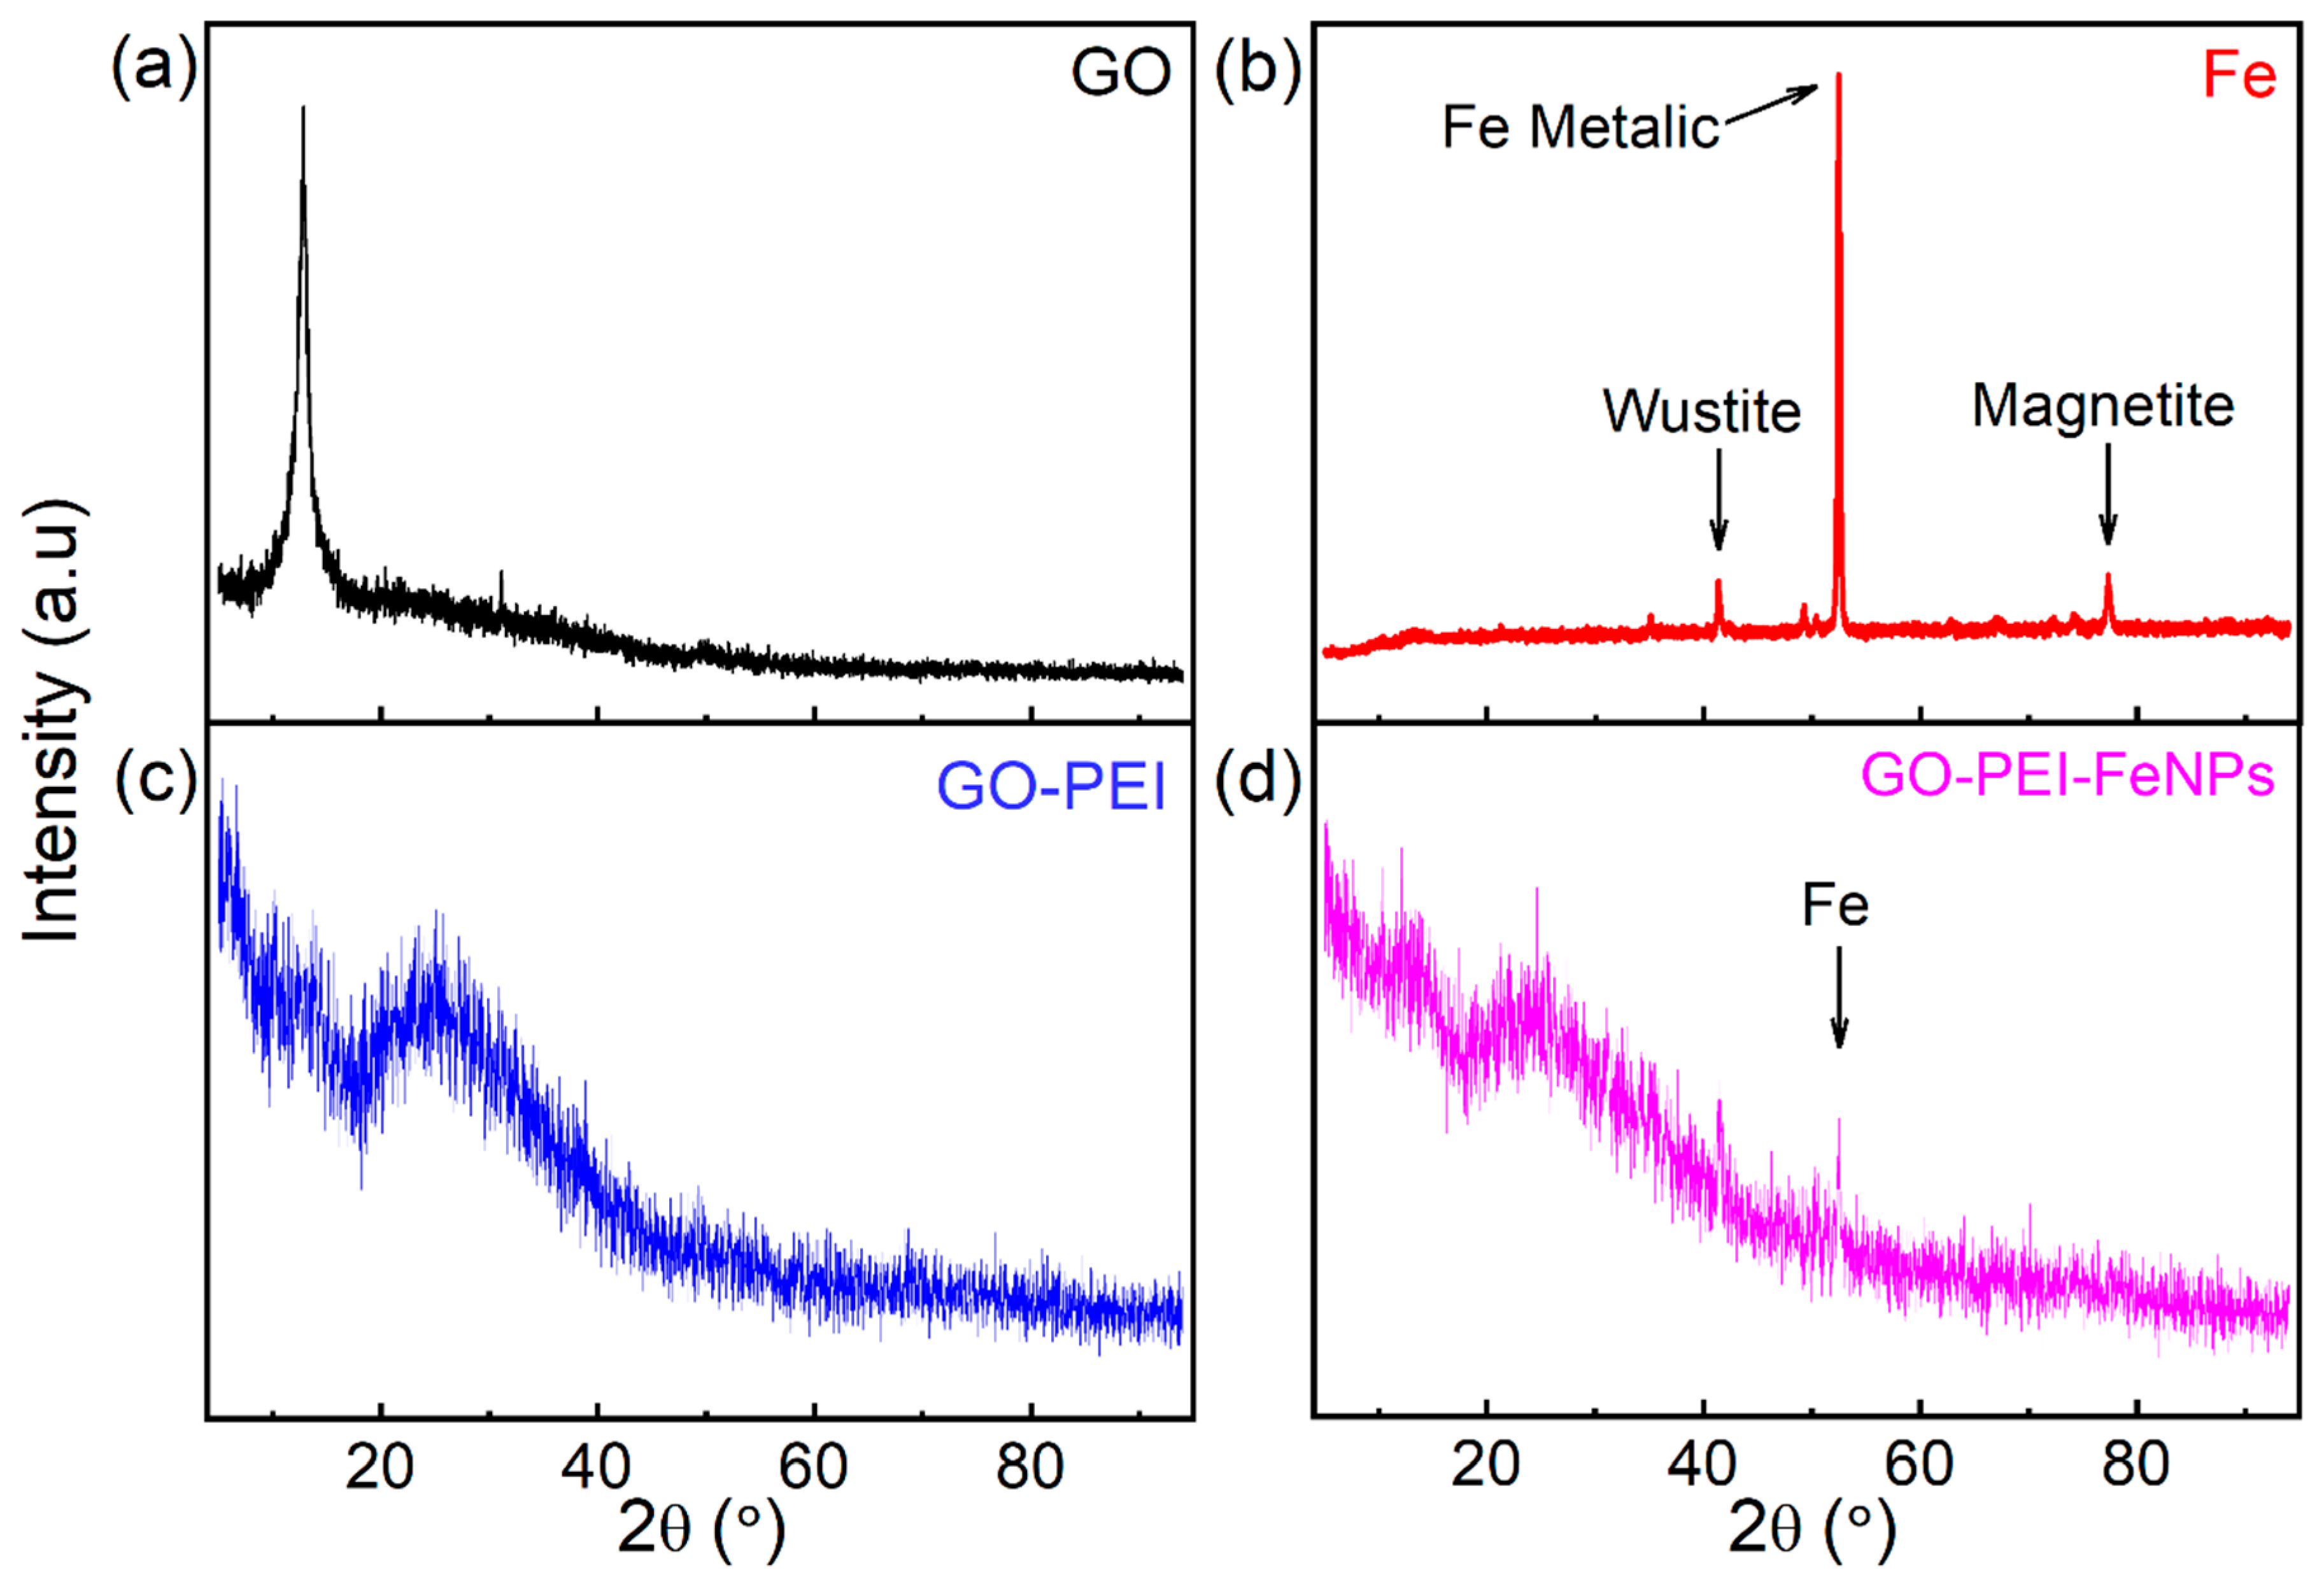
3.1. Membrane Characterization

Figure 1 shows a digital image of the GO-based foam and SEM images at different magnifications. Each GO–PEI–FeNPs foam was stable and was ca. 0.4 cm thick with a diameter of ca. 3 cm (Figure 1a). In addition, the composite foam exhibited magnetic properties when in contact with an external magnet (Figure 1b). In the SEM image of the GO–PEI–FeNPs foam in Figure 1c, the synthesized GO-based composite foam material shows a macroporous structure with iron nanoparticles deposited on the surface. This porous structure provides a large surface area that will promote diffusion of the analyte from the bulk solution to the surface, which could lead to more efficient adsorption. At higher magnification, as seen in Figure 1d, the magnetic particles are observed with an average diameter of 100 nm.
Raman spectroscopy was conducted in order to evaluate the graphitic nature of the composite. Figure 2a shows the Raman spectra of three different types of foams, GO, GO–PEI and GO–PEI–FeNPs. All three spectra exhibit typical Raman D and G bands of GO at 1347.91 cm1 and 1594.36 cm1, respectively [38]. These results indicate that the method used to prepare the foam is non-destructive and the nature of the carbon is maintained throughout the process, even after incorporation of PEI and iron nanoparticles. Knowing that the intensities (ID/IG) ratio is proportional to the number of structural defects, this ratio was evaluated as 0.81, 0.97 and 0.98 for GO, GO–PEI and GO–PEI–FeNPs, respectively. The increase in ID/IG ratio with addition of PEI and FeNPs into the foam matrix involves a reduction of the graphene oxide material. Reduction of the GO nanosheets in the foam was confirmed by comparing the ATR–FTIR spectra of GO, GO–PEI and GO–PEI–FeNPs (Figure 2b). ATR-FTIR data show a significant decrease in the intensity of the peak corresponding to the carbonyl and the hydroxyl functional groups at 1735 cm1 and 3354 cm1, respectively. They indicate the presence of a carbonyl functional group. This decrease is accompanied with increase of the C−N bands at 1124 cm1, indicating that a C−N bond is formed between the polymer and the GO. In addition, the peaks corresponding to the PEI are also visible at 3293 and 2900 cm1, demonstrating successful addition of the PEI in the foam.
The chemical compositions of GO and the prepared GO–PEI–FeNPs foam composite were further studied using XPS, a sensitive and powerful tool for monitoring structural changes of carbon-based materials. Figure 3a shows the XPS survey spectra of GO and the GO–PEI–FeNPs foam composite. Compared to the XPS spectrum of GO, the GO–PEI–FeNPs foams had the characteristic N1s peak for PEI centered at ~398 eV. The high resolution C1s XPS spectrums of GO and GO–PEI–FeNPs foam composite were investigated, as shown in Figure 3b. For the GO sample, the C1s peak centered at 284.6 eV was attributed to the graphitic sp2 carbon atoms [39]. The C1s XPS spectra were further deconvoluted, and characteristic peaks for GO were observed at binding energies of 286.3, 287.8 and 288.9 eV corresponding to C−O, C=O and O−C=O, respectively. In the XPS spectrum of the GO–PEI foam, the C=O−C peaks at 288.8 eV decreased and were replaced by the C-N bond originating from the PEI, leading to reduction of GO upon functionalization. Moreover, addition of PEI was further confirmed with the decrease in intensity of the high resolution O1s spectrum (Figure 3c), which was shifted toward lower binding energies, possibly due to the covalent attachment of the N-group from PEI to the GO nanosheets.
Figure 4 presents the XRD pattern of GO, metallic iron, GO–PEI and GO–PEI–FeNPs. This analysis was conducted in order to visualize changes after functionalization of the GO material with the polymer and the FeNPs. In pure GO, the crystalline peak appears at 12.84° with a d-spacing (002) value of 8 Å. When the polymer is added, the peak is shifted to 23.12° with a d-spacing (002) value of 8.43 Å. This shows the behavior of a 3D assembly-reduced graphene oxide, as stipulated by other published work [38,40,41]. Comparison of the XRD pattern in Figure 4b–d shows that the peak corresponding to GO overpowered that of the FeNPs in the GO–PEI–FeNPs composite. This is expected due to the relatively small amount of nanoparticles that was added during the fabrication process. Nonetheless, it is possible to identify the most prominent XRD peak for the FeNPs at 50.58° in the foam, which could be attributed to metallic iron. This shows that during the preparation steps for the foam, the graphene oxide may have acted as a protective agent for iron nanoparticles against oxidation.

3.2. Study of Adsorption of BPA, Progesterone and Norethisterone

The adsorption times of BPA, progesterone and norethisterone were investigated by immersing the GO–PEI–FeNPs foam in aqueous solution at different time intervals. Figure 5 shows the percentage of adsorbed compound vs. time. A fast increase in adsorption is observed followed by a saturation point after a relatively short amount of time for all adsorbed compounds. Equilibrium was maintained for about 5 h with no changes for adsorption of BPA, progesterone and norethisterone. In the case of BPA (Figure 5a), the maximum % adsorbed compound was evaluated at 68% after 60 min. As for progesterone (Figure 5b), the maximum % adsorbed compound was assessed at 49% after 5 h. Finally, norethisterone (Figure 5c) had the highest % adsorbed compound of 80% after just 30 min of contact time. These different adsorption behaviors could be related to the different mechanisms controlling the adsorption process of the different endocrine disruptors. In particular, the presence of Csp2 bonding in all studied compounds allows a strong interaction with the GO plane via π–π stacking. Furthermore, the hydroxyl groups in BPA and the ketone and alkyne groups in the norethisterone can also be adsorbed to the GO foam via hydrogen bonding. As for progesterone, since it only possesses two ketone groups as functional groups, interactions with the foam could be weaker compared to its interactions with BPA and norethisterone, which can explain the lower adsorption by the membrane.
The adsorption capacity against the equilibrium concentration for BPA, progesterone and norethisterone at room temperature and under 60 rpm stirring rate are presented in Figure 6. Two models were investigated, the Langmuir and Freundlich models, to establish and determine the most suitable adsorption mechanisms for all compounds [32,33,42,43].
These models are described by Equations (3) and (4) and their linear equations are shown in Equations (5) and (6):
Langmuir model:
q e = q max · b · C e 1 + b · C e
Freundlich model:
q e = K · C e 1 n
where qe is the adsorption capacity at equilibrium, K is the Freundlich constant related to the adsorption capacity, n is the adsorption intensity, qmax (mg∙g−1) indicates the saturated adsorption capacity, b (L∙mg−1) is the Langmuir constant related to the adsorption free energy and Ce is the concentration at equilibrium [32,33,42,43]. The equations can be linearized and the parameters qmax, b, K and n are found by linear regression analysis:
C e q e = 1 b · q max + C e q max
log   q e = log   K + 1 n logC e
Table 1 summarizes different adsorption constants for linear plotting of the two models. As shown, the correlation coefficient R2 for BPA follows the Langmuir adsorption model. The constant n from the Freundlich model gives information on the adsorption capacity. In the case where n = 1, the adsorption is linear, but if n < 1 then the adsorption is governed by a chemical process, and finally if n > 1 then the adsorption is governed by a physical process [44]. In the case of BPA, n being inferior to 0 shows that the Freundlich model cannot be applied for adsorption of BPA by the GO membrane, which is in agreement with the literature [6]. Progesterone and norethisterone present a different adsorption process. They both have a higher linearity (R2) regarding the Freundlich model and different values of n. Progesterone has a n value < 1, suggesting that adsorption involves a chemical process. However, norethisterone has an n value higher than 1, indicating that this hormone exhibited favorable physisorption behavior on the GO foam.

4. Conclusions

In this paper, a magnetic graphene-based foam was prepared. The composite material is stable and presents a macroporous structure which helps adsorption of large molecules with a significant removal percentage, more than 80% for some contaminants. The membrane had better affinity with BPA and norethisterone compared to progesterone due to different interactions occurring between the Csp2 of graphene and the H-bonding of the different remaining oxygenated groups present on the graphene surface, which agrees with previous studies [45]. The magnetic properties of the developed GO–PEI–FeNPs foam could be leveraged to easily remove the membrane from the water using a simple magnet. Therefore, the GO-based membrane is a promising adsorbent for water treatment and could be used in the future to adsorb molecules with high molecular weight. Additionally, the fabrication process of such composite materials is extremely versatile and manageable in terms of size, shape and thickness.

Author Contributions

Conceptualization, J.N. and M.S.; methodology, J.N.; validation, J.N., M.S. and S.P.; formal analysis, J.N.; resources, M.S. and R.I.; data curation, J.N.; O.H. and G.C.J.; writing—original draft preparation, J.N.; writing—review and editing, M.S., S.P. and R.I.; supervision, M.S.; funding acquisition, M.S. and R.I. All authors have read and agreed to the published version of the manuscript.

Funding

This research was funded by the Natural Sciences and Engineering Research Council of Canada (NSERC), the Canada Research Chairs program (CRC) and the Canada Foundation for Innovation (CFI).

Acknowledgments

We thank the Natural Sciences and Engineering Research Council of Canada (NSERC), the Canada Research Chairs (CRC) program and the Canada Foundation for Innovation (CFI). The NanoQAM center at UQAM is gratefully acknowledged for all characterization experiments. We thank the Quebec Centre for Advanced Materials (QCAM).

Conflicts of Interest

The authors declare no conflict of interest.

References

  1. Newbold, R.R.; Hanson, R.B.; Jefferson, W.N.; Bullock, B.C.; Haseman, J.; McLachlan, J.A. Proliferative lesions and reproductive tract tumors in male descendants of mice exposed developmentally to diethylstilbestrol. Carcinogenesis 2000, 21, 1355–1363. [Google Scholar] [CrossRef] [PubMed]
  2. Couse, J.F.; Dixon, D.; Yates, M.; Moore, A.B.; Ma, L.; Maas, R.; Korach, K.S. Estrogen receptor-α knockout mice exhibit resistance to the developmental effects of neonatal diethylstilbestrol exposure on the female reproductive tract. Dev. Biol. 2001, 238, 224–238. [Google Scholar] [CrossRef] [PubMed] [Green Version]
  3. Newbold, R.R.; Padilla-Banks, E.; Jefferson, W.N. Adverse effects of the model environmental estrogen diethylstilbestrol are transmitted to subsequent generations. Endocrinology 2006, 147, s11–s17. [Google Scholar] [CrossRef] [PubMed]
  4. Pereira, G.F.; Andrade, L.S.; Rocha-Filho, R.C.; Bocchi, N.; Biaggio, S.R. Electrochemical determination of bisphenol A using a boron-doped diamond electrode. Electrochim. Acta 2012, 82, 3–8. [Google Scholar] [CrossRef]
  5. Yuan, C.; Chen, C.Y.; Hung, C.H. Electrochemical remediation of BPA in a soil matrix by Pd/Ti and RuO2/Ti electrodes. J. Appl. Electrochem. 2013, 43, 1163–1174. [Google Scholar] [CrossRef]
  6. Xu, J.; Wang, L.; Zhu, Y. Decontamination of bisphenol A from aqueous solution by graphene adsorption. Langmuir 2012, 28, 8418–8425. [Google Scholar] [CrossRef]
  7. Bautista-Toledo, I.; Ferro-García, M.A.; Rivera-Utrilla, J.; Moreno-Castilla, C.; Vegas Fernández, F.J. Bisphenol A removal from water by activated carbon. Effects of carbon characteristics and solution chemistry. Environ. Sci. Technol. 2005, 39, 6246–6250. [Google Scholar] [CrossRef]
  8. Wang, W.; Jiang, C.; Zhu, L.; Liang, N.; Liu, X.; Jia, J.; Zhang, C.; Zhai, S.; Zhang, B. Adsorption of bisphenol A to a carbon nanotube reduced its endocrine disrupting effect in mice male offspring. Int. J. Mol. Sci. 2014, 15, 15981–15993. [Google Scholar] [CrossRef] [Green Version]
  9. Geim, A.K.; Novoselov, K.S. The rise of graphene. Nat. Mater. 2007, 6, 183–191. [Google Scholar] [CrossRef]
  10. Stoller, M.D.; Park, S.; Zhu, Y.; An, J.; Ruoff, R.S. Graphene-based ultracapacitors. Nano Lett. 2008, 8, 3498–3502. [Google Scholar] [CrossRef]
  11. Balandin, A.A.; Ghosh, S.; Bao, W.; Calizo, I.; Teweldebrhan, D.; Miao, F.; Lau, C.N. Superior thermal conductivity of single-layer graphene. Nano Lett. 2008, 8, 902–907. [Google Scholar] [CrossRef] [PubMed]
  12. Lee, C.; Wei, X.; Kysar, J.W.; Hone, J. Measurement of the elastic properties and intrinsic strength of monolayer graphene. Science 2008, 321, 385–388. [Google Scholar] [CrossRef] [PubMed]
  13. Brodie, B.C. On the Atomic weight of graphite. Philos. Trans. R. Soc. Lond. 1859, 149, 249–259. [Google Scholar]
  14. Staudenmaier, L. Verfahren zur darstellung der graphitsäure. Ber. Dtsch. Chem. Ges. 1898, 31, 1481–1487. [Google Scholar] [CrossRef] [Green Version]
  15. Hummers, W.S.; Offeman, R.E. Preparation of graphitic Oxide. J. Am. Chem. Soc. 1958, 80, 1339. [Google Scholar] [CrossRef]
  16. Marcano, D.C.; Kosynkin, D.V.; Berlin, J.M.; Sinitskii, A.; Sun, Z.; Slesarev, A.; Alemany, L.B.; Lu, W.; Tour, J.M. Improved synthesis of graphene oxide. ACS Nano 2010, 4, 4806–4814. [Google Scholar] [CrossRef] [PubMed]
  17. Sui, Z.Y.; Cui, Y.; Zhu, J.H.; Han, B.H. Preparation of three-dimensional graphene oxide–polyethylenimine porous materials as dye and gas adsorbents. ACS Appl. Mater. Interfaces 2013, 5, 9172–9179. [Google Scholar] [CrossRef]
  18. Liang, J.; Huang, Y.; Zhang, L.; Wang, Y.; Ma, Y.; Guo, T.; Chen, Y. Molecular-level dispersion of graphene into poly(vinyl alcohol) and effective reinforcement of their nanocomposites. Adv. Funct. Mater. 2009, 19, 2297–2302. [Google Scholar] [CrossRef]
  19. Ramanathan, T.; Abdala, A.A.; Stankovich, S.; Dikin, D.A.; Herrera Alonso, M.; Piner, R.D.; Adamson, D.H.; Schniepp, H.C.; Chen, X.; Ruoff, R.S.; et al. Functionalized graphene sheets for polymer nanocomposites. Nat. Nano 2008, 3, 327–331. [Google Scholar] [CrossRef]
  20. Zhu, Y.; Cai, W.; Piner, R.D.; Velamakanni, A.; Ruoff, R.S. Transparent self-assembled films of reduced graphene oxide platelets. Appl. Phys. Lett. 2009, 95, 103104. [Google Scholar] [CrossRef] [Green Version]
  21. N’Diaye, J.; Poorahong, S.; Hmam, O.; Izquierdo, R.; Siaj, M. Facile synthesis rhodium nanoparticles decorated single layer graphene as an enhancement hydrogen peroxide sensor. J. Electroanal. Chem. 2017, 789, 85–91. [Google Scholar] [CrossRef]
  22. Wang, X.; Zhi, L.; Müllen, K. Transparent, conductive graphene electrodes for dye-sensitized solar cells. Nano Lett. 2008, 8, 323–327. [Google Scholar] [CrossRef] [PubMed]
  23. Watcharotone, S.; Dikin, D.A.; Stankovich, S.; Piner, R.; Jung, I.; Dommett, G.H.B.; Evmenenko, G.; Wu, S.E.; Chen, S.F.; Liu, C.P.; et al. Graphene−silica composite thin films as transparent conductors. Nano Lett. 2007, 7, 1888–1892. [Google Scholar] [CrossRef] [PubMed]
  24. Becerril, H.A.; Mao, J.; Liu, Z.; Stoltenberg, R.M.; Bao, Z.; Chen, Y. Evaluation of solution-processed reduced graphene oxide films as transparent conductors. ACS Nano 2008, 2, 463–470. [Google Scholar] [CrossRef] [PubMed]
  25. Chergui, S.; Rhili, K.; Poorahong, S.; Siaj, M. Graphene Oxide Membrane Immobilized Aptamer as a Highly Selective Hormone Removal. Membranes 2020, 10, 229. [Google Scholar] [CrossRef] [PubMed]
  26. Roy, S.; Soin, N.; Bajpai, R.; Misra, D.S.; McLaughlin, J.A.; Roy, S.S. Graphene oxide for electrochemical sensing applications. J. Mater. Chem. 2011, 21, 14725–14731. [Google Scholar] [CrossRef]
  27. Bi, H.; Xie, X.; Yin, K.; Zhou, Y.; Wan, S.; He, L.; Xu, F.; Banhart, F.; Sun, L.; Ruoff, R.S. Spongy graphene as a highly efficient and recyclable sorbent for oils and organic solvents. Adv. Funct. Mater. 2012, 22, 4421–4425. [Google Scholar] [CrossRef]
  28. Chabot, V.; Higgins, D.; Yu, A.; Xiao, X.; Chen, Z.; Zhang, J. A review of graphene and graphene oxide sponge: Material synthesis and applications to energy and the environment. Energy Environ. Sci. 2014, 7, 1564–1596. [Google Scholar] [CrossRef]
  29. Ladrón-de-Guevara, A.; Boscá, A.; Pedrós, J.; Climent-Pascual, E.; de Andrés, A.; Calle, F.; Martínez, J. Reduced graphene oxide/polyaniline electrochemical supercapacitors fabricated by laser. Appl. Surf. Sci. 2019, 467, 691–697. [Google Scholar] [CrossRef]
  30. Poorahong, S.; Harding, D.J.; Siaj, M. Hollow molybdenum oxide-graphene oxide spheres as a binder-free electrocatalyst membrane with enhanced hydrogen evolution efficiency. Mater. Lett. 2020, 272, 127872. [Google Scholar] [CrossRef]
  31. El maguana, Y.; Elhadiri, N.; Benchanaa, M.; Chikri, R. Activated carbon for dyes removal: Modeling and understanding the adsorption process. J. Chem. 2020, 2020, 2096834. [Google Scholar] [CrossRef]
  32. Elmorsi, T.M. Equilibrium isotherms and kinetic studies of removal of methylene blue dye by adsorption onto Miswak leaves as a natural adsorbent. J. Environ. Prot. 2011, 6, 11. [Google Scholar] [CrossRef] [Green Version]
  33. Ayawei, N.; Ebelegi, A.N.; Wankasi, D. Modelling and interpretation of adsorption isotherms. J. Chem. 2017, 2017, 3039817. [Google Scholar] [CrossRef]
  34. Yang, X.; Chen, C.; Li, J.; Zhao, G.; Ren, X.; Wang, X. Graphene oxide-iron oxide and reduced graphene oxide-iron oxide hybrid materials for the removal of organic and inorganic pollutants. RSC Adv. 2012, 2, 8821–8826. [Google Scholar] [CrossRef]
  35. Chen, B.; Yue, W.; Zhao, H.; Long, F.; Cao, Y.; Pan, X. Simultaneous capture of methyl orange and chromium(vi) from complex wastewater using polyethylenimine cation decorated magnetic carbon nanotubes as a recyclable adsorbent. RSC Adv. 2019, 9, 4722–4734. [Google Scholar] [CrossRef] [Green Version]
  36. Largitte, L.; Pasquier, R. A review of the kinetics adsorption models and their application to the adsorption of lead by an activated carbon. Chem. Eng. Res. Des. 2016, 109, 495–504. [Google Scholar] [CrossRef]
  37. Czikkely, M.; Neubauer, E.; Fekete, I.; Ymeri, P.; Fogarassy, C. Review of heavy metal adsorption processes by several organic matters from wastewaters. Water 2018, 10, 1377. [Google Scholar] [CrossRef] [Green Version]
  38. Wu, T.; Chen, M.; Zhang, L.; Xu, X.; Liu, Y.; Yan, J.; Wang, W.; Gao, J. Three-dimensional graphene-based aerogels prepared by a self-assembly process and its excellent catalytic and absorbing performance. J. Mater. Chem. A 2013, 1, 7612–7621. [Google Scholar] [CrossRef]
  39. Eissa, S.; N’diaye, J.; Brisebois, P.; Izquierdo, R.; Tavares, A.C.; Siaj, M. Probing the influence of graphene oxide sheets size on the performance of label-free electrochemical biosensors. Sci. Rep. 2020, 10, 13612. [Google Scholar] [CrossRef]
  40. Zhao, Z.; Wang, X.; Qiu, J.; Lin, J.; Xu, D.; Zhang, C.; Lv, M.; Yang, X. Three-dimensional graphene-based hydrogel/aerogel materials. Rev. Adv. Mater. Sci. 2014, 36, 137–151. [Google Scholar]
  41. Cui, P.; Lee, J.; Hwang, E.; Lee, H. One-pot reduction of graphene oxide at subzero temperatures. Chem. Commun. 2011, 47, 12370–12372. [Google Scholar] [CrossRef] [PubMed]
  42. Freundlich, H. Ueber die Adsorption in Loesungen; Engelmann: Leipzig, Germany, 1906. [Google Scholar]
  43. Ahalya, N.; Kanamadi, R.D.; Ramachandra, T.V. Biosorption of chromium (VI) from aqueous solutions by the husk of Bengal gram (Cicer arientinum). Electron. J. Biotechnol. 2005, 8, 258–264. [Google Scholar] [CrossRef] [Green Version]
  44. Desta, M.B. Batch sorption experiments: Langmuir and freundlich isotherm studies for the adsorption of textile metal ions onto teff straw (Eragrostis tef) agricultural waste. J. Thermodyn. 2013, 2013, 6. [Google Scholar] [CrossRef] [Green Version]
  45. Baig, N.; Sajid, M.; Saleh, T.A. Graphene-based adsorbents for the removal of toxic organic pollutants: A review. J. Environ. Manag. 2019, 244, 370–382. [Google Scholar] [CrossRef] [PubMed]
Figure 1. Digital images of the composite foam (a) and the foam in the contact with an external magnet (b). SEM images at different magnifications (c,d).
Membranes 10 00340 g001
Figure 2. Raman spectra (a) and ATR–FTIR (b) of GO, GO–PEI and GO–PEI–iron nanoparticles (FeNPs).
Membranes 10 00340 g002
Figure 3. XPS of survey spectrums of the GO and GO–PEI–FeNPs foams (a). High-resolution spectrums of C1s (b,d) and O1s before and after functionalization with PEI (c).
Membranes 10 00340 g003
Figure 4. XRD diffractogram of (a) GO, (b) metallic iron, (c) GO–PEI and (d) GO–PEI–FeNPs.
Membranes 10 00340 g004
Figure 5. Effect of incubation time on the removal percentage of (a) bisphenol A (BPA), (b) progesterone and (c) norethisterone.
Membranes 10 00340 g005
Figure 6. Linear regression plots of (a) Langmuir and (b) Freundlich adsorption models for BPA, progesterone and norethisterone. Inset of panel (a) is the Langmuir linear regression plot of norethisterone.
Membranes 10 00340 g006
Table 1. Isotherm parameters for adsorption of BPA, progesterone and norethisterone by the GO–PEI–FeNPs composite.
Adsorption Model/AnalyteLangmuirFreundlich
bqmaxR2nKR2
(L∙mg−1)(mg∙g−1)
BPA0.136.610.93−12.430.50.92
Progesterone−0.13−0.010.820.401396.40.98
Norethisterone1.560.210.491.356.30.83
Publisher’s Note: MDPI stays neutral with regard to jurisdictional claims in published maps and institutional affiliations.

