Article

Performance Evaluation and Kinetic Analysis of Photocatalytic Membrane Reactor in Wastewater Treatment

by
Zeyad Zeitoun
1,
Ahmed H. El-Shazly
1,2,
Shaaban Nosier
1,
Mohamed R. Elmarghany
3,4,*,
Mohamed S. Salem
3,4 and
Mahmoud M. Taha
1,5,*
1
Chemical Engineering Department, Faculty of Engineering, Alexandria University, Alexandria 11432, Egypt
2
Chemical and Petrochemical Engineering Department, Egypt-Japan University of Science and Technology (E-Just), New Borg El-Arab City, Alexandria 21934, Egypt
3
Mechanical Power Engineering Department, Faculty of Engineering, Mansoura University, Mansoura 35516, Egypt
4
Mansoura University Nanotechnology Center, Mansoura University, Mansoura 35516, Egypt
5
Environmental Engineering Department, University of Science and Technology, Zewail City of Science and Technology, October Gardens, Giza 12578, Egypt
*
Authors to whom correspondence should be addressed.
Membranes 2020, 10(10), 276; https://doi.org/10.3390/membranes10100276
Submission received: 3 September 2020 / Revised: 4 October 2020 / Accepted: 6 October 2020 / Published: 8 October 2020

Abstract

:
The objectives of the current study are to assess and compare the performance of a developed photocatalytic membrane reactor (PMR) in treating industrial waste (e.g., organic dye waste) against membrane distillation. The current PMR is composed of a feed tank, which is a continuous stirred photocatalytic reactor containing slurry Titanium dioxide (TiO2) particles that are activated by using ultraviolet lamp irradiation at a wavelength of 365 nm, and a poly-vinylidene flouride (PVDF) membrane cell. The experimental setup was designed in a flexible way to enable both separate and integrated investigations of the photocatalytic reactor and the membrane, separately and simultaneously. The experimental work was divided into two phases. Firstly, the PVDF membrane was fabricated and characterized to examine its morphology, surface charge, and hydrophobicity by using a scanning electron microscope, surface zeta potential, and contact angle tests, respectively. Secondly, the effects of using different concentrations of the TiO2 photocatalyst and feed (e.g., dye concentration) were examined. It is found that the PMR can achieve almost 100% dye removal and pure permeate is obtained at certain conditions. Additionally, a kinetic analysis was performed and revealed that the photocatalytic degradation of dye follows a pseudo-first-order reaction.

Graphical Abstract

1. Introduction

The textile industry is one of the largest sources yielding tons of waste dyeing effluents that, even at low concentrations, reduce wastewater transparency, oxygen solubility, and are generally toxic [1,2]. Therefore, significant attention was directed to investigate different approaches for waste treatment before being discharged to the environment to meet the limitations imposed by legislation [3]. Over the years, wastewater treatment methods have advanced beyond conventional methods (i.e., coagulation, filtration, adsorption, etc.) to overcome the complexity and diversity of pollutants existing in domestic, industrial, and agro-industrial waste-streams and to provide clean drinking water to confront the population growth and water scarcity issues.
For instance, thermally-driven membrane processes have shown notable capabilities in removing different contaminants existing in wastewater [4]. Although there are four main configurations used for membrane distillation (MD) [5,6], as shown in Figure 1, the direct contact membrane distillation (DCMD) configuration [7] is the most widely used due to its simplicity and ease of application. Moreover, the performance of different membrane fabrication materials was investigated, and it was found that polyvinylidene fluoride (PVDF), as a material for membrane fabrication, is a promising one due to its good film-forming ability, thermal stability, high mechanical strength, and excellent chemical and aging resistance [8]. However, adopting MD for wastewater management was hindered due to some limitations; such as membrane fouling, wetting, high level of feed pretreatment requirements, and inability of some membranes to remove microcontaminants [9].
Another promising method of wastewater treatment is photocatalysis. In general, photocatalysis has gained considerable attention in wastewater treatment in recent years owing to its ability to completely oxidize and mineralize organic pollutants. Several studies investigated using different photocatalytic substances such as (TiO2, ZnO2, CeO2, ZrO2, WO3, V2O5, Fe2O3, etc.) and sulfides (CdS, ZnS, etc.). A detailed explanation of the mechanism of organic pollutants removal by photocatalysis can be found elsewhere [10,11,12,13,14]. From these studies, it is revealed that, titanium dioxide (TiO2) has several advantages over other photocatalysts such as (i) mechanical and chemical stability (meaning that it retains its characteristics and composition with time and at normal operating temperatures), (ii) non-poisonous and non-toxic properties, (iii) the ability to be used under visible light not only the UV-light, (iv) super-hydrophilicity, and (v) commercial availability [15]. However, this method (photocatalysis) also suffers from difficulties, especially in photocatalyst recovery.
The limitations accompanied by membrane separation processes and photocatalytic degradation of contaminants can be solved by coupling both methods to form a hybrid system named photocatalytic membrane reactors (PMRs). The performance of different PMRs combinations in terms of fabrication materials of membranes and photocatalysts have been assessed in the open literature [14,16,17]. It was found that an integrated system of polyvinylidene fluoride (PVDF) membrane along with TiO 2 photocatalyst seems to be a promising solution for wastewater treatment owing to the previously mentioned advantages of the PVDF as well as photocatalysis by using TiO 2 .
The performance of this integrated system (i.e., PVDF and TiO 2 ) have been examined under different conditions in previous studies in the open literature as listed in Table 1. As shown in Table 1, several methods were used to fabricate membranes. Although each method has its procedures and product properties [18], the electrospinning technique was adopted in the current study owing to its capabilities of obtaining a highly porous membrane and consequently high fluxes [19]. The PMRs configurations examined in the literature are divided into (i) slurry reactors with photocatalysts suspended in a feed solution and (ii) photocatalyst-supported membranes. Grzechulska et al. [20] compared the performance of both configurations and showed that the first configuration is more efficient than the second one. Thus, this configuration (a slurry reactor with photocatalysts suspended in a feed solution) was also adopted in the current study.
The objectives of the current study are to design and develop a flexible hybrid PMRs system to investigate the potential use of PMRs for wastewater treatment (i.e., degradation of organic dyes “methylene blue—MB”) and compare its performance against conventional membrane distillation (MD). Additionally, kinetic analysis of photodegradation of MB by TiO 2 without MD is also carried out.

2. Materials and Methods

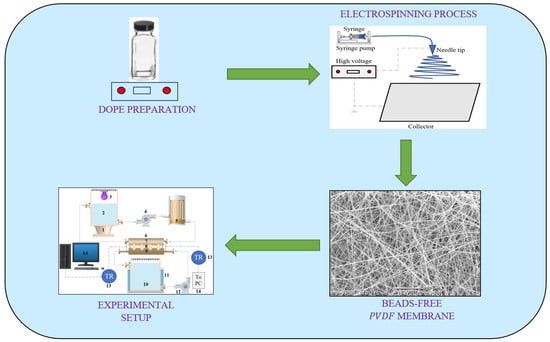
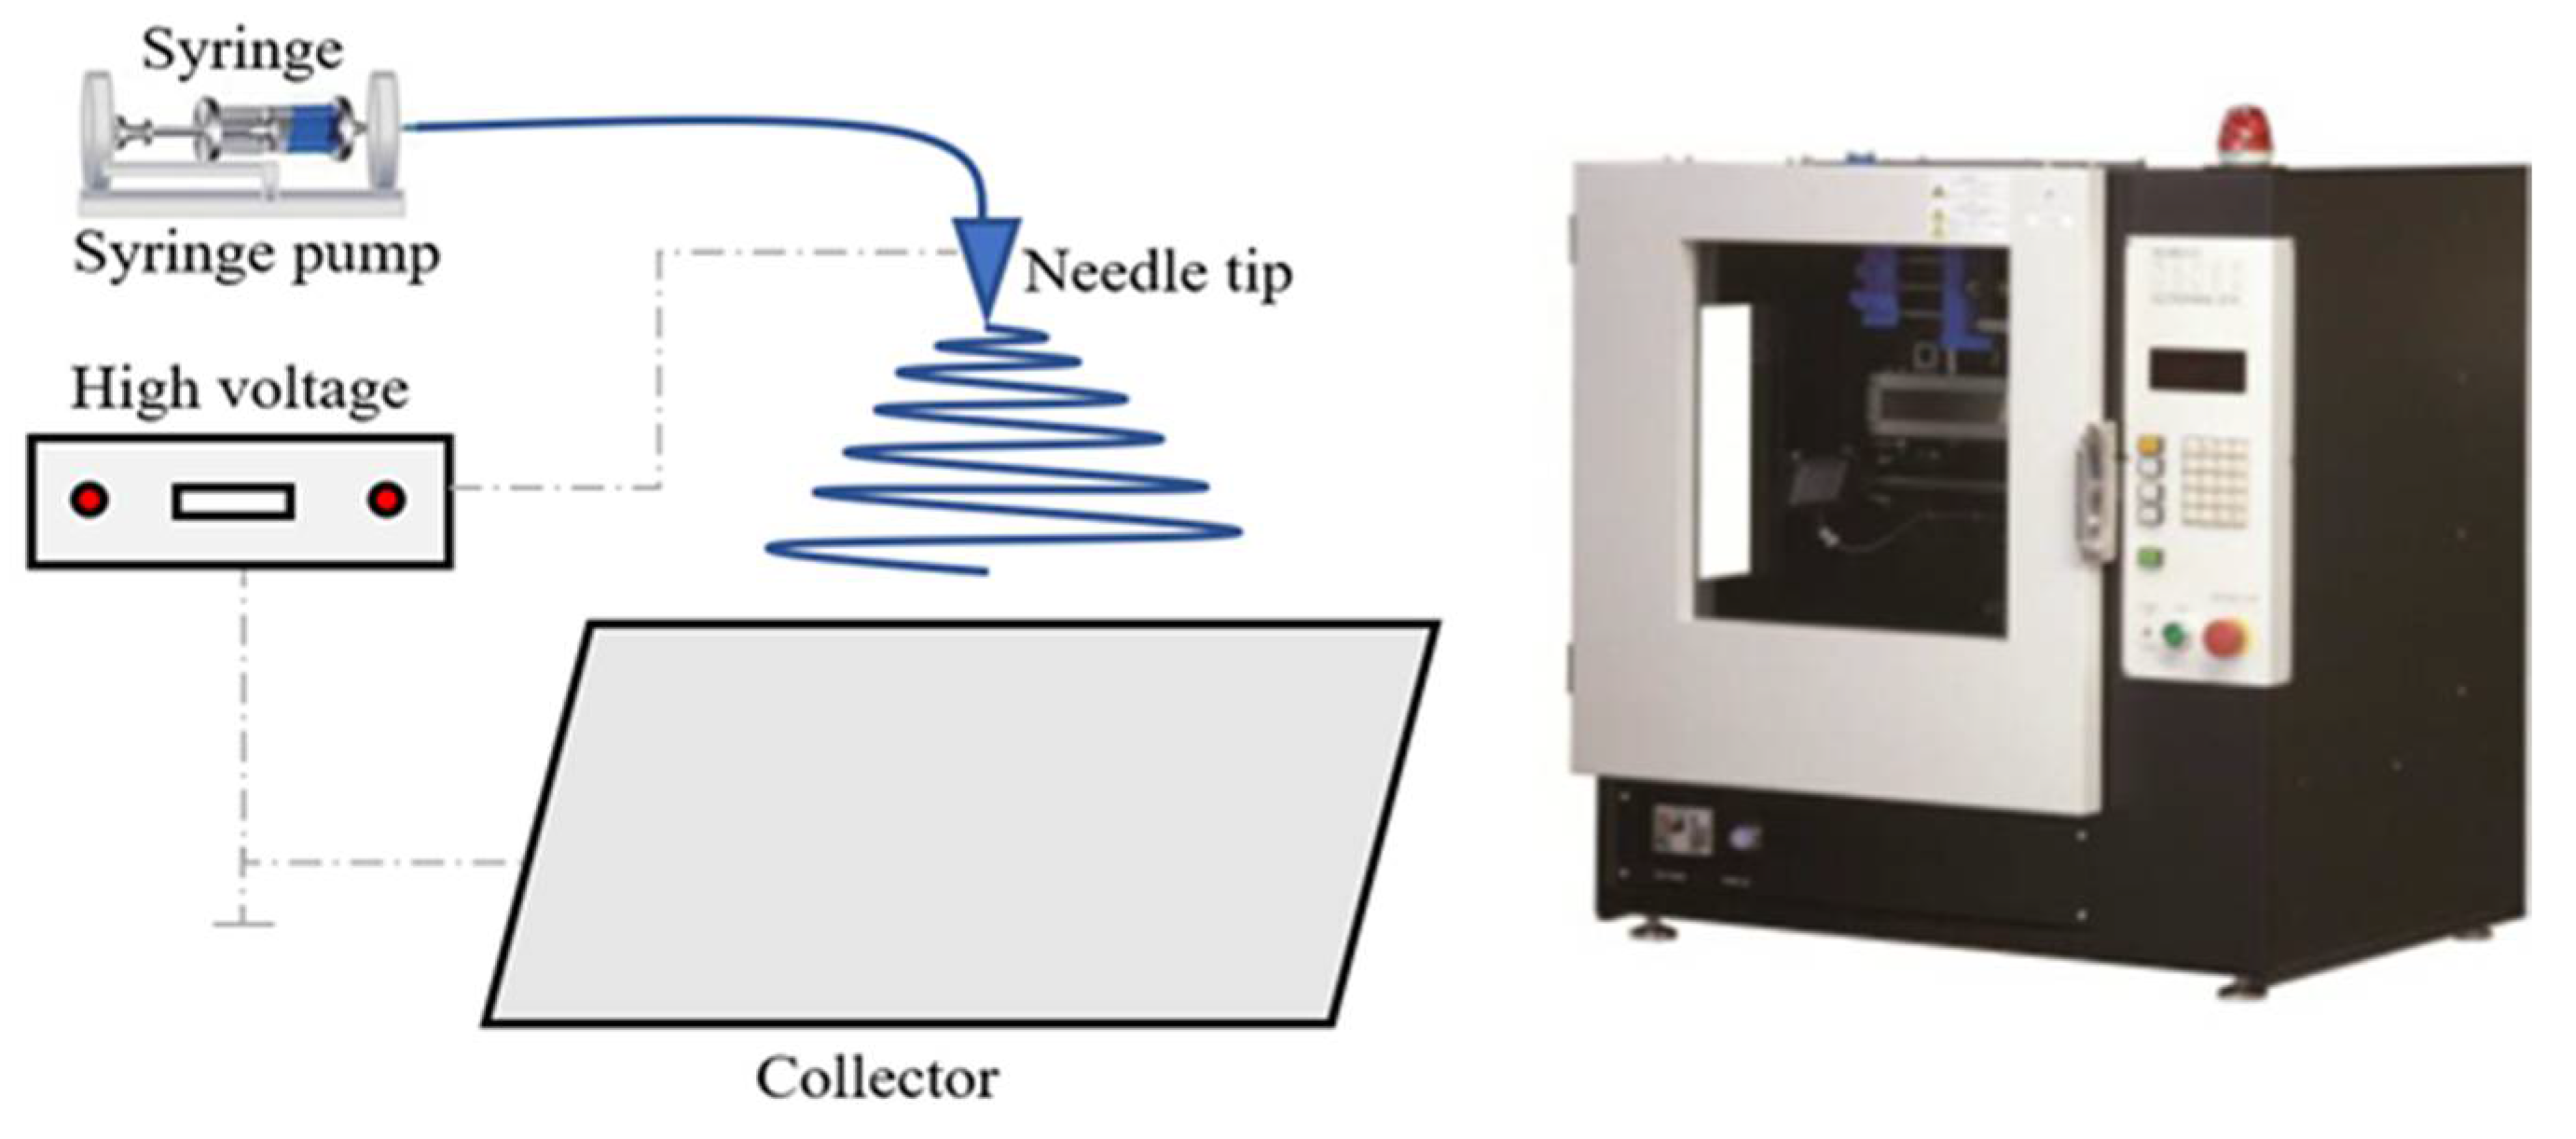
2.1. Membrane Fabrication

Raw PVDF pellets ( ρ = 1.78 g / cm 3 , average Mw ~275,000 g/mol), purchased from Sigma Aldrich, St. Louis, MO, USA, were allowed to form a homogeneous solution of 16   wt % PVDF and 84   wt % mixture of N-Dimethyl acetamide (DMAc) and acetone ( 20   vol % DMAc, 80   vol % acetone) after 12 h of continuous magnetic stirring of solution components at 90 °C. Stirring is directly followed by the electrospinning process (shown in Figure 2) to preserve solution homogeneity and not to affect the membrane morphology. The electrospinning voltage is set at 20   kV , the solution was pumped at a flow rate of 1   mm / h , spinneret speed (needle speed) is 100   mm / s , cleaning frequency and interval are 15   min and 1   s , respectively. Spinning distance, the distance traveled by the needle in one direction, is 15   cm . These electrospinning conditions are listed in Table 2; afterward, the prepared membranes were put in an oven at 60 °C for 24   h to remove the solvents residuals. Finally, this fabricated membrane was fully characterized to ensure free-beads fibers and to test its morphology, surface charge, and hydrophobicity. Characterization includes SEM, surface zeta potential, and contact angle measurements.

2.2. Membrane Characterization and Analysis

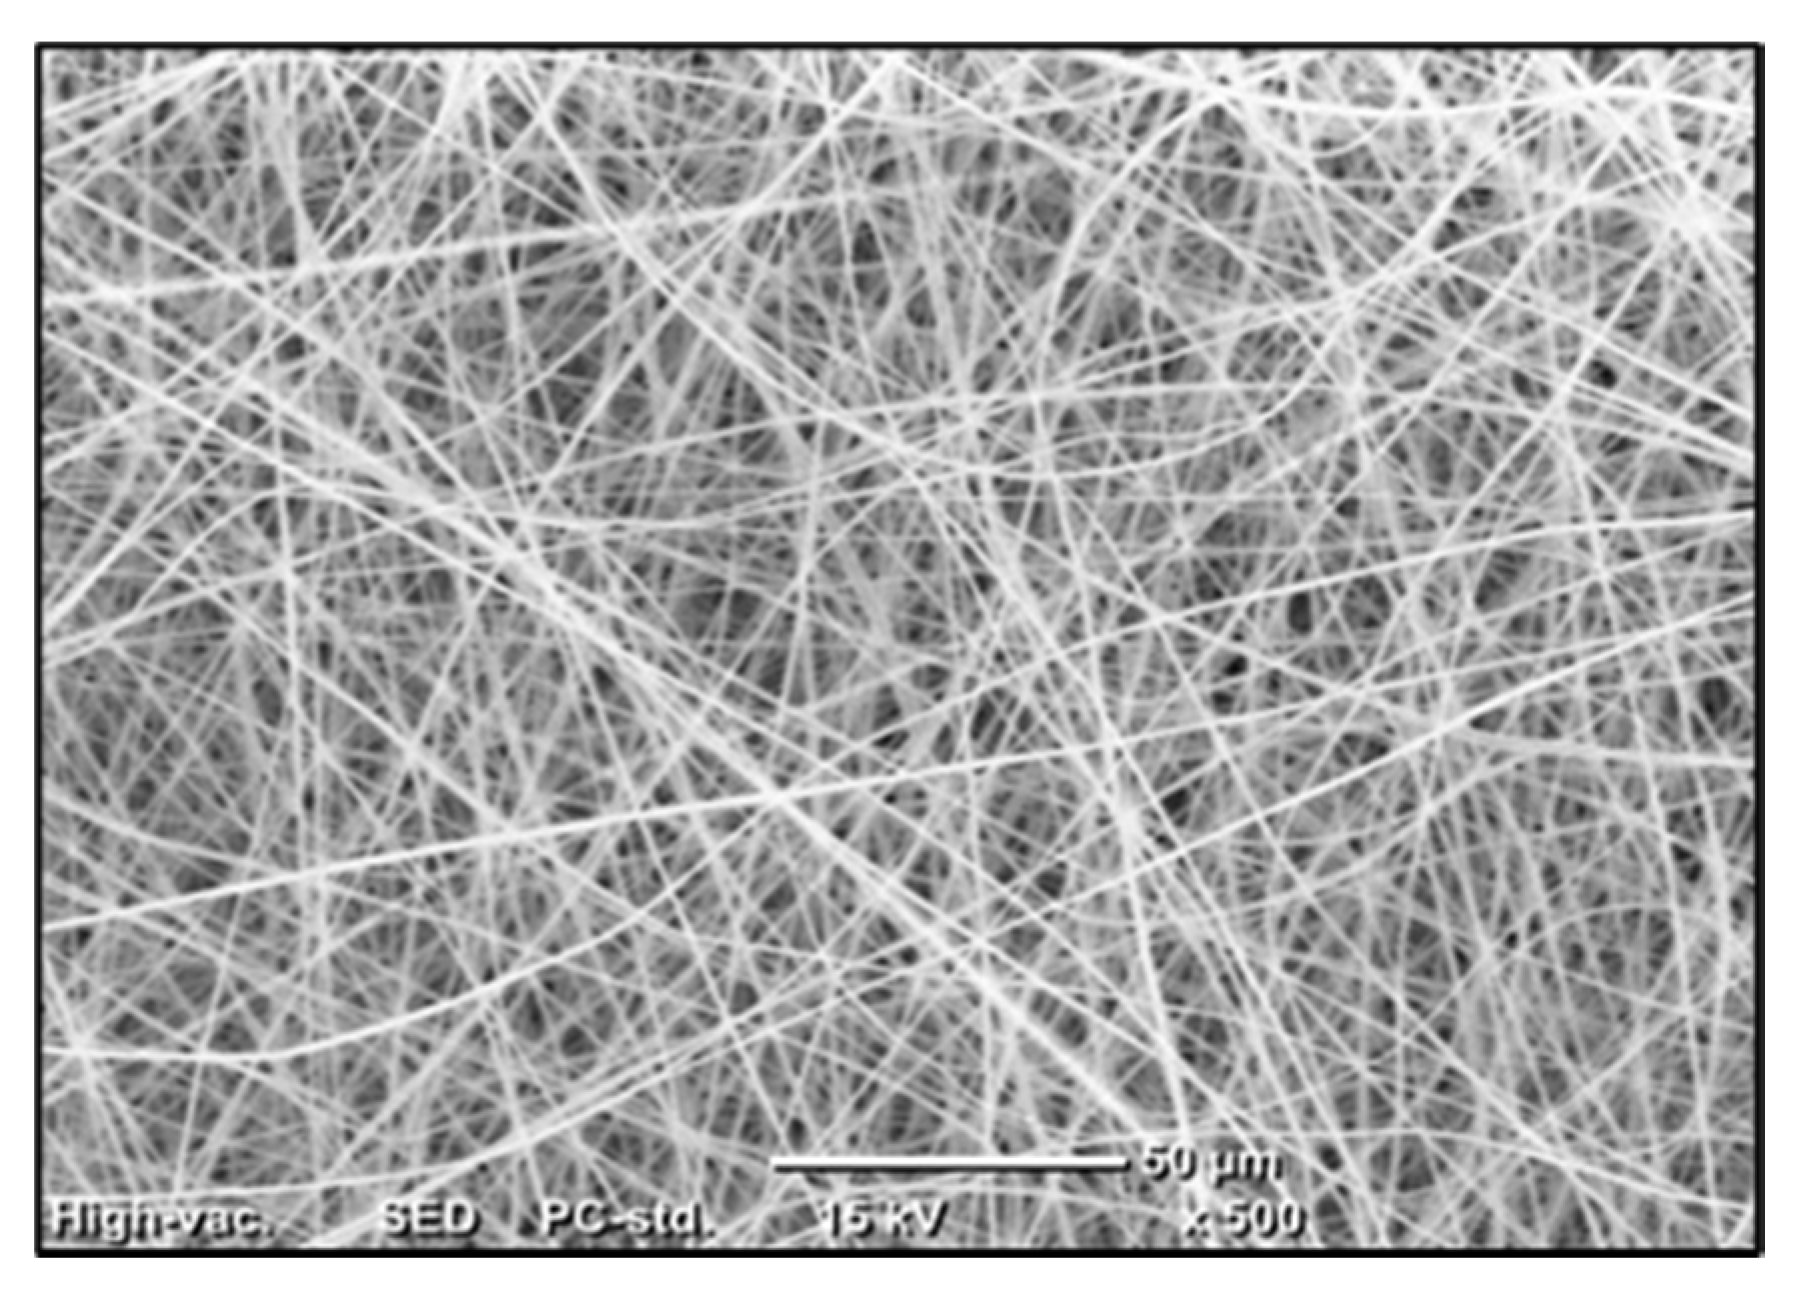
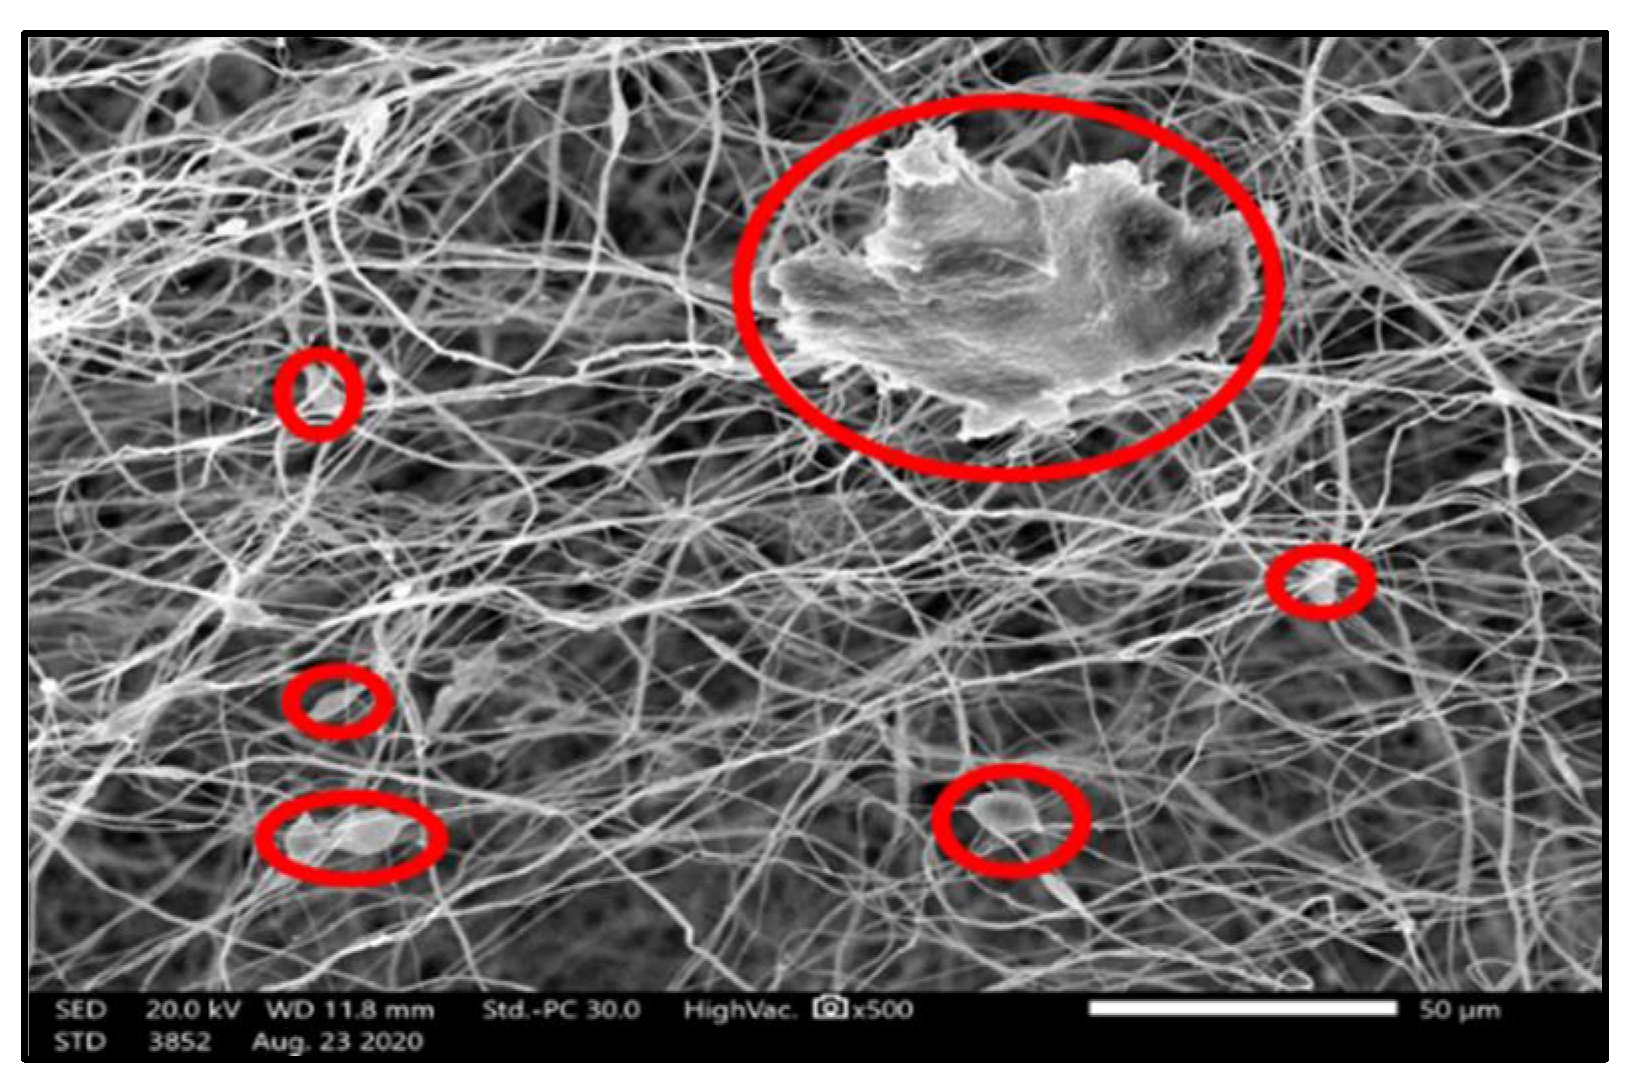
2.2.1. Membrane Morphology

Membrane morphology was examined using a Scanning Electron Microscopy “SEM” (JEOL JSM-6010LV), Figure 3 shows a randomly aligned intercrossing fiber network with uniform fiber diameter distribution throughout the structure which reveals the consistency of the electrospinning adopted conditions [34].

2.2.2. Surface Zeta Potential

Streaming current method using an electro-kinetic analyzer (Surpass Anton Paar, Saint Laurent, Austria) was conducted to measure the PVDF membrane surface zeta potential. The membrane sample was cut into 0.2   cm   ×   0.1   cm pieces and then immobilized on an adjustable gap cell. Determination of zeta potential was carried out by KCl solution ( 1.0   mmol / L ) and other prepared solutions were utilized to study the effect of solution pH on the charge density of the membrane surface. Adjusting the pH value was done by hydrochloric acid ( HCl ) and potassium hydroxide ( KOH ). Visolab for Surpass performed the necessary calculations. Figure 4 shows that the membrane’s surface is negatively charged in the range of 5   to   45   mV at pH values from 4 to 10 .

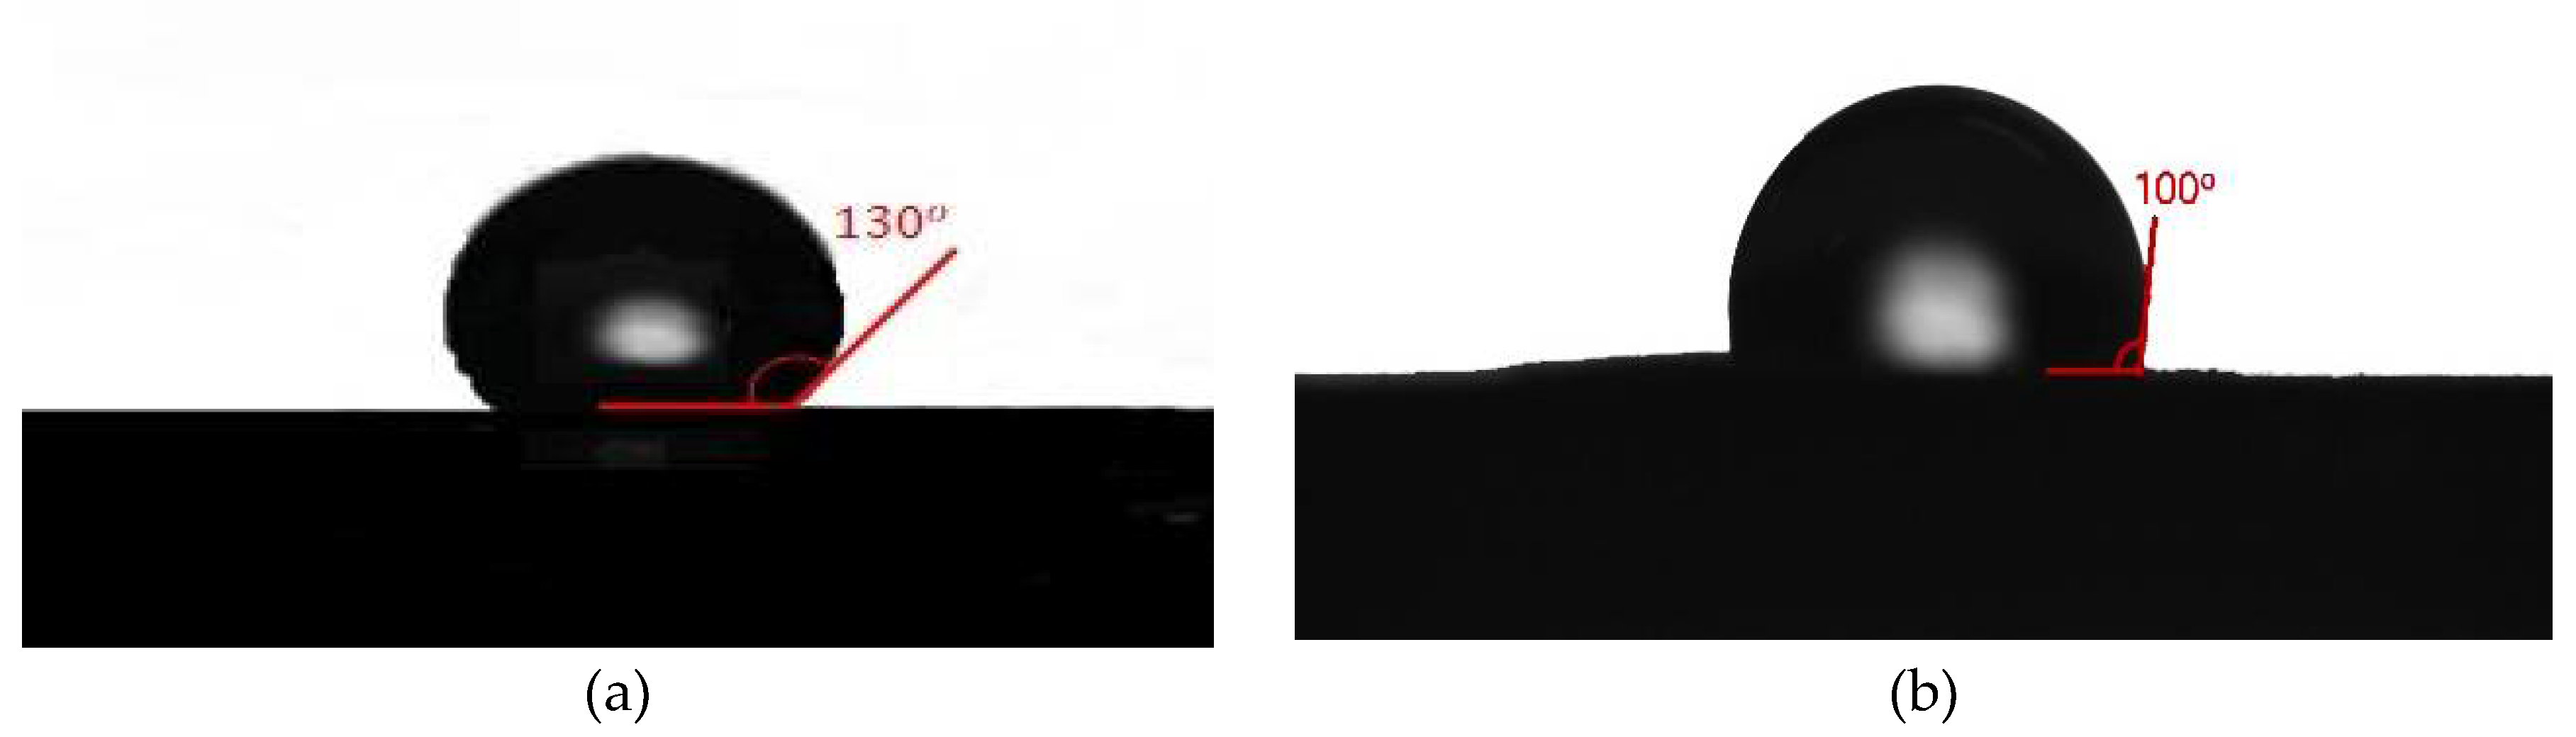
2.2.3. Membrane Contact Angle

Hydrophobicity of the membrane was analyzed by the water contact angle test (Theta Lite, Biolin Scientific, Sweden) [35]. In this test, the contact angle between the membrane sample and methylene blue droplet was measured and compared to the previously measured contact angle between the membrane sample and water droplet [36], as shown in Figure 5 and Figure 6. The contact angle between the PVDF membrane and water drop phase is equal to ( 130 ο ) while that between methylene blue drop phase and PVDF membrane is equal to ( 100 ο ). This test proves that the hydrophobicity of the membrane decreased when using methylene blue solution instead of pure water and this will have a significant effect on the purification of water as a consequence of the prevention of dye passage through the membrane [37].

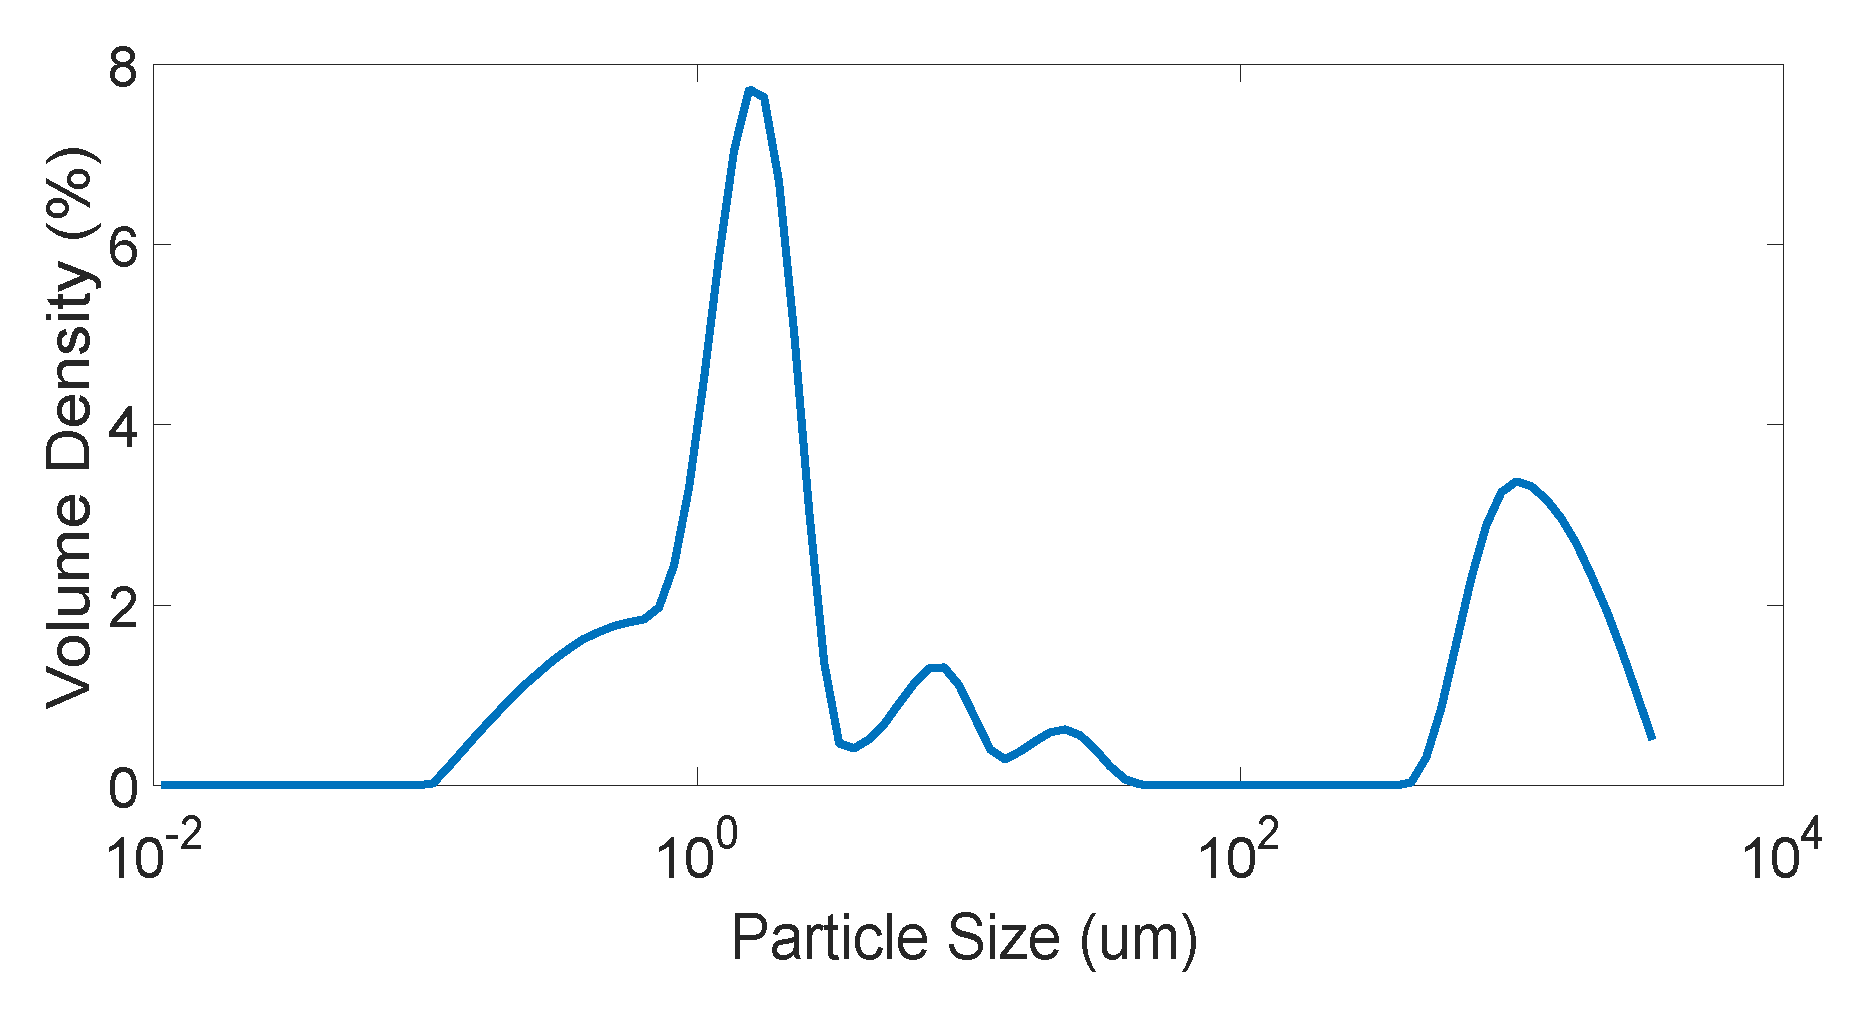
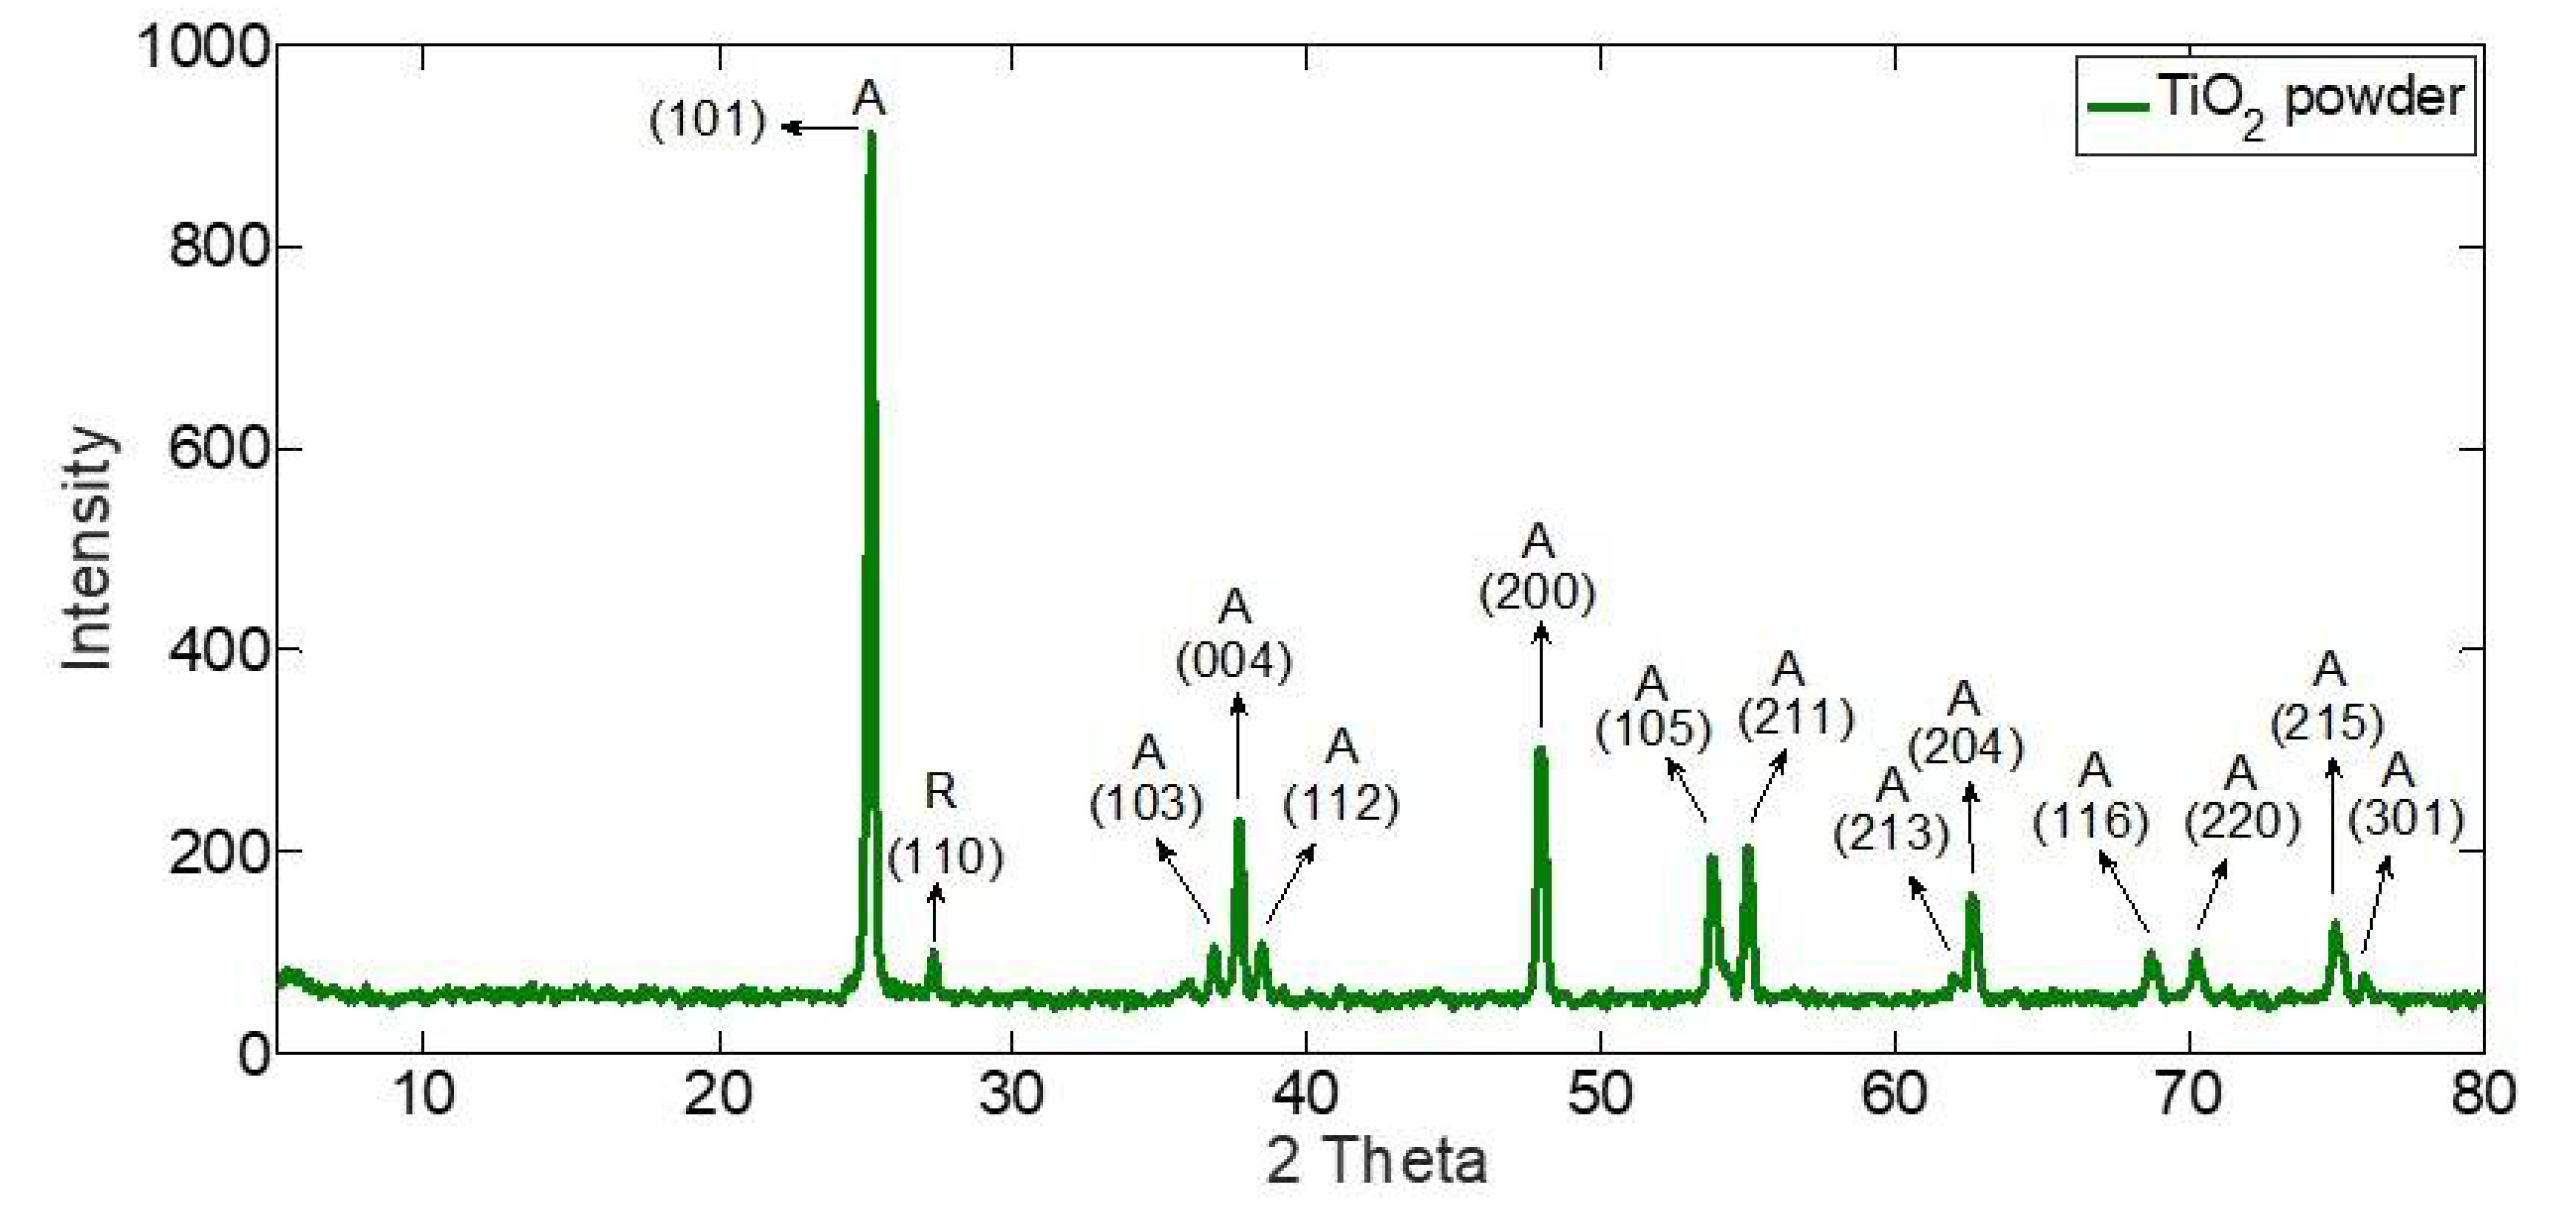
2.3. TiO2 Characterization and Analysis

High quality Anatase ( 99 % ) TiO 2 was purchased from Sigma Aldrich, USA. The particle size and phases existing were examined by implementing particle size distribution and XRD analysis, respectively. Particle size distribution was determined by using N 5 submicron particle size analyzer, BeckMan Coulter, with using water as the diluent. Analysis of the particle size distribution, shown in Figure 7, shows that the mean particle size lies between 1 and 4 µ m with a small number of large particles greater than 400   µ m .
Figure 8 shows the X-Ray Diffraction (Shimadzu XRD-6100) results. It is revealed that the strongest peaks are at 2 θ equals 25.4174 ˚ , 37.9077 ˚ , and 48.1766 ˚ corresponding to the miller indices ( 101 ) , ( 004 ) , and ( 200 ) , respectively. The values of the detected diffraction angles in this study are quantitively consistent with the findings of previous studies [38,39] as well all other peaks are in good agreement with the standard spectrum (JCPDS no.: 88-1175 and 84-1286) [39]. Therefore, it is confirmed that the TiO 2 used is mainly in the anatase (A) phase ( 99 % ) with traces of rutile (R) [40].

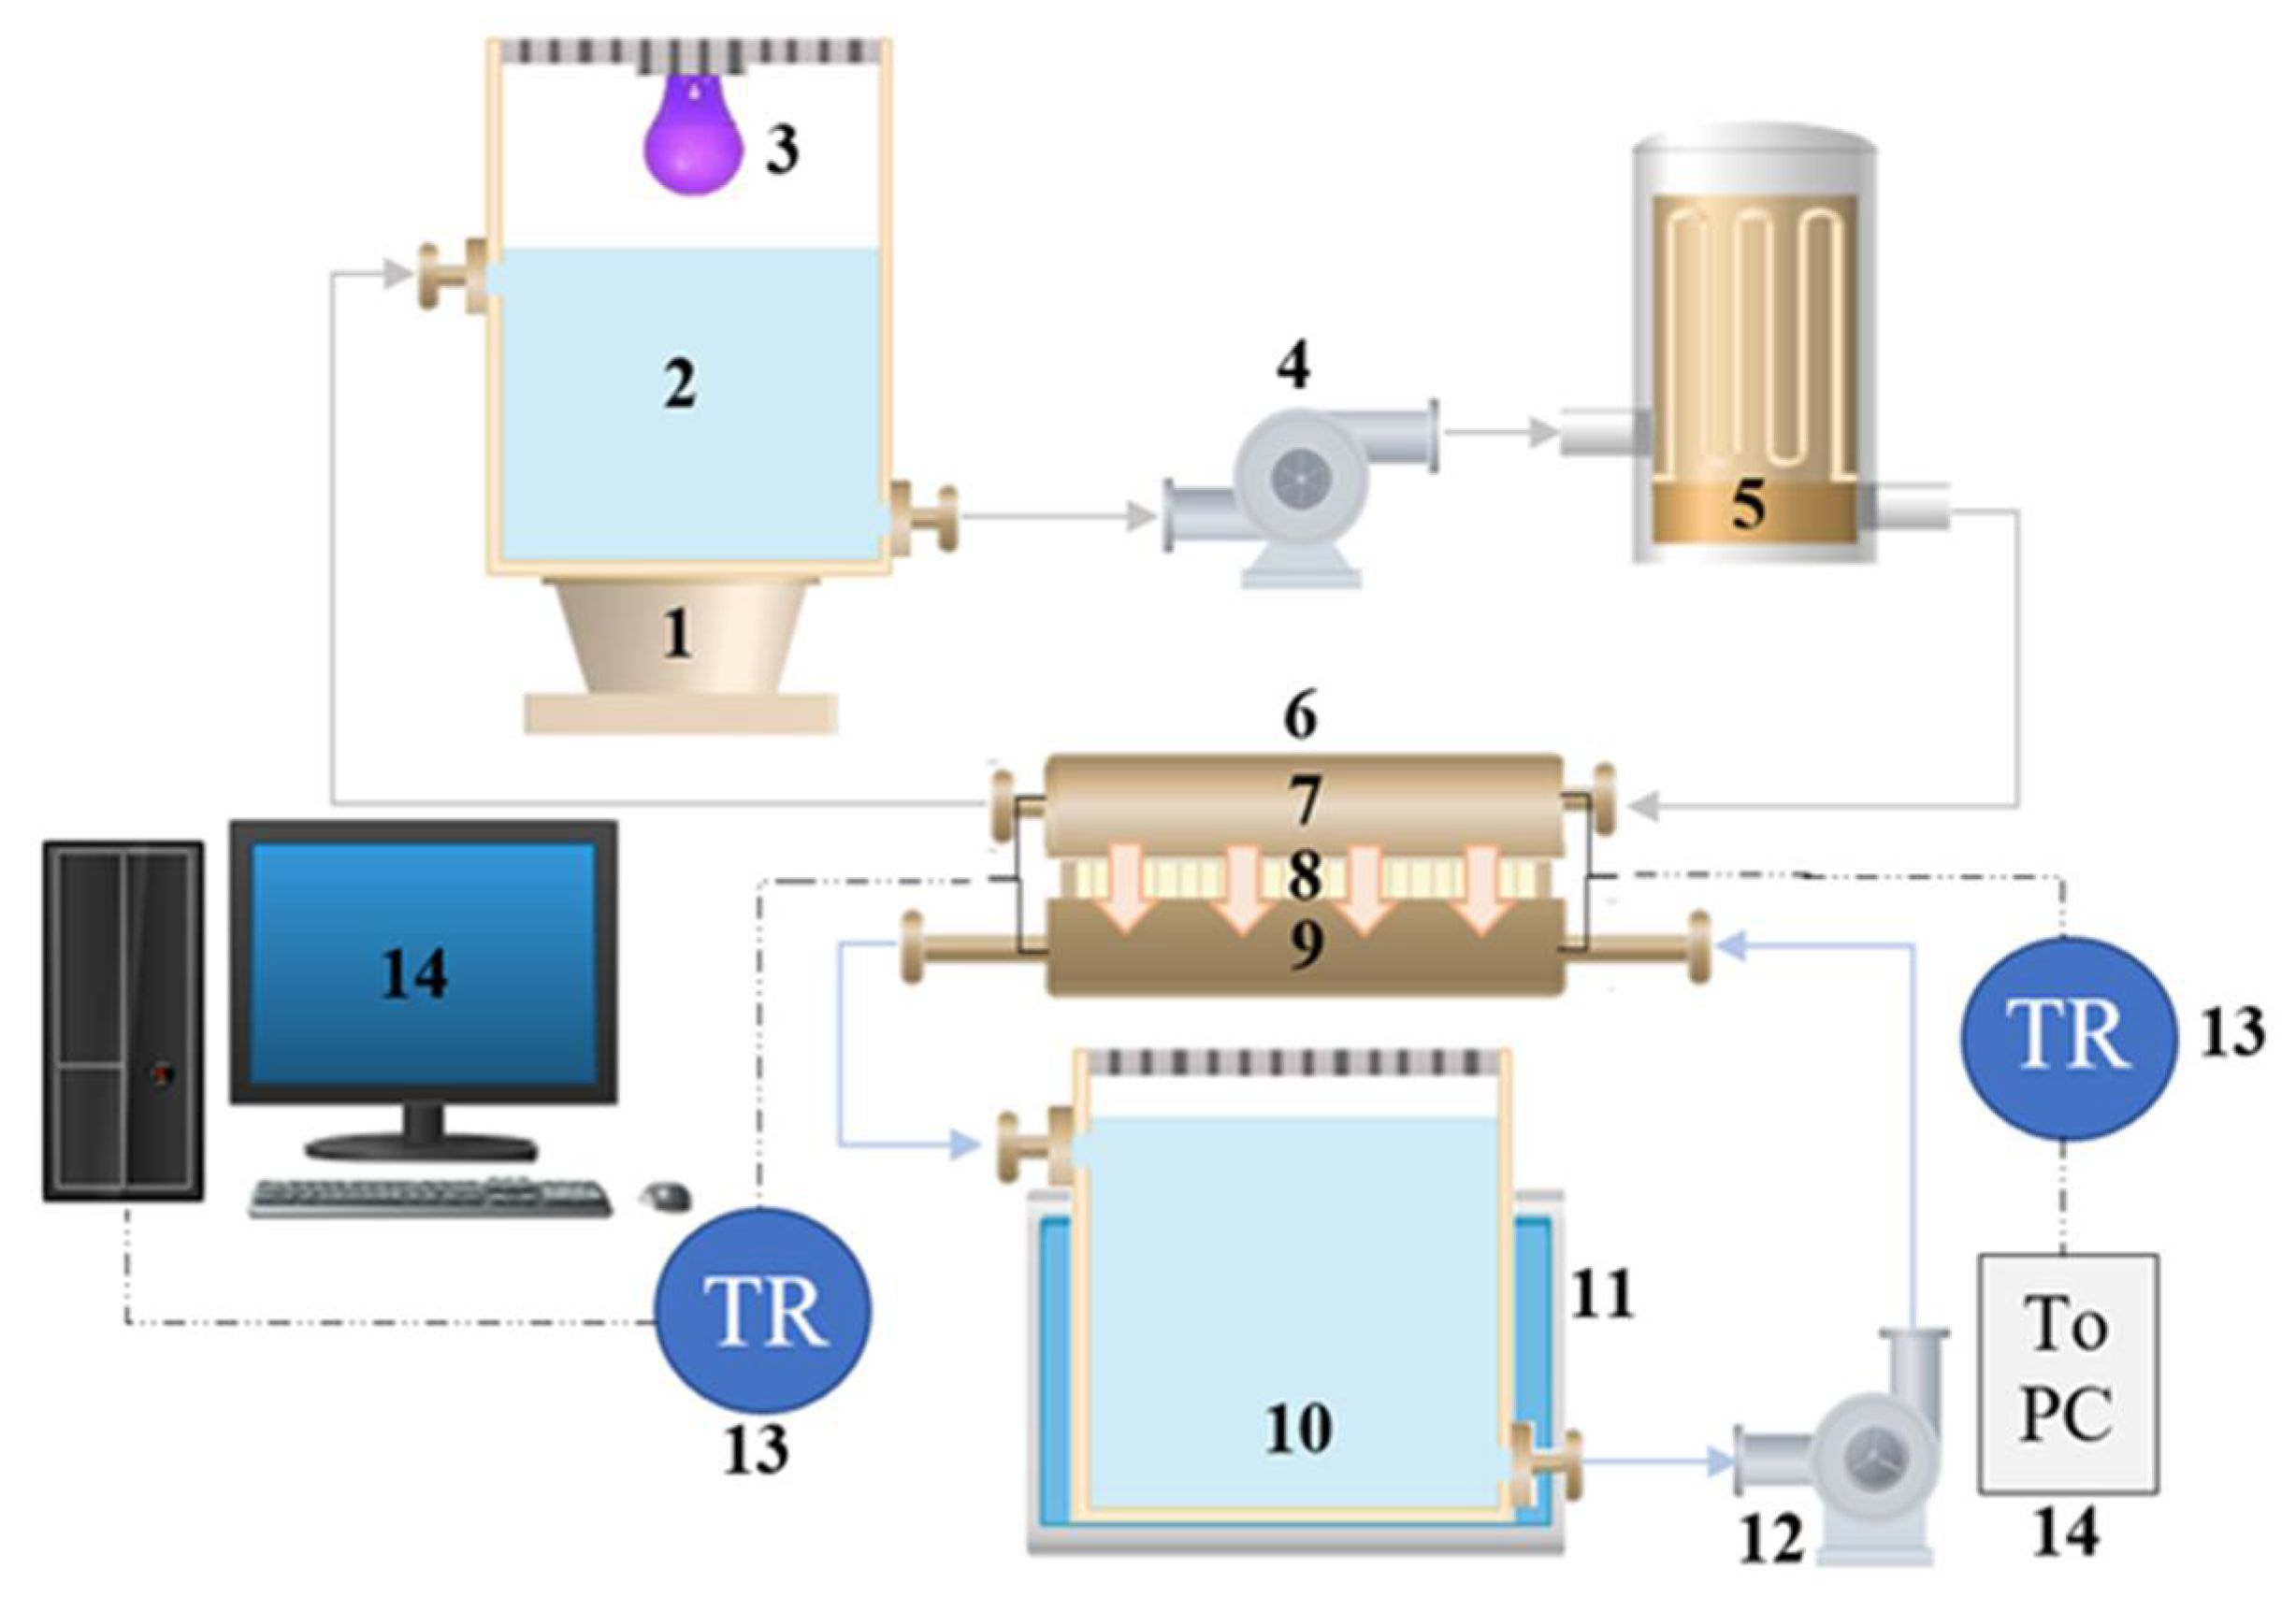
2.4. Experimental Setup

The photocatalytic membrane reactor (PMR) utilized in the current study, shown in Figure 9, consists of a direct contact membrane distillation (DCMD) cell and a photocatalytic reactor with TiO 2 nanoparticles as a slurry in the feed tank. The membrane cell consists of two compartments separated by the poly-vinylidene flouride (PVDF) membrane. The temperature difference across the membrane is achieved by introducing cold deionized water into the lower compartment of the membrane where it is combined with condensed vapors passing through the membrane from the upper compartment and is subsequently collected in a permeate tank. The feed tank contains TiO 2 nanoparticles kept suspended within the dye (i.e., methylene blue) by using a magnetic stirrer. The TiO 2 nanoparticles are activated by UV-lamp irradiation at a wavelength of 365   nm . Before entering the membrane cell, the feed solution is introduced, by using a micro-pump (Micropump L20561 A-Mount Suction Shoe Pump Head; Cole-Parmer, Vernon Hills, IL, USA), into a copper coil immersed into a water bath heater to raise the feed temperature to 55 °C for membrane distillation. Afterward, the feed solution is fed to the upper compartment of the membrane cell counter-currently to the permeate stream. The concentrate stream, leaving the upper compartment of the membrane cell, is recirculated to the feed tank. It is worthy of mention that, inlet and outlet temperatures of membrane cell streams (i.e., inlet streams are feed and deionized water; outlet streams are the permeate and concentrate) were measured by using thermocouples (K-type, ±2.2 °C or ±0.75%) to keep temperature difference fixed throughout the experiments. The system was designed and constructed in a flexible way to enable both separate and integrated investigations of the membrane and the photocatalytic reactor, separately and simultaneously, to end up with a comparison between the performance of the MD and the integrated PMR.

2.5. Experimental Procedures

Each experiment starts with mixing and dissolving a predetermined amount of dye (i.e., methylene blue “MB”) into distilled water in the stirred feed tank to prepare the desired dye solution concentration. Dye dispersion is maintained by using sonication. Meanwhile, the water bath heater is turned on to increase bath temperature to 70 °C. Preliminary experiments have shown that this bath temperature (70 °C) is sufficient to increase feed solution temperature to 55 °C before entering the DCMD cell. Afterward, the feed pump is turned on to allow the circulation of feed solution through the experimental setup (i.e., feed tank, water bath heater, and DCMD cell). Each experiment lasts for 4 h and 2   mL samples from permeate and concentrate streams were withdrawn every 30 min . The weight and concentration of the permeate were measured and recorded during each sample. Additionally, the feed concentration was determined to analyze the effect of TiO 2 on MB degradation.
As mentioned earlier, the experimental setup was designed in a flexible way to enable both separate and integrated experiments. Thus, in the current study, the performance of membrane distillation and integrated photocatalytic membrane reactor was evaluated for different dye and TiO 2 concentrations. The examined dye concentrations range from 4 to 15 ppm while the TiO 2 concentrations range from 0.0 to 0.3   g / L .

2.6. Data Representation and Analysis

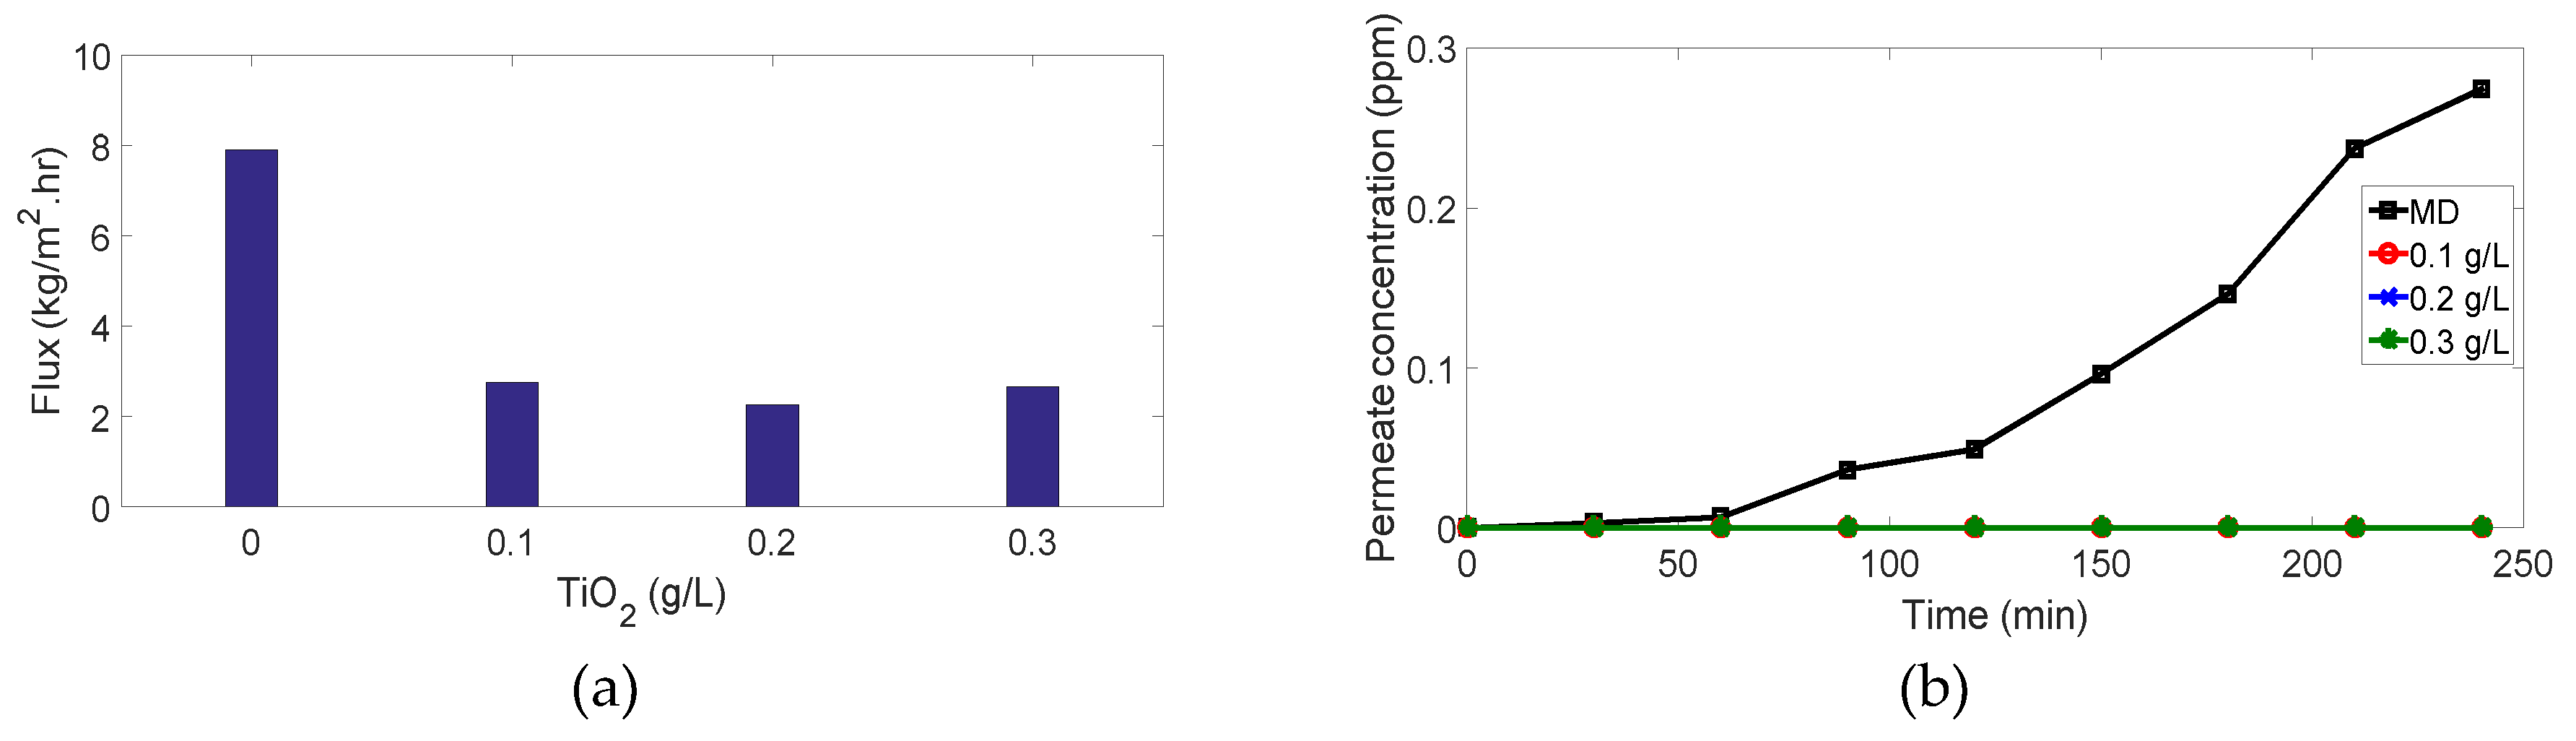
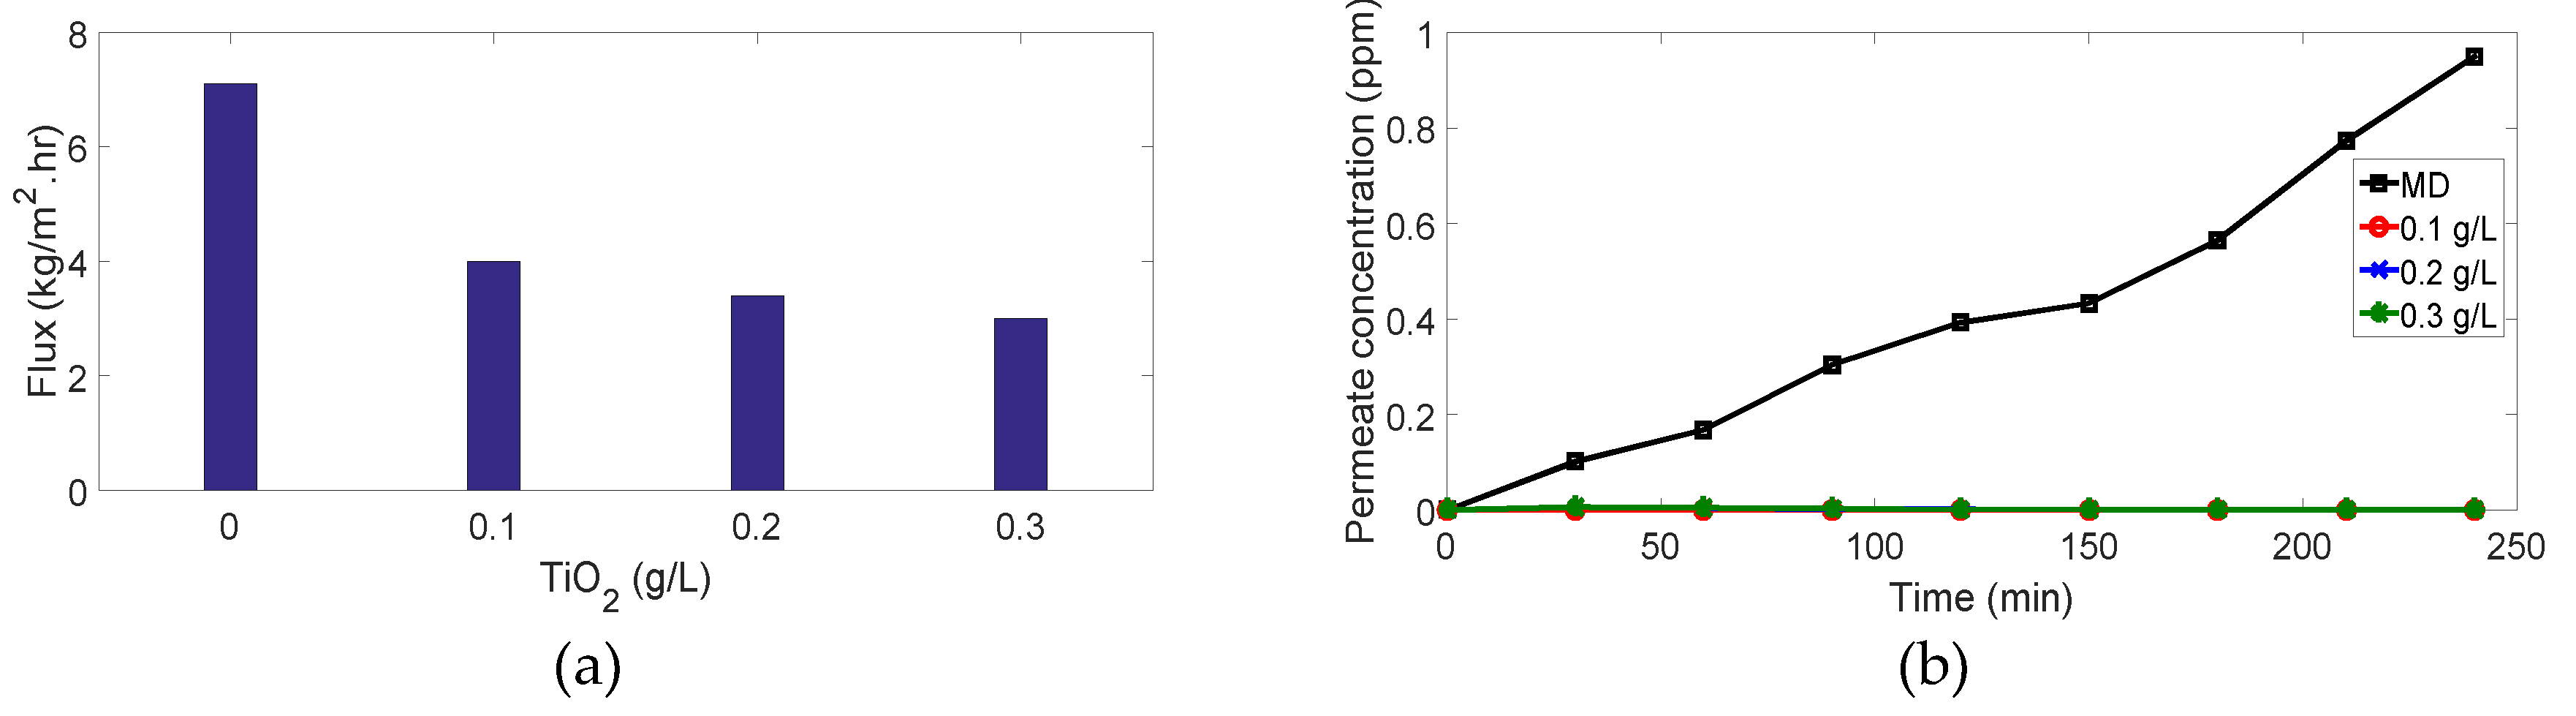
Membrane Flux and Dye Removal Efficiency

Changes in permeate weight were monitored and the permeate flux ( J ) was defined as the mass of water passed through the membrane per unit time under fixed temperature and pressure [41]; it is calculated from the following Equation (1) [42].
J = m A · t
where J is the permeate flux ( kg / ( m 2 · hr ) ), m is the permeate mass ( kg ), A is the effective membrane area ( m 2 ) and t is the sampling time ( h ). Feed and permeate concentrations were followed by using a UV-Visible Spectrophotometer (Hitachi U-3900). The optimum wavelength was 664   nm which is in the visible light range. The dye removal efficiency was calculated at the end of each cycle from Equation (2):
η   = ( 1 C p C f )   ·   100 %
where η is the dye removal efficiency, C p and C f are permeate and initial feed concentration, respectively.

3. Results and Discussion

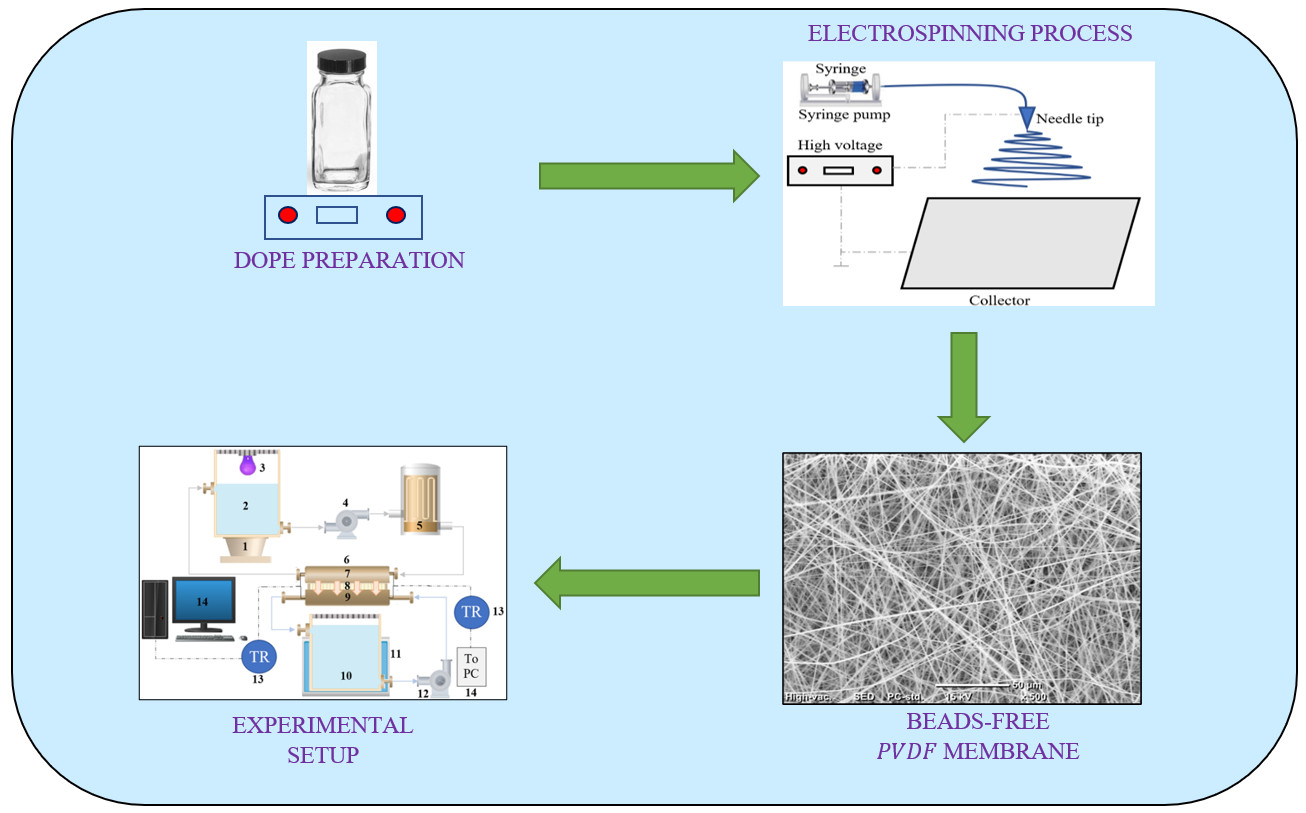
3.1. Membrane Distillation

As shown in Figure 10 and Figure 11, membrane distillation experiments (without photocatalytic reactor) for 4   ppm and 7   ppm methylene blue recorded the highest flux and lowest dye removal ( 91.1 % and 87.84 % , respectively) in comparison with other experiments using the same MB concentration. This is attributed to the high adsorption of the dye onto the membrane as the MB dissociates in aqueous solutions into a cation (the chromophore, dye + ) and an anion ( Cl ). Accordingly, there is an attractive force between the dye + and the negatively charged membrane leading to the ease of MB adsorption on the membrane and passage through the pores, as shown in Figure 12. Moreover, high membrane porosity, as measured in our previous study [36], and lower hydrophobicity as proved by measuring the contact angle will result in low removal and high flux.
Membrane distillation for 11   ppm and 15   ppm did not achieve the highest flux as 4   ppm and 7   ppm in comparison to other experiments with the same MB concentration. Hence, the drop in flux, as shown in (Figure 13a and Figure 14a), results from the high organic foulant “ MB ” loading which induces concentration polarization owing to the retention and partially blocking of the membrane pores. Membrane fouling by dye molecules is a complex phenomenon that is still not well understood. It is thought that this phenomenon mainly results from the interactions between the dye molecules and membrane. These interactions can be represented as physicochemical interactions, i.e., hydrophobic interactions (dispersion forces), polar interactions (dipole forces), and charge transfer (hydrogen bonding). These interactions significantly affect the permeate flux and the percentage of dye removal. Moreover, partial pore wetting may cause a reduction in the permeate flux. It is worth mentioning that an illustration of various forms of pore wetting can be found elsewhere [43].
Although the permeate flux decreased, the percentage of dye removal was remarkably high: it reached 99.7 % and 99.6 % for 11   ppm and 15   ppm , respectively, (Figure 13b and Figure 14b). Although deposition of the dye on the membrane surface occurs due to the attraction force between the negatively charged membrane and dye ions as mentioned above, retention of molecules increases gradually during the process and covers the membrane surface leading to repulsion between dye molecules adsorbed on the surface and dye molecules in the feed solution. This phenomenon is named (dye-dye fouling) and leads to the prevention of dye molecules from passing through the membrane, therefore, removal efficiency increases.

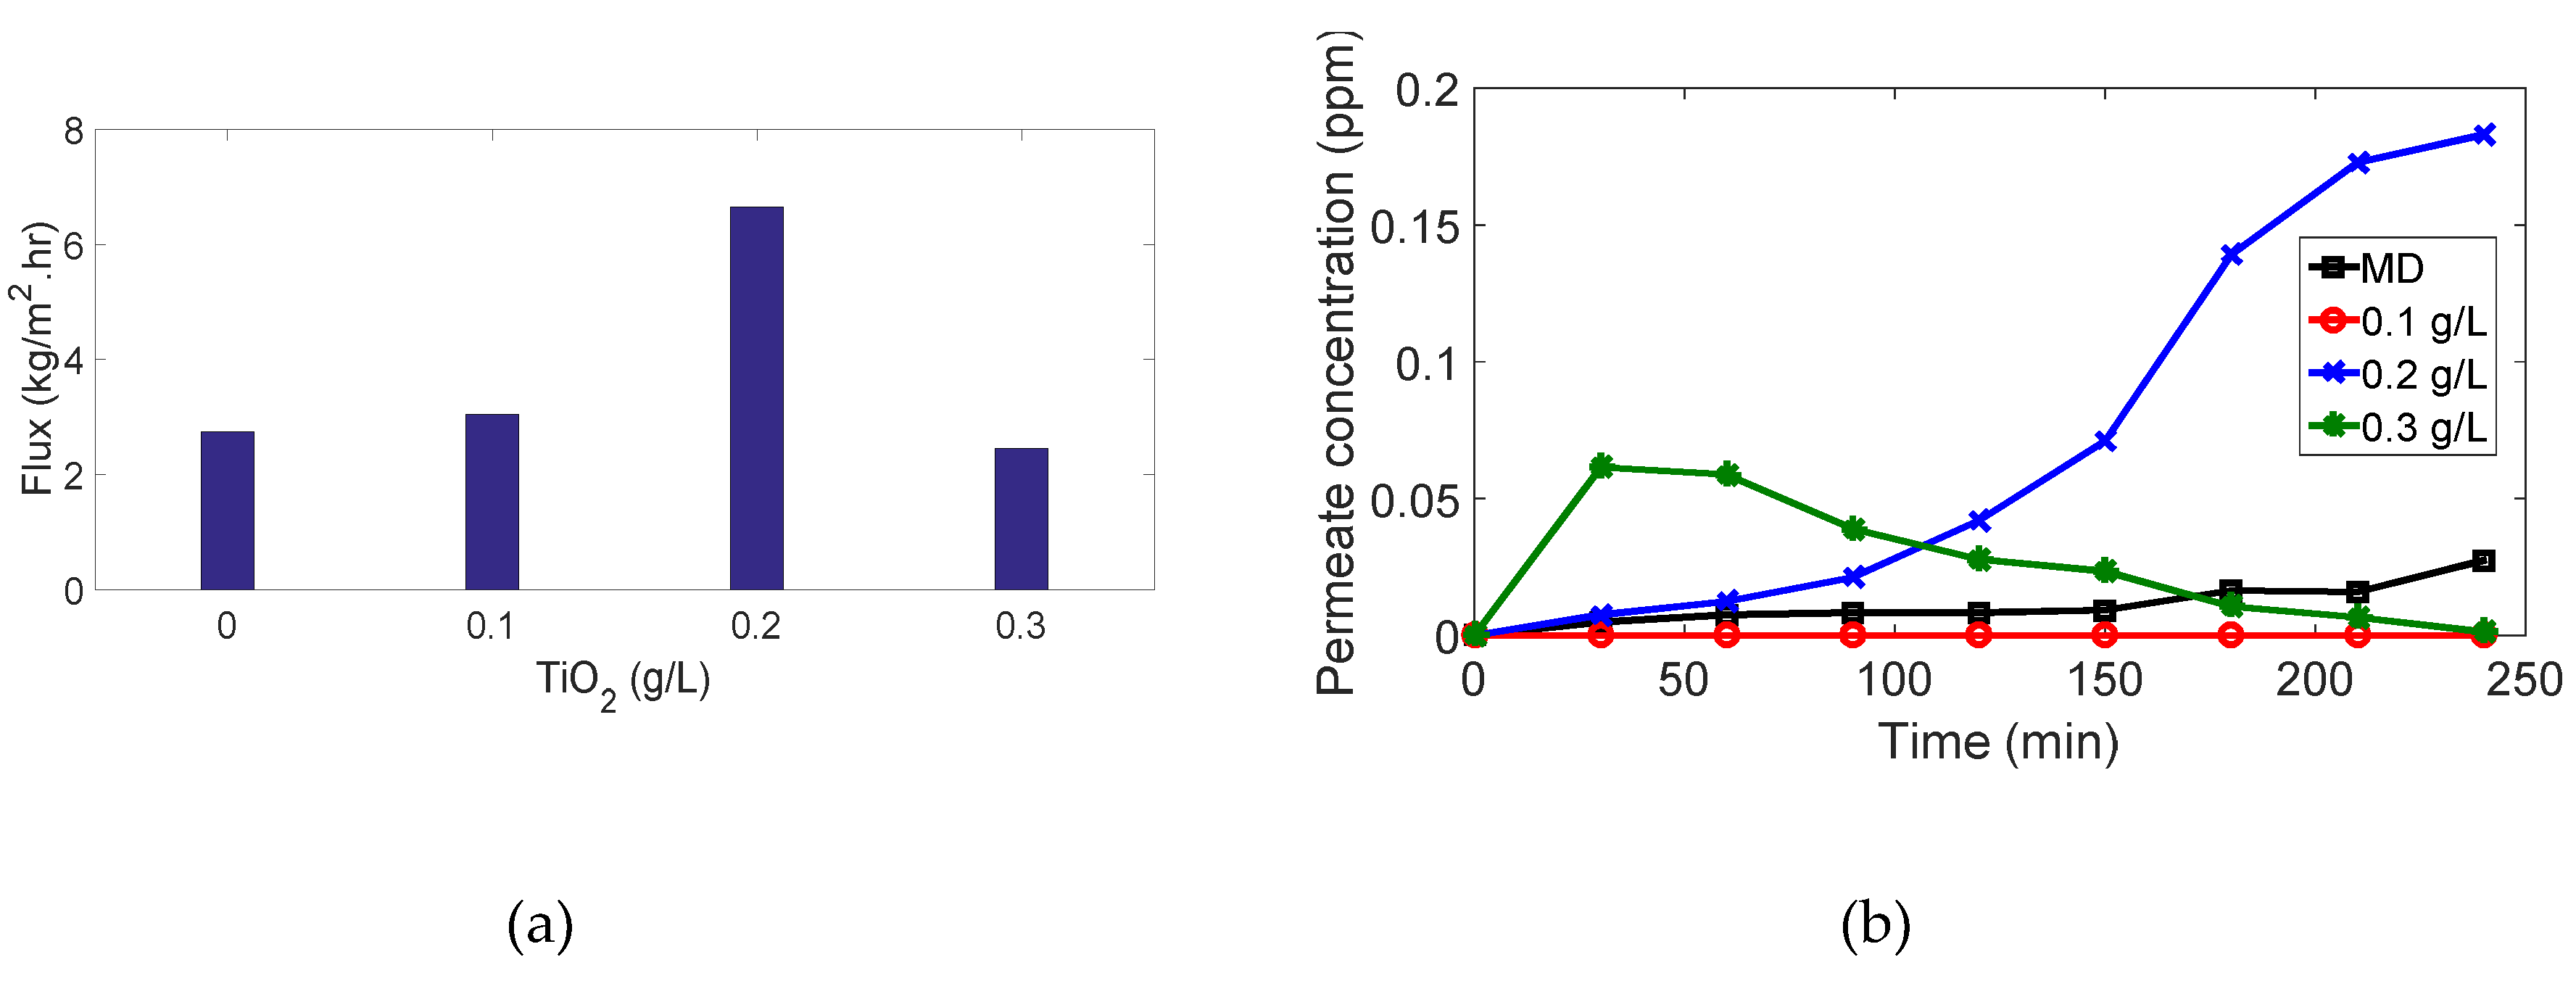
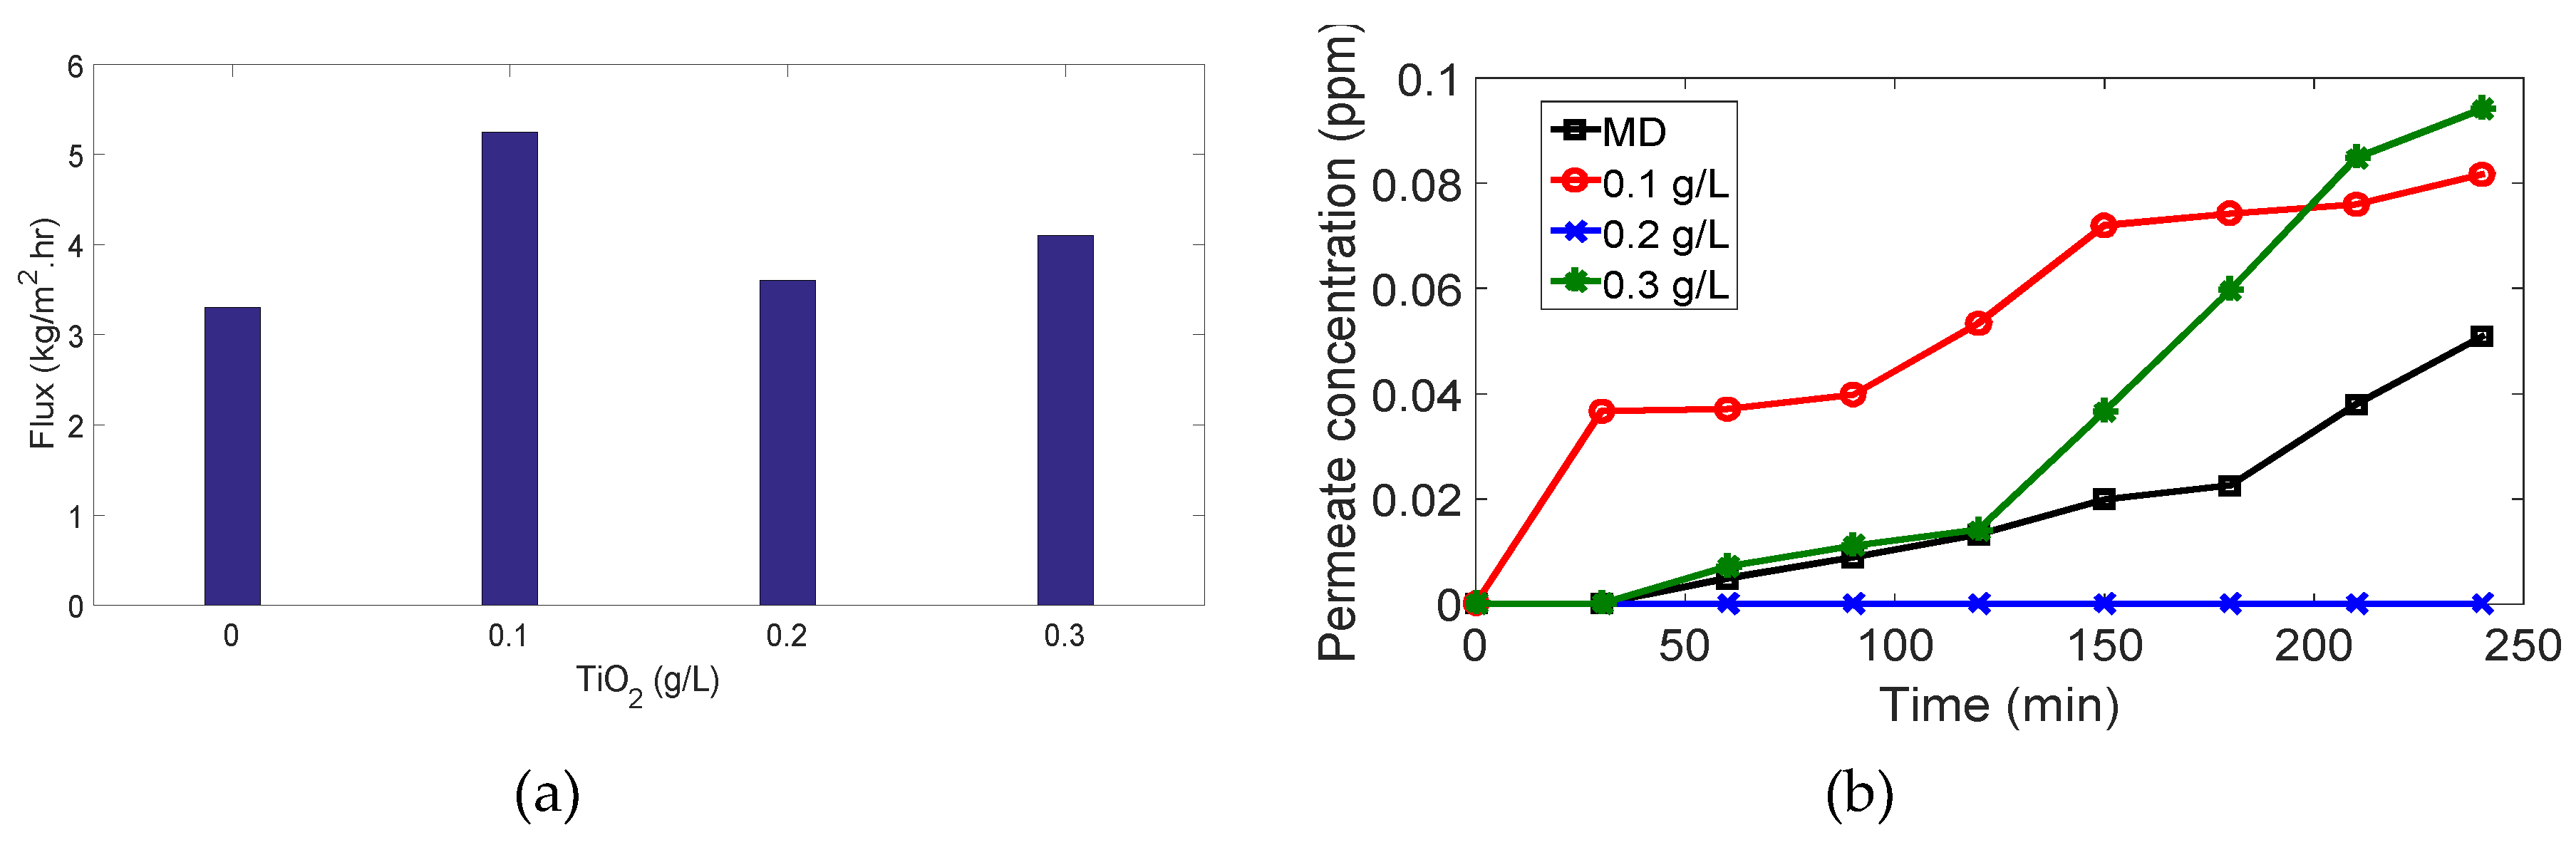
3.2. PMR Performance

For MB concentration of 4   and   7   ppm , (Figure 10 and Figure 11): interestingly, when we added the photocatalytic reactors with different TiO 2 concentrations to the above experiments, 100 % removal was achieved but with lower fluxes. The enhancement of dye removal is due to the presence of TiO 2 which degrades MB molecules under UV irradiation by photocatalysis mechanism. Fluxes are decreased as the TiO 2 may enter the membrane cell and block the pores and thus prevent vapors passage through the membranes.
For MB concentration of 11   ppm , Figure 13: meanwhile, 100 % and 98.1 % dye removal were recorded in case of 0.1   g / L and 0.2   g / L TiO 2 concentrations, respectively. There is an important behavior was observed in case of 0.3   g / L TiO 2 concentration as shown in Figure 13. At first, the permeate concentration and flux increase gradually followed by a gradual decrease in concentration and flux. This may be explained as follows; (i) During the first 30   mins , TiO 2 nanoparticles were not activated yet therefore its effect was not obvious leading to a high load of the MB on the membrane surface as a result of attraction forces as explained above as well the MB molecules were able to penetrate the membrane. (ii) After 30   mins , TiO 2 was activated and dye-dye fouling occurred so the flux and concentration decreased remarkably.
For MB concentration of 15   ppm , Figure 14: in this case, different behavior of the system’s performance was observed. Degradation of MB occurred, and this decreased the high load of organic molecules on the membrane leading to the increase in permeate flux. The removal efficiency was recorded to be 99.4 % , 100 % , and 99.3 % when TiO 2 concentration changed from 0.1   g / L , 0.2   g / L , and 0.3   g / L respectively. As shown in Figure 14, an integrated system of a photocatalytic reactor containing 0.2   g / L TiO 2 as slurry and membrane cell serving as a distillation unit is the optimum design under these conditions. Table 3 summarizes the performance of MD and PMR performance.

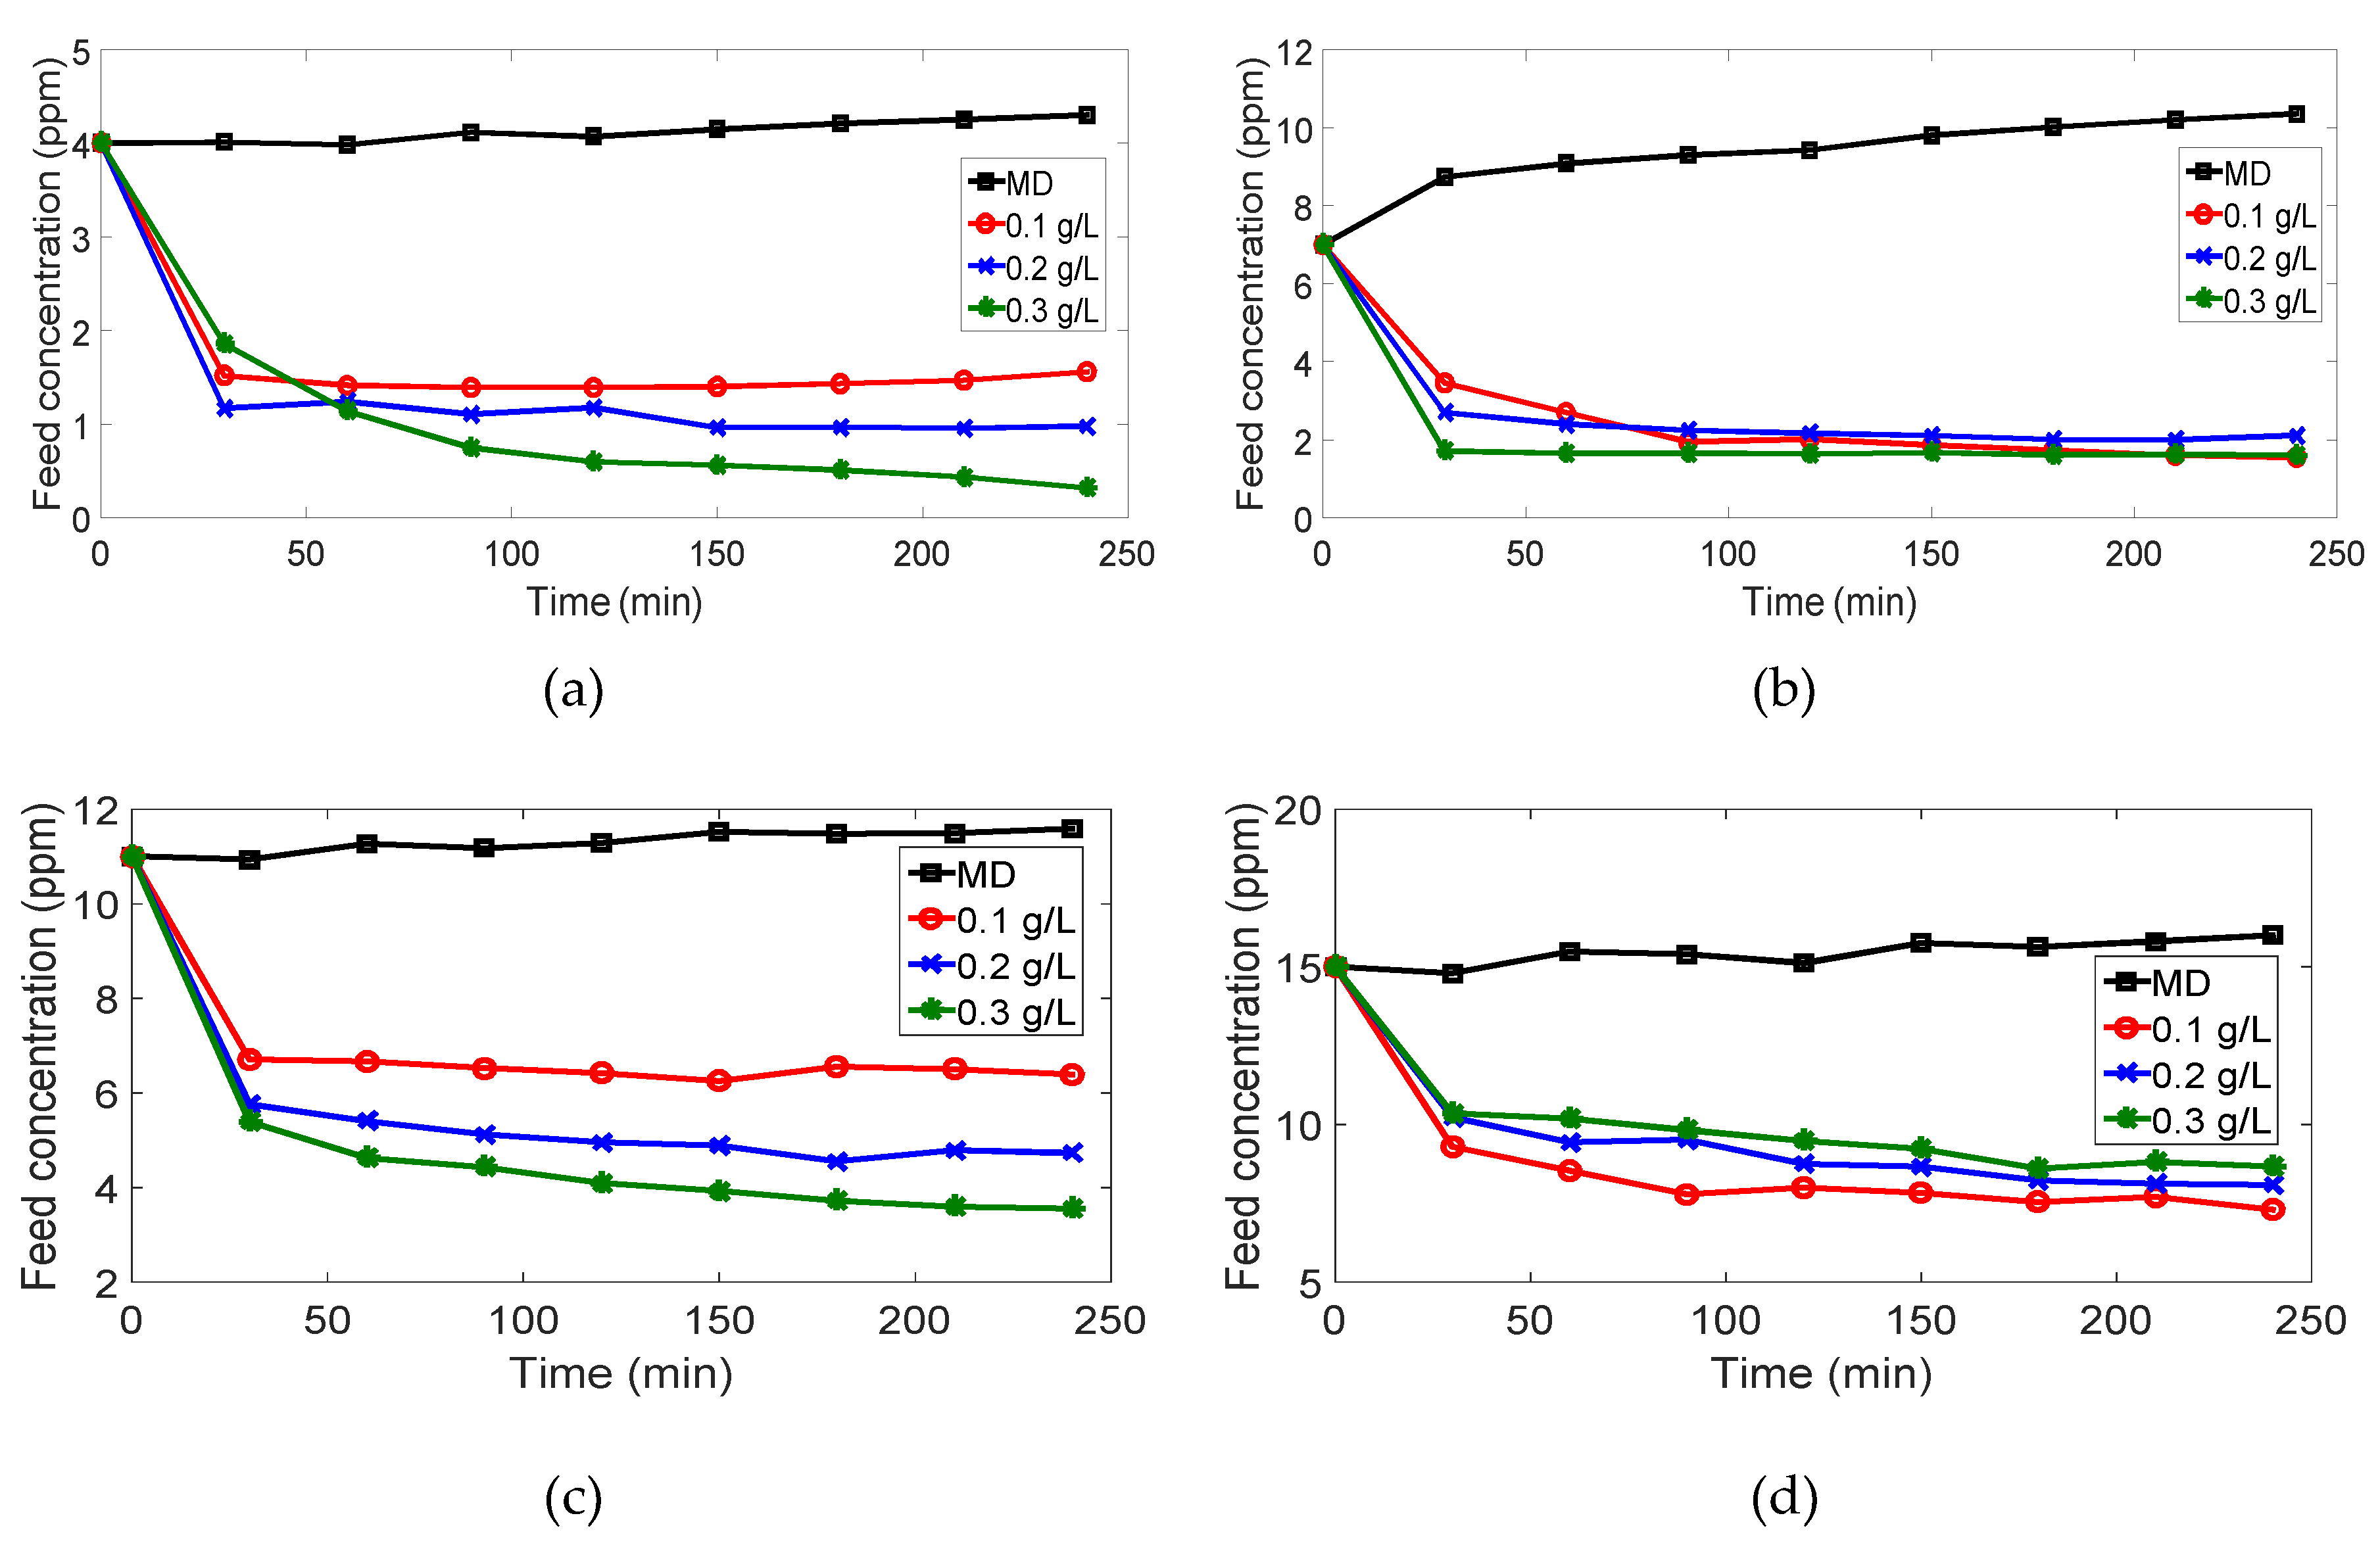
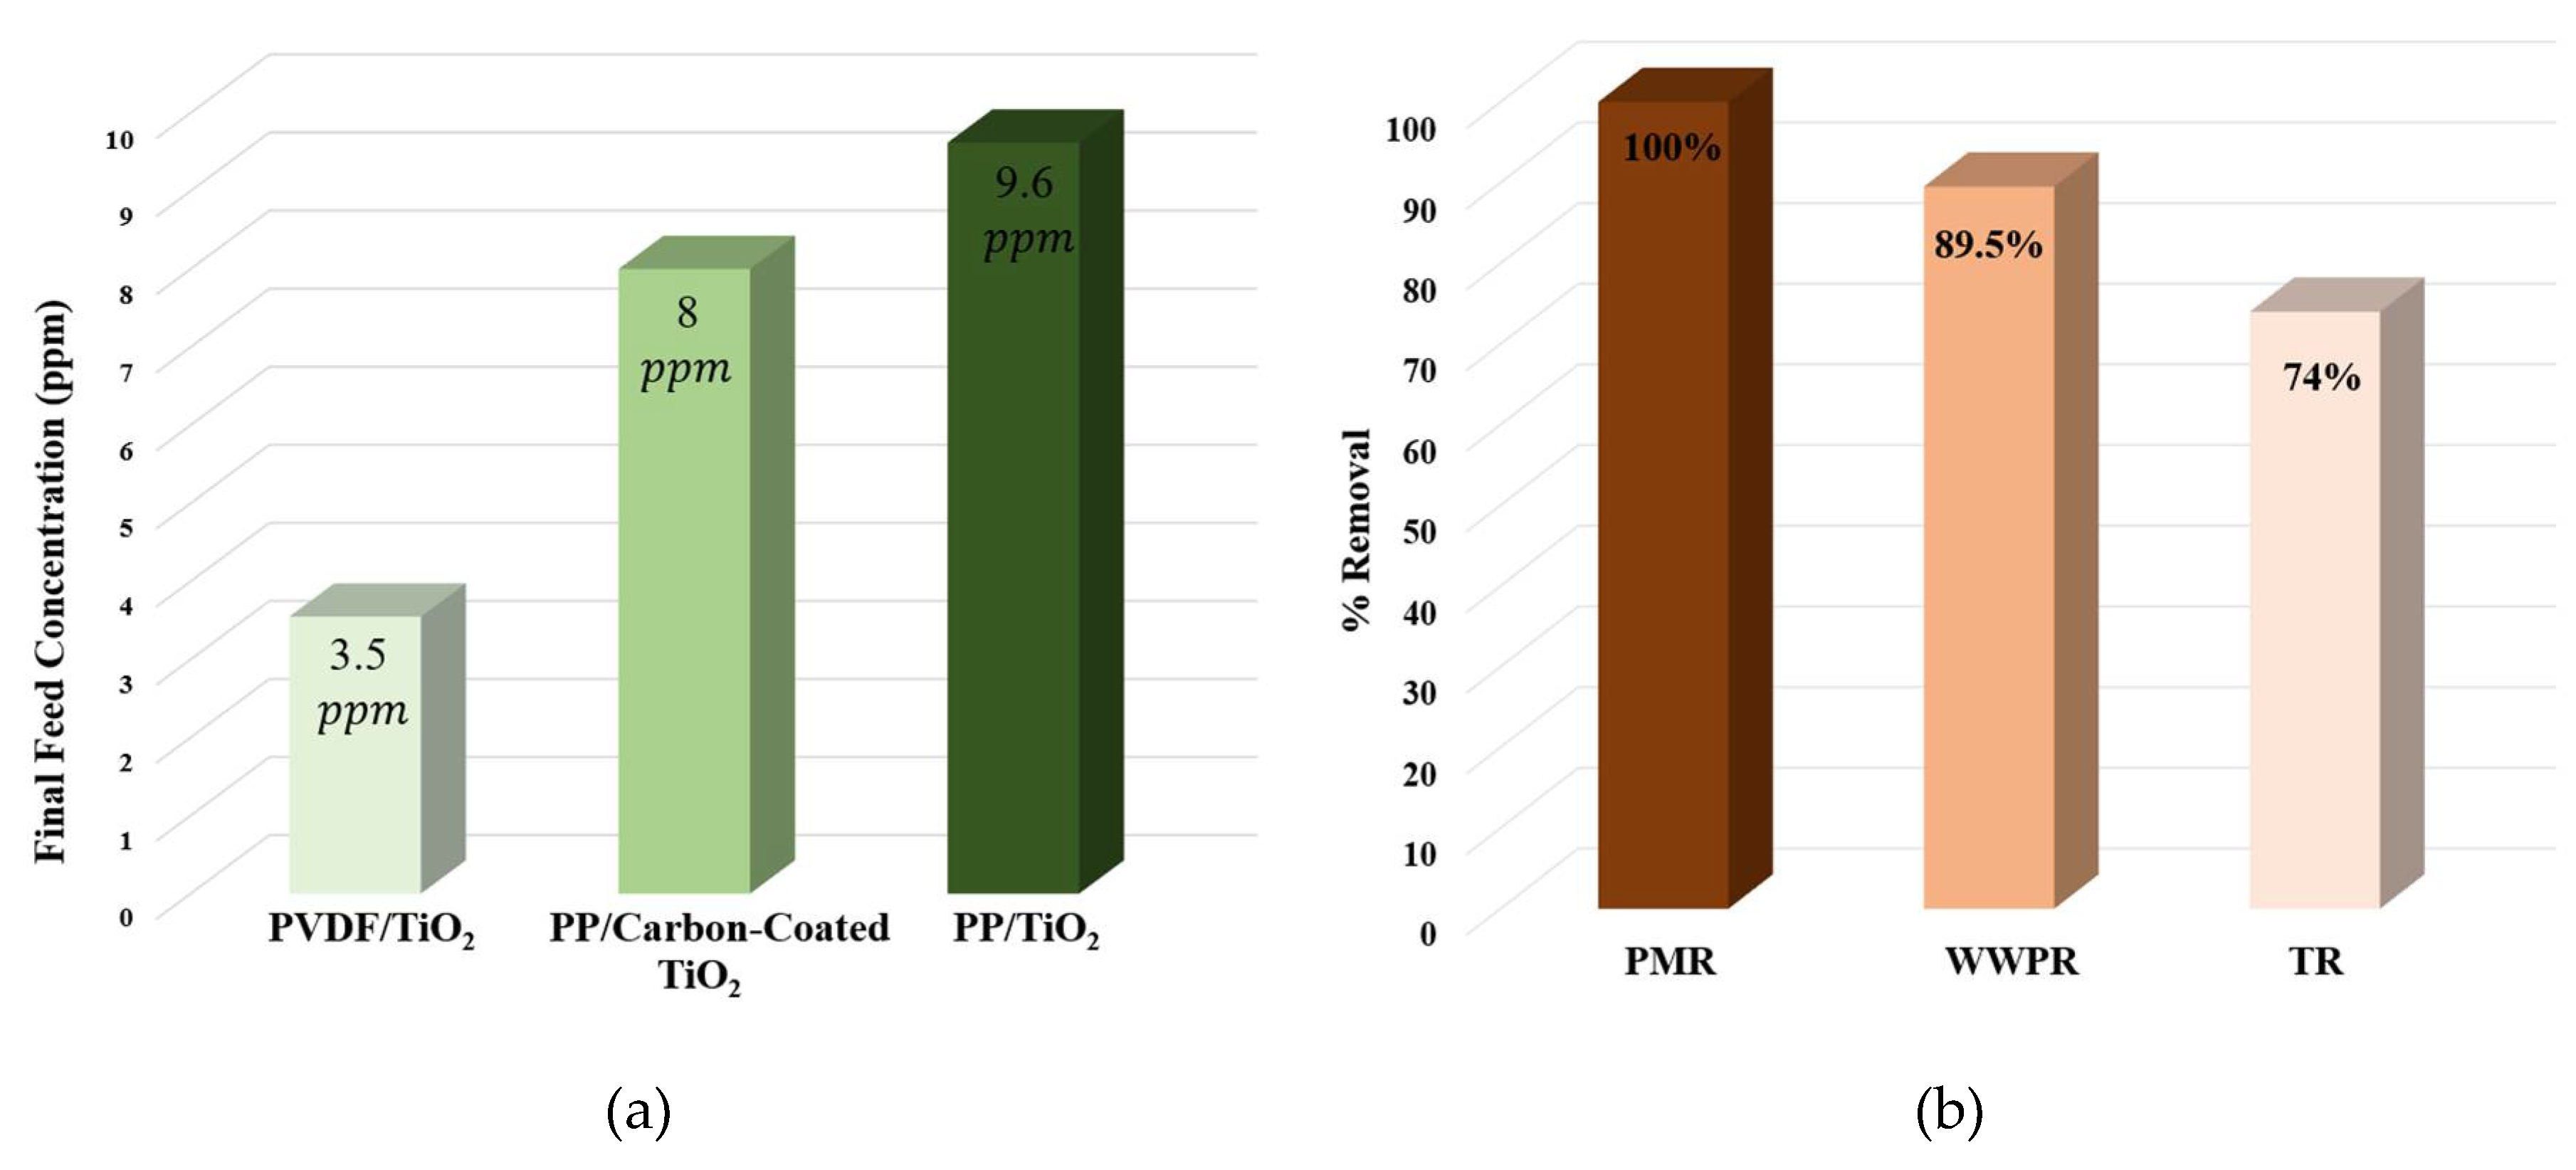
3.3. Feed Concentration Analysis

As mentioned earlier, the change in feed concentration was recorded and presented in Figure 15 to analyze the effect of TiO 2 on MB degradation. There are two noticeable opposing effects; (i) an increase in feed concentration is detected throughout the MD experiments while (ii) a reduction in the feed concentration is observed in the case of PMR experiments. The feed concentration increase is attributed to the water vapor passage through the PVDF membrane. On the other hand, the feed concentration reduction is mainly due to the photodegradation of MB by TiO 2 in the feed tank.

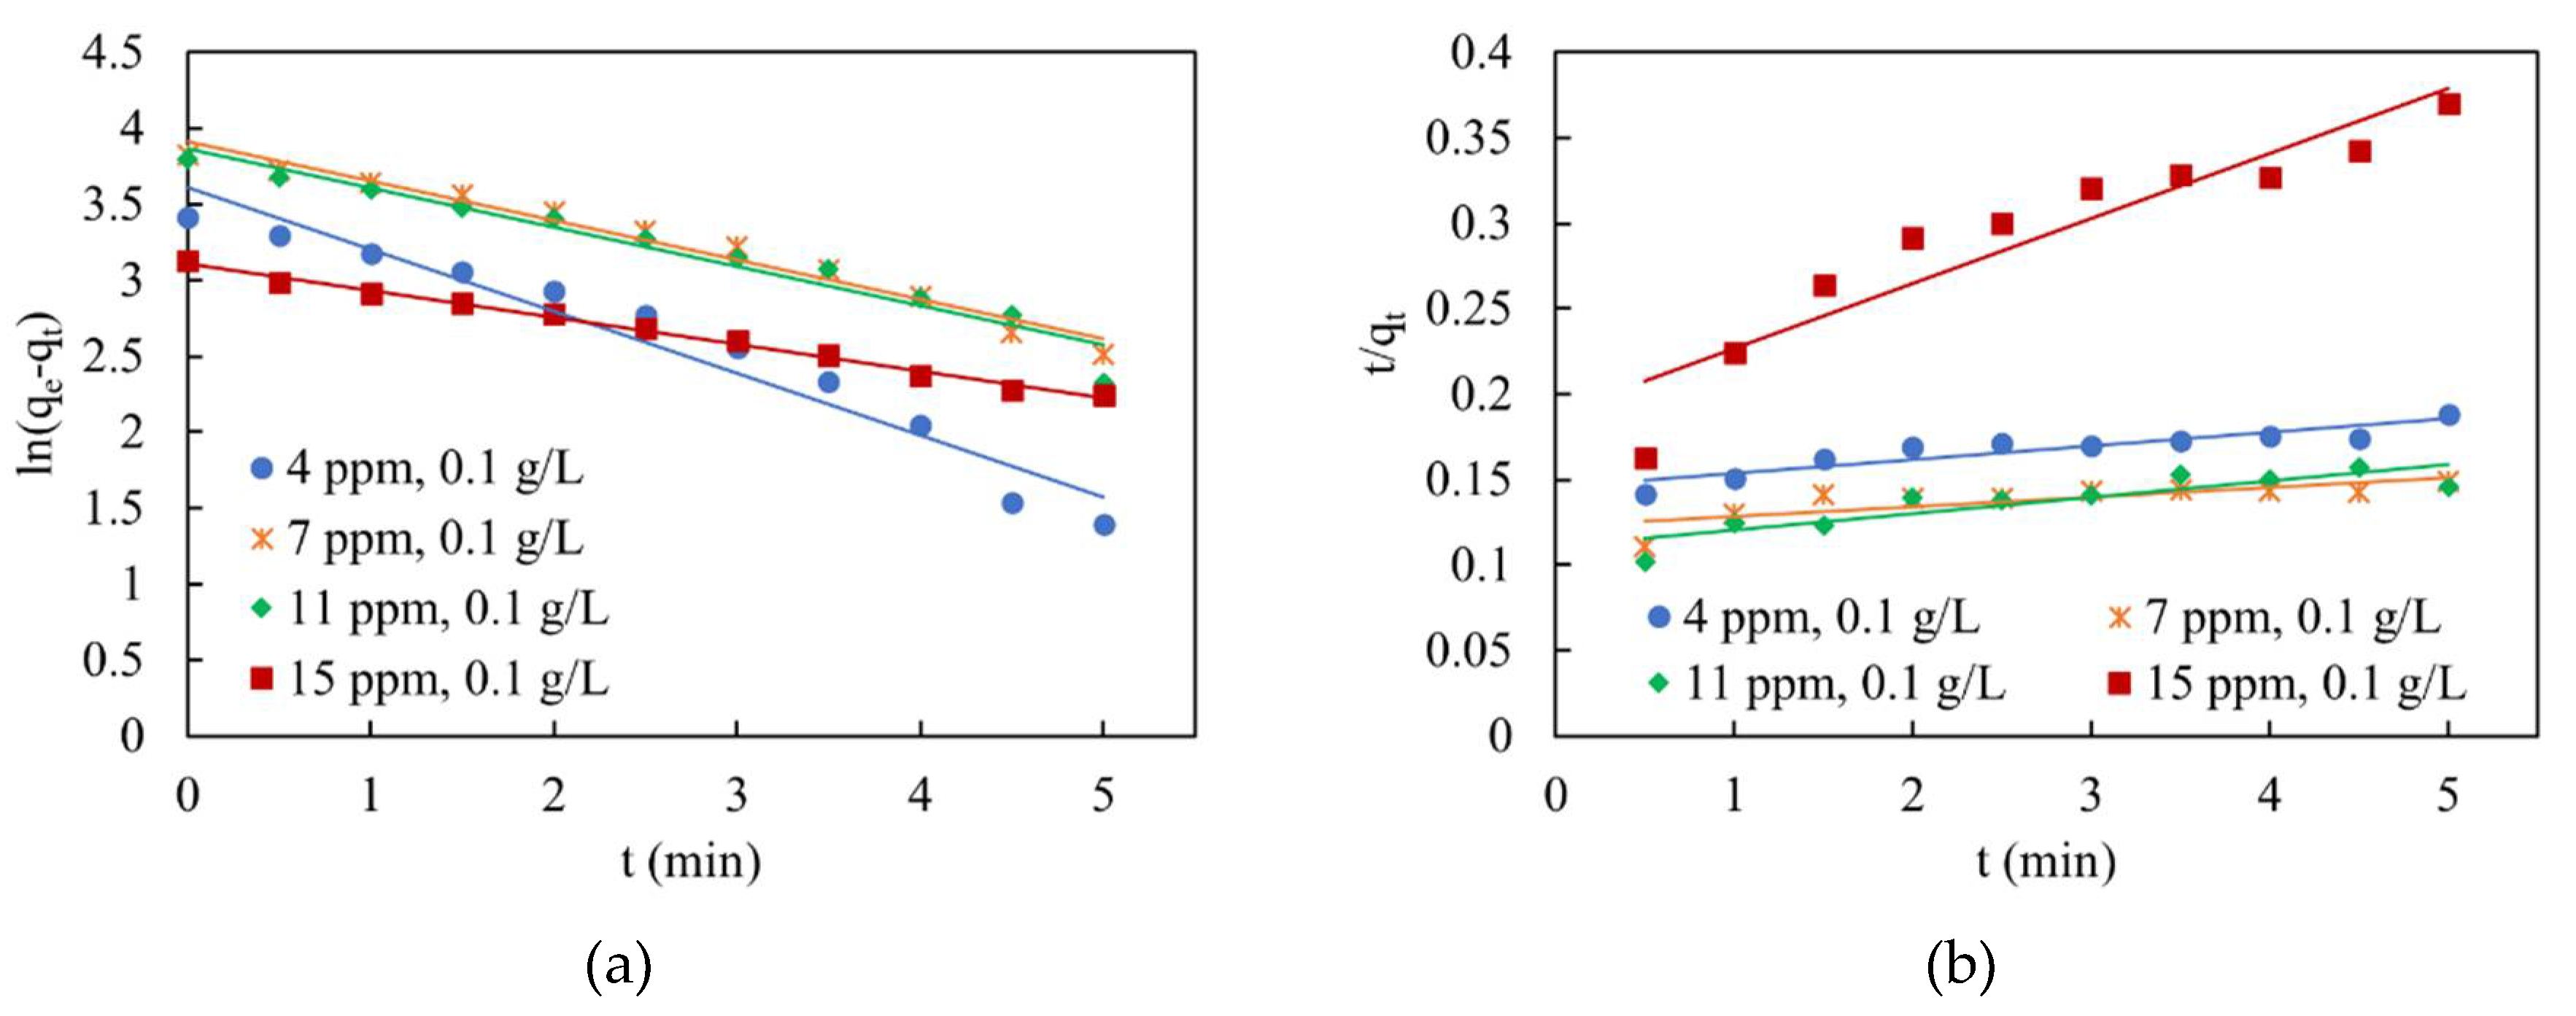
3.4. Photocatalysis Kinetic Analysis

Kinetics analysis of MB degradation was carried out in a batch reactor under the optimum condition of the PMR system, listed in Table 4. The reaction was performed in a glass reactor containing 500   mL of MB solution and the respective amount of photocatalyst. At first, the solution was continuously stirred by a magnetic stirrer at room temperature in the absence of light for 60   mins to ensure that equilibrium adsorption on the surface of the photocatalyst has been reached; then, 2   mL samples were withdrawn every 30   s . Afterward, the samples were purified from any existing traces of TiO 2 by using centrifugation at 6000   rpm for 20   mins . Then, the concentrations of these purified samples were measured by UV-Spectrophotometer at a wavelength of 664   nm .
The concentration-time data obtained were used to determine the reaction order by fitting the data to the linear relationship of pseudo-first-order (Lagergren’s rate law; Equation (3)) and the pseudo-second-order rate law Equation (4).
ln   ( q e q t ) = ln ( q e ) K 1 t
t q t = 1 K 2 q e 2 +   t q e
where q t and q e are the adsorption capacities   ( mg / g ) ; amount adsorbed of MB per unit mass of TiO 2 , at time t and equilibrium, respectively. K 1 and K 2 represent pseudo-first-order rate constant ( min 1 ) and pseudo-second-order rate constant ( g / ( mg · min ) ) , respectively.
As shown in Figure 16, it was found that the photodegradation of MB was described as a first-order reaction because the correlation coefficient ( R 2 ) for the pseudo-first-order model is higher than that of the pseudo-second-order model, additionally, the theoretical q e is more consistent with the calculated q cal for the pseudo-first-order model. For each of the fittings, the reaction rate constants, theoretical q e , calculated q cal and the correlation coefficient ( R 2 ) were determined and summarized in Table 5 [44].

3.5. Comparison between PMRs and Previous Studies

The performance of the developed PMR system was compared against different PMR systems [45] operating under the conditions of initial MB concentration 11   ppm , photocatalyst load 0.1   g / L , and operating time 4   hrs . As shown in Figure 17a, the current PMR system achieves the least final feed concentration compared to different PMR system of polypropylene (PP) membrane combined with either a slurry of TiO 2 or carbon-coated TiO 2 which emphasizes the capabilities of the current system.
Additionally, the performance of the current PMR in treating MB was compared against the wetted wall photocatalytic reactor (WWPR) [46], and tubular reactor (TR) [47] at different operating conditions (see Table 6). As shown in Figure 17b, 100 % MB removal was achieved by utilizing the developed PMR system at an initial MB concentration of 11   ppm and TiO 2 load of 0.1   g / L . Meanwhile, 89.5 % and 74 % were recorded in case of the WWPR and the TR, respectively. It is worth mentioning that the PMR is privileged by attaining pure permeate, for further usage, as well as achieving high MB photocatalytic degradation.

4. Remarks and Conclusions

The key findings of the current study are as follows:
  • Electrospinning conditions adopted in the current study enable the acquisition of free beads fibers with a negatively charged surface and a high hydrophobicity membrane.
  • The performance of the PMR exceeds the conventional MD, thus allowing more water to be reused which is an important advantage from the economic and environmental points of view.
  • Using the MD is preferable with high MB concentrations (i.e., 11 and 15   ppm ) to obtain nearly pure permeate besides recovering dyes from the concentrate.
  • Almost 100 % separation efficiency was achieved by operating the PMR at the investigated optimum conditions, which provides high-quality water and low-dyeing waste concentration suitable for discharge.
  • Photodegradation of MB on TiO 2 behaves similarly to the pseudo-first-order kinetic model.

Author Contributions

Conceptualization, S.N., A.H.E.-S. and M.T.M.; methodology, Z.Z.; software, M.S.S. and M.R.E.; validation, Z.Z., M.R.E. and M.S.S.; formal analysis, S.N. and M.T.M.; writing—original draft preparation, Z.Z. and M.M.T.; writing—review and editing, M.S.S, S.N. and A.H.E.-S.; supervision, S.N., A.H.E.-S. and M.M.T. All authors have read and agreed to the published version of the manuscript.

Funding

This research received no external funding.

Acknowledgments

The authors would like to appreciate the technical support of Alexandria University and Egypt-Japan University of Science and Technology (E-JUST).

Conflicts of Interest

The authors declare no conflict of interest.

Nomenclature

Symbols
A Membrane area ( m 2 )
C f Initial feed concentration ( ppm )
C p Permeate concentration ( ppm )
J Permeate flux ( kg / ( m 2 · hr ) )
K 1 Pseudo-first-order rate constant ( min 1 )
K 2 Pseudo-second-order rate constant ( g / ( mg . min ) )
Mw Molecular weight ( g / mol )
m Permeate mass ( kg )
q c Calculated adsorption capacity ( mg / g )
q e Equilibrium adsorption capacity ( mg / g )
q t Adsorption capacity at time t ( mg / g )
R 2 Correlation coefficient
t Sampling time ( hr )
Greek letters
η Dye removal efficiency ( % )
Abbreviations
Ag Silver
AGMD Air Gap Membrane distillation
APTES Aminopropyltriethoxysilane
CdS Cadmium Sulfide
CeO 2 Cerium Dioxide
DCMD Direct Contact Membrane Distillation
DMAc N-Dimethyl Acetamide
DMAc SDS GO Dimethyl Acetamide-Sodium Dodecyl Sulphate-Graphene Oxide
Fe 2 O 3 Ferric Oxide
FTIR Fourier Transform Infrared Spectrometer
KCl Potassium Chloride
KOH Potassium Hydroxide
MBMethylene Blue
MDMembrane Distillation
MWCNTs Multi-Walled Carbon Nanotubes
NIPS Non-solvent Induced Phase Separation
PMMA Poly-methyl Methacrylate
PMR Photocatalytic Membrane Reactors
PVDF Poly-Vinylidene Flouride
PVP Poly-Vinyl Propylene
SEM Scanning Electron Microscope
SGMD Sweep Gas Membrane Distillation
TiO 2 Titanium Dioxide
TrFE Trifluoro Ethylene
UV Ultraviolet
VMD Vacuum Membrane Distillation
V 2 O 5 Vanadium Oxide
WO 3 Tungsten Trioxide
XRD X-Ray Diffraction
ZnO Zinc Oxide
ZnSZinc Sulfide
ZrO 2 Zirconium Dioxide

References

  1. Desa, A.L.; Hairom, N.H.H.; Ng, L.Y.; Ng, C.Y.; Ahmad, M.K.; Mohammad, A.W. Industrial textile wastewater treatment via membrane photocatalytic reactor (MPR) in the presence of ZnO-PEG nanoparticles and tight ultrafiltration. J. Water Process. Eng. 2019, 31, 100872. [Google Scholar] [CrossRef]
  2. Mondal, S.; Purkait, M.K.; De, S. Advances in Dye Removal Technologies; Springer: Singapore, 2018. [Google Scholar]
  3. Molinari, R.; Pirillo, F.; Falco, M.; Loddo, V.; Palmisano, L. Photocatalytic degradation of dyes by using a membrane reactor. Chem. Eng. Process. Process Intensif. 2004, 43, 1103–1114. [Google Scholar] [CrossRef] [Green Version]
  4. Basile, A.; Gallucci, F. Membranes for Membrane Reactors: Preparation, Optimization and Selection; John Wiley & Sons: West Sussex, UK, 2010. [Google Scholar]
  5. Elmarghany, M.R.; El-Shazly, A.H.; Rajabzadeh, S.; Salem, M.S.; Shouman, M.A.; Sabry, M.N.; Matsuyama, H.; Nady, N. Triple-layer nanocomposite membrane prepared by electrospinning based on modified pes with carbon nanotubes for membrane distillation applications. Membranes 2020, 10, 15. [Google Scholar] [CrossRef] [PubMed] [Green Version]
  6. Ashoor, B.; Mansour, S.; Giwa, A.; Dufour, V.; Hasan, S. Principles and applications of direct contact membrane distillation (DCMD): A comprehensive review. Desalination 2016, 398, 222–246. [Google Scholar] [CrossRef]
  7. El-Marghany, M.R.; El-Shazly, A.H.; Salem, M.S.A.; Sabry, M.N.; Nady, N. Novel membrane suitable for membrane distillation: Effect of mixed nanofillers on the membrane performance. Key Eng. Mater. 2019, 801, 325–330. [Google Scholar] [CrossRef]
  8. Ali, I.; Bamaga, O.; Gzara, L.; Bassyouni, M.; Abdel-Aziz, M.; Soliman, M.; Drioli, E.; Albeirutty, M. Assessment of blend PVDF membranes, and the effect of polymer concentration and blend composition. Membranes 2018, 8, 13. [Google Scholar] [CrossRef] [Green Version]
  9. Mat Nawi, N.I.; Chean, H.M.; Shamsuddin, N.; Bilad, M.R.; Narkkun, T.; Faungnawakij, K.; Khan, A.L. Development of hydrophilic PVDF membrane using vapour induced phase separation method for produced water treatment. Membranes 2020, 10, 121. [Google Scholar] [CrossRef]
  10. Zhang, H.; Quan, X.; Chen, S.; Zhao, H.; Zhao, Y. Fabrication of photocatalytic membrane and evaluation its efficiency in removal of organic pollutants from water. Sep. Purif. Technol. 2006, 50, 147–155. [Google Scholar] [CrossRef]
  11. Van Gerven, T.; Mul, G.; Moulijn, J.; Stankiewicz, A. A review of intensification of photocatalytic processes. Chem. Eng. Process. Process Intensif. 2007, 46, 781–789. [Google Scholar] [CrossRef]
  12. Herrmann, J.-M. Heterogeneous photocatalysis: State of the art and present applications in honor of Pr. RL Burwell Jr. (1912–2003), Former Head of Ipatieff Laboratories, Northwestern University, Evanston (Ill). Top. Catal. 2005, 34, 49–65. [Google Scholar] [CrossRef]
  13. Leong, S.; Razmjou, A.; Wang, K.; Hapgood, K.; Zhang, X.; Wang, H. TiO2 based photocatalytic membranes: A review. J. Membr. Sci. 2014, 472, 167–184. [Google Scholar] [CrossRef]
  14. Mozia, S. Photocatalytic membrane reactors (PMRs) in water and wastewater treatment. A review. Sep. Purif. Technol. 2010, 73, 71–91. [Google Scholar] [CrossRef]
  15. Buscio, V.; Brosillon, S.; Mendret, J.; Crespi, M.; Gutiérrez-Bouzán, C. Photocatalytic membrane reactor for the removal of CI Disperse red 73. Materials 2015, 8, 3633–3647. [Google Scholar] [CrossRef] [Green Version]
  16. Ollis, D.F. Integrating photocatalysis and membrane technologies for water treatment. Ann. N. Y. Acad. Sci. 2003, 984, 65–84. [Google Scholar] [CrossRef]
  17. Zhang, W.; Ding, L.; Luo, J.; Jaffrin, M.Y.; Tang, B. Membrane fouling in photocatalytic membrane reactors (PMRs) for water and wastewater treatment: A critical review. Chem. Eng. J. 2016, 302, 446–458. [Google Scholar] [CrossRef]
  18. Molinari, R.; Lavorato, C.; Argurio, P.; Szymański, K.; Darowna, D.; Mozia, S. Overview of photocatalytic membrane reactors in organic synthesis, energy storage and environmental applications. Catalysts 2019, 9, 239. [Google Scholar] [CrossRef] [Green Version]
  19. Salem, M.S.A.; El-Shazly, A.H.; El-Marghany, M.R.; Sabry, M.N.; Nady, N. Effect of Adding Functionalized Graphene on the Performance of PVDF Membrane in Direct Contact Membrane Distillation. Key Eng. Mater. 2019, 801, 337–342. [Google Scholar] [CrossRef]
  20. Grzechulska, J.; Morawski, A.W. Photocatalytic decomposition of azo-dye acid black 1 in water over modified titanium dioxide. Appl. Catal. B 2002, 36, 45–51. [Google Scholar] [CrossRef]
  21. Suriani, A.; Mohamed, A.; Othman, M.; Rohani, R.; Yusoff, I.; Mamat, M.; Hashim, N.; Azlan, M.; Ahmad, M.; Marwoto, P. Incorporation of electrochemically exfoliated graphene oxide and TiO2 into polyvinylidene fluoride-based nanofiltration membrane for Dye Rejection. Water Air Soil Pollut. 2019, 230, 176. [Google Scholar] [CrossRef]
  22. Benhabiles, O.; Galiano, F.; Marino, T.; Mahmoudi, H.; Lounici, H.; Figoli, A. Preparation and characterization of TiO2-PVDF/PMMA blend membranes using an alternative non-toxic solvent for UF/MF and photocatalytic application. Molecules 2019, 24, 724. [Google Scholar] [CrossRef] [Green Version]
  23. Martins, P.M.; Ribeiro, J.M.; Teixeira, S.; Petrovykh, D.; Cuniberti, G.; Pereira, L.; Lanceros-Méndez, S. Photocatalytic microporous membrane against the increasing problem of water emerging pollutants. Materials 2019, 12, 1649. [Google Scholar] [CrossRef] [PubMed] [Green Version]
  24. Lee, C.-G.; Javed, H.; Zhang, D.; Kim, J.-H.; Westerhoff, P.; Li, Q.; Alvarez, P.J. Porous electrospun fibers embedding TiO2 for adsorption and photocatalytic degradation of water pollutants. Environ. Sci. Technol. 2018, 52, 4285–4293. [Google Scholar] [CrossRef] [PubMed]
  25. Abdullah, N.; Ayodele, B.V.; Mansor, W.N.W.; Abdullah, S. Effect of incorporating TiO2 photocatalyst in pvdf hollow fibre membrane for photo-assisted degradation of methylene blue. Bull. Chem. React. Eng. Catal. 2018, 13, 588–591. [Google Scholar] [CrossRef] [Green Version]
  26. Cheng, J.; Pu, H. A facile method to prepare polyvinylidene fluoride composite nanofibers with high photocatalytic activity via nanolayer coextrusion. Eur. Polym. J. 2018, 99, 361–367. [Google Scholar] [CrossRef]
  27. Galiano, F.; Song, X.; Marino, T.; Boerrigter, M.; Saoncella, O.; Simone, S.; Faccini, M.; Chaumette, C.; Drioli, E.; Figoli, A. Novel photocatalytic PVDF/Nano-TiO2 hollow fibers for environmental remediation. Polymers 2018, 10, 1134. [Google Scholar] [CrossRef] [Green Version]
  28. Li, N.; Tian, Y.; Zhang, J.; Sun, Z.; Zhao, J.; Zhang, J.; Zuo, W. Precisely-controlled modification of PVDF membranes with 3D TiO2/ZnO nanolayer: Enhanced anti-fouling performance by changing hydrophilicity and photocatalysis under visible light irradiation. J. Membr. Sci. 2017, 528, 359–368. [Google Scholar] [CrossRef]
  29. Peng, Y.; Yu, Z.; Pan, Y.; Zeng, G. Antibacterial photocatalytic self-cleaning poly (vinylidene fluoride) membrane for dye wastewater treatment. Polym. Adv. Technol. 2018, 29, 254–262. [Google Scholar] [CrossRef]
  30. Ramasundaram, S.; Seid, M.G.; Choe, J.W.; Kim, E.-J.; Chung, Y.C.; Cho, K.; Lee, C.; Hong, S.W. Highly reusable TiO2 nanoparticle photocatalyst by direct immobilization on steel mesh via PVDF coating, electrospraying, and thermal fixation. Chem. Eng. J. 2016, 306, 344–351. [Google Scholar] [CrossRef]
  31. Fischer, K.; Grimm, M.; Meyers, J.; Dietrich, C.; Gläser, R.; Schulze, A. Photoactive microfiltration membranes via directed synthesis of TiO2 nanoparticles on the polymer surface for removal of drugs from water. J. Membr. Sci. 2015, 478, 49–57. [Google Scholar] [CrossRef]
  32. Li, J.-H.; Yan, B.-F.; Shao, X.-S.; Wang, S.-S.; Tian, H.-Y.; Zhang, Q.-Q. Influence of Ag/TiO2 nanoparticle on the surface hydrophilicity and visible-light response activity of polyvinylidene fluoride membrane. Appl. Surf. Sci. 2015, 324, 82–89. [Google Scholar] [CrossRef]
  33. Jia, L.M.; Wen, C.; Xu, J.Y.; Xiao, C.F. Enhancement of retention and antifouling capability for PVDF UF membrane modified by nano-TiO2 sol. In Proceedings of the Second International Conference on Smart Materials and Nanotechnology in Engineering, Weihai, China, 20 October 2009; p. 74935R. [Google Scholar]
  34. Soo, J.Z.; Ang, B.C.; Ong, B.H. Microscopic characterization and analysis of electrospun TiO2-PVP and TiO2-PVDF fibers. Solid State Phenom. 2017, 264, 33–37. [Google Scholar] [CrossRef]
  35. Tan, Y.; Sun, Z.; Meng, H.; Han, Y.; Wu, J.; Xu, J.; Xu, Y.; Zhang, X. A new MOFs/polymer hybrid membrane: MIL-68 (Al)/PVDF, fabrication and application in high-efficient removal of p-nitrophenol and methylene blue. Sep. Purif. Technol. 2019, 215, 217–226. [Google Scholar] [CrossRef]
  36. Zeitoun, Z.; El-Shazly, A.H.; Nosier, S.R.; Elmarghany, M.; Salem, M.S.; Taha, M.M. Electrospinning of polyvinylidene fluoride membranes: Effect of membrane composition and fabrication conditions. Alex. Eng. J. Under review.
  37. An, A.K.; Guo, J.; Jeong, S.; Lee, E.-J.; Tabatabai, S.A.A.; Leiknes, T. High flux and antifouling properties of negatively charged membrane for dyeing wastewater treatment by membrane distillation. Water Res. 2016, 103, 362–371. [Google Scholar] [CrossRef] [PubMed] [Green Version]
  38. Latif, S.M.F.A. Photocatalytic Degradation of Methylene Blue Dye Using a Slurry of TiO2 in a Falling Film Reactor. Master’s Thesis, Alexandria University, Alexandria Governorate, Egypt, 2017. [Google Scholar]
  39. Thamaphat, K.; Limsuwan, P.; Ngotawornchai, B. Phase characterization of TiO2 powder by XRD and TEM. Kasetsart J. (Nat. Sci.) 2008, 42, 357–361. [Google Scholar]
  40. Mozia, S.; Morawski, A.W.; Toyoda, M.; Inagaki, M. Effectiveness of photodecomposition of an azo dye on a novel anatase-phase TiO2 and two commercial photocatalysts in a photocatalytic membrane reactor (PMR). Sep. Purif. Technol. 2008, 63, 386–391. [Google Scholar] [CrossRef]
  41. Li, J.; Hu, Y.; Liu, W.; Weng, X.; Dong, X.; Zhang, X.; Zhou, W. High Flux and hydrophilic fibrous ultrafiltration membranes based on electrospun titanium dioxide nanoparticles/polyethylene oxide/poly (vinylidene fluoride) composite scaffolds. J. Nanosci. Nanotechnol. 2017, 17, 9042–9049. [Google Scholar] [CrossRef]
  42. Li, Y.; Dong, S.; Zhu, L. Preparation of novel poly (vinylidene fluoride)/TiO2 photocatalysis membranes for use in direct contact membrane distillation. J. Nanopart. Res. 2018, 20, 63. [Google Scholar] [CrossRef]
  43. Rezaei, M.; Warsinger, D.M.; Duke, M.C.; Matsuura, T.; Samhaber, W.M. Wetting phenomena in membrane distillation: Mechanisms, reversal, and prevention. Water Res. 2018, 139, 329–352. [Google Scholar] [CrossRef]
  44. Mozia, S.; Toyoda, M.; Inagaki, M.; Tryba, B.; Morawski, A.W. Application of carbon-coated TiO2 for decomposition of methylene blue in a photocatalytic membrane reactor. J. Hazard. Mater. 2007, 140, 369–375. [Google Scholar] [CrossRef]
  45. Mozia, S.; Toyoda, M.; Tsumura, T.; Inagaki, M.; Morawski, A.W. Comparison of effectiveness of methylene blue decomposition using pristine and carbon-coated TiO2 in a photocatalytic membrane reactor. Desalination 2007, 212, 141–151. [Google Scholar] [CrossRef]
  46. Boonying, A.; Kasempremsak, A.; Junpirom, S.; Nuchitprasittichai, A. Wetted wall photocatalytic reactor for methylene blue degradation. IOP Conf. Ser. Mater. Sci. Eng. 2020, 778, 012060. [Google Scholar] [CrossRef]
  47. Rahimi, S.; Poormohammadi, A.; Salmani, B.; Ahmadian, M.; Rezaei, M. Comparing the photocatalytic process efficiency using batch and tubular reactors in removal of methylene blue dye and COD from simulated textile wastewater. J. Water Reuse. Desal. 2016, 6, 574–582. [Google Scholar] [CrossRef] [Green Version]
Figure 1. The four membrane distillation configurations.
Membranes 10 00276 g001
Figure 2. Electrospinning device and mechanism.
Membranes 10 00276 g002
Figure 3. SEM image for PVDF membrane.
Membranes 10 00276 g003
Figure 4. Zeta potential of the PVDF membrane surface.
Membranes 10 00276 g004
Figure 5. Contact angle: (a) water droplet on PVDF membrane surface [36]; (b) methylene blue droplet on PVDF membrane surface.
Membranes 10 00276 g005
Figure 6. Images of dye and water droplets on PVDF membrane.
Membranes 10 00276 g006
Figure 7. Particle size distribution of TiO 2 .
Membranes 10 00276 g007
Figure 8. XRD patterns for TiO 2 nanoparticles.
Membranes 10 00276 g008
Figure 9. Hybrid system diagram: (1) magnetic stirrer; (2) feed tank; (3)UV-lamp; (4) feed pump; (5) heating unit; (6) membrane cell; (7) feed compartment; (8) PVDF membrane; (9) permeate compartment; (10) permeate tank; (11) cooling jacket; (12) permeate pump; (13) thermocouples; (14) PC data acquisition system.
Membranes 10 00276 g009
Figure 10. Results for 4   ppm methylene blue (MB) experiments: (a) flux vs. amount of TiO 2 ; (b) permeate concentration vs. time.
Membranes 10 00276 g010
Figure 11. Results for 7   ppm MB experiments: (a) flux vs. amount of TiO 2 ; (b) permeate concentration vs. time.
Membranes 10 00276 g011
Figure 12. SEM for PVDF membrane after dye treatment.
Membranes 10 00276 g012
Figure 13. Results for 11   ppm MB experiments: (a) flux vs. amount of TiO 2 ; (b) permeate concentration vs. time.
Membranes 10 00276 g013
Figure 14. Results for 15   ppm MB experiments: (a) flux vs. amount of TiO 2 ; (b) permeate concentration vs. time.
Membranes 10 00276 g014
Figure 15. Feed concentration vs. time: (a) 4 ppm; (b) 7 ppm; (c) 11 ppm; (d) 15 ppm.
Membranes 10 00276 g015
Figure 16. Kinetic data fitting: (a) pseudo-first-order kinetic model fitting; (b) pseudo-second-order kinetic model fitting.
Membranes 10 00276 g016
Figure 17. Comparison between: (a) PVDF/TiO2, polypropylene (PP)/carbon-coated TiO2, and PP/TiO2 systems; (b) PMR, wetted wall photocatalytic reactor (WWPR), and tubular reactor (TR).
Membranes 10 00276 g017
Table 1. Summary of previous studies utilizing polyvinylidene fluoride (PVDF)-titanium dioxide ( TiO 2 ) photocatalytic membrane reactors (PMRs).
MembraneAdditivesPollutantRef.
TypeFabrication MethodTypeConc.TypeConc.
PVDFPhase immersion DMAc _ SDS GO / TiO 2 ( DMAc _ SDS GO : TiO 2 )
79 wt%:1 wt%
MB 10   ppm [21]
PVDF/PMMAPhase inversion TiO 2 0.12   wt % 0.25   wt % 0.5   wt % MB10 µmol/L[22]
PVDF-TrFESolvent casting TiO 2 8   wt % MB 2   ppm [23]
PVDF-PVPElectrospinning TiO 2 4   wt % MB 3.2   ppm 6.4   ppm [24]
PVDFElectrospinning TiO 2 3   wt % 6   wt % 9   wt % MB 1   mol / L [25]
PVDFCoextrusion TiO 2 10   wt % 20   wt % 30   wt % 40   wt % MB 10   ppm [26]
PVDFCoextrusionTiO2/MWCNTsTiO2/MWCNTs
10 wt%
TiO2/MWCNTs
20 wt%
TiO2/MWCNTs
30 wt%
TiO2/MWCNTs
40 wt%
MB 10   ppm [26]
PVDFPhase inversion TiO 2 0.5   wt % MB 10 µ mol / L [27]
PVDFPurchased TiO 2 : ZnO (TiO2:ZnO)
1:1
(TiO2:ZnO)
1:3
(TiO2:ZnO)
1:5
MB 10 5 mol / L [28]
PVDFPhase inversion Ag / TiO 2 / APTES 0.1 g
0.2 g
0.5 g
MB 3   ppm [29]
PVDFDip coating TiO 2 1   mg / L MB 10   µ M [30]
PVDFDip coatingTitanium isopropoxide 2   ×   10 3 M MB 10   µ M [31]
PVDFNonsolvent induced phase separation (NIPS)-immersion precipitation inversion Ag / TiO 2 ( TiO 2 : Ag )
3.5   wt % : 0   wt %
( TiO 2 : Ag )
1.57   wt % : 17.19   wt %
( TiO 2 : Ag )
1.76   wt % : 20.54   wt %
( TiO 2 : Ag )
1.71   wt % : 21.33   wt %
MB10 mg/L[32]
PVDFPhase inversion TiO 2 0 vol%
6 vol%
12 vol%
21 vol%
MB0.01 mmo/L[33]
Table 2. Electrospinning condition for preparation of PVDF membrane.
Electrospinning Voltage 20   kV
Flow rate 1   mm / h
Spinneret speed 100   mm / s
Cleaning frequency 15   mins
Cleaning interval 1   s
Spinning distance 15   cm
Table 3. Summary—PMR and membrane distillation (MD) performance.
MB
Concentration (ppm)
Percentage of Dye Removal
Concentration   of   Ti O 2 ( g / L )
0 (MD) 0.1   ( PMR ) 0.2   ( PMR ) 0.3   ( PMR )
After 1 h
4 99.82 % 100 % 100 % 100 %
7 97.51 % 100 % 100 % 100 %
11 99.93 % 100 % 99.88 % 99.45 %
15 99.96 % 99.74 % 100 % 99.95 %
After 2 h
4 98.68 % 100 % 100 % 100 %
7 93.97 % 100 % 100 % 100 %
11 99.92 % 100 % 99.59 % 99.74 %
15 99.9 % 99.62 % 100 % 99.9 %
After 3 h
4 95.86 % 100 % 100 % 100 %
7 91.03 % 100 % 100 % 100 %
11 99.84 % 100 % 98.6 % 99.9 %
15 99.84 % 99.46 % 100 % 99.5 %
After 4 h
4 92 % 100 % 100 % 100 %
7 84.52 % 100 % 100 % 100 %
11 99.7 % 100 % 98.1 % 100 %
15 99.6 % 99.4 % 100 % 99.3 %
Table 4. Optimum conditions for PMR performance.
MB   Concentration   ( ppm ) Ti O 2   Concentration
( g / L )
4 0.1  
7 0.1  
11 0.1  
15 0.2  
Table 5. Kinetics parameters for adsorption of MB on TiO 2 at the optimum conditions.
Optimum ConditionsRate Law
MB   ( ppm ) Ti O 2
( g / L )
Pseudo-First-Order Kinetic ModelPseudo-Second-Order Kinetic Model
q e ( mg g ) K 1 ( mi n 1 ) q cal ( mg g ) R 2 q e ( mg g ) K 2 ( g mg · min ) q cal ( mg g ) R 2
4 0.1 30.54 0.4069 36.92 0.9487 30.54 4.39 × 10 4 125 0.8408
7 0.1 45.87 0.2598 49.97 0.9738 45.87 2.55 × 10 4 178.57 0.6164
11 0.1 44.56 0.2587 47.84 0.9489 44.56 8.3 × 10 4 104.17 0.7735
15 0.2 22.92 0.1776 22.46 0.9934 22.92 7.7 × 10 3 26.25 0.8774
Table 6. The effect of PMR, WWPR, and TR on MB removal at different operating conditions.
Operating ConditionsType of Photocatalytic Reactor
PMRWWPRTR
Photocatalyst TiO 2 TiO 2 / SiO 2 TiO 2
Photocatalyst loading ( g / L ) 0.1 1.25 0.3
Initial MB concentration ( ppm ) 11 80 60
Operating time ( hrs ) 4 2 1
% Removal10089.574

