
Rapidly Establishing an Ultra-Cold Supply Chain of Vaccines in Israel: Evidence for the Efficacy of Inoculation to Mitigate the COVID-19 Pandemic

Abstract
:1. Introduction
2. Materials and Methods
2.1. Interviews
2.2. Applied Statistical Methods
3. Results
4. Discussion
5. Conclusions
Author Contributions
Funding
Institutional Review Board Statement
Informed Consent Statement
Data Availability Statement
Acknowledgments
Conflicts of Interest
References
- Sinha, A.; Bernardes, E.; Calderon, R.; Wuest, T. Digital Supply Networks; McGraw Hill-Ascent Audio: London, UK, 2021. [Google Scholar]
- World Health Organization. Operational Guidance on Establishing an Ultra-Cold Chain System in Support of the Pfizer-BioNTech COVID-19 Vaccine Rollout, 1 February 2022 (No. WHO/2019-nCoV/UCC_systems/Pfizer-BioNTech_vaccine/2022.1); World Health Organization: Geneva, Switzerland, 2022. [Google Scholar]
- Yahalom-Ronen, Y.; Tamir, H.; Melamed, S.; Politi, B.; Shifman, O.; Achdout, H.; Vitner, E.B.; Israeli, O.; Milrot, E.; Stein, D.; et al. A single dose of recombinant VSV-∆ G-spike vaccine provides protection against SARS-CoV-2 challenge. Nat. Commun. 2020, 11, 6402. [Google Scholar] [CrossRef] [PubMed]
- Yahalom-Ronen, Y.; Erez, N.; Fisher, M.; Tamir, H.; Politi, B.; Achdout, H.; Melamed, S.; Glinert, I.; Weiss, S.; Cohen-Gihon, I.; et al. Neutralization of SARS-CoV-2 variants by rVSV-ΔG-spike-elicited human sera. Vaccines 2022, 10, 291. [Google Scholar] [CrossRef] [PubMed]
- Balicer, R.D.; Afek, A. Digital health nation: Israel’s global big data innovation hub. Lancet 2017, 389, 2451–2453. [Google Scholar] [CrossRef] [PubMed]
- Naor, M.; Laor, E. Disaster recovery after Hurricane Maria in Puerto Rico: Assessment using Endsley’s three-level model of situational awareness. J. Bus. Contin. Emerg. Plan. 2020, 13, 278–288. [Google Scholar]
- United States Government Accountability Office. COVID-19: Pandemic Lessons Highlight Need for Public Health Situational Awareness Network, Gao. 2022. Available online: https://www.gao.gov/products/gao-22-104600 (accessed on 23 June 2022).
- Rapaport, C.; Ashkenazi, I. Why does Israel lead the world in COVID-19 vaccinations? applying mass casualty event principles to COVID-19 vaccination programs. Int. J. Environ. Res. Public Health 2021, 18, 5362. [Google Scholar] [CrossRef] [PubMed]
- SLE. The Logistics Center. 2022. Available online: https://www.sle.co.il/en/?catid=%7B5C447255-5633-4465-9241-14544CDB3F49%7D (accessed on 9 December 2022).
- Senor, D.; Singer, S. Start-Up Nation: The Story of Israel’s Economic Miracle; Random House Digital, Inc.: New York, NY, USA, 2011. [Google Scholar]
- Rosen, B.; Waitzberg, R.; Israeli, A. Israel’s rapid rollout of vaccinations for COVID-19. Isr. J. Health Policy Res. 2021, 10, 6. [Google Scholar] [CrossRef]
- Glied, S. Strategy drives implementation: COVID vaccination in Israel. Isr. J. Heal. Policy Res. 2021, 10, 9. [Google Scholar] [CrossRef]
- Israel Ministry of Health. COVID-19 Data Tracker. 2022. Available online: https://datadashboard.health.gov.il/COVID-19/general (accessed on 15 June 2022).
- Rossman, H.; Shilo, S.; Meir, T.; Gorfine, M.; Shalit, U.; Segal, E. COVID-19 dynamics after a national immunization program in Israel. Nat. Med. 2021, 27, 1055–1061. [Google Scholar] [CrossRef]
- Wickham, H.; Grolemund, G. R for Data Science: Import, Tidy, Transform, Visualize, and Model Data; O’Reilly Media, Inc.: Sebastopol, CA, USA, 2016. [Google Scholar]
- Haas, E.J.; Angulo, F.J.; McLaughlin, J.M.; Anis, E.; Singer, S.R.; Khan, F.; Brooks, N.; Smaja, M.; Mircus, G.; Pan, K.; et al. Impact and effectiveness of mRNA BNT162b2 vaccine against SARS-CoV-2 infections and COVID-19 cases, hospitalisations, and deaths following a nationwide vaccination campaign in Israel: An observational study using national surveillance data. Lancet 2021, 397, 1819–1829. [Google Scholar] [CrossRef]
- Muhsen, K.; Maimon, N.; Mizrahi, A.; Varticovschi, B.; Bodenheimer, O.; Gelbshtein, U.; Grotto, I.; Cohen, D.; Dagan, R. Effects of BNT162b2 COVID-19 vaccine booster in long-term care facilities in Israel. N. Engl. J. Med. 2022, 386, 399–401. [Google Scholar] [CrossRef]
- Rozenberg, S.; Vandromme, J.; Martin, C. Are we equal in adversity? Does COVID-19 affect women and men differently? Maturitas 2020, 138, 62–68. [Google Scholar] [CrossRef]
- Gorelik, Y.; Anis, E.; Edelstein, M. Inequalities in initiation of COVID19 vaccination by age and population group in Israel-December 2020-July 2021. Lancet Reg. Health-Eur. 2022, 12, 100234. [Google Scholar] [CrossRef]
- Rosen, B.; Waitzberg, R.; Israeli, A.; Hartal, M.; Davidovitch, N. Addressing vaccine hesitancy and access barriers to achieve persistent progress in Israel’s COVID-19 vaccination program. Isr. J. Health Policy Res. 2021, 10, 43. [Google Scholar] [CrossRef]
- Shacham, M.; Greenblatt-Kimron, L.; Hamama-Raz, Y.; Martin, L.R.; Peleg, O.; Ben-Ezra, M.; Mijiritsky, E. Increased COVID-19 vaccination hesitancy and health awareness amid COVID-19 vaccinations programs in Israel. Int. J. Environ. Res. Public Health 2021, 18, 3804. [Google Scholar] [CrossRef]
- Goldberg, Y.; Mandel, M.; Bar-On, Y.M.; Bodenheimer, O.; Freedman, L.; Haas, E.J.; Milo, R.; Alroy-Preis, S.; Ash, N.; Huppert, A. Waning immunity after the BNT162b2 vaccine in Israel. N. Engl. J. Med. 2021, 385, e85. [Google Scholar] [CrossRef]
- Regev-Yochay, G.; Amit, S.; Bergwerk, M.; Lipsitch, M.; Leshem, E.; Kahn, R.; Lustig, Y.; Cohen, C.; Doolman, R.; Ziv, A.; et al. Decreased infectivity following BNT162b2 vaccination: A prospective cohort study in Israel. Lancet Reg. Health-Eur. 2021, 7, 100150. [Google Scholar] [CrossRef]
- De-Leon, H.; Aran, D. What pushed Israel out of herd immunity? Modeling COVID-19 spread of Delta and Waning immunity. medRxiv 2021. [Google Scholar] [CrossRef]
- Marchildon, G.P. The rollout of the COVID-19 vaccination: What can Canada learn from Israel? Isr. J. Health Policy Res. 2021, 10, 12. [Google Scholar] [CrossRef]
- Naor, M.; Coman, A.; Ronen, B. Exploiting bottlenecks. Qual. Prog. 2016, 49, 34. [Google Scholar]
- Manski, C.F.; Molinari, F. Estimating the COVID-19 infection rate: Anatomy of an inference problem. J. Econom. 2021, 220, 181–192. [Google Scholar] [CrossRef]
- Randolph, H.E.; Barreiro, L.B. Herd immunity: Understanding COVID-19. Immunity 2020, 52, 737–741. [Google Scholar] [CrossRef] [PubMed]
- Margit, M. Easing Lockdown Should Depend on Vaccination Rate, Israeli Epidemiologist Says, themedialine. 2021. Available online: https://themedialine.org/ (accessed on 15 December 2022).
- Wilf-Miron, R.; Myers, V.; Saban, M. Incentivizing vaccination uptake: The “green pass” proposal in Israel. JAMA 2021, 325, 1503–1504. [Google Scholar] [CrossRef] [PubMed]
- Amit, M.; Kimhi, H.; Bader, T.; Chen, J.; Glassberg, E.; Benov, A. Mass-surveillance technologies to fight coronavirus spread: The case of Israel. Nat. Med. 2020, 26, 1167–1169. [Google Scholar] [CrossRef] [PubMed]
- Steinberg, A.; Levy-Lahad, E.; Karni, T.; Sprung, C.L. Israeli position paper: Triage decisions for severely ill patients during the COVID-19 pandemic. Chest 2020, 158, 2278–2281. [Google Scholar] [CrossRef] [PubMed]
- Naor, M.; Heyman, S.N.; Bader, T.; Merin, O. Deployment of field hospitals to disaster regions: Insights from ten medical relief operations spanning three decades. Am. J. Disaster Med. 2017, 12, 243–256. [Google Scholar] [CrossRef]
- Shapiro, G.; Tehori, O.; Zehavi, G.; Goldscher, N.; Twig, G.; Benov, A.; Fink, N.; Glassberg, E.; Shachor-Meyouhas, Y.; Hussein, K.; et al. Rapid Sequence Adaptation: Establishing the First Military COVID-19 Ward in a Large Civilian Medical Center. Health Syst. Policy Res. 2021, 8, S1:002. [Google Scholar]
- Advisory Board. President Biden declares the pandemic is “over” but some experts disagree. Daily Briefing, 19 September 2022. Available online: https://www.advisory.com/daily-briefing/2022/09/19/biden-pandemic (accessed on 24 January 2023).


| Company | Title of Subject Matter Expert Interviewed | Date |
|---|---|---|
| Eli Lilly and company | Expert in cold supply chain | 2 February 2022 |
| Teva conglomerate | Procurement manager | 21 February 2022 |
| Kupat Cholim Lehumit | CEO of logistics | 3 March 2022 |
| Kupat Cholim Clalit | Senior nurse in charge of vaccination process | 21 February 2022 |
| 1. | What is your name and role in the company? |
| 2. | How are you involved in the treatment of corona? |
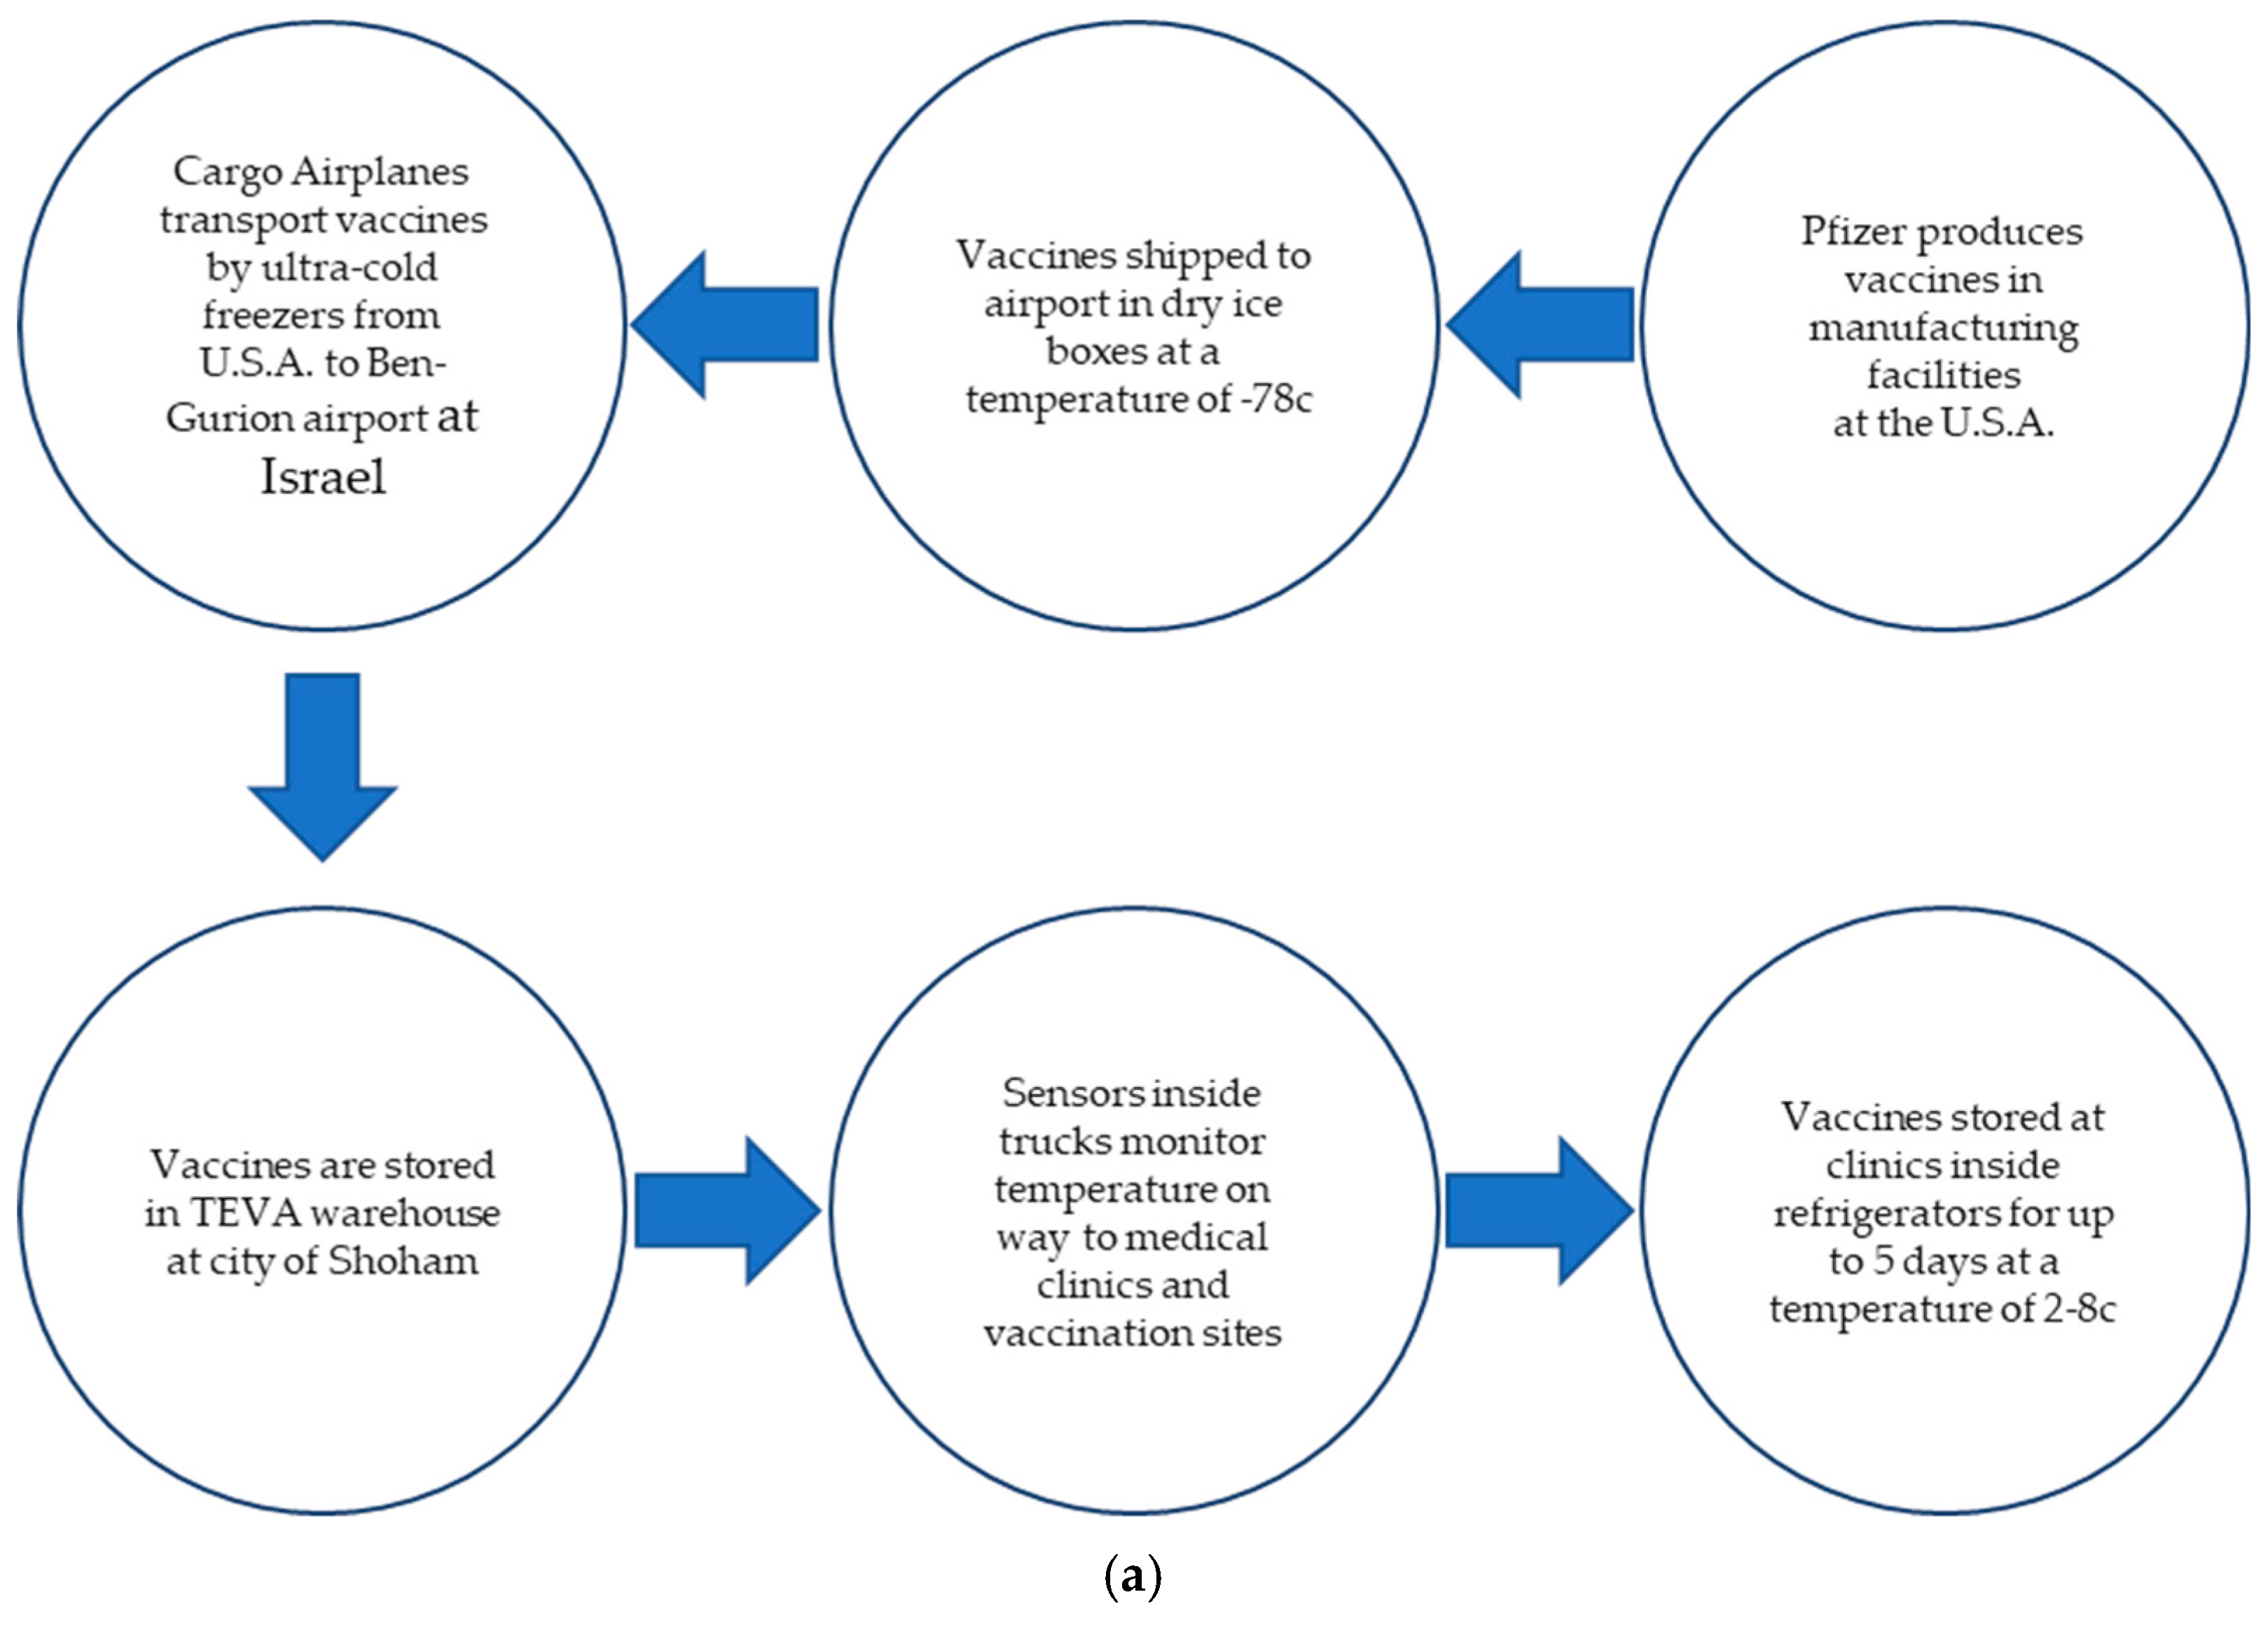
| 3. | Please explain how the vaccines were transported to Israel onboard the airplanes during flight? |
| 4. | How long did it take to transport the vaccines from the Pfizer production plant to Teva’s warehouse? |
| 5. | How many vaccines were packaged in each aircraft? |
| 6. | At what temperature were the vaccines stored onboard the airplanes during flight? |
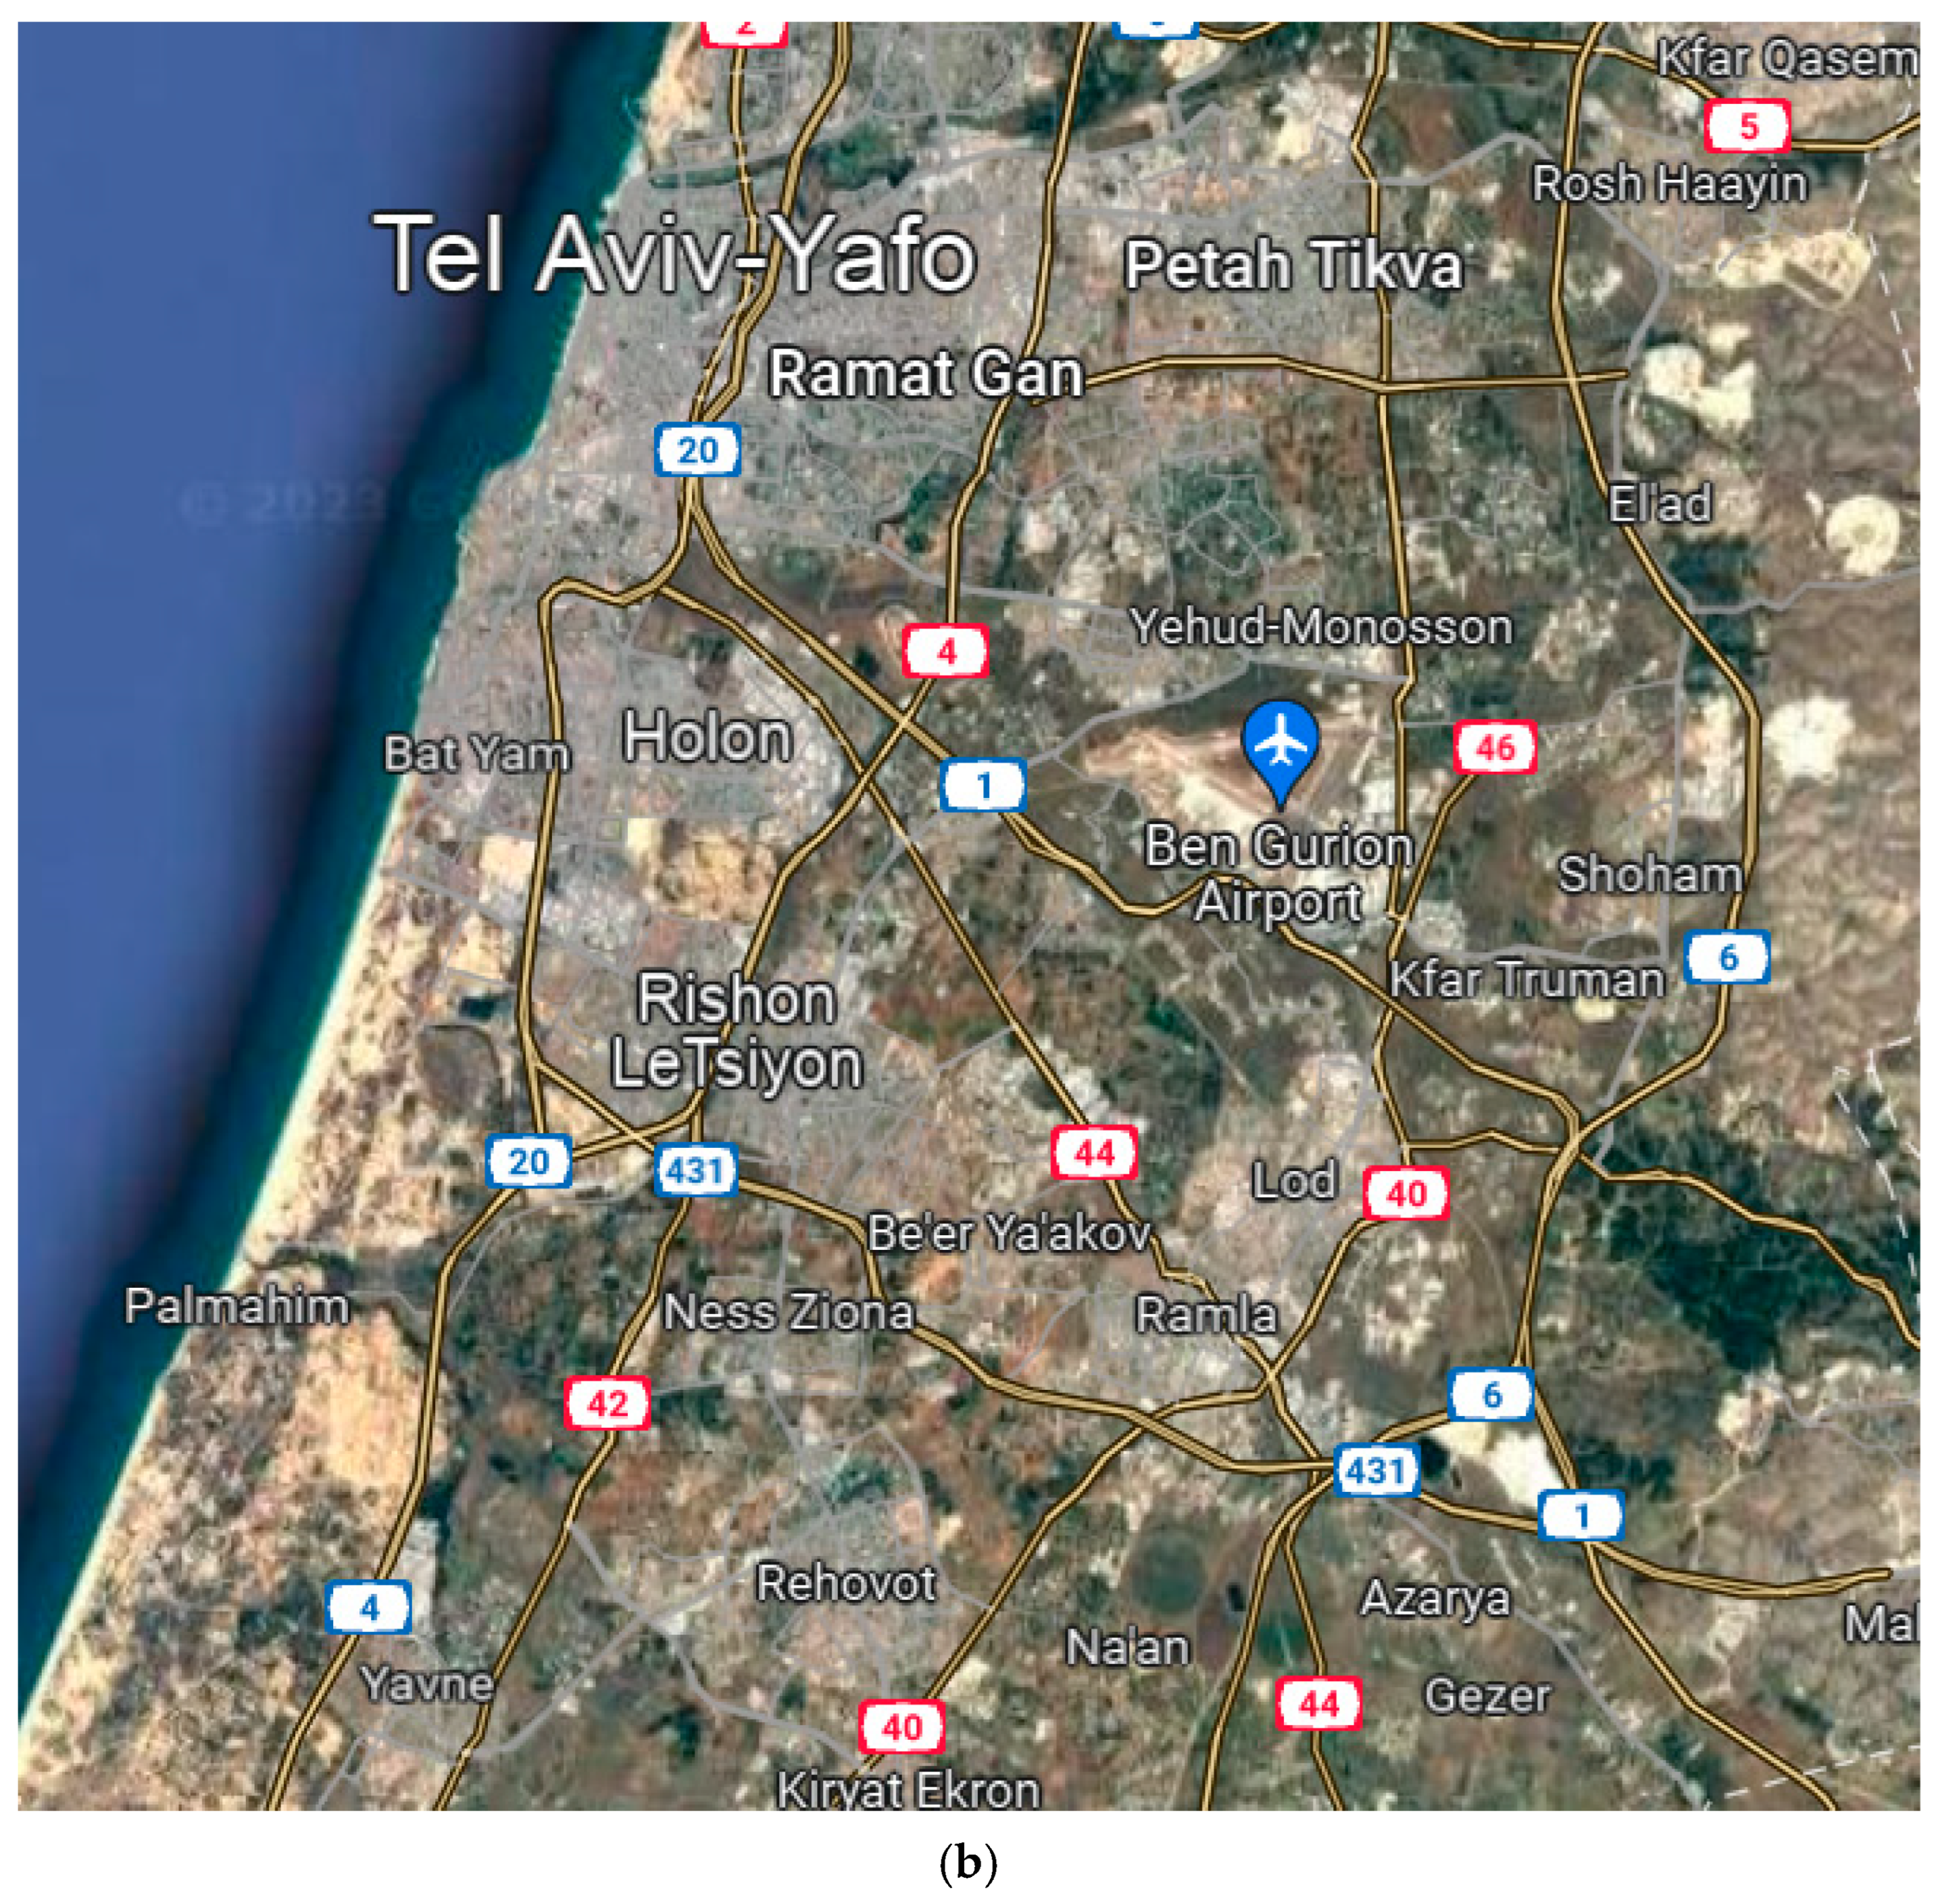
| 7. | Where vaccines were stored in Israel, and in which city? |
| 8. | Why did Teva choose the location of the logistics center in exactly this geographical place? |
| 9. | What type of refrigerators were inside the logistics center and how many vaccines were stored in each refrigerator? |
| 10. | Did employees wear a body heating suit because of the ultra-cold temperatures inside the warehouse? |
| 11. | How long could a vaccine be stored in the refrigerator of the logistics center? |
| 12. | How were the vaccines delivered to the health clinic, and how many were in each truck? |
| 13. | How long could a vaccine remain in the health clinic before it expired? |
| 14. | Was a vaccine that was almost expired thrown away or was it transferred to another country? |
| 15. | Was vaccine waste recycled? |
| 16. | What was unique about the ultra-cold supply chain? |
| 1. | What was your position in the health clinic? |
| 2. | What can you tell us about the vaccination process at the health clinic? |
| 3. | How were patients summoned for vaccination? |
| 4. | Is there a list of people who have been vaccinated on the HMO’s computer and how did people receive a message to come and get vaccinated—by phone or text message? |
| 5. | Is there a central information system for all patients in Israel? |
| 6. | Are the four health providers in Israel (Maccabi, Leumit, Meuhedet, and Clalit) sharing information about patients? |
| 7. | Where were people vaccinated (stations, sport arenas, etc.)? |
| 8. | How many people were vaccinated each day, on average? |
| 9. | How many vaccines were in each bottle? |
| 10. | How many bottles were in each tray stored in the refrigerators? |
| 11. | At what temperature were the vaccines stored at in the health clinics? |
| 12. | At what frequency each week were the vaccines shipped to the health clinics? |
| 13. | How did the bottles arrive (whether they were in a box or a cooler) and how many were in each package? |
| 14. | From which logistics center in the country were the vaccines shipped? |
| 15. | Can you recommend additional people to talk with about vaccination? |
| 16. | What was your position in the health clinic? |
| City | % Third-Dose Vaccinated | % Second-Dose Vaccinated | % First-Dose Vaccinated |
|---|---|---|---|
| Jerusalem | 34.22% | 53.09% | 61.7% |
| Tel Aviv | 59.33% | 73.42% | 76.88% |
| Haifa | 60.72% | 75.07% | 79.02% |
| Beer Sheva | 55.79% | 72.38% | 77.26% |
| Acre | 51.21% | 70.53% | 76.6% |
| Shoham | 75% | 89.97% | 90% |
| Eilat | 59.65% | 79.26% | 83.52% |
| Nazareth | 36.03% | 59.15% | 68.28% |
| Dose 1 Aggregate Inoculation | Mildly Sick People | Moderately Sick People | Severely Sick People | Daily Deaths | Infection Rate (R) | Percentage of Positive Tests | Number of Positive Tests | |
|---|---|---|---|---|---|---|---|---|
| Dose 1 Aggregate Inoculation | 1 | −0.958 ** | −0.949 ** | −0.946 ** | −0.954 ** | −0.494 ** | −0.966 ** | −0.925 ** |
| Mildly Sick | −0.958 ** | 1 | 0.991 ** | 0.985 ** | 0.935 ** | 0.362 ** | 0.968 ** | 0.914 ** |
| Moderately Sick | −0.949 ** | 0.991 ** | 1 | 0.983 ** | 0.932 ** | 0.339 ** | 0.966 ** | 0.920 ** |
| Severely Sick | −0.946 ** | 0.985 ** | 0.983 ** | 1 | 0.933 ** | 0.328 ** | 0.971 ** | 0.897 ** |
| Infection Rate (R) | −0.494 ** | 0.362 ** | 0.339 ** | 0.328 ** | 0.420 ** | 1 | 0.473 ** | 0.419 ** |
| Percentage of Positive Tests | −0.966 ** | 0.968 ** | 0.966 ** | 0.971 ** | 0.937 ** | 0.473 ** | 1 | 0.920 ** |
| Number of Positive Tests | −0.925 ** | 0.914 ** | 0.920 ** | 0.897 ** | 0.885 ** | 0.419 ** | 0.920 ** | 1 |
| Dose 2 Aggregate Inoculation | Mildly Sick People | Moderately Sick People | Severely Sick People | Daily Deaths | Infection Rate (R) | Percentage of Positive Tests | Number of Positive Tests | |
|---|---|---|---|---|---|---|---|---|
| Dose 2 Aggregate Inoculation | 1 | −0.979 ** | −0.968 ** | −0.980 ** | −0.951 ** | −0.319 ** | −0.990 ** | −0.928 ** |
| Mildly Sick | −0.979 ** | 1 | 0.988 ** | 0.988 ** | 0.922 ** | 0.234 ** | 0.967 ** | 0.909 ** |
| Moderately Sick | −0.968 ** | 0.988 ** | 1 | 0.982 ** | 0.916 ** | 0.205 * | 0.960 ** | 0.918 ** |
| Severely Sick | −0.980 ** | 0.988 ** | 0.982 ** | 1 | 0.932 ** | 0.206 * | 0.965 ** | 0.897 ** |
| Daily Deaths | −0.951 ** | 0.922 ** | 0.916 ** | 0.932 ** | 1 | 0.293 ** | 0.939 ** | 0.887 ** |
| Infection Rate (R) | −0.319 ** | 0.234 ** | 0.205 * | 0.206 * | 0.293 ** | 1 | 0.380 ** | 0.325 ** |
| Percentage of Positive Tests | −0.990 ** | 0.967 ** | 0.960 ** | 0.965 ** | 0.939 ** | 0.380 ** | 1 | 0.922 ** |
| Number of Positive Tests | −0.928 ** | 0.909 ** | 0.918 ** | 0.897 ** | 0.887 ** | 0.325 ** | 0.922 ** | 1 |
| Dose 3 Aggregate Inoculation | Mildly Sick People | Moderately Sick People | Severely Sick People | Daily Deaths | Infection Rate (R) | Percentage of Positive Tests | Number of Positive Tests | |
|---|---|---|---|---|---|---|---|---|
| Dose 3 Aggregate Inoculation | 1 | −0.813 ** | −0.803 ** | −0.657 ** | −0.765 ** | −0.820 ** | −0.843 ** | −0.770 ** |
| Mildly Sick | −0.813 ** | 1 | 0.977 ** | 0.919 ** | 0.860 ** | 0.488 ** | 0.944 ** | 0.874 ** |
| Moderately Sick | −0.803 ** | 0.977 ** | 1 | 0.930 ** | 0.875 ** | 0.492 ** | 0.940 ** | 0.868 ** |
| Severely Sick | −0.657 ** | 00.919 ** | 0.930 ** | 1 | 0.837 ** | 0.236 * | 0.882 ** | 0.793 ** |
| Daily Deaths | −0.765 ** | 0.860 ** | 0.875 ** | 0.837 ** | 1 | 0.501 ** | 0.875 ** | 0.781 ** |
| Infection Rate (R) | −0.820 ** | 0.488 ** | 0.492 ** | 00.236 * | 0.501 ** | 1 | 0.536 ** | 0.517 ** |
| Percentage of Positive Tests | −0.843 ** | 0.944 ** | 0.940 ** | 0.882 ** | 0.875 ** | 0.536 ** | 1 | 0.918 ** |
| Number of Positive Tests | −0.770 ** | 0.874 ** | 0.868 ** | 0.793 ** | 0.781 ** | 0.517 ** | 0.918 ** | 1 |
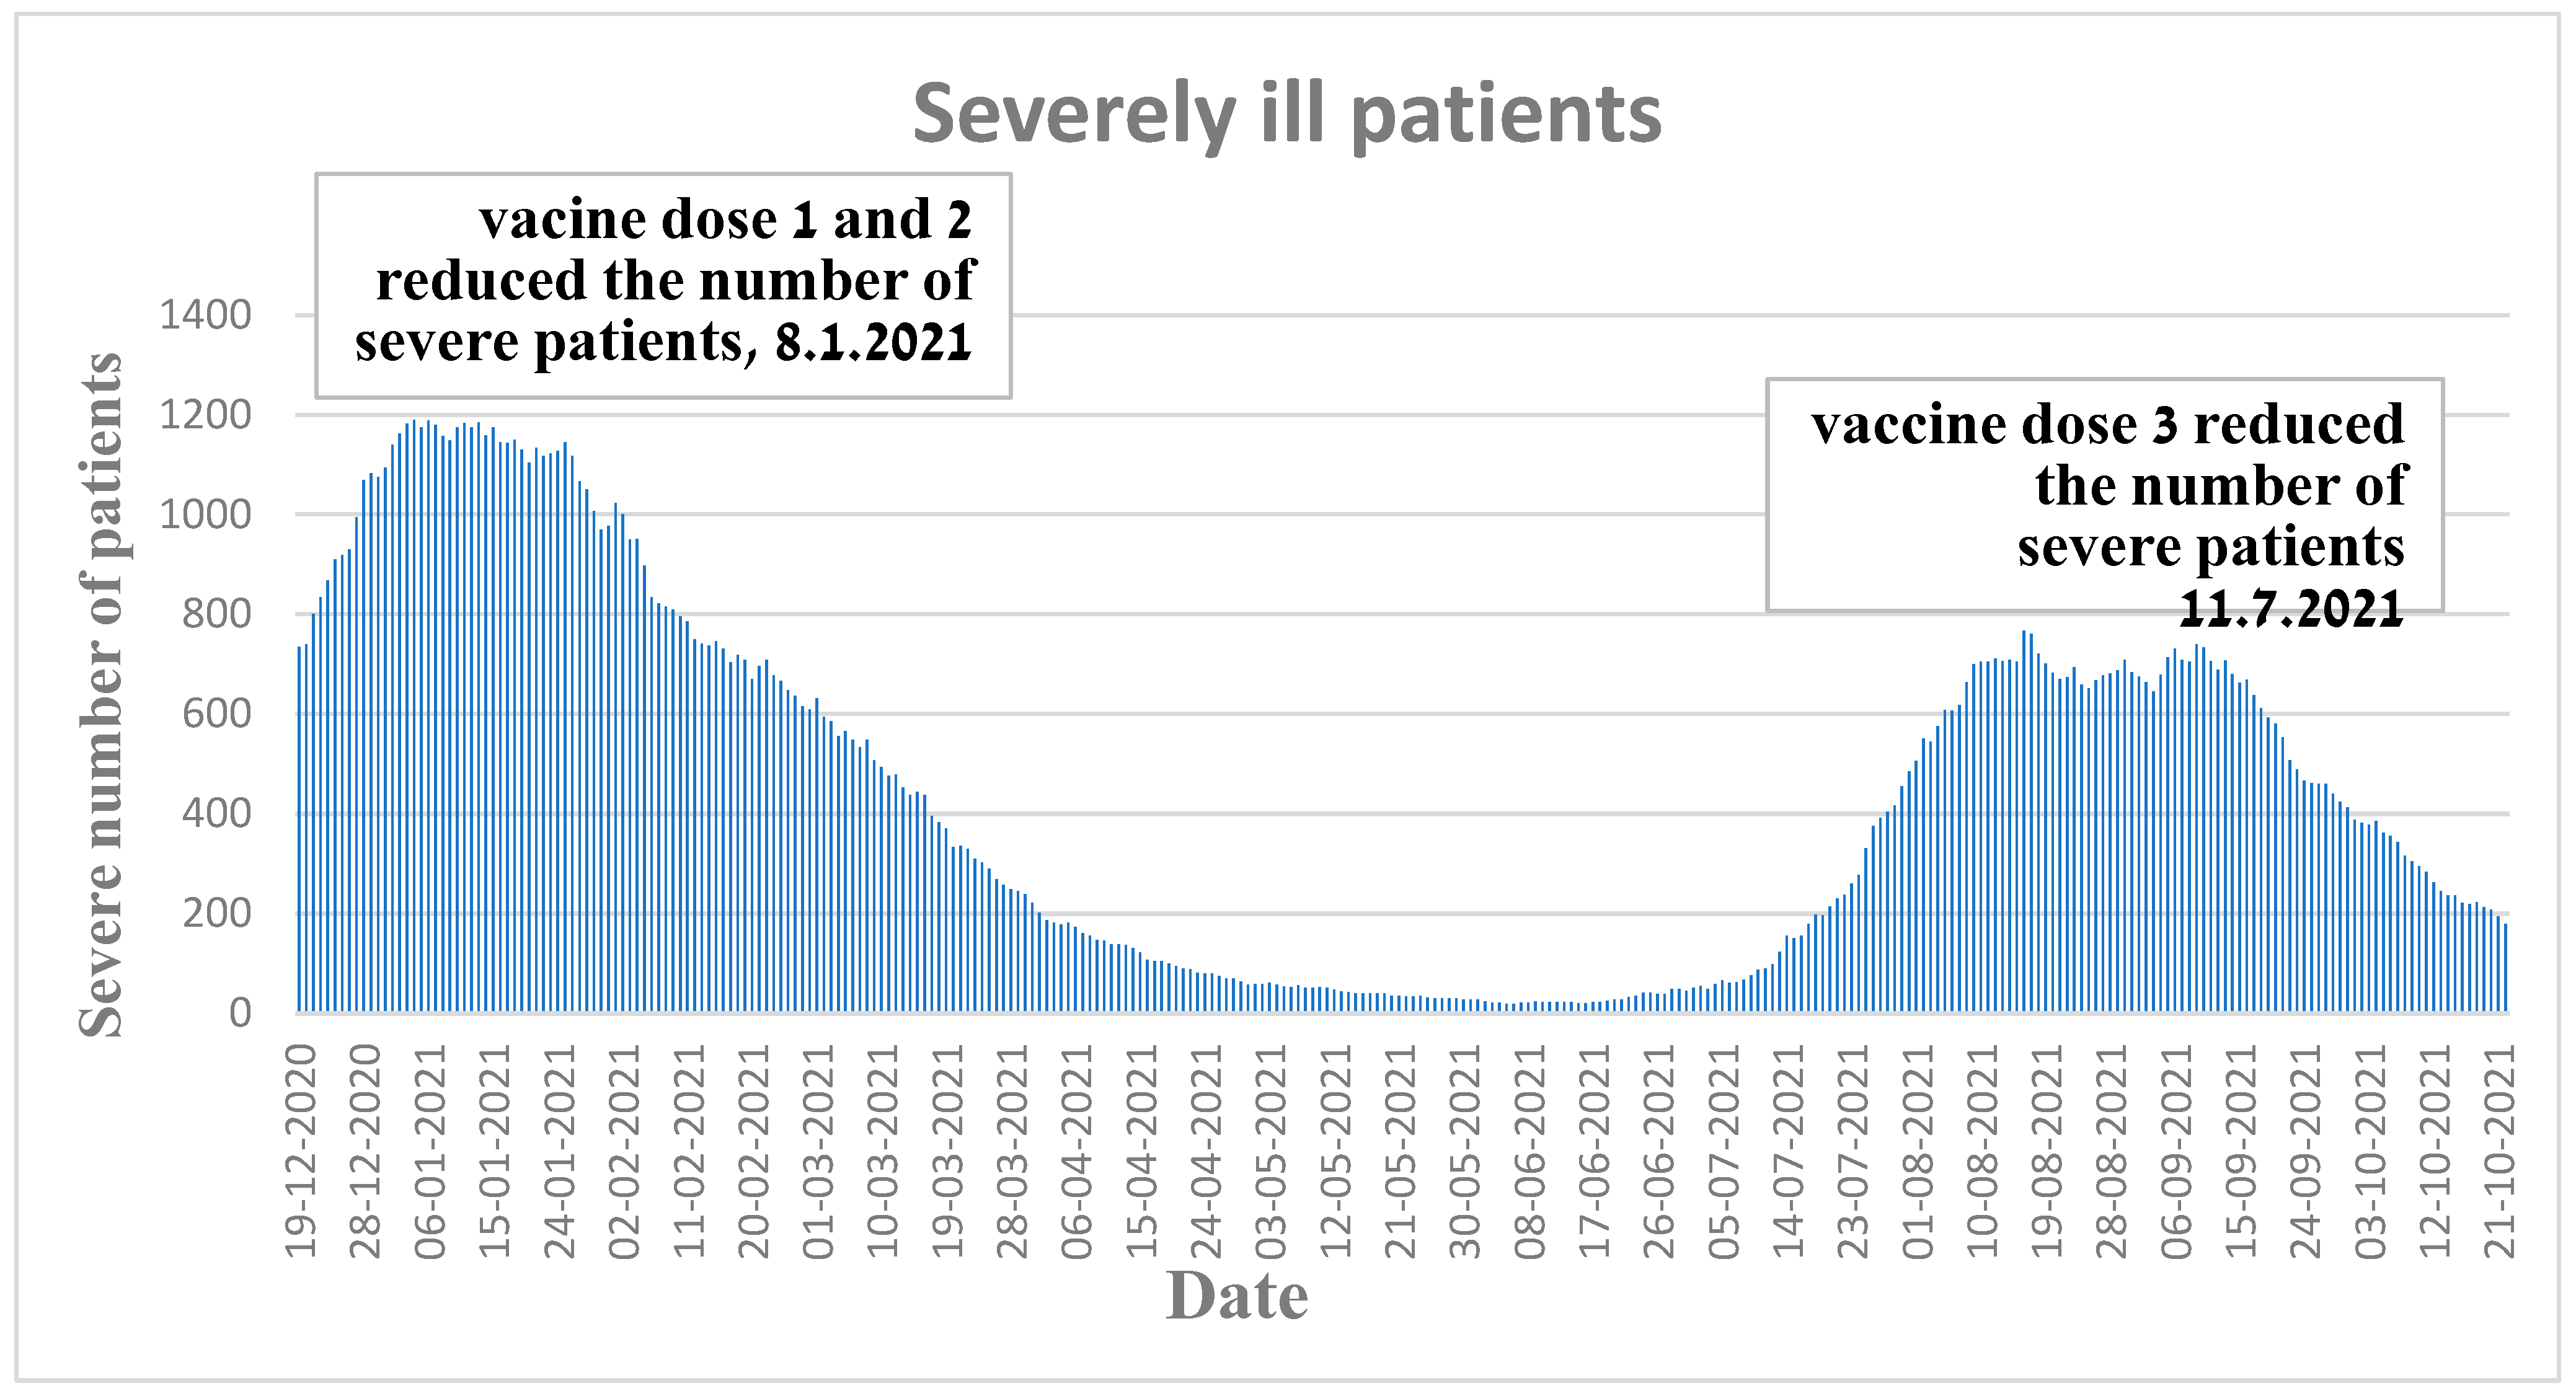
| Severely Sick | Severely Sick | Severely Sick | |
|---|---|---|---|
| Dose 1 Aggregate Inoculation | −30.167 ** | ||
| Dose 2 Aggregate Inoculation | −24.720 ** | ||
| Dose 3 Aggregate Inoculation | −9.377 ** | ||
| R-square Value | 0.894 | 0.961 | 0.431 |
| Adjusted R-square Value | 0.893 | 0.961 | 0.424 |
| F | 1173.6 | 3129.5 | 59.2 |
| Significance of F | <0.01 | <0.01 | <0.01 |
| Moderately Sick | Moderately Sick | Moderately Sick | |
|---|---|---|---|
| Dose 1 Aggregate Inoculation | −7.633 ** | ||
| Dose 2 Aggregate Inoculation | −5.887 ** | ||
| Dose 3 Aggregate Inoculation | −3.536 ** | ||
| R-square Value | 0.900 | 0.937 | 0.645 |
| Adjusted R-square Value | 0.899 | 0.937 | 0.641 |
| F | 33.2 | 1894.2 | 141.9 |
| Significance of F | <0.01 | <0.01 | <0.01 |
| Mildly Sick | Mildly Sick | Mildly Sick | |
|---|---|---|---|
| Dose 1 Aggregate Inoculation | −16.584 ** | ||
| Dose 2 Aggregate Inoculation | −12.614 ** | ||
| Dose 3 Aggregate Inoculation | −8.842 ** | ||
| R-square Value | 0.918 | 0.959 | 0.660 |
| Adjusted R-square Value | 0.917 | 0.958 | 0.656 |
| F | 1553.7 | 2935.8 | 151.5 |
| Significance of F | <0.01 | <0.01 | <0.01 |
| Daily Deaths | Daily Deaths | Daily Deaths | |
|---|---|---|---|
| Dose 1 Aggregate Inoculation | −1.386 ** | ||
| Dose 2 Aggregate Inoculation | −0.987 ** | ||
| Dose 3 Aggregate Inoculation | −0.561 ** | ||
| R-square Value | 0.909 | 0.905 | 0.585 |
| Adjusted R-square Value | 0.909 | 0.904 | 0.579 |
| F | 1392.2 | 1203.8 | 109.7 |
| Significance of F | <0.01 | <0.01 | <0.01 |
| Infection Rate (R) | Infection Rate (R) | Infection Rate (R) | |
|---|---|---|---|
| Dose 1 Aggregate Inoculation | −0.005 ** | ||
| Dose 2 Aggregate Inoculation | −0.003 ** | ||
| Dose 3 Aggregate Inoculation | −0.010 ** | ||
| R-square Value | 0.244 | 0.102 | 0.673 |
| Adjusted R-square Value | 0.238 | 0.095 | 0.669 |
| F | 44.8 | 14.4 | 160.4 |
| Significance of F | <0.01 | <0.01 | <0.01 |
| Percentage of Positive Tests | Percentage of Positive Tests | Percentage of Positive Tests | |
|---|---|---|---|
| Dose 1 Aggregate Inoculation | −0.264 ** | ||
| Dose 2 Aggregate Inoculation | −0.213 ** | ||
| Dose 3 Aggregate Inoculation | −0.165 ** | ||
| R-square Value | 0.934 | 0.980 | 0.710 |
| Adjusted R-square Value | 0.934 | 0.980 | 0.706 |
| F | 1968.1 | 6142.5 | 191.1 |
| Significance of F | <0.01 | <0.01 | <0.01 |
| Number of Positive Tests | Number of Positive Tests | Number of Positive Tests | |
|---|---|---|---|
| Dose 1 Aggregate Inoculation | −200.482 ** | ||
| Dose 2 Aggregate Inoculation | −146.884 ** | ||
| Dose 3 Aggregate Inoculation | −230.507 ** | ||
| R-square Value | 0.856 | 0.861 | 0.592 |
| Adjusted R-square Value | 0.855 | 0.860 | 0.587 |
| F | 826.4 | 787.2 | 113.2 |
| Significance of F | <0.01 | <0.01 | <0.01 |
Disclaimer/Publisher’s Note: The statements, opinions and data contained in all publications are solely those of the individual author(s) and contributor(s) and not of MDPI and/or the editor(s). MDPI and/or the editor(s) disclaim responsibility for any injury to people or property resulting from any ideas, methods, instructions or products referred to in the content. |
© 2023 by the authors. Licensee MDPI, Basel, Switzerland. This article is an open access article distributed under the terms and conditions of the Creative Commons Attribution (CC BY) license (https://creativecommons.org/licenses/by/4.0/).
Share and Cite
Naor, M.; Pinto, G.D.; Davidov, P.; Abdrbo, L. Rapidly Establishing an Ultra-Cold Supply Chain of Vaccines in Israel: Evidence for the Efficacy of Inoculation to Mitigate the COVID-19 Pandemic. Vaccines 2023, 11, 349. https://doi.org/10.3390/vaccines11020349
Naor M, Pinto GD, Davidov P, Abdrbo L. Rapidly Establishing an Ultra-Cold Supply Chain of Vaccines in Israel: Evidence for the Efficacy of Inoculation to Mitigate the COVID-19 Pandemic. Vaccines. 2023; 11(2):349. https://doi.org/10.3390/vaccines11020349
Chicago/Turabian StyleNaor, Michael, Gavriel David Pinto, Pini Davidov, and Lina Abdrbo. 2023. "Rapidly Establishing an Ultra-Cold Supply Chain of Vaccines in Israel: Evidence for the Efficacy of Inoculation to Mitigate the COVID-19 Pandemic" Vaccines 11, no. 2: 349. https://doi.org/10.3390/vaccines11020349