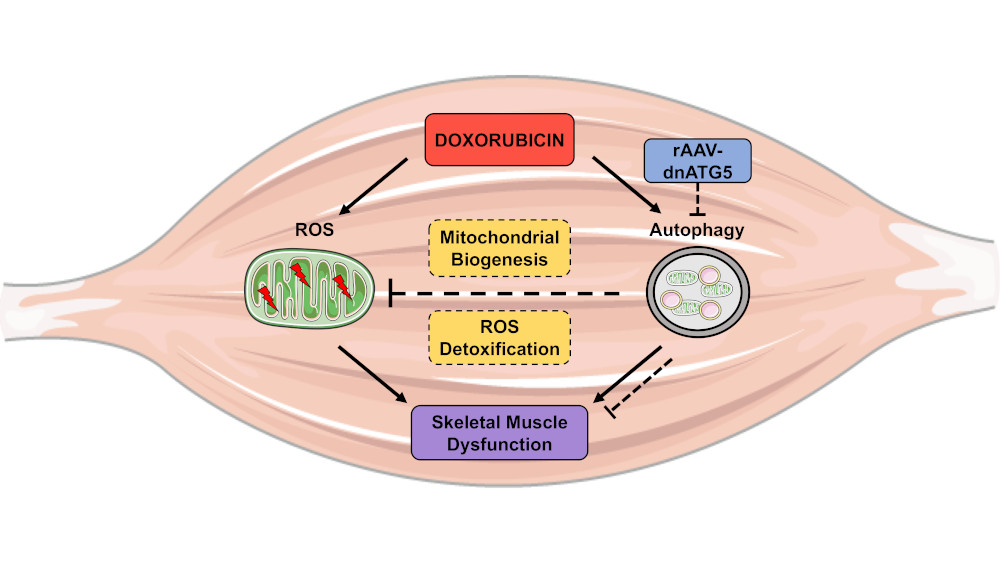
Prevention of Doxorubicin-Induced Autophagy Attenuates Oxidative Stress and Skeletal Muscle Dysfunction

 ,
,  , ,
, , 
Abstract
:
1. Introduction
2. Materials and Methods
2.1. Animals
2.2. Experimental Design
2.2.1. Experiment 1
2.2.2. Experiment 2
2.3. Experimental Protocol
2.3.1. Packaging and Purification of Recombinant AAV Vectors
2.3.2. Muscle Cross-Sectional Area
2.3.3. In Vitro Muscle Contractile Properties
2.3.4. Electron Microscopy
2.3.5. Muscle Fiber Permeabilization
2.3.6. Mitochondrial Respiration
2.3.7. Mitochondrial ROS Emission
2.3.8. DOX Concentration
2.3.9. Western Blot Analysis
2.3.10. RNA Isolation and cDNA Synthesis
2.3.11. Real-Time Polymerase Chain Reaction
2.4. Statistical Analysis
3. Results
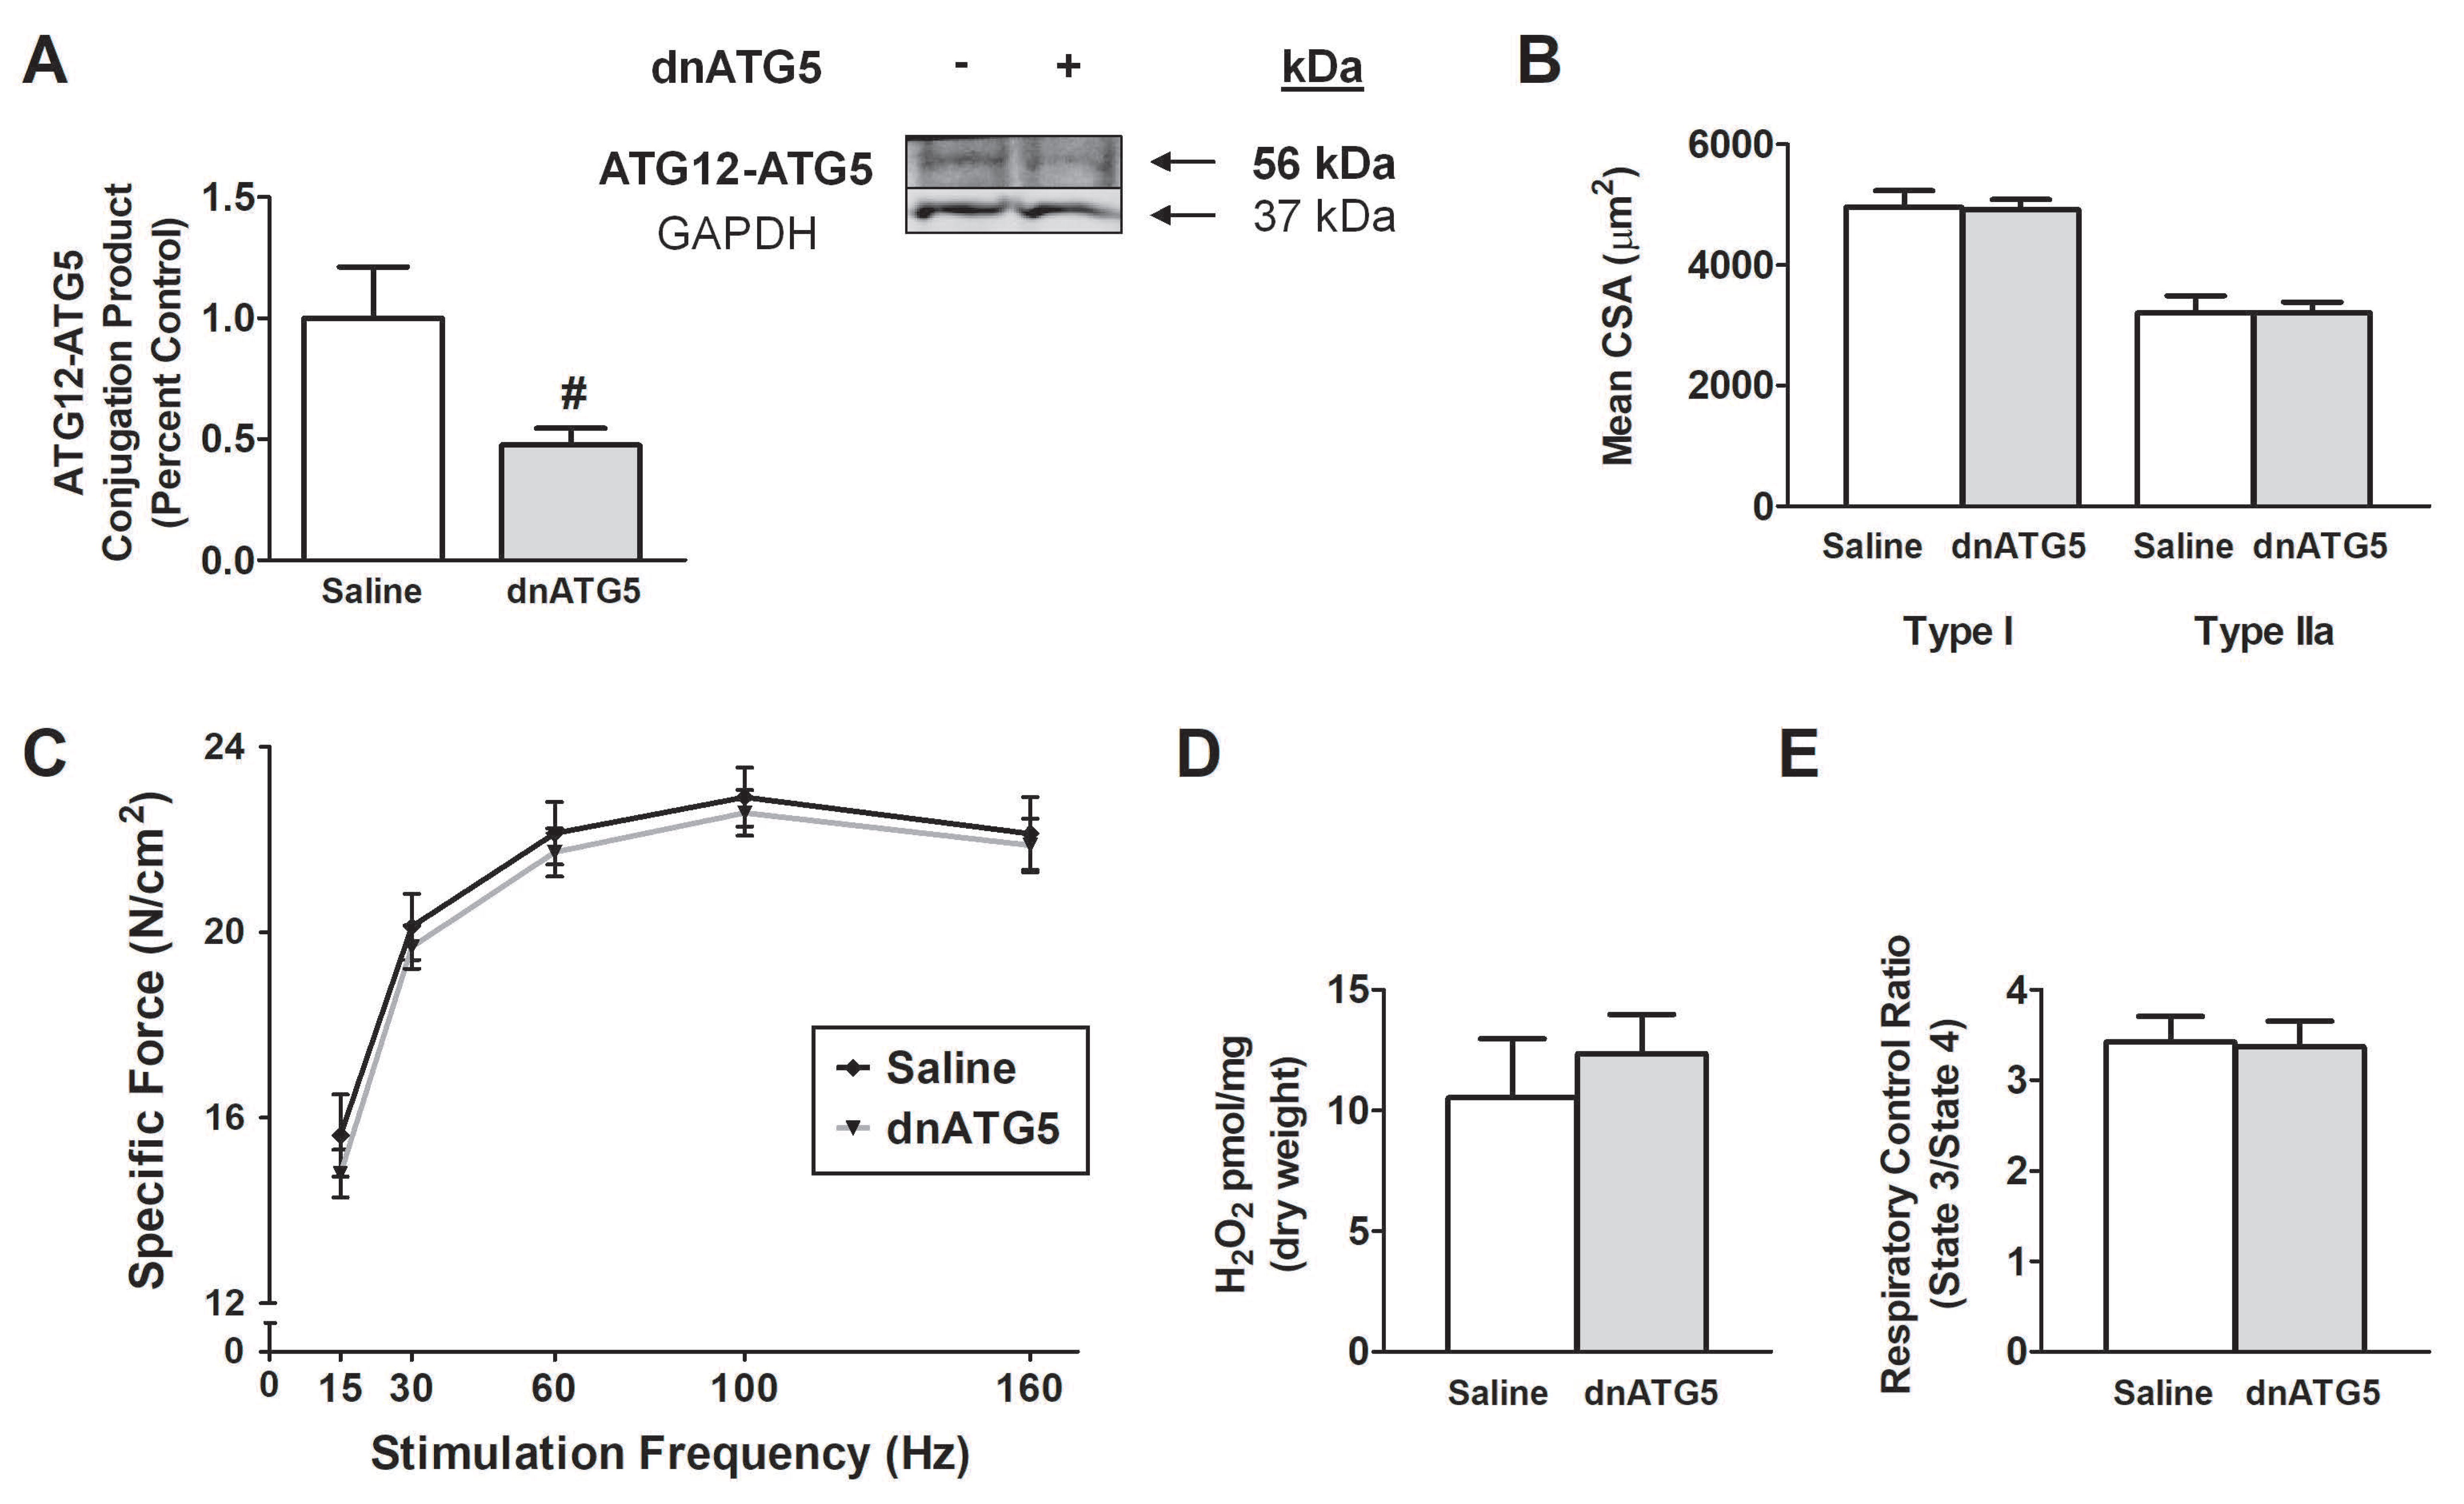
3.1. Experiment 1
Physiological Response to rAAV-dnATG5 Treatment
3.2. Experiment 2
3.2.1. Systemic Effects of DOX on Body Weight and Soleus Mass
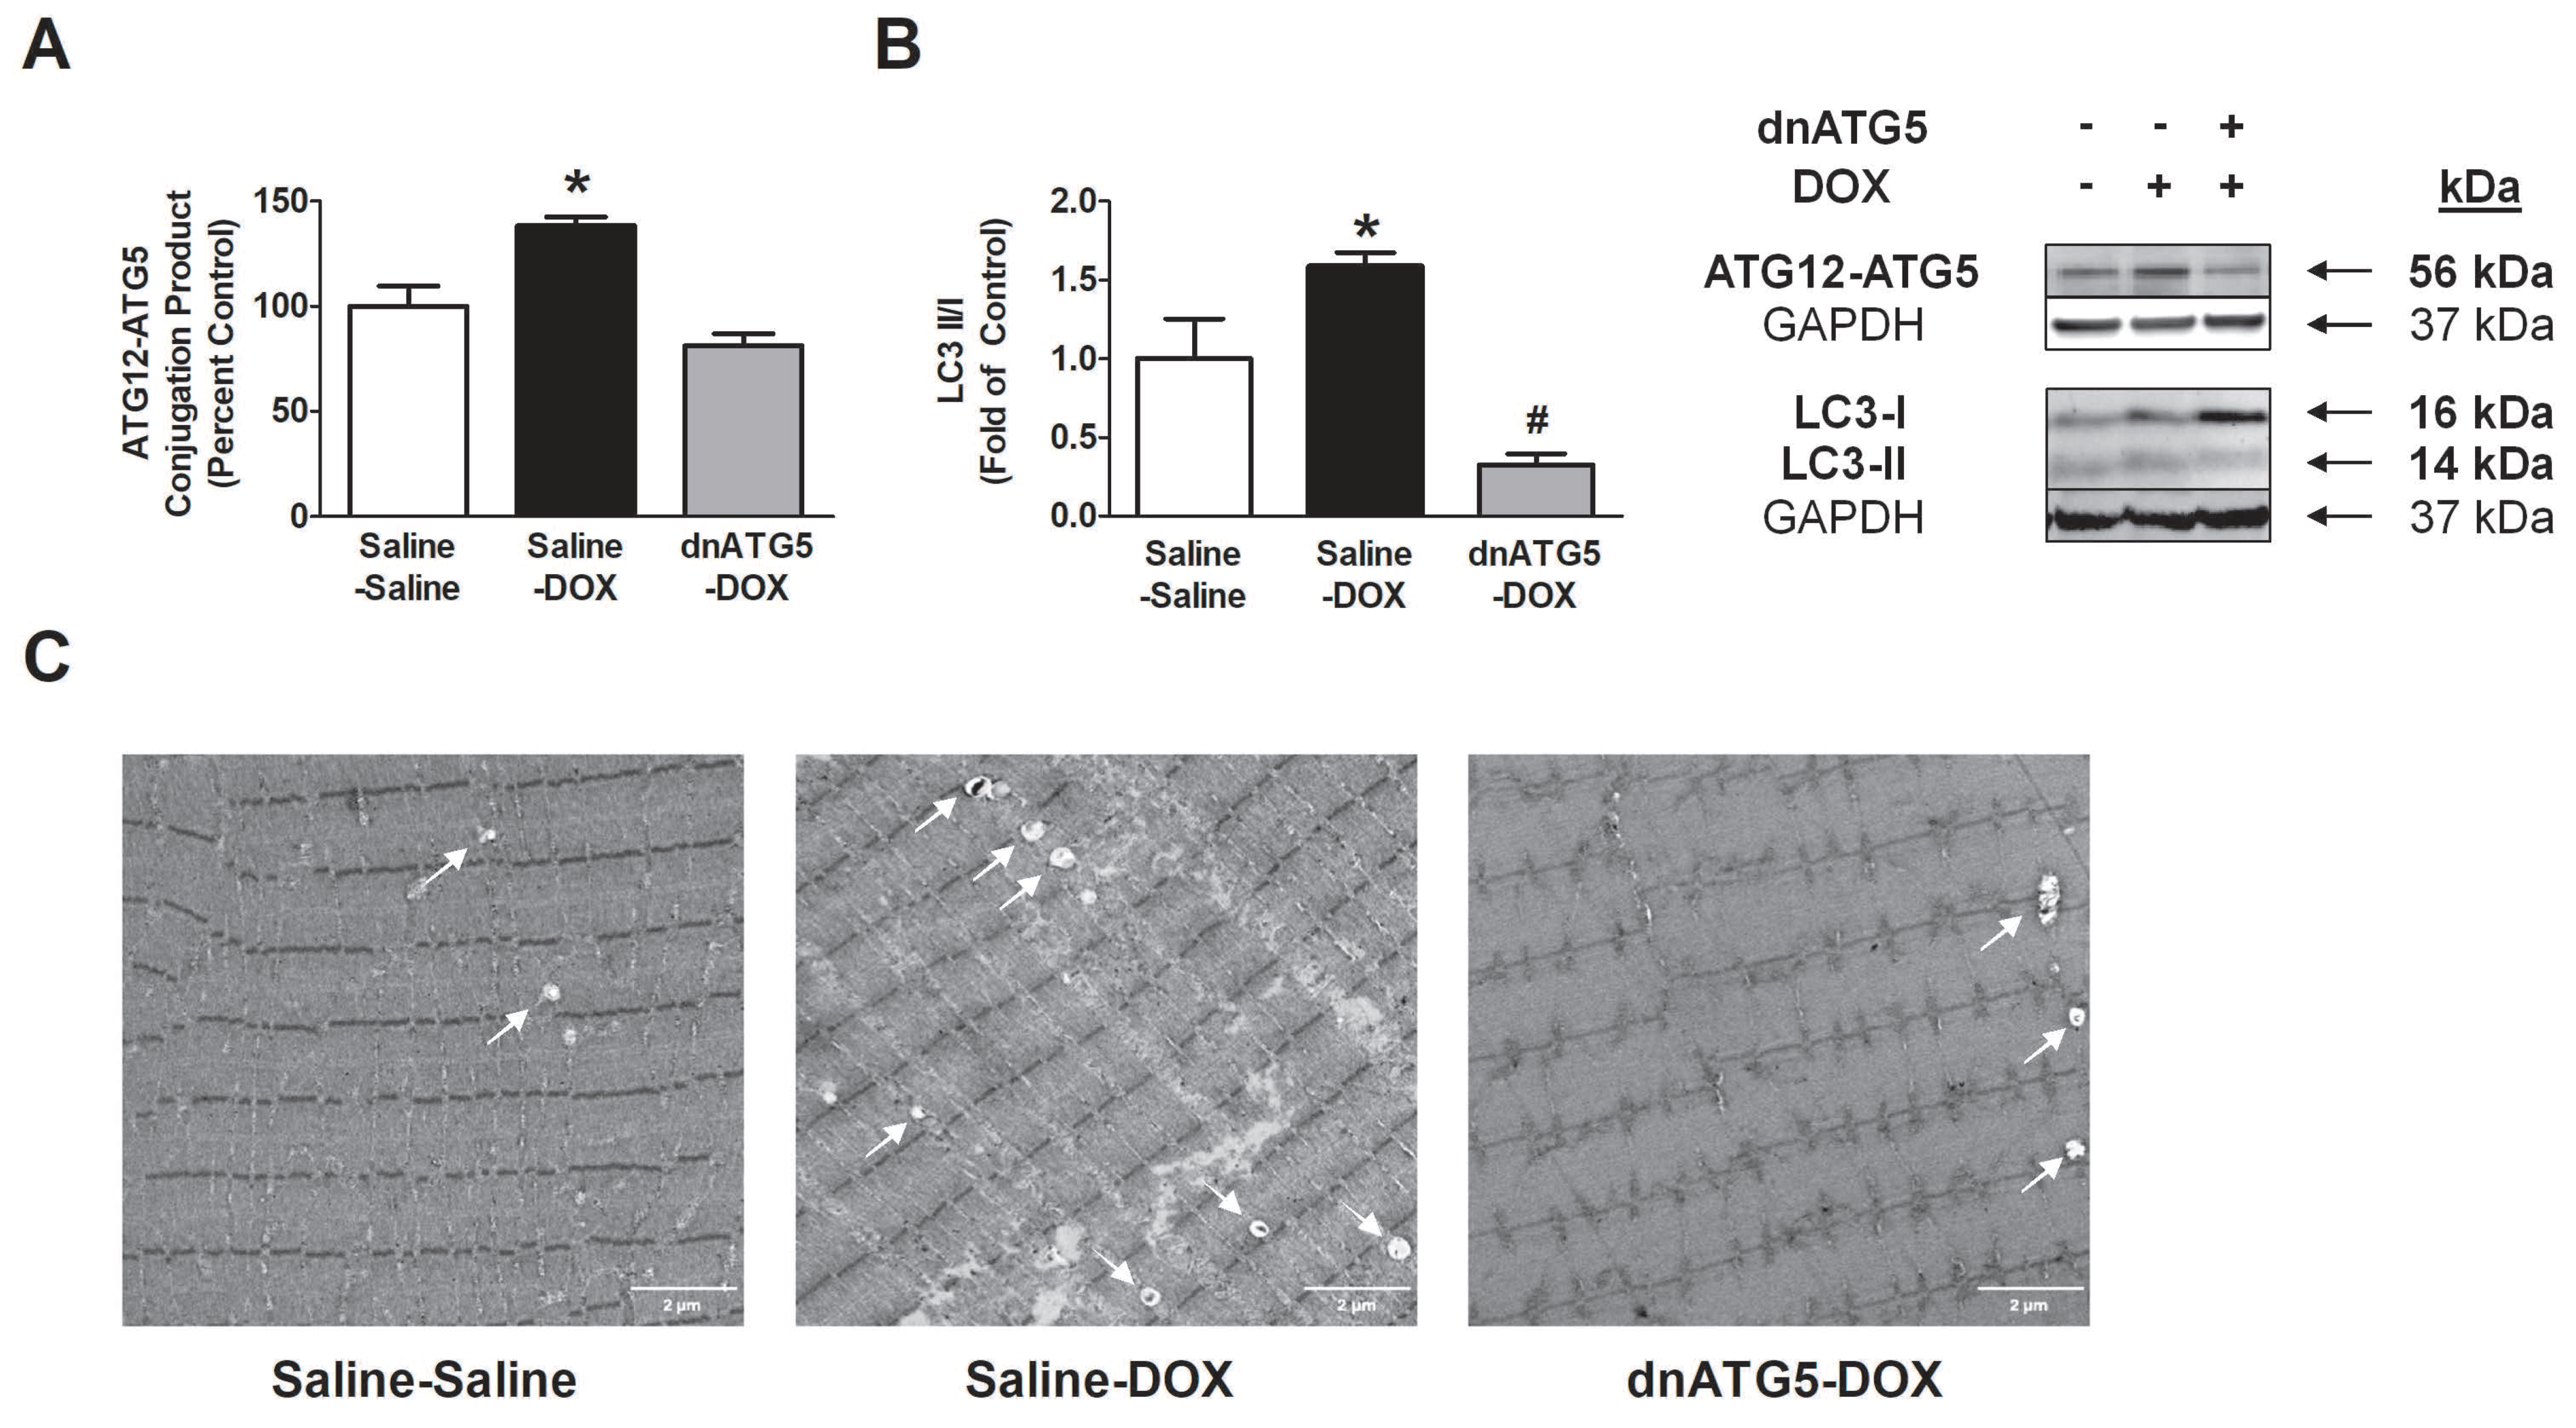
3.2.2. rAAV-dnATG5 Prevented ATG12-ATG5 Conjugation and Reduced Autophagosome Formation in DOX-Treated Animals
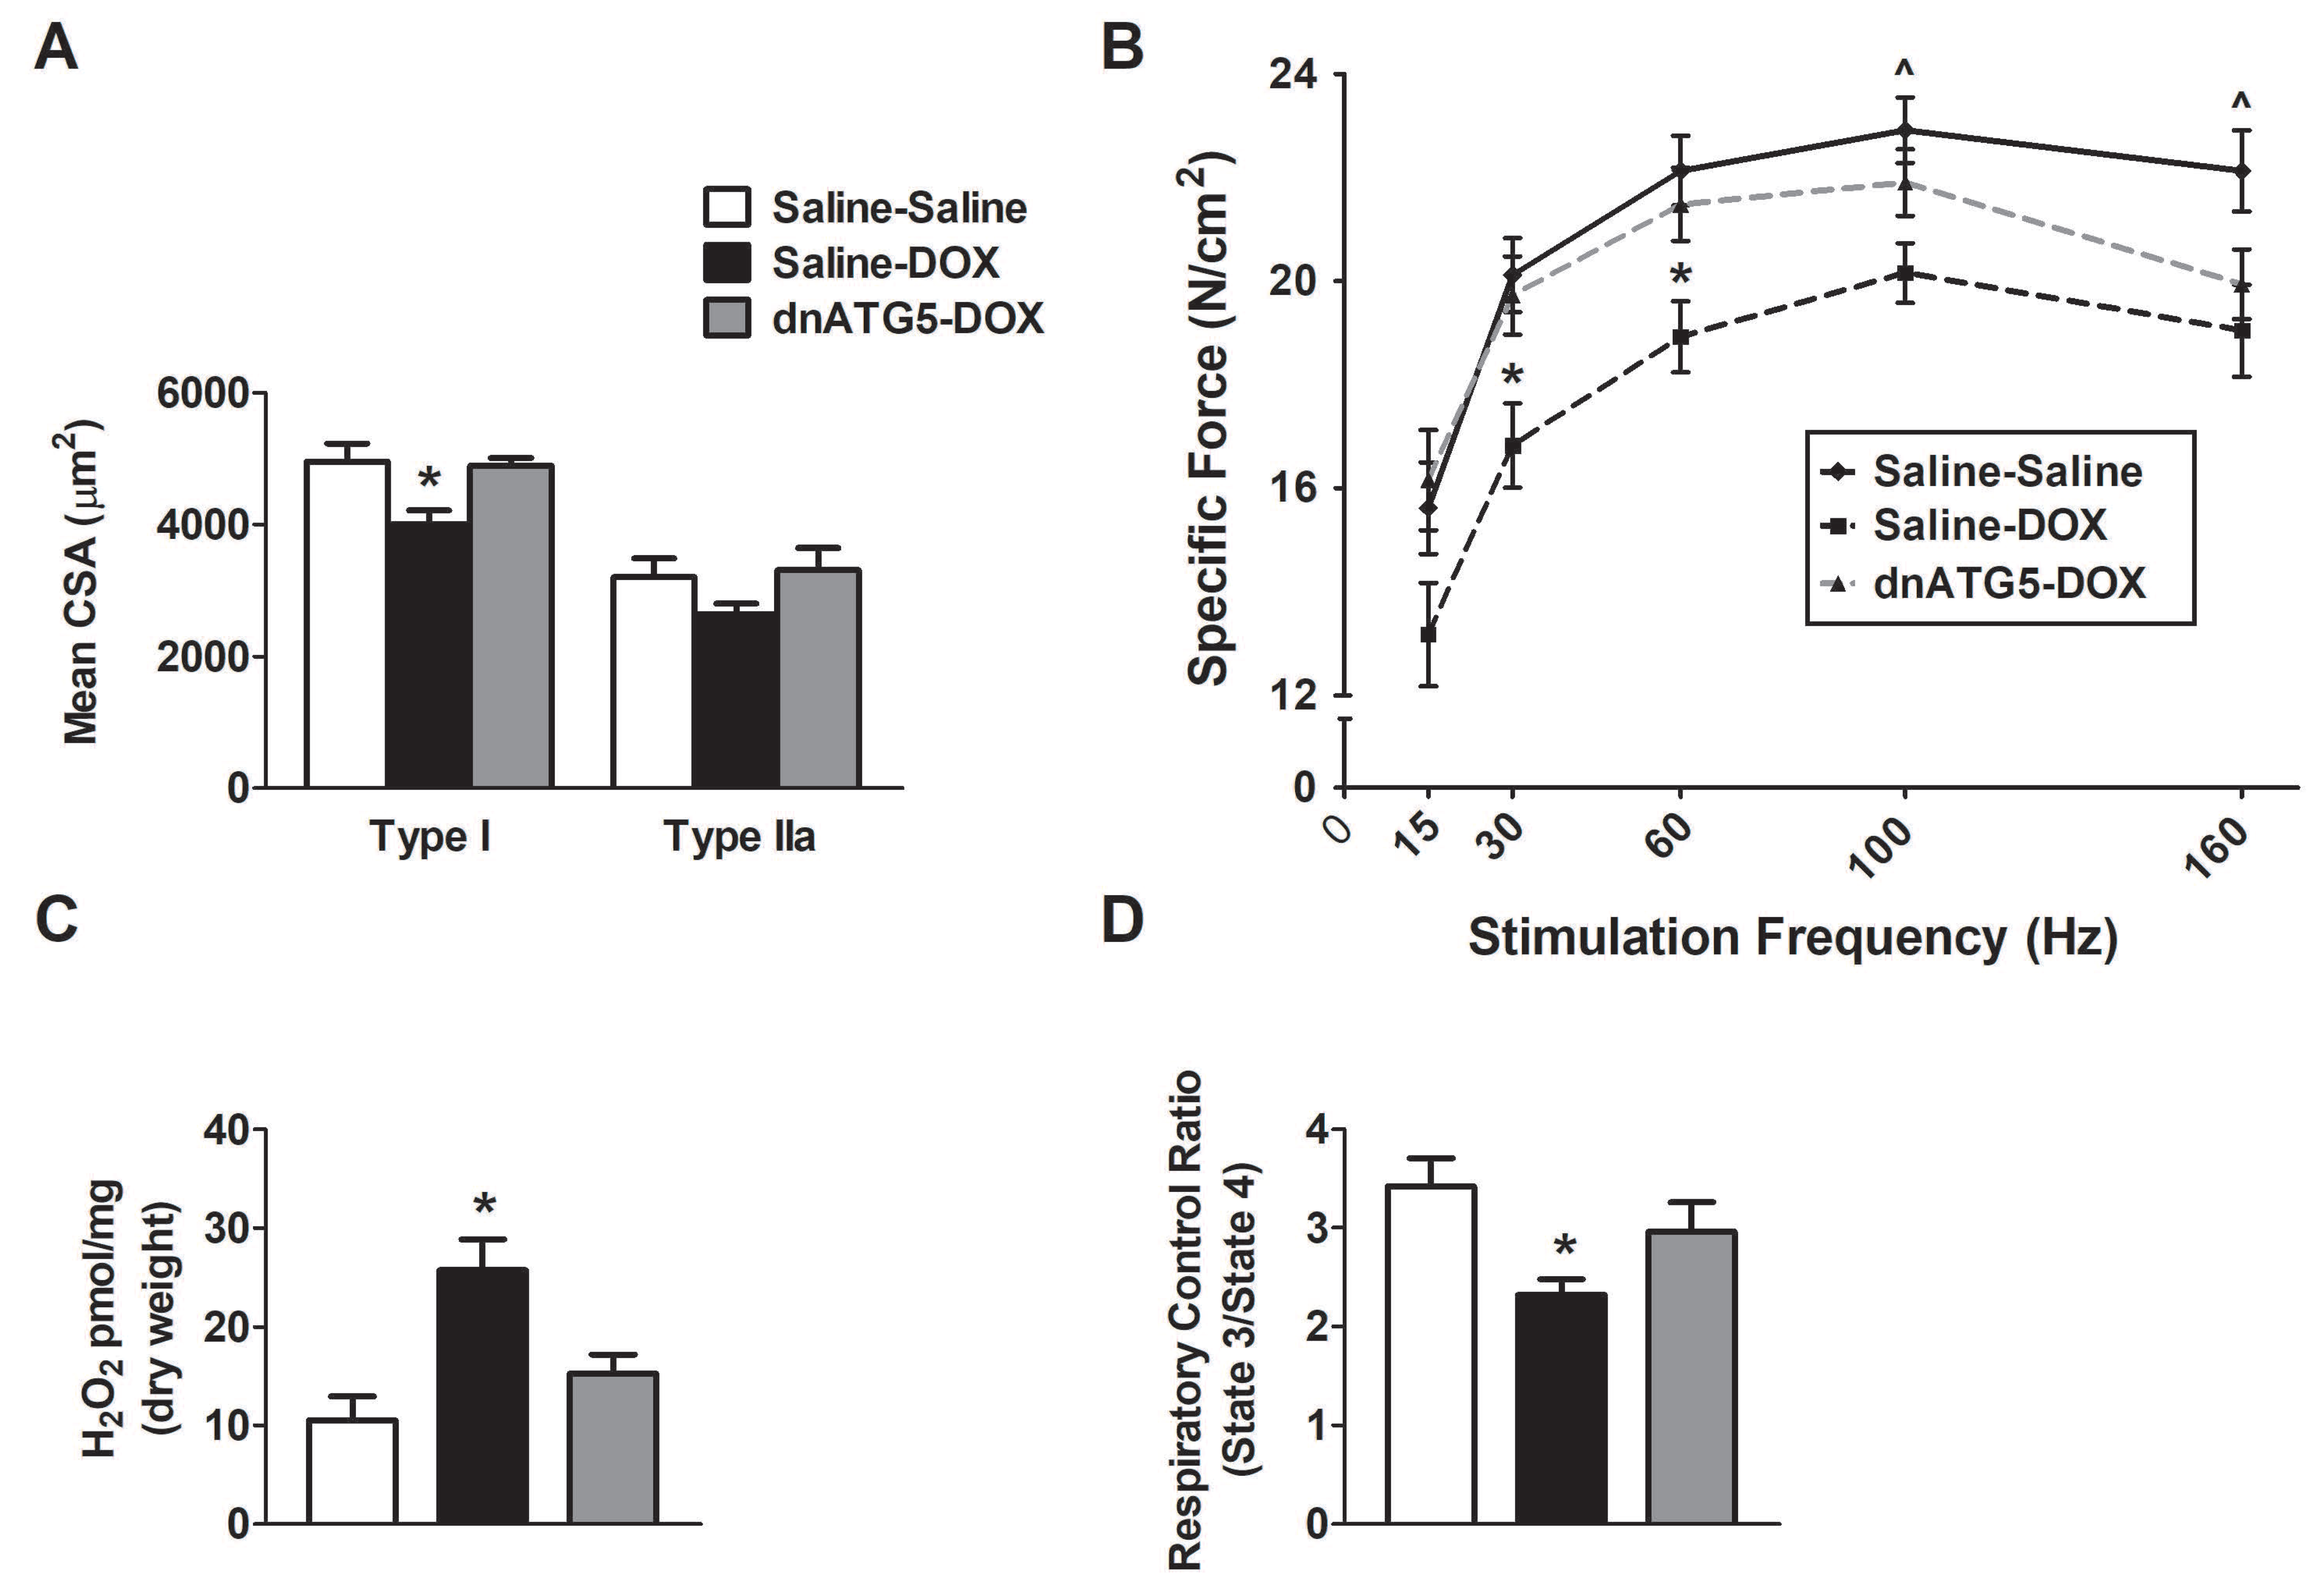
3.2.3. Autophagy Inhibition Prevented DOX-Induced Soleus Muscle Weakness and Mitochondrial Dysfunction
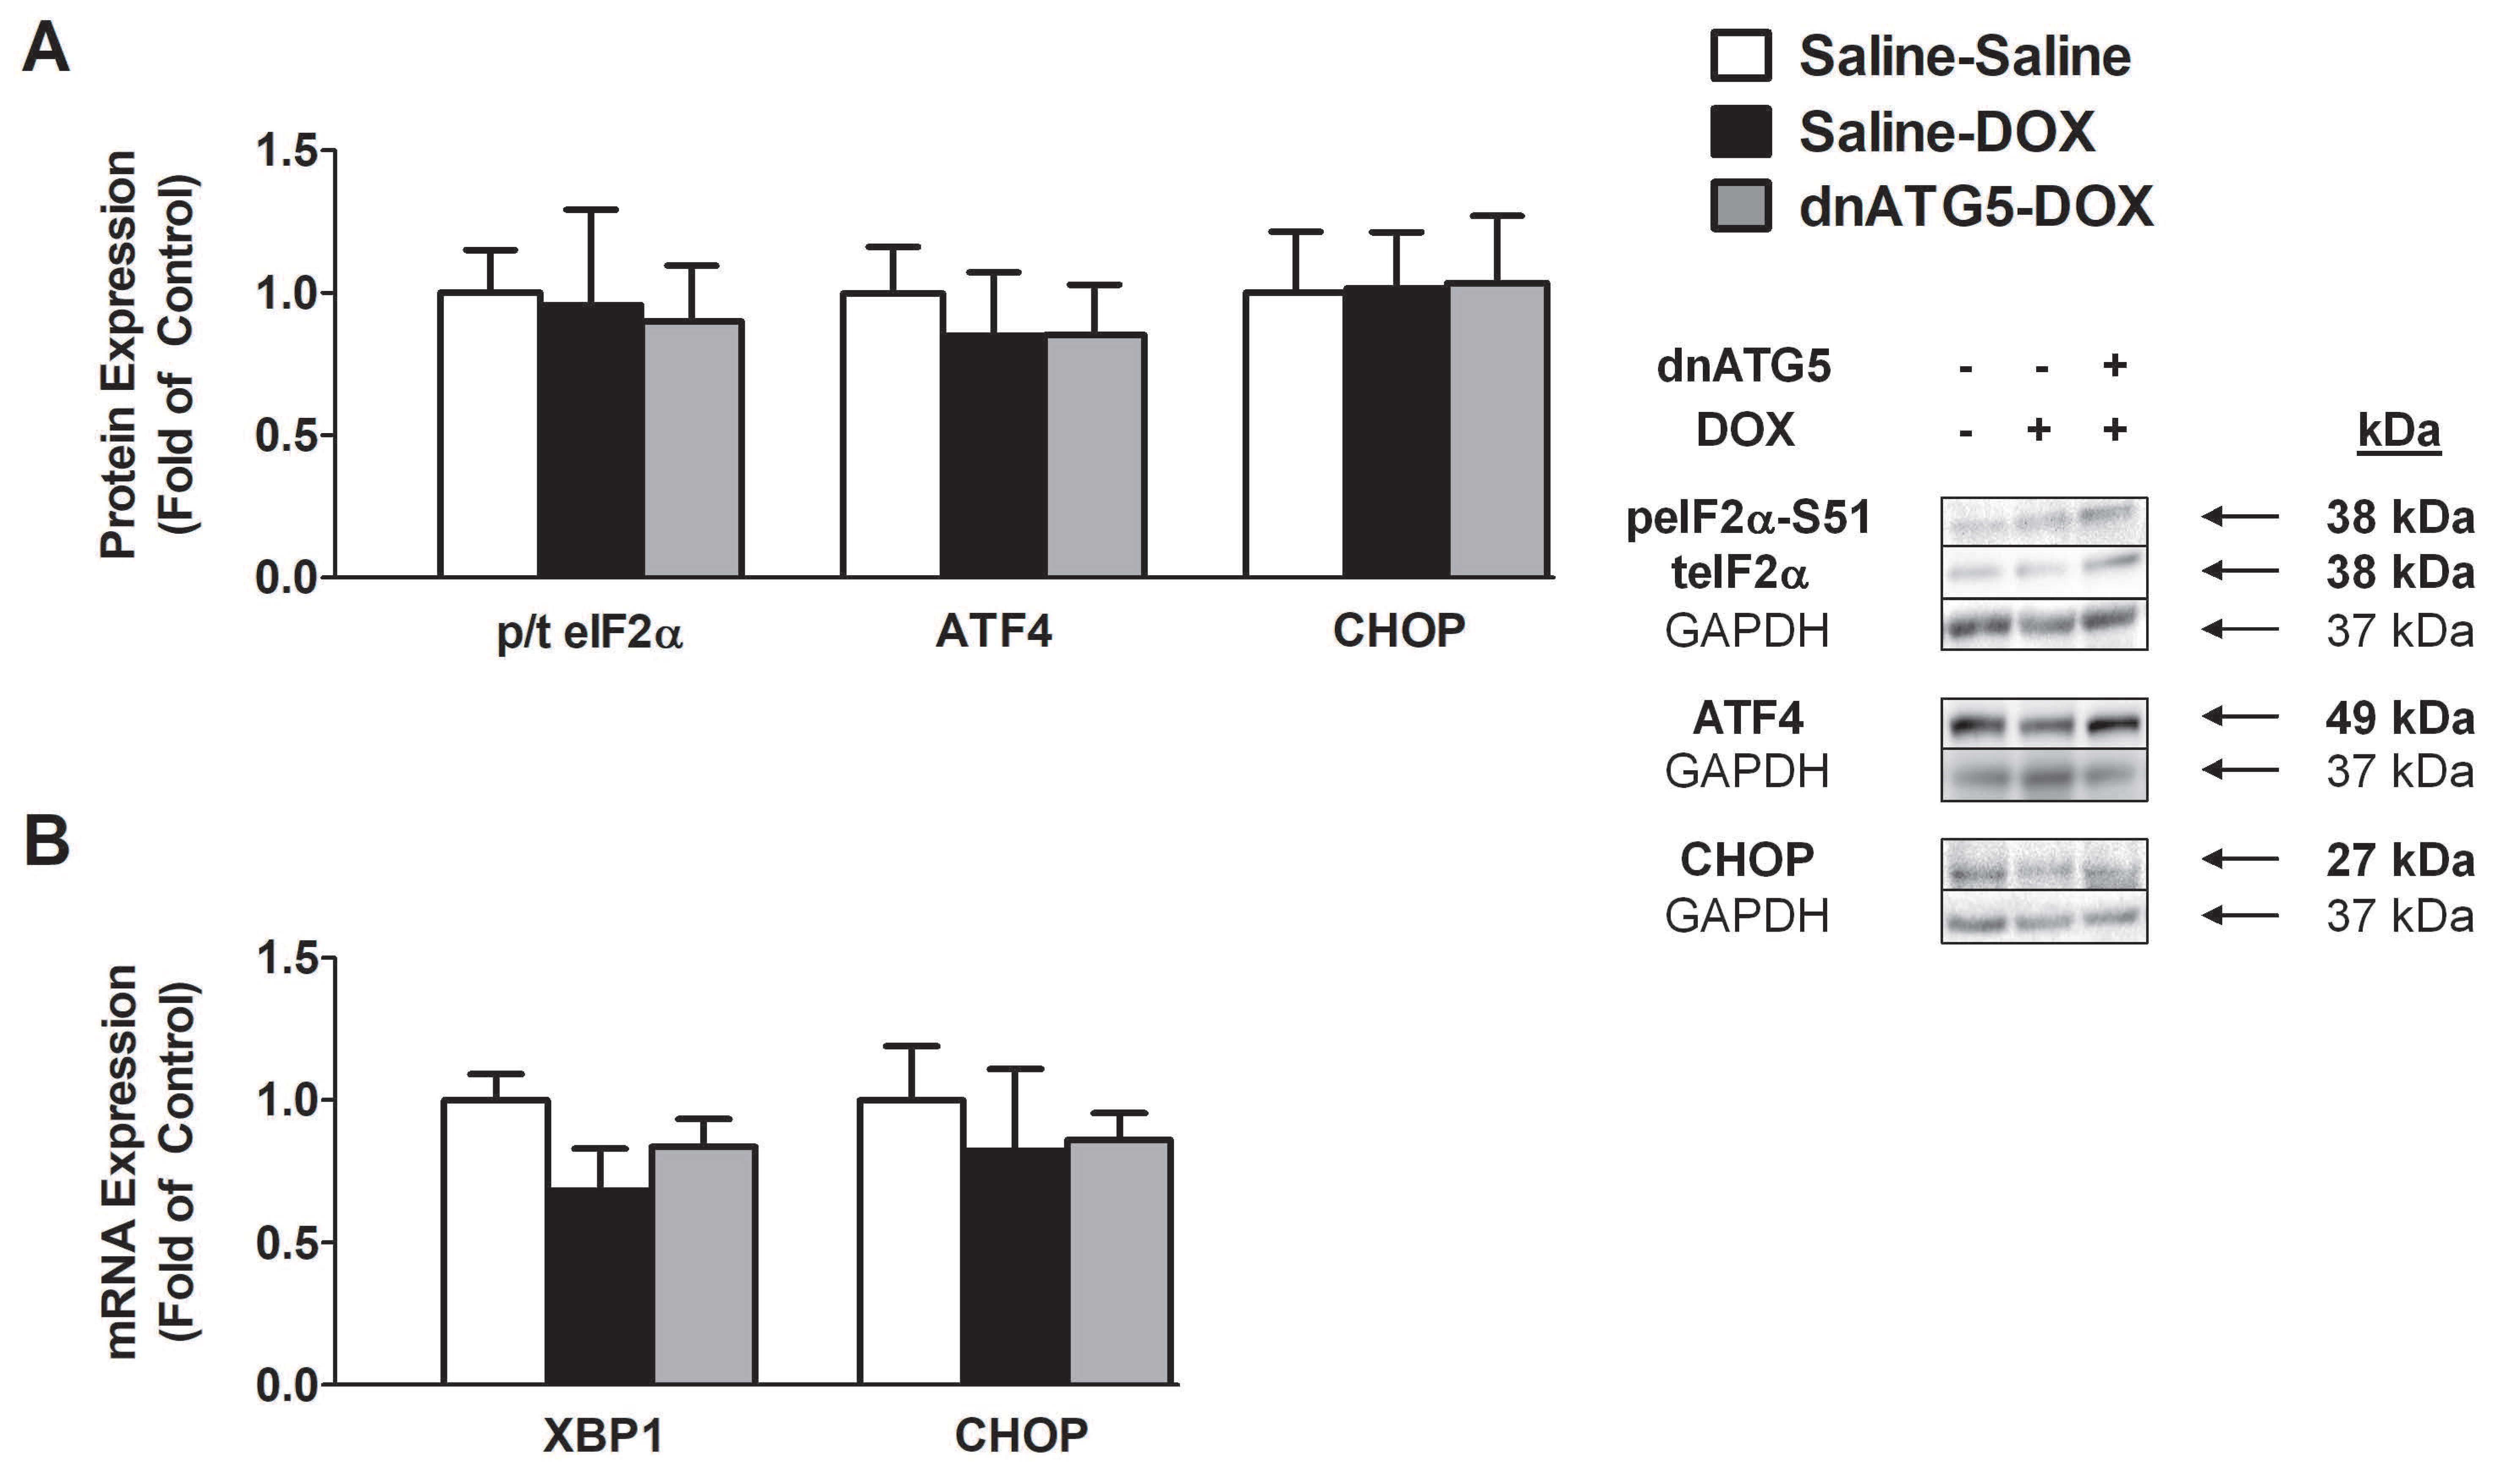
3.2.4. DOX did not Enhance Endoplasmic Reticulum Stress Signaling in the Soleus
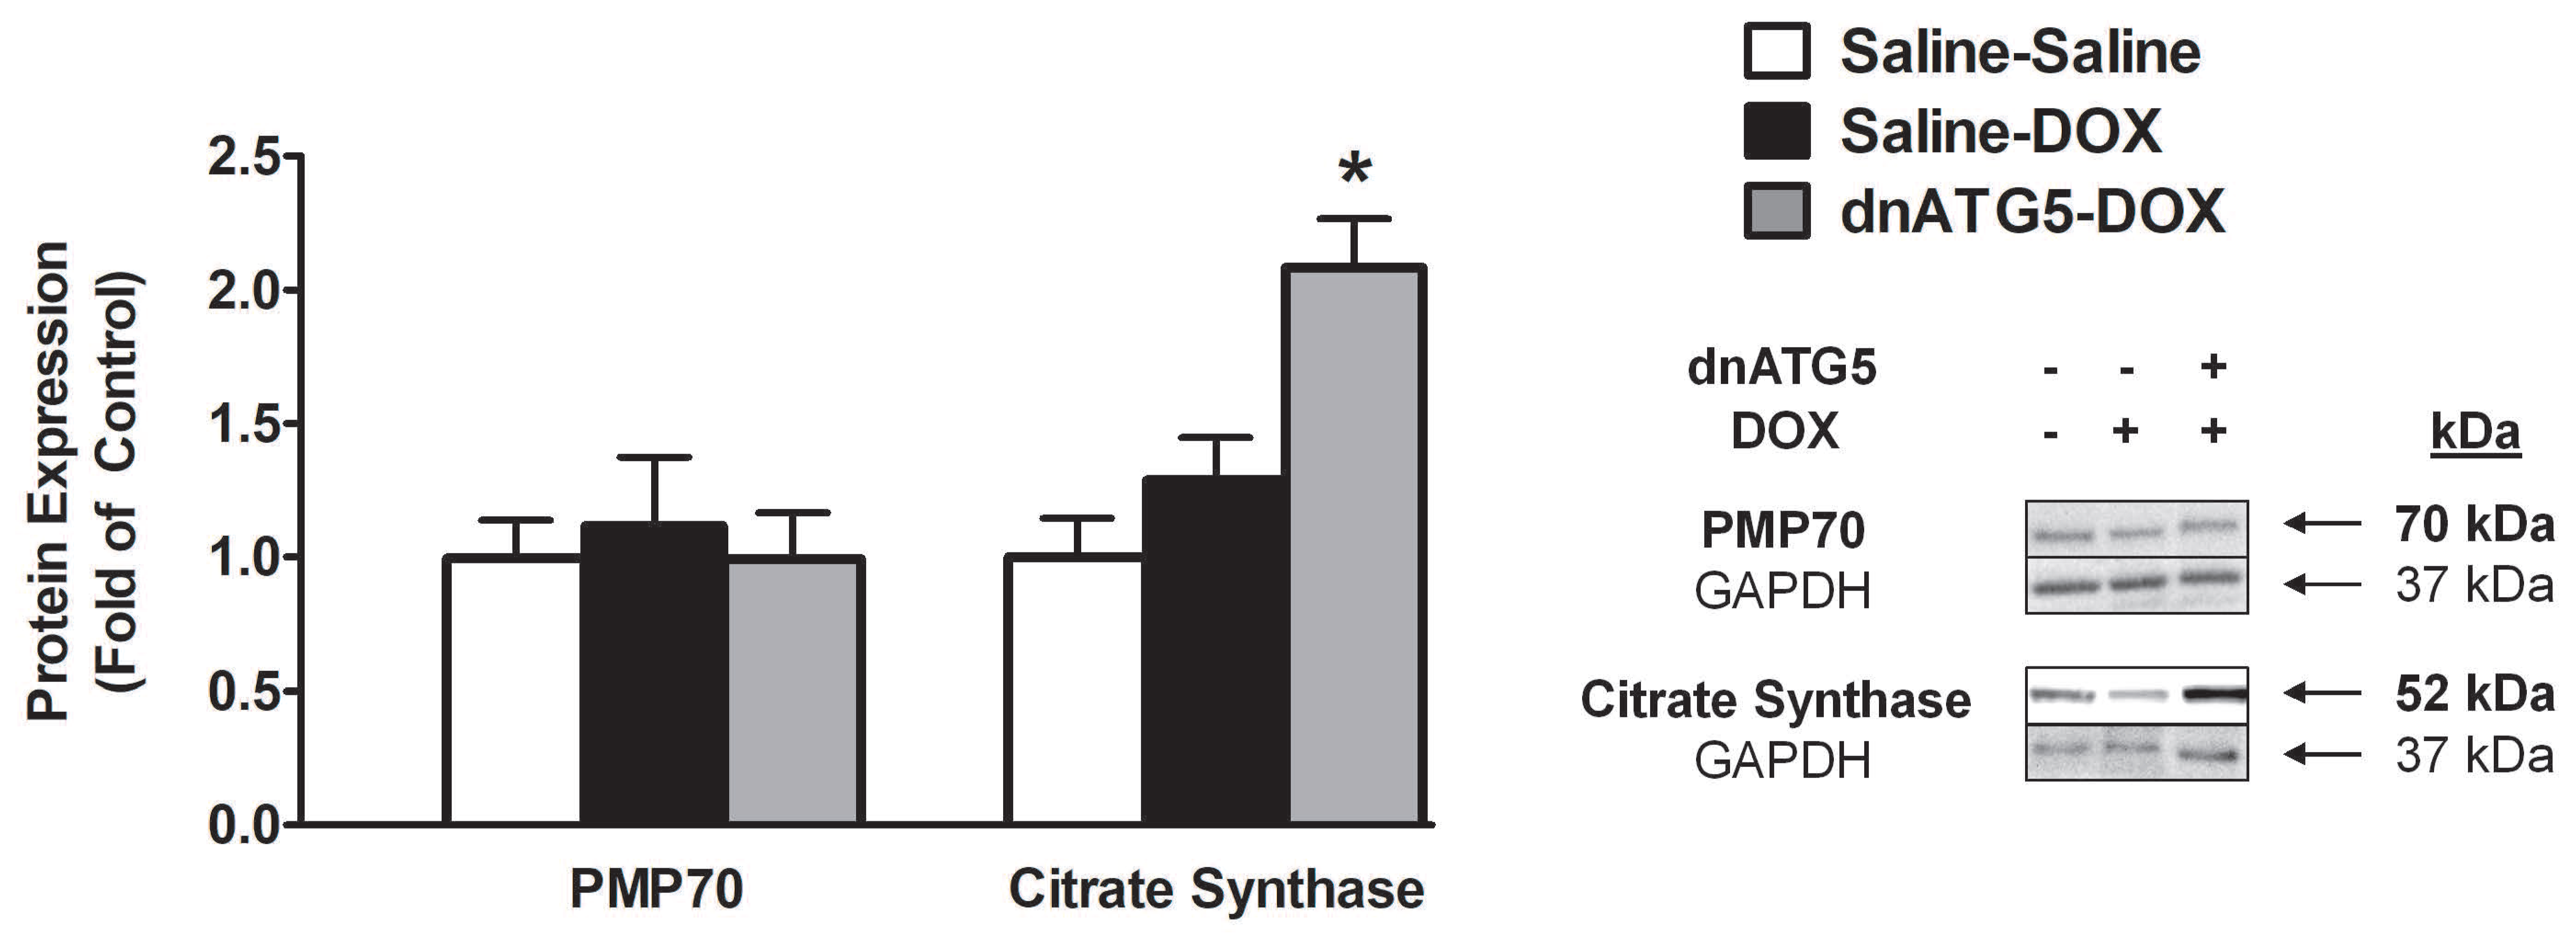
3.2.5. Citrate Synthase Protein Expression was Increased when Autophagy was Inhibited in DOX-Treated Animals
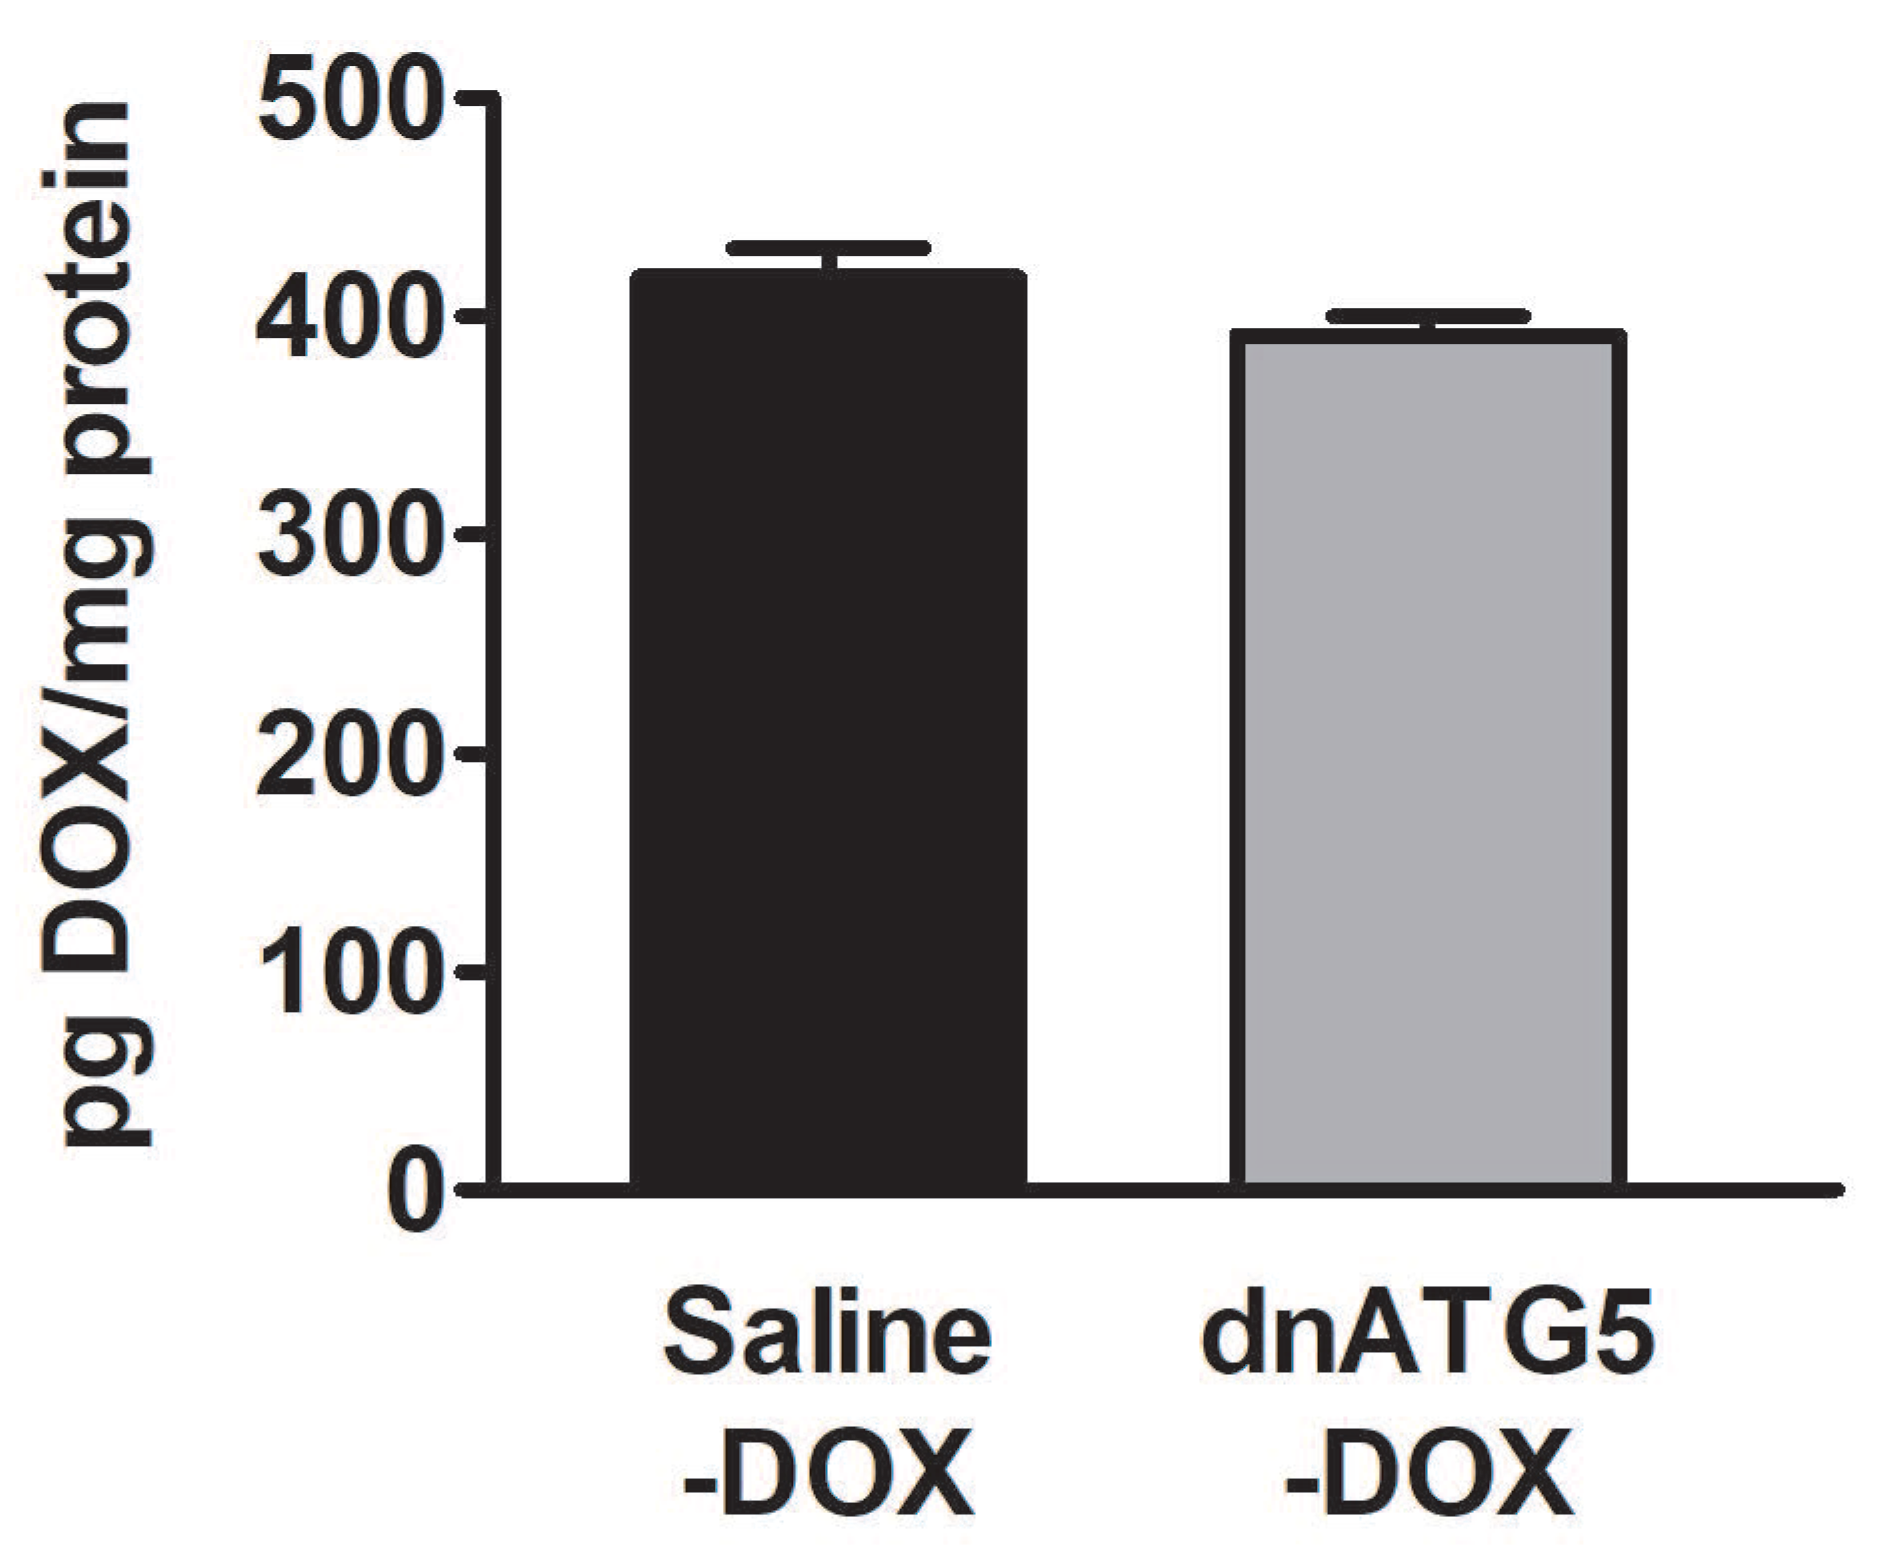
3.2.6. DOX Accumulation within the Soleus Muscle Was not Affected by Autophagy Inhibition
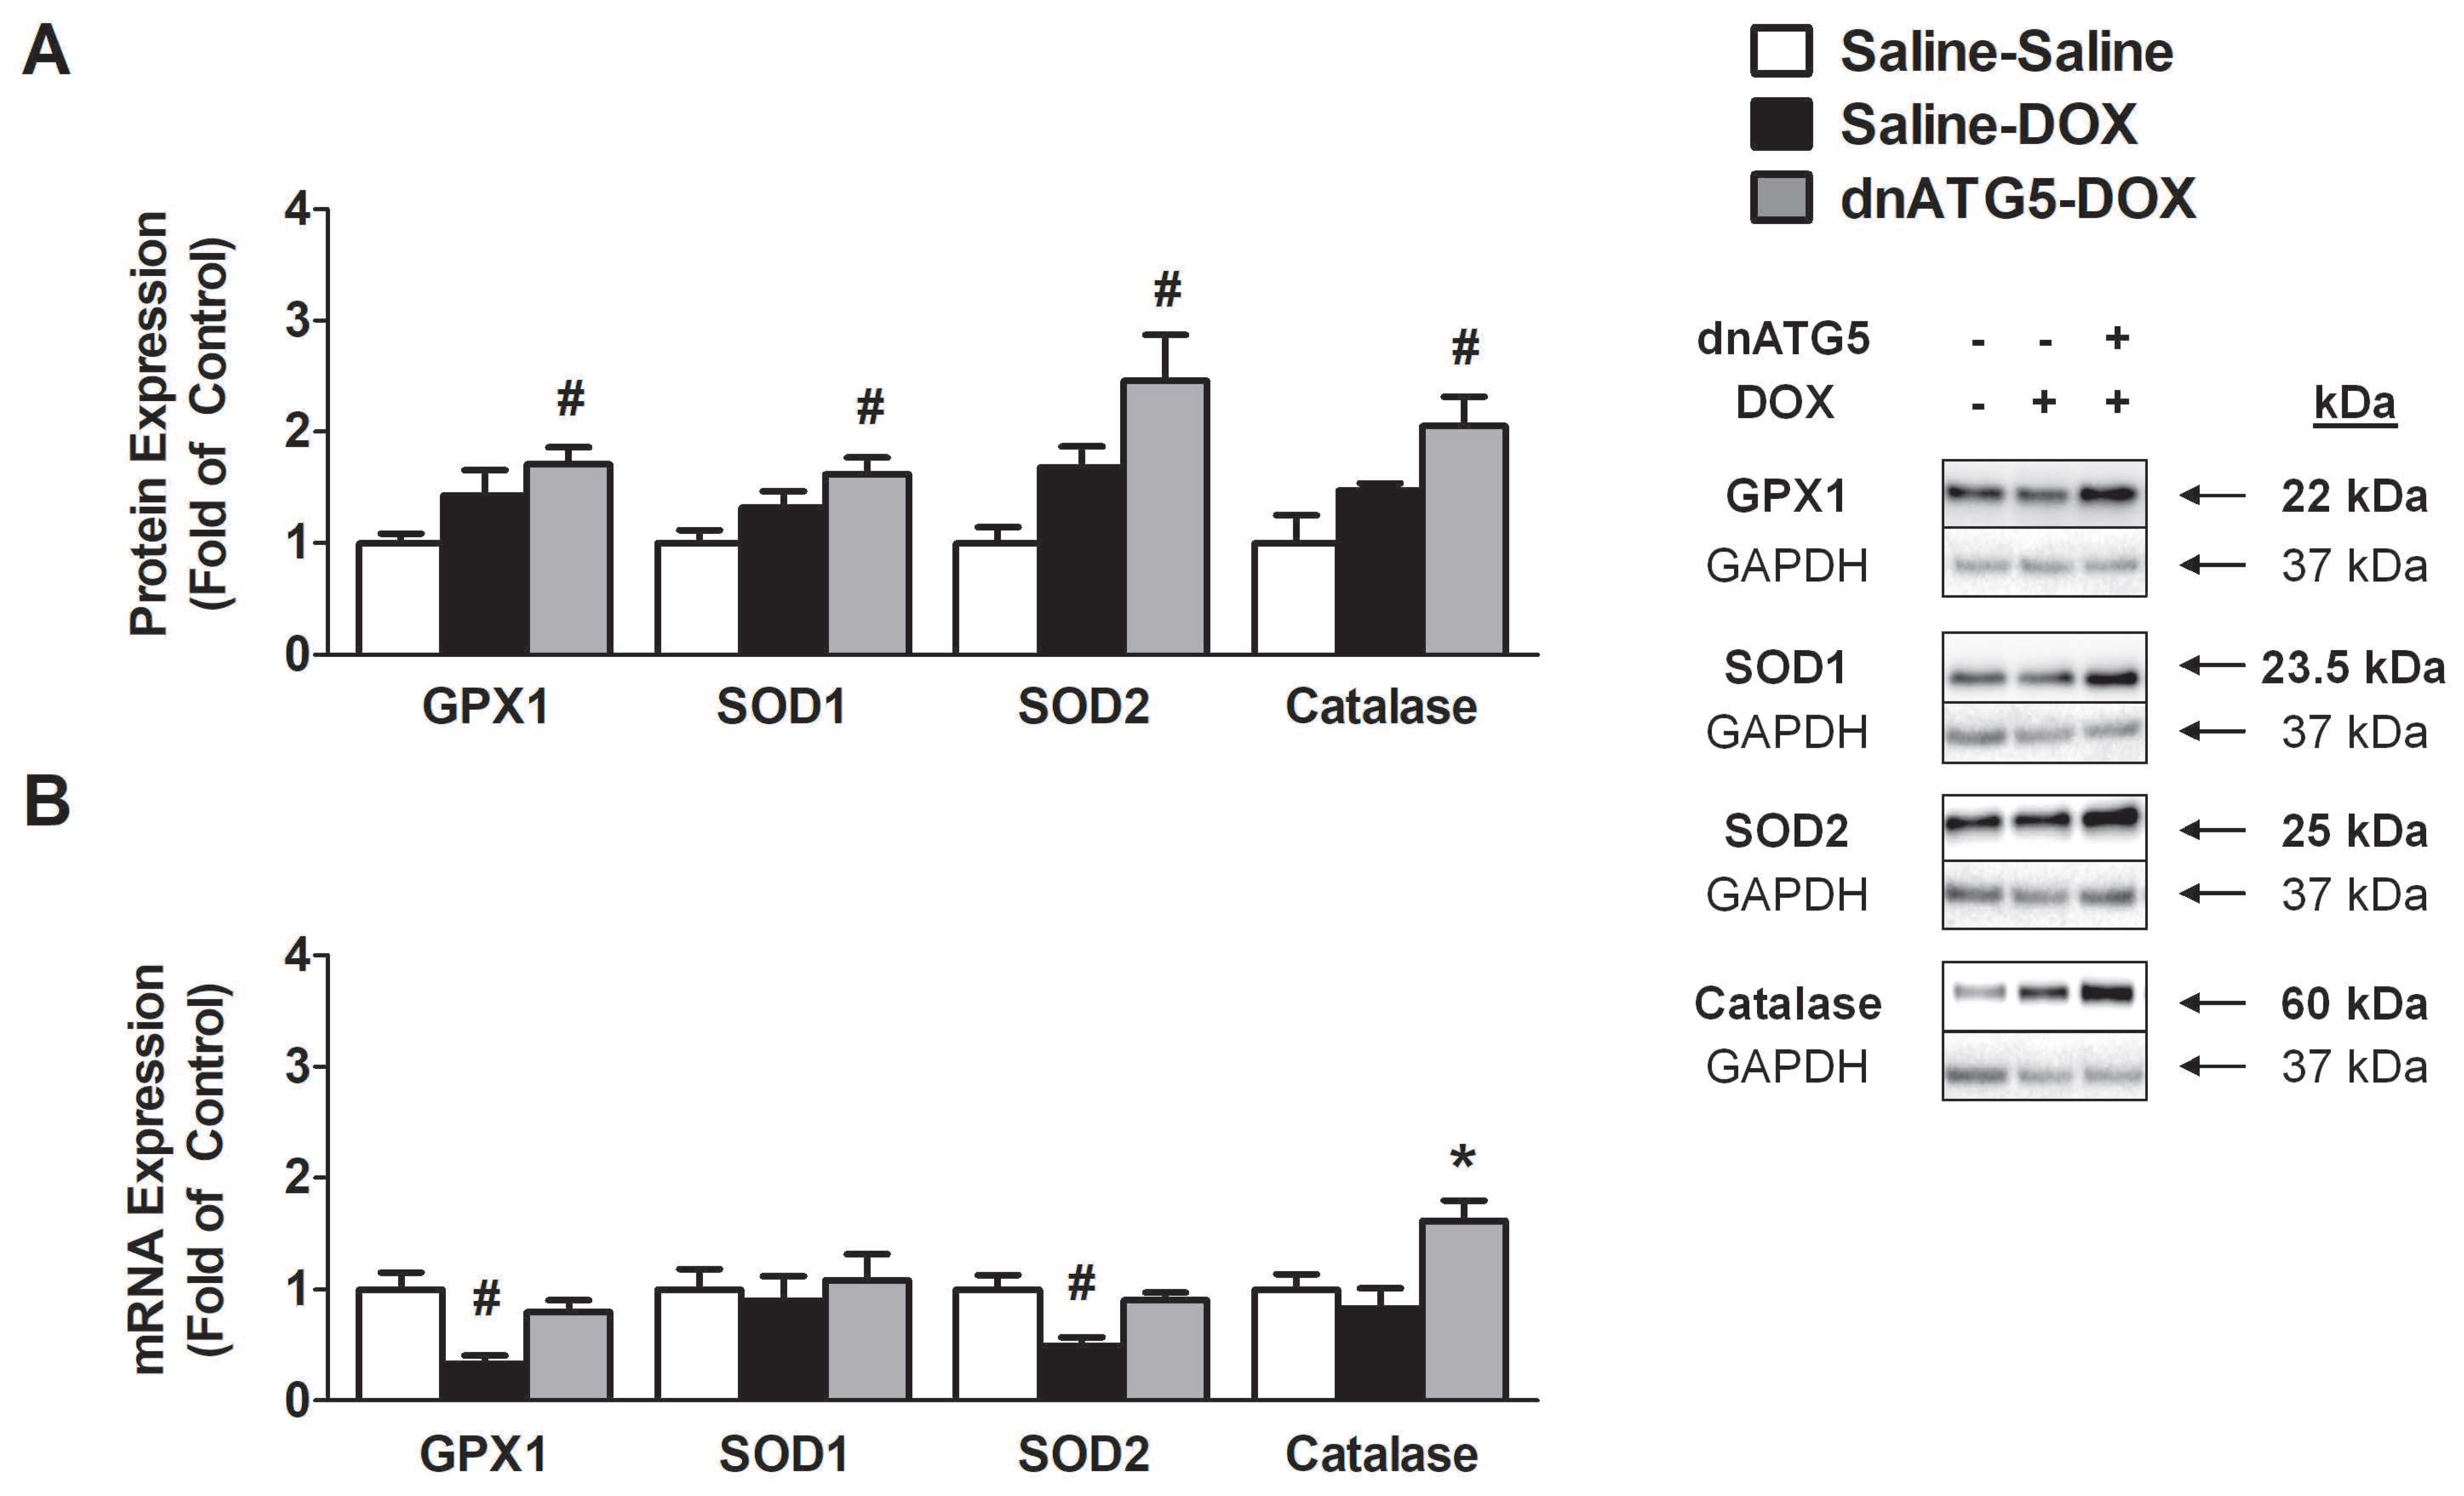
3.2.7. Prevention of DOX-Induced Autophagy Enhanced Soleus Muscle Antioxidant Capacity
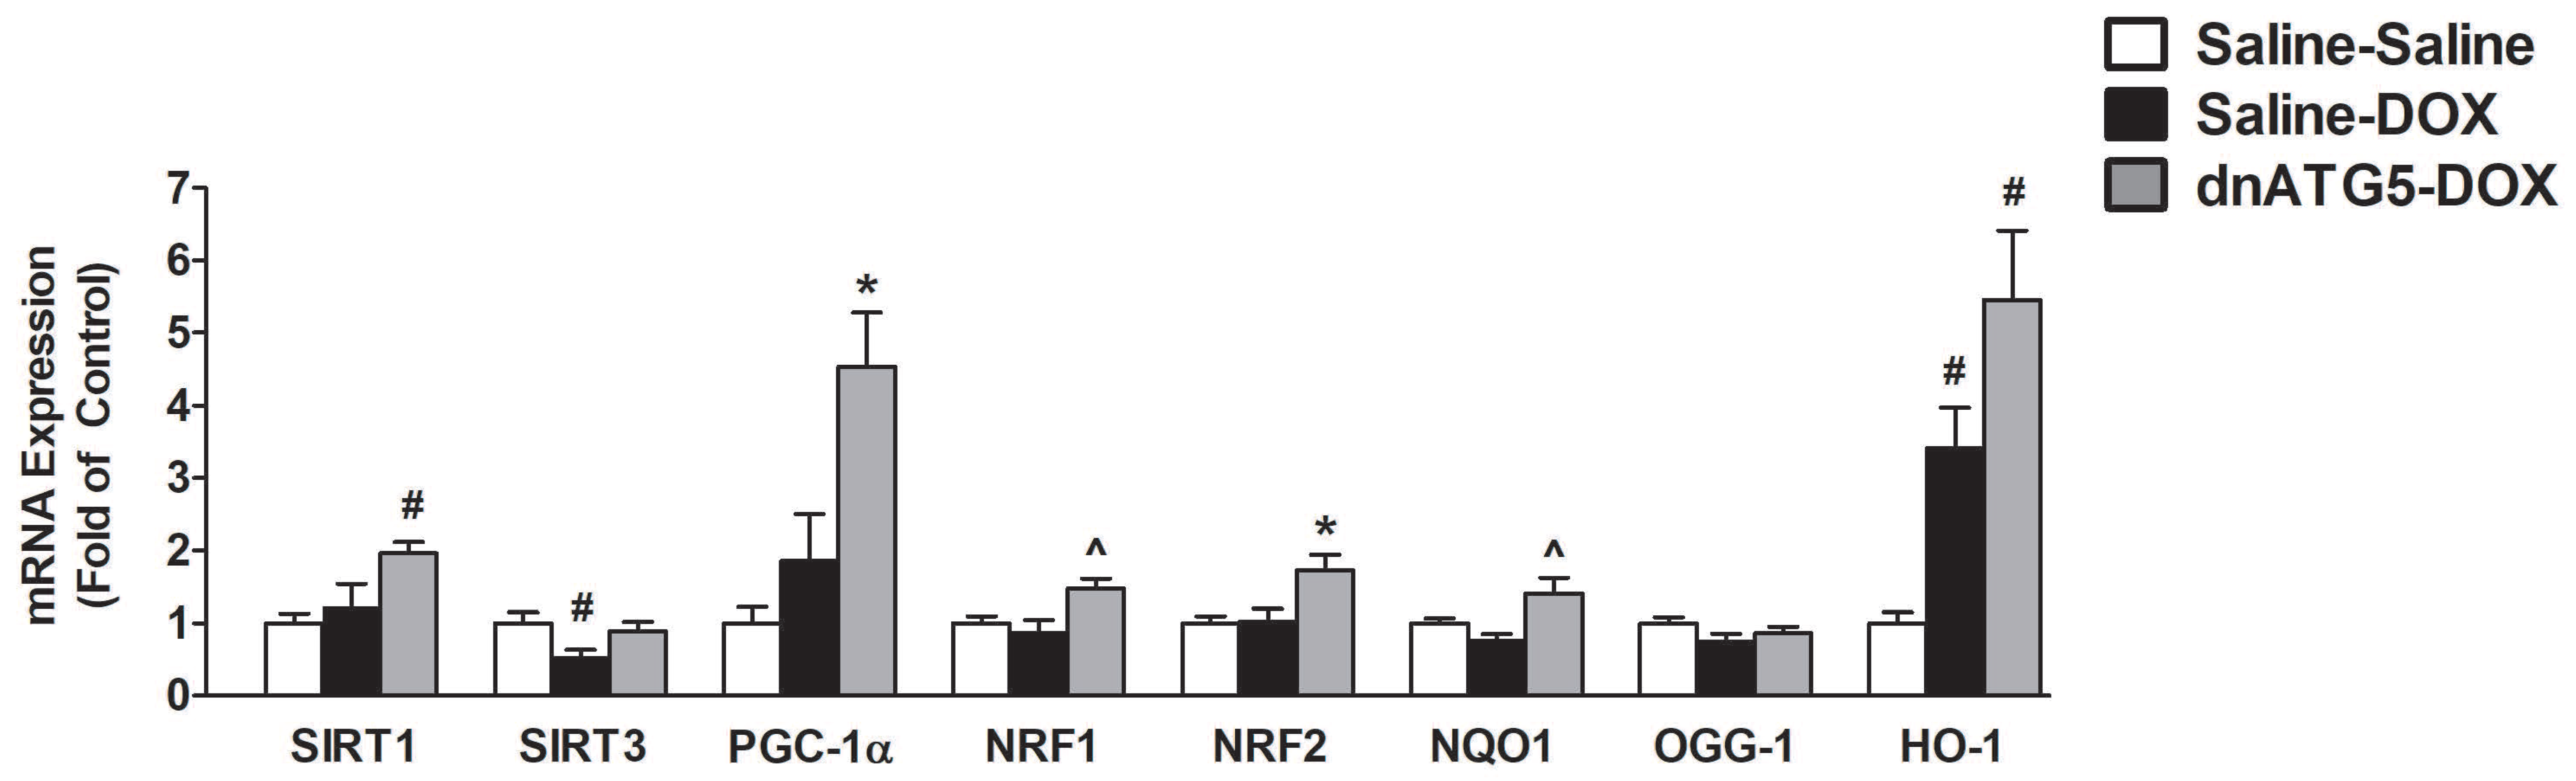
3.2.8. Inhibition of DOX-Induced Autophagy Upregulated Proteins Responsible for Mitochondrial Quality Control and Adaptation to Oxidative Stress
4. Discussion
4.1. Inhibition of Autophagy Prevented DOX-Induced Skeletal Muscle Atrophy and Dysfunction
4.2. DOX-Induced Autophagy Promoted Soleus Muscle Dysfunction and ROS Production Independent of Changes in Endoplasmic Reticulum Stress
4.3. Inhibition of Autophagy Reduced ROS Production and Improved Mitochondrial Efficiency
4.4. Autophagy Inhibition Enhanced Soleus Muscle Antioxidant Capacity in DOX Treated Animals
4.5. Autophagy Inhibition Led to Improved Mitochondrial Biogenesis and ROS Detoxification
5. Conclusions
Author Contributions
Funding
Conflicts of Interest
References
- Tacar, O.; Sriamornsak, P.; Dass, C.R. Doxorubicin: An update on anticancer molecular action, toxicity and novel drug delivery systems. J. Pharm. Pharmacol. 2012, 65, 157–170. [Google Scholar] [CrossRef] [PubMed]
- Chatterjee, K.; Zhang, J.; Honbo, N.; Karliner, J.S. Doxorubicin cardiomyopathy. Cardiology 2009, 115, 155–162. [Google Scholar] [CrossRef] [PubMed]
- Chlebowski, R.T. Adriamycin (Doxorubicin) Cardiotoxicity: A Review. West. J. Med. 1979, 131, 364–368. [Google Scholar] [PubMed]
- Gilliam, L.A.; Clair, D.K.S. Chemotherapy-Induced Weakness and Fatigue in Skeletal Muscle: The Role of Oxidative Stress. Antioxidants Redox Signal. 2011, 15, 2543–2563. [Google Scholar] [CrossRef] [Green Version]
- Van Norren, K.; Van Helvoort, A.; Argilés, J.M.; Van Tuijl, S.; Arts, K.; Gorselink, M.; Laviano, A.; Kegler, D.; Haagsman, H.P.; Van Der Beek, E.M. Direct effects of doxorubicin on skeletal muscle contribute to fatigue. Br. J. Cancer 2009, 100, 311–314. [Google Scholar] [CrossRef] [Green Version]
- Guigni, B.A.; Callahan, D.M.; Tourville, T.W.; Miller, M.S.; Fiske, B.; Voigt, T.; Korwin-Mihavics, B.; Anathy, V.; Dittus, K.; Toth, M.J. Skeletal muscle atrophy and dysfunction in breast cancer patients: Role for chemotherapy-derived oxidant stress. Am. J. Physiol. Physiol. 2018, 315, C744–C756. [Google Scholar] [CrossRef]
- Smuder, A.J.; Sollanek, K.J.; Nelson, W.; Min, K.; Talbert, E.; Kavazis, A.N.; Hudson, M.; Sandri, M.; Szeto, H.H.; Powers, S.K. Crosstalk between autophagy and oxidative stress regulates proteolysis in the diaphragm during mechanical ventilation. Free. Radic. Boil. Med. 2018, 115, 179–190. [Google Scholar] [CrossRef]
- Min, K.; Kwon, O.-S.; Smuder, A.J.; Wiggs, M.P.; Sollanek, K.J.; Christou, D.D.; Yoo, J.-K.; Hwang, M.-H.; Szeto, H.H.; Kavazis, A.N.; et al. Increased mitochondrial emission of reactive oxygen species and calpain activation are required for doxorubicin-induced cardiac and skeletal muscle myopathy. J. Physiol. 2015, 593, 2017–2036. [Google Scholar] [CrossRef] [Green Version]
- Smuder, A.J.; Kavazis, A.N.; Min, K.; Powers, S.K. Exercise protects against doxorubicin-induced oxidative stress and proteolysis in skeletal muscle. J. Appl. Physiol. 2011, 110, 935–942. [Google Scholar] [CrossRef] [PubMed] [Green Version]
- Gorini, S.; De Angelis, A.; Berrino, L.; Malara, N.; Rosano, G.; Ferraro, E. Chemotherapeutic Drugs and Mitochondrial Dysfunction: Focus on Doxorubicin, Trastuzumab, and Sunitinib. Oxidative Med. Cell. Longev. 2018, 2018, 1–15. [Google Scholar] [CrossRef] [Green Version]
- Powers, S.K.; Kavazis, A.N.; McClung, J.M. Oxidative stress and disuse muscle atrophy. J. Appl. Physiol. 2007, 102, 2389–2397. [Google Scholar] [CrossRef] [PubMed]
- Montalvo, R.N.; Doerr, V.; Min, K.; Szeto, H.H.; Smuder, A.J. Doxorubicin-induced oxidative stress differentially regulates proteolytic signaling in cardiac and skeletal muscle. Am. J. Physiol. Integr. Comp. Physiol. 2019, 318, R227–R233. [Google Scholar] [CrossRef] [PubMed]
- Sandri, M. Autophagy in skeletal muscle. FEBS Lett. 2010, 584, 1411–1416. [Google Scholar] [CrossRef] [PubMed]
- Smuder, A.J.; Kavazis, A.N.; Min, K.; Powers, S.K. Doxorubicin-induced markers of myocardial autophagic signaling in sedentary and exercise trained animals. J. Appl. Physiol. 2013, 115, 176–185. [Google Scholar] [CrossRef] [PubMed] [Green Version]
- Dirks-Naylor, A.J. The role of autophagy in doxorubicin-induced cardiotoxicity. Life Sci. 2013, 93, 913–916. [Google Scholar] [CrossRef]
- Sun, A.; Cheng, Y.; Zhang, Y.; Zhang, Q.; Wang, S.; Tian, S.; Zou, Y.; Hu, K.; Ren, J.; Ge, J. Aldehyde dehydrogenase 2 ameliorates doxorubicin-induced myocardial dysfunction through detoxification of 4-HNE and suppression of autophagy. J. Mol. Cell. Cardiol. 2014, 71, 92–104. [Google Scholar] [CrossRef]
- Xu, X.; Chen, K.; Kobayashi, S.; Timm, D.; Liang, Q. Resveratrol attenuates doxorubicin-induced cardiomyocyte death via inhibition of p70 S6 kinase 1-mediated autophagy. J. Pharmacol. Exp. Ther. 2011, 341, 183–195. [Google Scholar] [CrossRef] [Green Version]
- Chen, K.; Xu, X.; Kobayashi, S.; Timm, D.; Jepperson, T.; Liang, Q. Caloric Restriction Mimetic 2-Deoxyglucose Antagonizes Doxorubicin-induced Cardiomyocyte Death by Multiple Mechanisms*. J. Boil. Chem. 2011, 286, 21993–22006. [Google Scholar] [CrossRef] [Green Version]
- Kobayashi, S.; Volden, P.; Timm, D.; Mao, K.; Xu, X.; Liang, Q. Transcription Factor GATA4 Inhibits Doxorubicin-induced Autophagy and Cardiomyocyte Death*. J. Boil. Chem. 2009, 285, 793–804. [Google Scholar] [CrossRef] [Green Version]
- Liu, H.; Lei, H.; Shi, Y.; Wang, J.-J.; Chen, N.; Li, Z.-H.; Chen, Y.-F.; Ye, Q.-F.; Yang, Y. Autophagy inhibitor 3-methyladenine alleviates overload-exercise-induced cardiac injury in rats. Acta Pharmacol. Sin. 2017, 38, 990–997. [Google Scholar] [CrossRef] [Green Version]
- Yu, L.; Wan, F.; Dutta, S.; Welsh, S.; Liu, Z.; Freundt, E.; Baehrecke, E.H.; Lenardo, M.J. Autophagic programmed cell death by selective catalase degradation. Proc. Natl. Acad. Sci. 2006, 103, 4952–4957. [Google Scholar] [CrossRef] [PubMed] [Green Version]
- Hollomon, M.; Gordon, N.; Santiago-O’Farrill, J.M.; Kleinerman, E. Knockdown of autophagy-related protein 5, ATG5, decreases oxidative stress and has an opposing effect on camptothecin-induced cytotoxicity in osteosarcoma cells. BMC Cancer 2013, 13, 500. [Google Scholar] [CrossRef] [PubMed] [Green Version]
- Rivera, E. Liposomal anthracyclines in metastatic breast cancer: Clinical update. Oncologist 2003, 8 (Suppl. 2), 3–9. [Google Scholar] [CrossRef] [PubMed]
- Franco, Y.L.; Vaidya, T.R.; Ait-Oudhia, S. Anticancer and cardio-protective effects of liposomal doxorubicin in the treatment of breast cancer. Breast Cancer: Targets Ther. 2018, 10, 131–141. [Google Scholar] [CrossRef] [Green Version]
- Houston, F.E.; Hain, B.; Adams, T.J.; Houston, K.L.; O’Keeffe, R.; Dodd, S.L. Heat shock protein 70 overexpression does not attenuate atrophy in botulinum neurotoxin type A-treated skeletal muscle. J. Appl. Physiol. 2015, 119, 83–92. [Google Scholar] [CrossRef] [Green Version]
- Freireich, E.J.; Gehan, E.; Rall, D.P.; Schmidt, L.H.; E Skipper, H. Quantitative comparison of toxicity of anticancer agents in mouse, rat, hamster, dog, monkey, and man. Cancer Chemother Rep 1966, 50, 219–244. [Google Scholar]
- Hiensch, A.E.; Bolam, K.A.; Mijwel, S.; Jeneson, J.A.L.; Huitema, A.D.R.; Kranenburg, O.; Van Der Wall, E.; Rundqvist, H.; Wengstrom, Y.; May, A.M. Doxorubicin-induced skeletal muscle atrophy: Elucidating the underlying molecular pathways. Acta Physiol. 2019, 2019, e13400. [Google Scholar] [CrossRef] [Green Version]
- Morton, A.; Huertas, A.M.; Hinkley, J.M.; Ichinoseki-Sekine, N.; Christou, D.D.; Smuder, A.J.; Mor, A. Mitochondrial accumulation of doxorubicin in cardiac and diaphragm muscle following exercise preconditioning. Mitochondrion 2019, 45, 52–62. [Google Scholar] [CrossRef]
- Huertas, A.M.; Morton, A.B.; Hinkey, J.M.; Ichinoseki-Sekine, N.; Smuder, A.J. Modification of Neuromuscular Junction Protein Expression by Exercise and Doxorubicin. Med. Sci. Sports Exerc. 2020. [Google Scholar] [CrossRef]
- Gustafsson, A.B.; Gottlieb, R.A. Recycle or die: The role of autophagy in cardioprotection. J. Mol. Cell. Cardiol. 2008, 44, 654–661. [Google Scholar] [CrossRef] [Green Version]
- Brooks, S.V.; A Faulkner, J. Contractile properties of skeletal muscles from young, adult and aged mice. J. Physiol. 1988, 404, 71–82. [Google Scholar] [CrossRef] [PubMed]
- Smuder, A.J.; Hudson, M.B.; Nelson, W.B.; Kavazis, A.N.; Powers, S.K. Nuclear factor-κb signaling contributes to mechanical ventilation-induced diaphragm weakness*. Crit. Care Med. 2012, 40, 927–934. [Google Scholar] [CrossRef] [PubMed] [Green Version]
- Lin, Y.; Jiang, M.; Chen, W.; Zhao, T.; Wei, Y. Cancer and ER stress: Mutual crosstalk between autophagy, oxidative stress and inflammatory response. Biomed. Pharmacother. 2019, 118, 109249. [Google Scholar] [CrossRef] [PubMed]
- Hayward, R.; Hydock, D.; Gibson, N.; Greufe, S.; Bredahl, E.; Parry, T. Tissue retention of doxorubicin and its effects on cardiac, smooth, and skeletal muscle function. J. Physiol. Biochem. 2012, 69, 177–187. [Google Scholar] [CrossRef]
- Tang, B.L. Sirt1 and the Mitochondria. Mol. Cells 2016, 39, 87–95. [Google Scholar]
- Nguyen, T.; Nioi, P.; Pickett, C.B. The Nrf2-Antioxidant Response Element Signaling Pathway and Its Activation by Oxidative Stress*. J. Boil. Chem. 2009, 284, 13291–13295. [Google Scholar] [CrossRef] [Green Version]
- Pin, F.; Couch, M.E.; Bonetto, A. Preservation of muscle mass as a strategy to reduce the toxic effects of cancer chemotherapy on body composition. Curr. Opin. Support. Palliat. Care 2018, 12, 420–426. [Google Scholar] [CrossRef] [Green Version]
- Fearon, K.C.H.; Arends, J.; Baracos, V.E. Understanding the mechanisms and treatment options in cancer cachexia. Nat. Rev. Clin. Oncol. 2012, 10, 90–99. [Google Scholar] [CrossRef]
- Gilliam, L.A.A.; Moylan, J.S.; Callahan, L.A.; Sumandea, M.P.; Reid, M.B. Doxorubicin causes diaphragm weakness in murine models of cancer chemotherapy. Muscle Nerve 2011, 43, 94–102. [Google Scholar] [CrossRef] [Green Version]
- Ertunc, M.; Sara, Y.; Onur, R. Differential Contractile Impairment of Fast- and Slow-Twitch Skeletal Muscles in a Rat Model of Doxorubicin-Induced Congestive Heart Failure. Pharmacol. 2009, 84, 240–248. [Google Scholar] [CrossRef]
- Smuder, A.J.; Kavazis, A.N.; Min, K.; Powers, S.K. Exercise protects against doxorubicin-induced markers of autophagy signaling in skeletal muscle. J. Appl. Physiol. 2011, 111, 1190–1198. [Google Scholar] [CrossRef] [PubMed] [Green Version]
- Lu, L.; Wu, W.; Yan, J.; Li, X.; Yu, H.; Yu, X. Adriamycin-induced autophagic cardiomyocyte death plays a pathogenic role in a rat model of heart failure. Int. J. Cardiol. 2009, 134, 82–90. [Google Scholar] [CrossRef] [PubMed]
- Koleini, N.; Kardami, E. Autophagy and mitophagy in the context of doxorubicin-induced cardiotoxicity. Oncotarget 2017, 8, 46663–46680. [Google Scholar] [CrossRef] [PubMed] [Green Version]
- Forrester, S.J.; Kikuchi, D.S.; Hernandes, M.S.; Xu, Q.; Griendling, K.K. Reactive Oxygen Species in Metabolic and Inflammatory Signaling. Circ. Res. 2018, 122, 877–902. [Google Scholar] [CrossRef] [PubMed]
- Bohnert, K.R.; Gallot, Y.S.; Sato, S.; Xiong, G.; Hindi, S.M.; Kumar, A. Inhibition of ER stress and unfolding protein response pathways causes skeletal muscle wasting during cancer cachexia. FASEB J. 2016, 30, 3053–3068. [Google Scholar] [CrossRef] [Green Version]
- Ebert, S.M.; Monteys, A.M.; Fox, D.K.; Bongers, K.S.; Shields, B.E.; Malmberg, S.E.; Davidson, B.L.; Suneja, M.; Adams, C.M. The transcription factor atf4 promotes skeletal myofiber atrophy during fasting. Mol. Endocrinol. 2010, 24, 790–799. [Google Scholar] [CrossRef] [Green Version]
- Wang, Y.; Lei, T.; Yuan, J.; Wu, Y.; Shen, X.; Gao, J.; Feng, W.; Lu, Z. GCN2 deficiency ameliorates doxorubicin-induced cardiotoxicity by decreasing cardiomyocyte apoptosis and myocardial oxidative stress. Redox Boil. 2018, 17, 25–34. [Google Scholar] [CrossRef]
- Kavazis, A.N.; Morton, A.; Hall, S.E.; Smuder, A.J. Effects of doxorubicin on cardiac muscle subsarcolemmal and intermyofibrillar mitochondria. Mitochondrion 2017, 34, 9–19. [Google Scholar] [CrossRef] [Green Version]
- Powers, S.K.; Ji, L.L.; Kavazis, A.N.; Jackson, M.J. Reactive oxygen species: Impact on skeletal muscle. Compr. Physiol. 2011, 1, 941–969. [Google Scholar]
- Cheung, K.G.; Cole, L.K.; Xiang, B.; Chen, K.; Ma, X.; Myal, Y.; Hatch, G.M.; Tong, Q.; Dolinsky, V.W. Sirtuin-3 (SIRT3) Protein Attenuates Doxorubicin-induced Oxidative Stress and Improves Mitochondrial Respiration in H9c2 Cardiomyocytes*. J. Boil. Chem. 2015, 290, 10981–10993. [Google Scholar] [CrossRef] [Green Version]
- Karnati, S.; Lüers, G.; Pfreimer, S.; Baumgart-Vogt, E. Mammalian SOD2 is exclusively located in mitochondria and not present in peroxisomes. Histochem. Cell Boil. 2013, 140, 105–117. [Google Scholar] [CrossRef] [PubMed]
- Suresh, A.; Guedez, L.; Moreb, J.; Zucali, J. Overexpression of manganese superoxide dismutase promotes survival in cell lines after doxorubicin treatment. Br. J. Haematol. 2003, 120, 457–463. [Google Scholar] [CrossRef] [PubMed]
- Xiong, Y.; Liu, X.; Lee, C.-P.; Chua, B.H.; Ho, Y.-S. Attenuation of doxorubicin-induced contractile and mitochondrial dysfunction in mouse heart by cellular glutathione peroxidase. Free. Radic. Boil. Med. 2006, 41, 46–55. [Google Scholar] [CrossRef] [PubMed]
- Kang, Y.J.; Sun, X.; Chen, Y.; Zhou, Z. Inhibition of Doxorubicin Chronic Toxicity in Catalase-Overexpressing Transgenic Mouse Hearts. Chem. Res. Toxicol. 2002, 15, 1–6. [Google Scholar] [CrossRef]
- Gao, J.; Xiong, Y.; Ho, Y.-S.; Liu, X.; Chua, C.C.; Xu, X.; Wang, H.; Hamdy, R.; Chua, B.H. Glutathione peroxidase 1-deficient mice are more susceptible to doxorubicin-induced cardiotoxicity. Biochim. et Biophys. Acta (BBA) - Bioenerg. 2008, 1783, 2020–2029. [Google Scholar] [CrossRef] [Green Version]
- Yen, H.C.; Oberley, T.D.; Vichitbandha, S.; Ho, Y.S.; Clair, D.K.S. The protective role of manganese superoxide dismutase against adriamycin-induced acute cardiac toxicity in transgenic mice. J. Clin. Investig. 1996, 98, 1253–1260. [Google Scholar] [CrossRef] [Green Version]
- Cole, M.P.; Chaiswing, L.; Oberley, T.D.; Edelmann, S.E.; Piascik, M.T.; Lin, S.-M.; Kiningham, K.K.; Clair, D.K.S. The protective roles of nitric oxide and superoxide dismutase in adriamycin-induced cardiotoxicity. Cardiovasc. Res. 2006, 69, 186–197. [Google Scholar] [CrossRef] [Green Version]
- Gilliam, L.A.A.; Lark, D.; Reese, L.R.; Torres, M.J.; Ryan, T.E.; Lin, C.-T.; Cathey, B.L.; Neufer, P.D. Targeted overexpression of mitochondrial catalase protects against cancer chemotherapy-induced skeletal muscle dysfunction. Am. J. Physiol. Metab. 2016, 311, E293–E301. [Google Scholar] [CrossRef]
- Kang, Y.J.; Chen, Y.; Epstein, P. Suppression of Doxorubicin Cardiotoxicity by Overexpression of Catalase in the Heart of Transgenic Mice. J. Boil. Chem. 1996, 271, 12610–12616. [Google Scholar] [CrossRef] [Green Version]
- Vainshtein, A.; Desjardins, E.M.; Armani, A.; Sandri, M.; Hood, D.A. PGC-1α modulates denervation-induced mitophagy in skeletal muscle. Skelet. Muscle 2015, 5, 9. [Google Scholar] [CrossRef] [Green Version]
- Sandri, M.; Lin, J.; Handschin, C.; Yang, W.; Arany, Z.P.; Lecker, S.H.; Goldberg, A.L.; Spiegelman, B.M. PGC-1α protects skeletal muscle from atrophy by suppressing FoxO3 action and atrophy-specific gene transcription. Proc. Natl. Acad. Sci. 2006, 103, 16260–16265. [Google Scholar] [CrossRef] [Green Version]
- Cannavino, J.; Brocca, L.; Sandri, M.; Grassi, B.; Bottinelli, R.; Pellegrino, M.A. The role of alterations in mitochondrial dynamics and PGC-1α over-expression in fast muscle atrophy following hindlimb unloading. J. Physiol. 2015, 593, 1981–1995. [Google Scholar] [CrossRef] [PubMed] [Green Version]
- Piantadosi, C.A.; Carraway, M.S.; Babiker, A.; Suliman, H.B. Heme Oxygenase-1 Regulates Cardiac Mitochondrial Biogenesis via Nrf2-Mediated Transcriptional Control of Nuclear Respiratory Factor-1. Circ. Res. 2008, 103, 1232–1240. [Google Scholar] [CrossRef] [PubMed] [Green Version]
- Suliman, H.B.; Piantadosi, C.A. Mitochondrial Quality Control as a Therapeutic Target. Pharmacol. Rev. 2015, 68, 20–48. [Google Scholar] [CrossRef] [PubMed]
- Ren, Z.; He, H.; Zuo, Z.; Xu, Z.; Wei, Z.; Deng, J. The role of different SIRT1-mediated signaling pathways in toxic injury. Cell. Mol. Boil. Lett. 2019, 24, 36. [Google Scholar] [CrossRef] [Green Version]


| Saline-Saline | Saline-DOX | dnATG5-DOX | |
|---|---|---|---|
| Initial weight (g) | 278.6 ± 3.34 | 283.13 ± 5.52 | 280.13 ± 3.38 |
| Treatment weight (g) | 296.5 ± 4.40 | 302.8 ± 5.06 | 299.88 ± 4.50 |
| Final weight (g) | 295.9 ± 4.52 | 287.13 ± 6.57 | 290.5 ± 6.27 |
| Soleus (mg) | 123.5 ± 2.78 | 125.9 ± 2.76 | 122.0 ± 2.34 |
| Soleus/body weight (mg/g) | 0.42 ± 0.01 | 0.44 ± 0.01 | 0.42 ± 0.01 |
© 2020 by the authors. Licensee MDPI, Basel, Switzerland. This article is an open access article distributed under the terms and conditions of the Creative Commons Attribution (CC BY) license (http://creativecommons.org/licenses/by/4.0/).
Share and Cite
Doerr, V.; Montalvo, R.N.; Kwon, O.S.; Talbert, E.E.; Hain, B.A.; Houston, F.E.; Smuder, A.J. Prevention of Doxorubicin-Induced Autophagy Attenuates Oxidative Stress and Skeletal Muscle Dysfunction. Antioxidants 2020, 9, 263. https://doi.org/10.3390/antiox9030263
Doerr V, Montalvo RN, Kwon OS, Talbert EE, Hain BA, Houston FE, Smuder AJ. Prevention of Doxorubicin-Induced Autophagy Attenuates Oxidative Stress and Skeletal Muscle Dysfunction. Antioxidants. 2020; 9(3):263. https://doi.org/10.3390/antiox9030263
Chicago/Turabian StyleDoerr, Vivian, Ryan N. Montalvo, Oh Sung Kwon, Erin E. Talbert, Brian A. Hain, Fraser E. Houston, and Ashley J. Smuder. 2020. "Prevention of Doxorubicin-Induced Autophagy Attenuates Oxidative Stress and Skeletal Muscle Dysfunction" Antioxidants 9, no. 3: 263. https://doi.org/10.3390/antiox9030263