Effect of Heme Oxygenase-1 on Melanoma Development in Mice—Role of Tumor-Infiltrating Immune Cells

 , , , , ,
  , and
, and 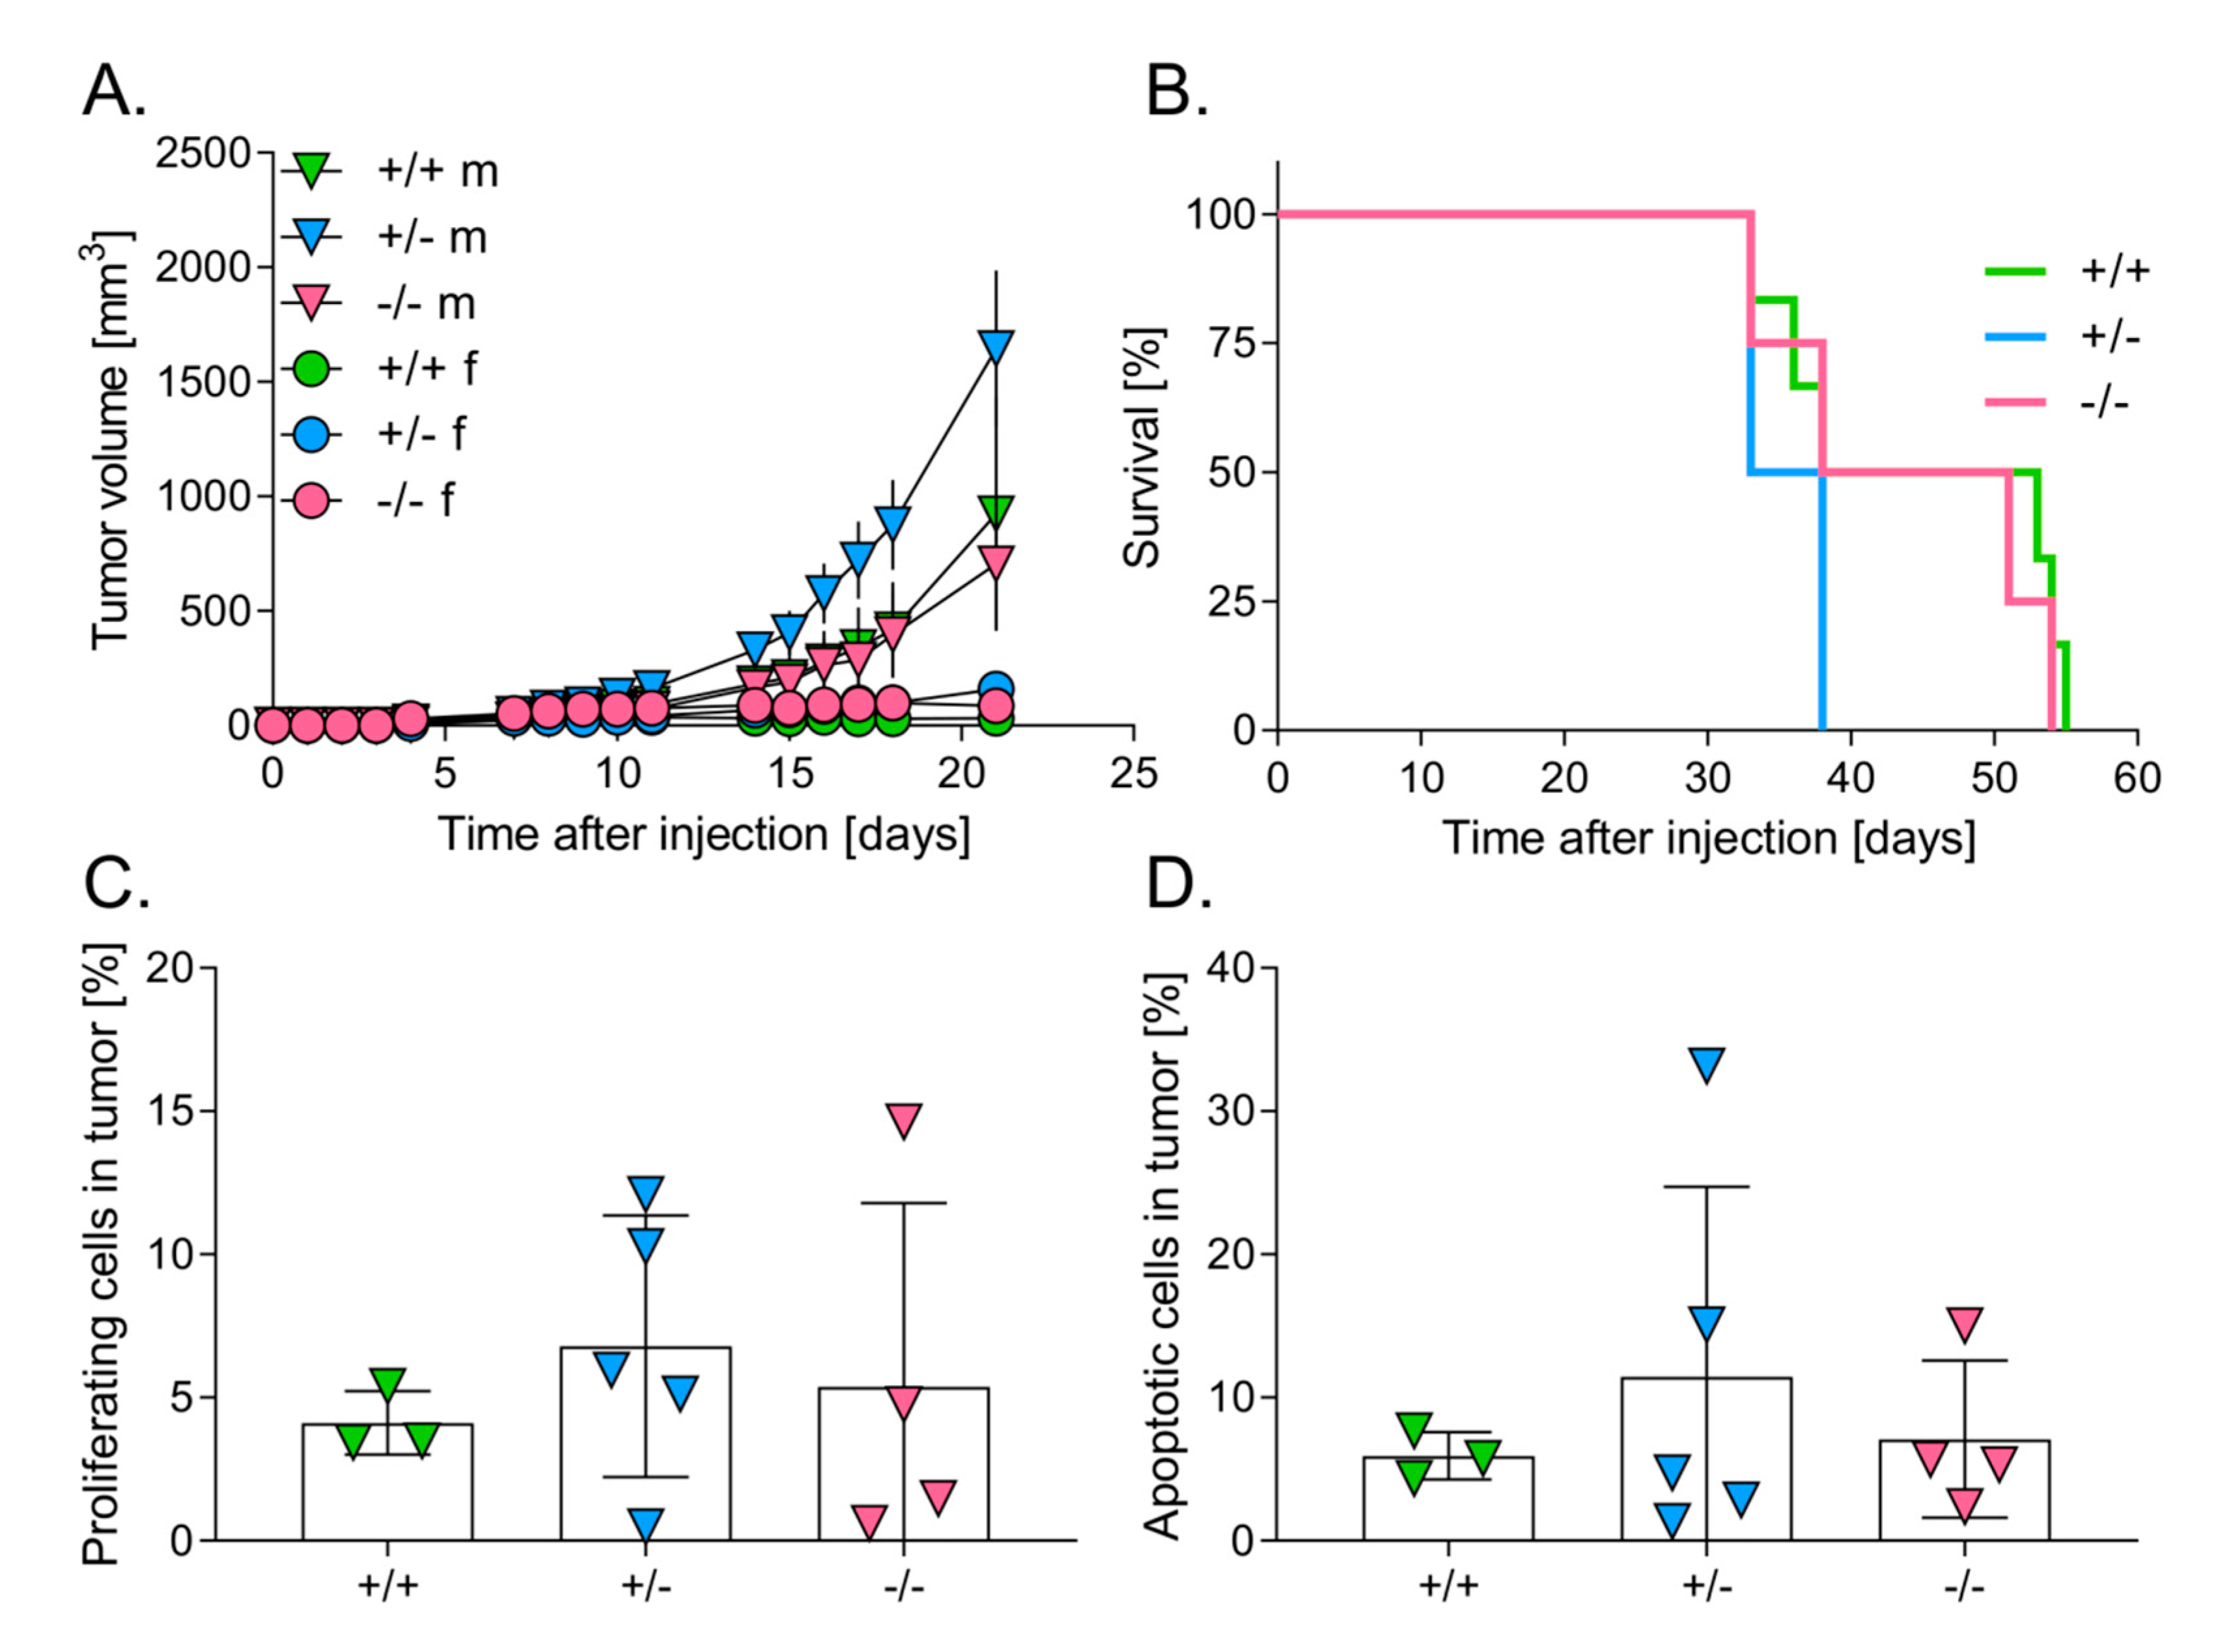
Abstract
:1. Introduction
2. Materials and Methods
2.1. Reagents
2.2. Cell Culture
2.3. Preparation of Plasmids
2.4. Preparation of Retroviruses
2.5. Animals
2.6. Immunohistochemistry of Proliferating Cell Nuclear Antigen (PCNA)
2.7. TdT-Mediated Fluorescein FragEL™ DNA Fragmentation Detection (TUNEL)
2.8. Flow Cytometry of Tumor-Infiltrating Leukocytes
2.9. Measurement of Protein Level
2.10. Measurement of Proinflammatory and Proangiogenic Protein Levels
2.11. Analysis of Hematological Parameters
2.12. Measurement of Luciferase Activity in Tissue Homogenates
2.13. Statistics
3. Results
3.1. Lower Level of HO-1 Expression in Mice Accelerates the Growth of Primary Tumors
3.2. Level of HO-1 Expression in Mice Does Not Influence the Survival of Mice
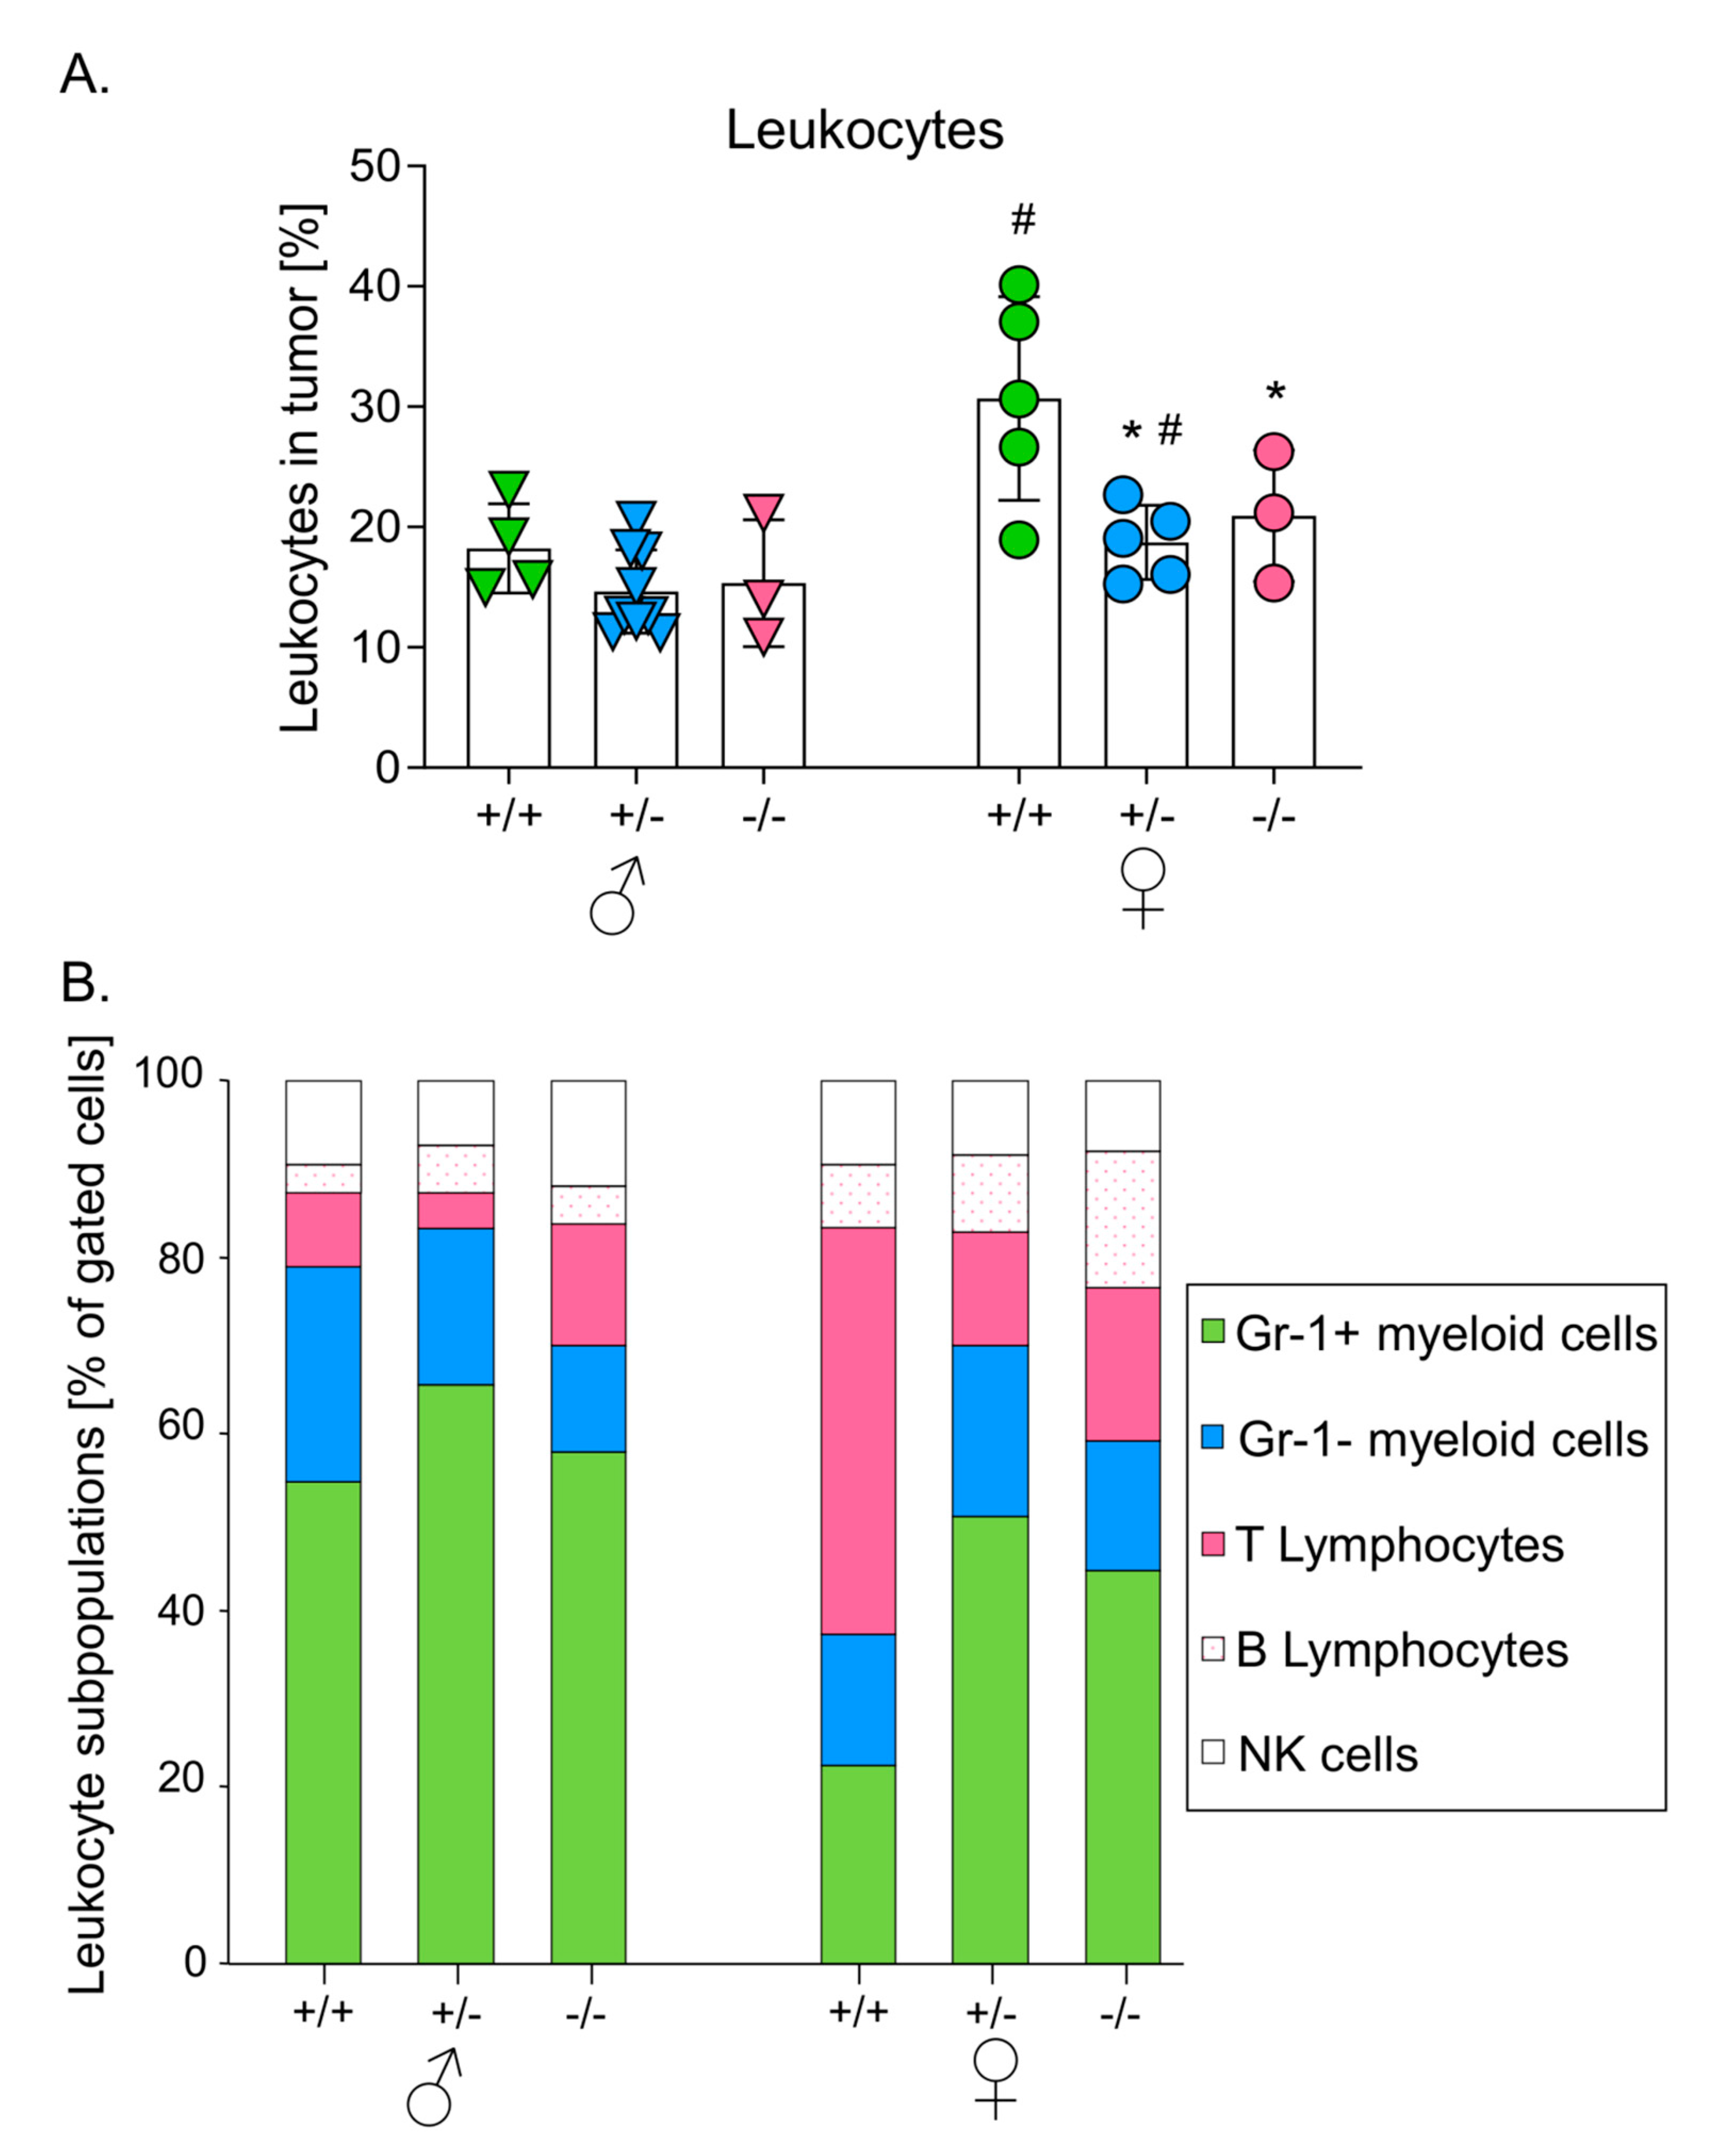
3.3. Melanomas Growing in Mice with Higher HO-1 Expression Were More Heavily Infiltrated by Leukocytes
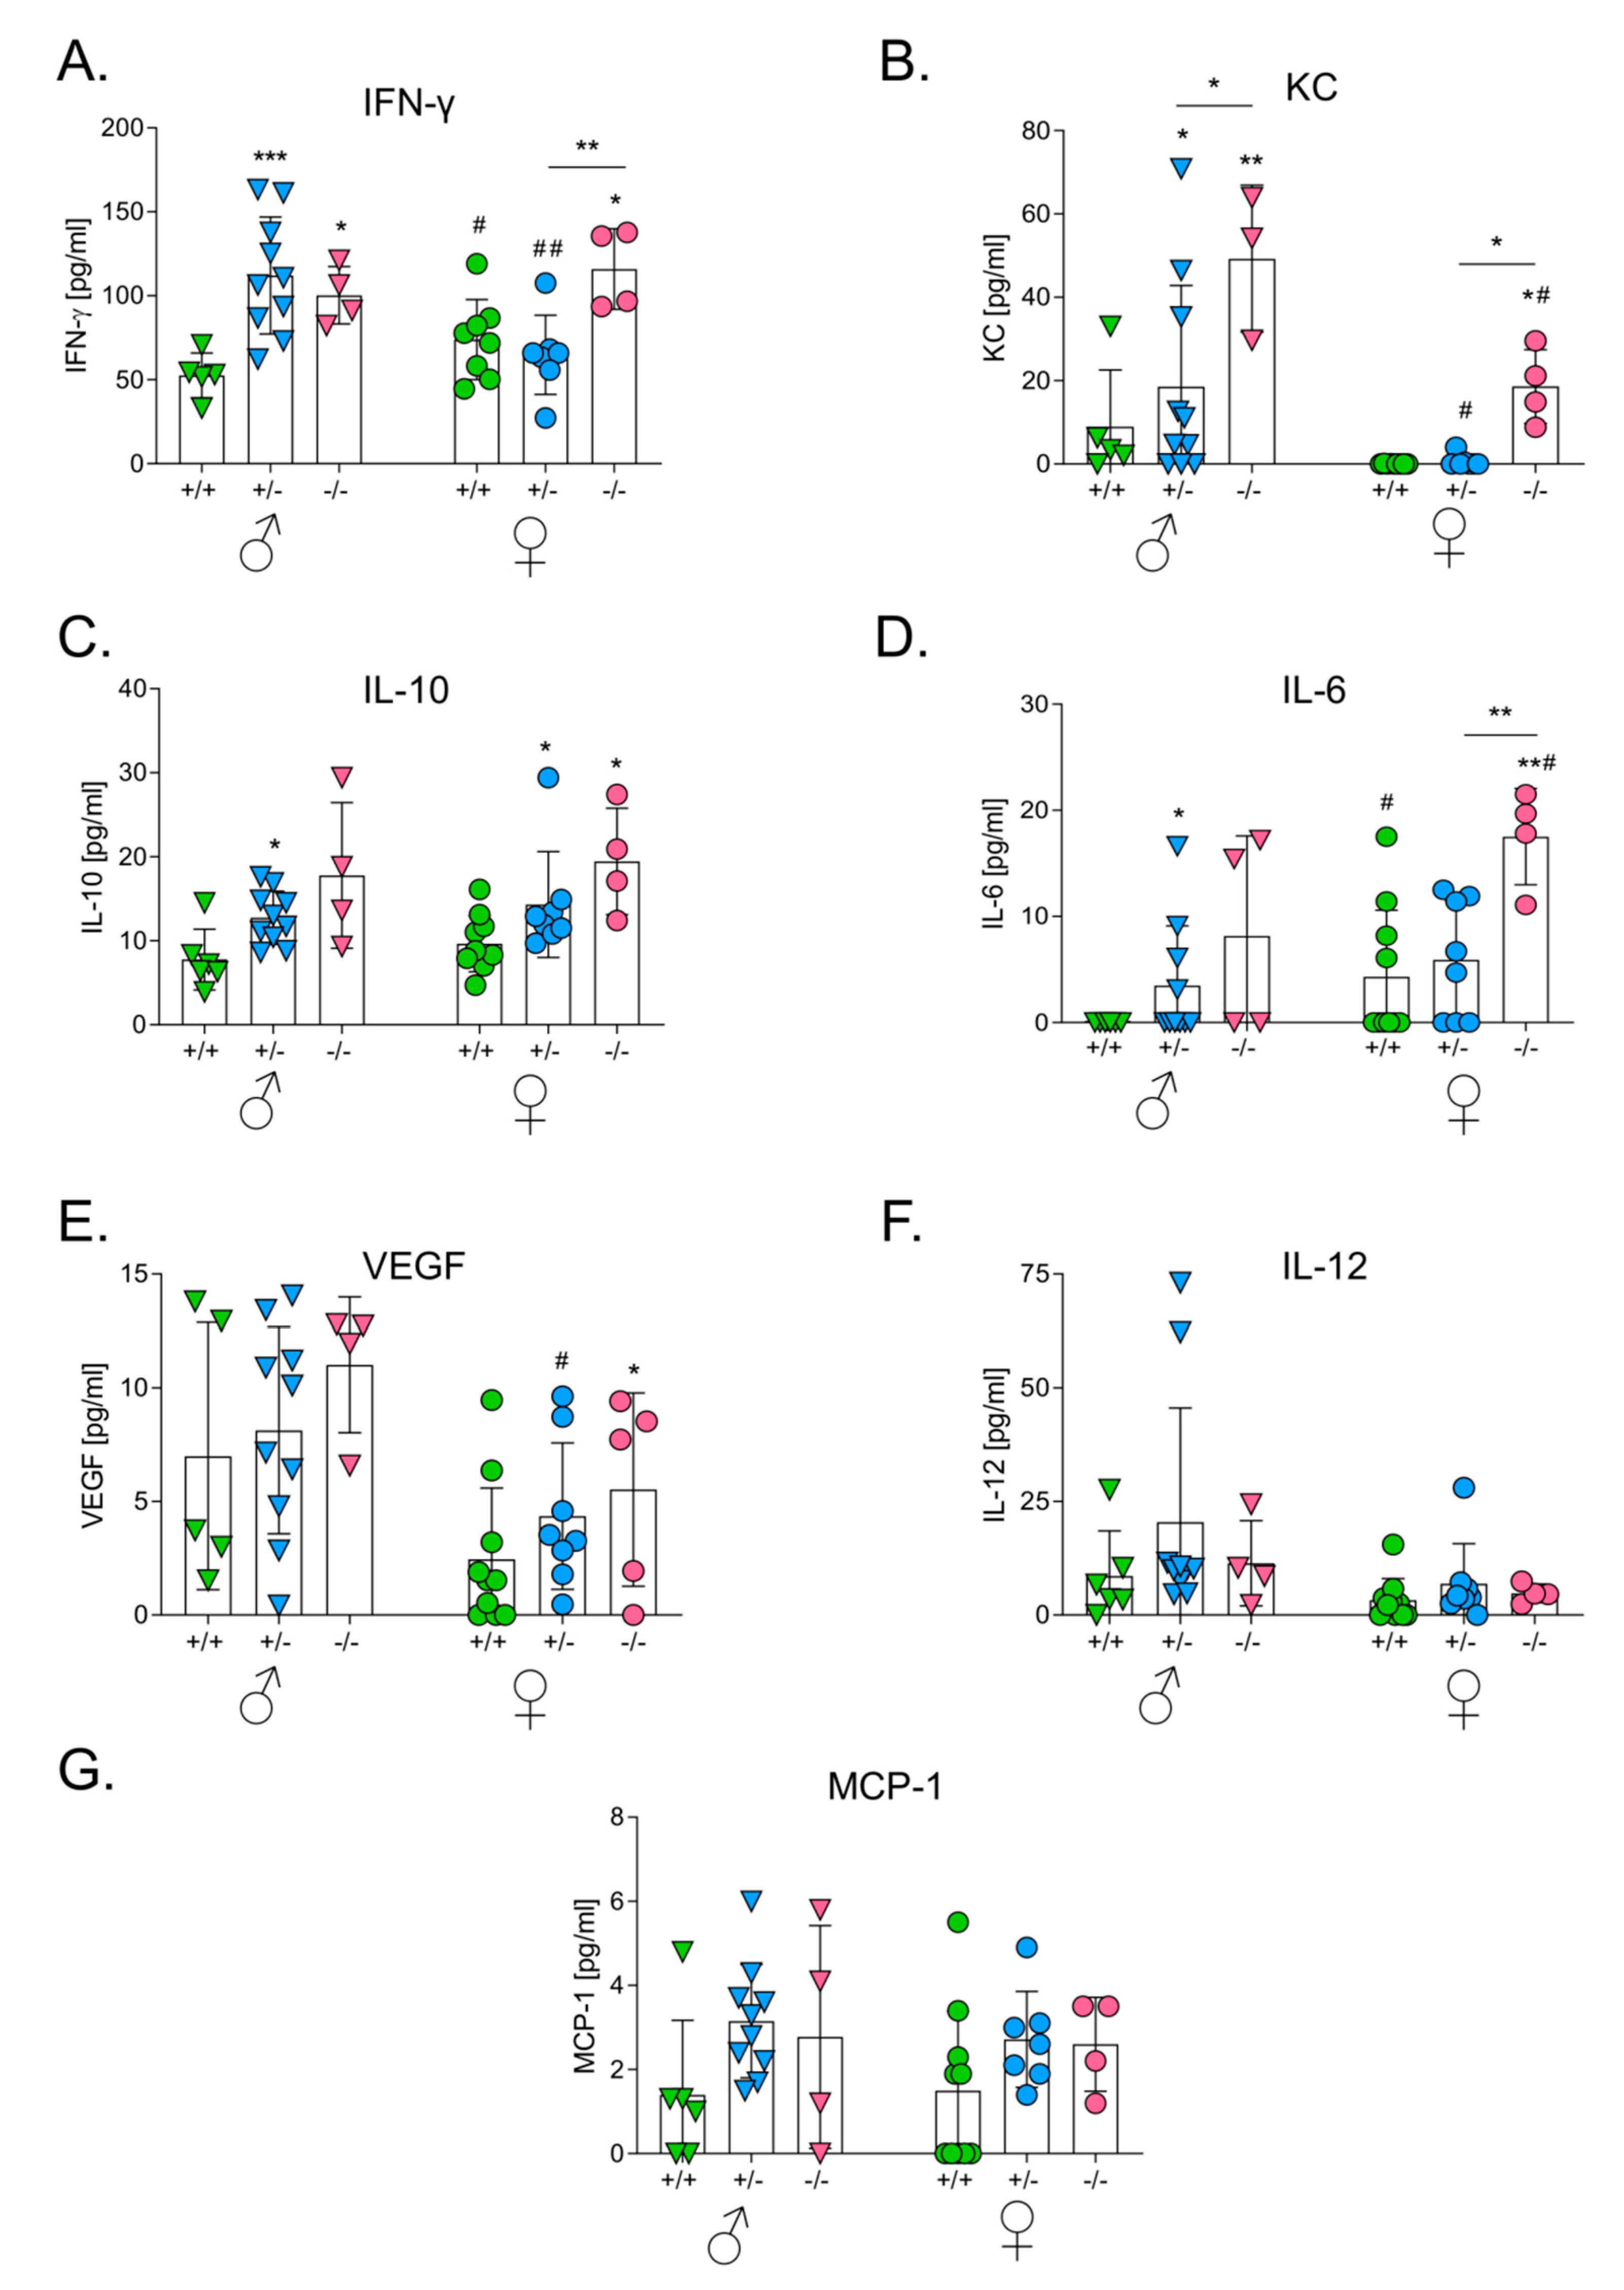
3.4. HO-1 Expression in Mice Influences Levels of Serum Cytokines after the Intracutaneous Inoculation of Melanoma
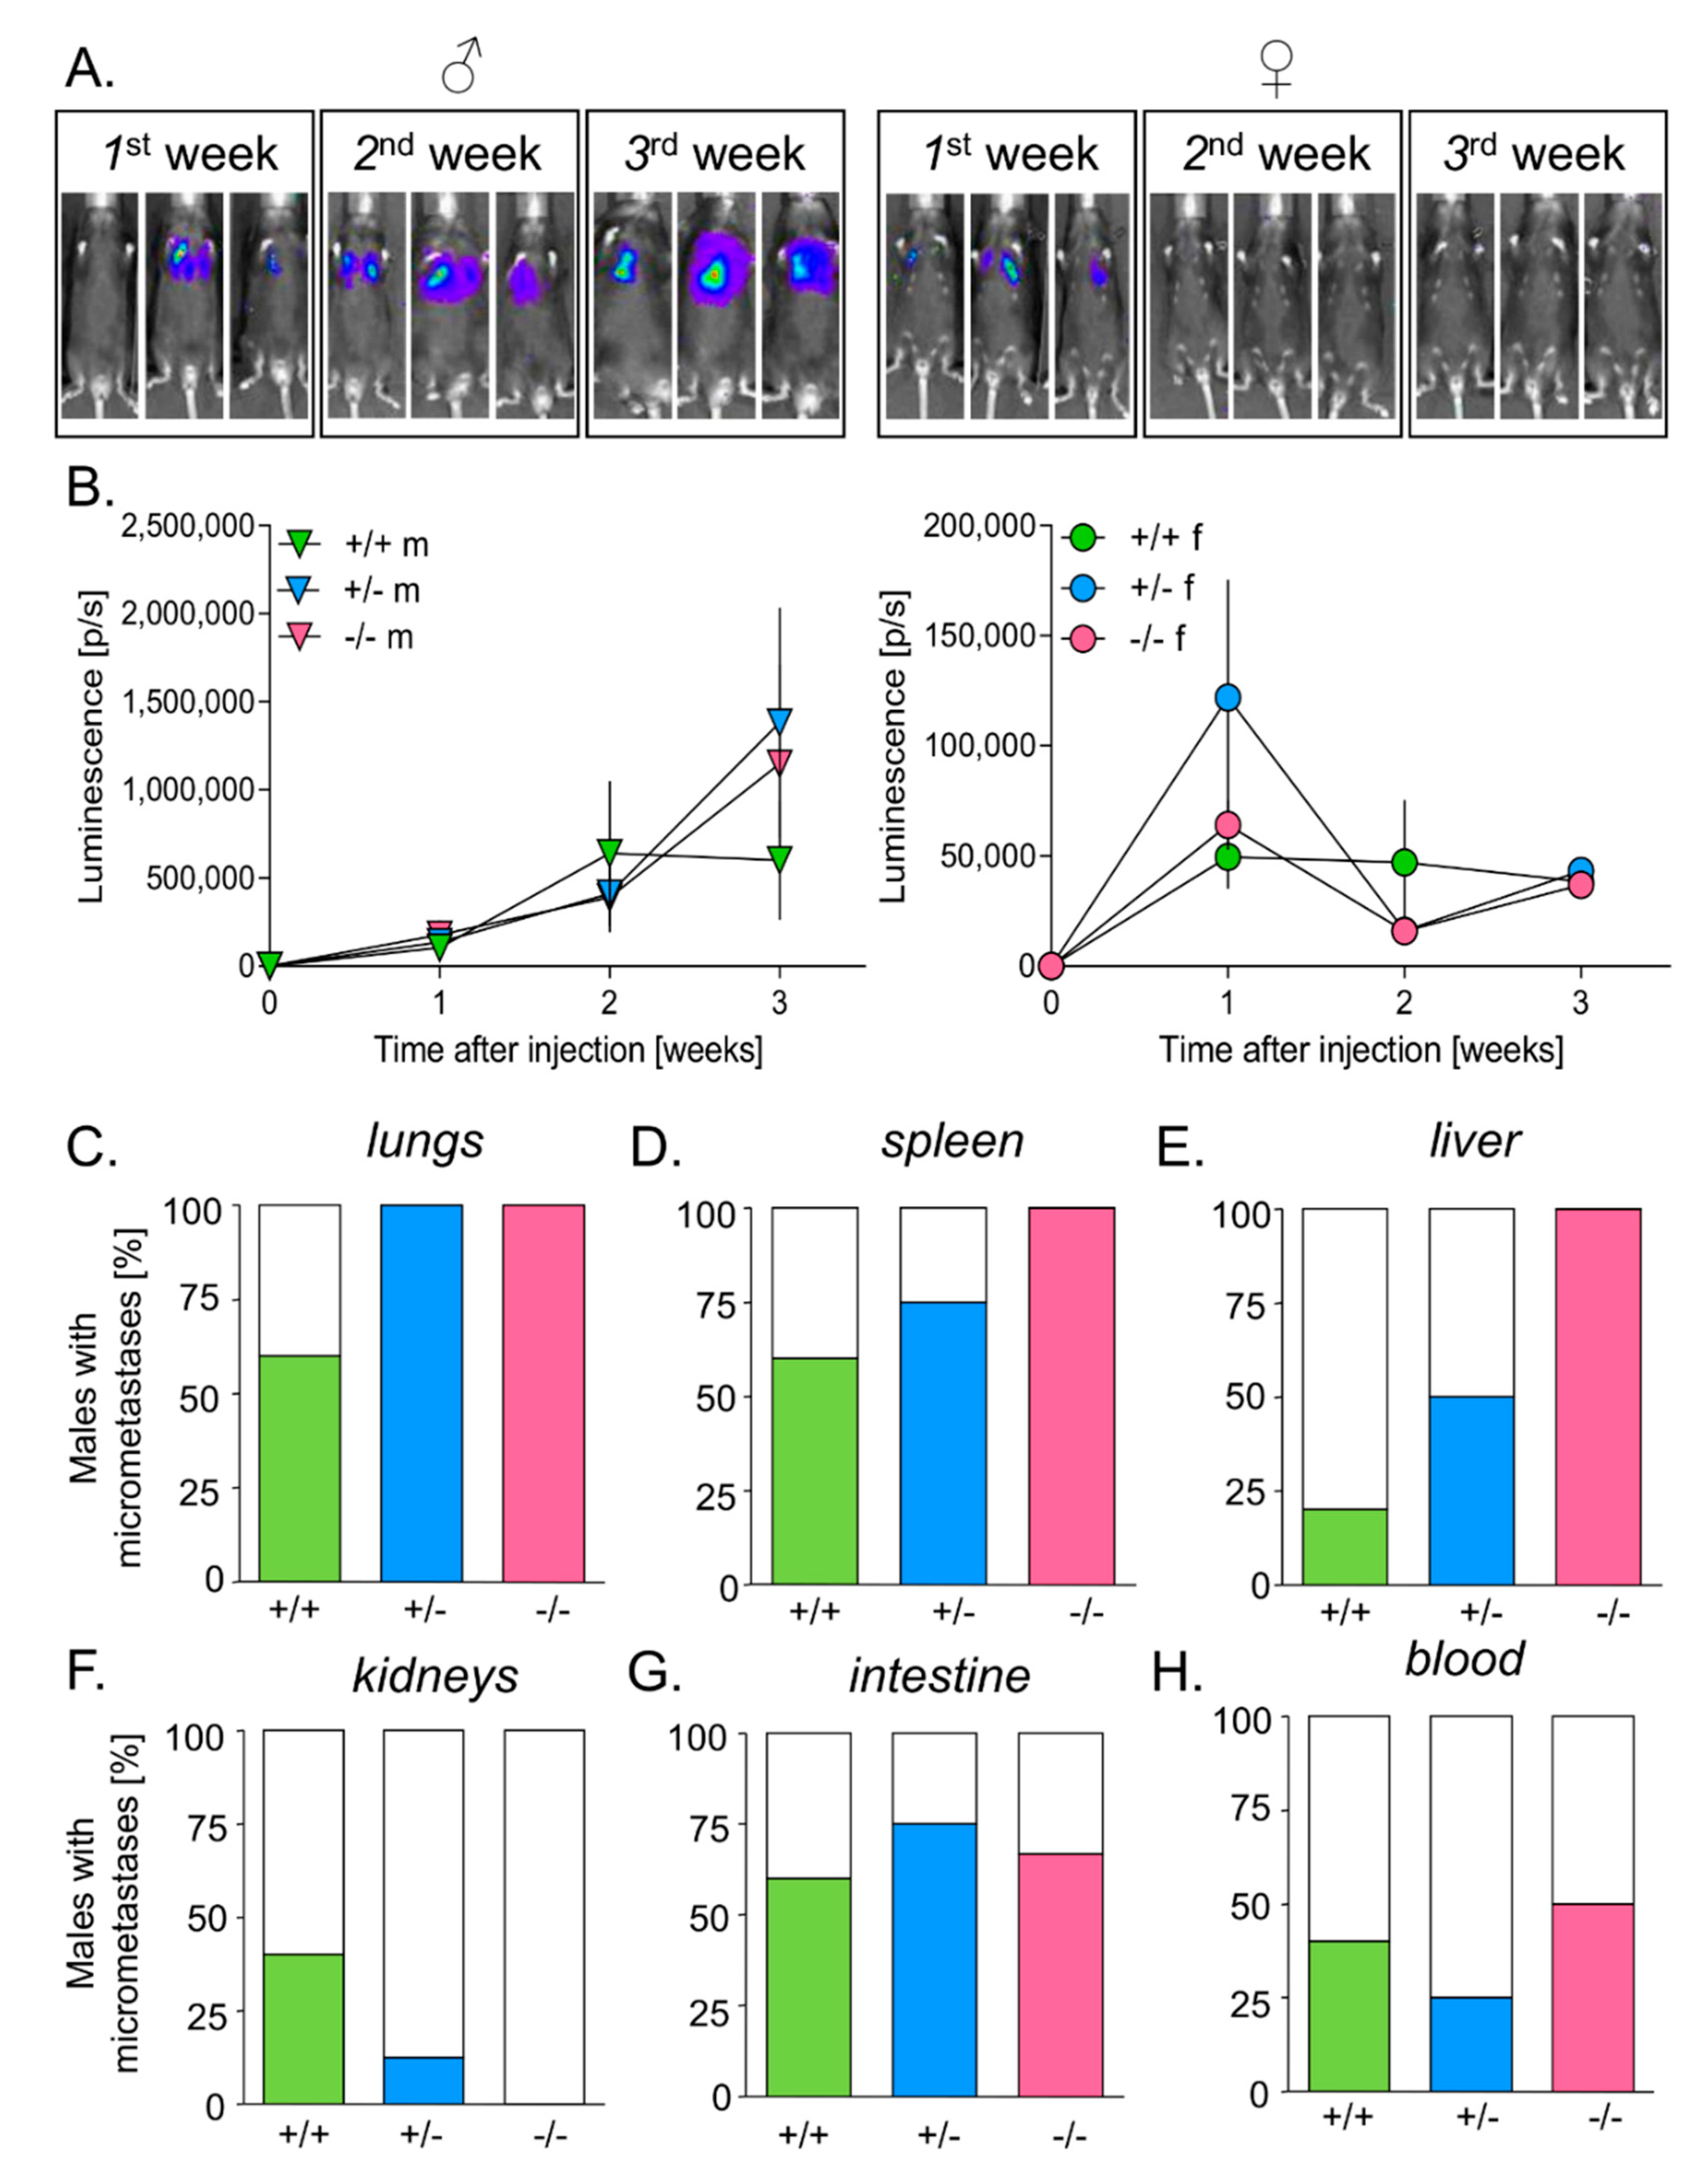
3.5. HO-1 Expression in Mice Inhibits Tumor Growth in Lungs
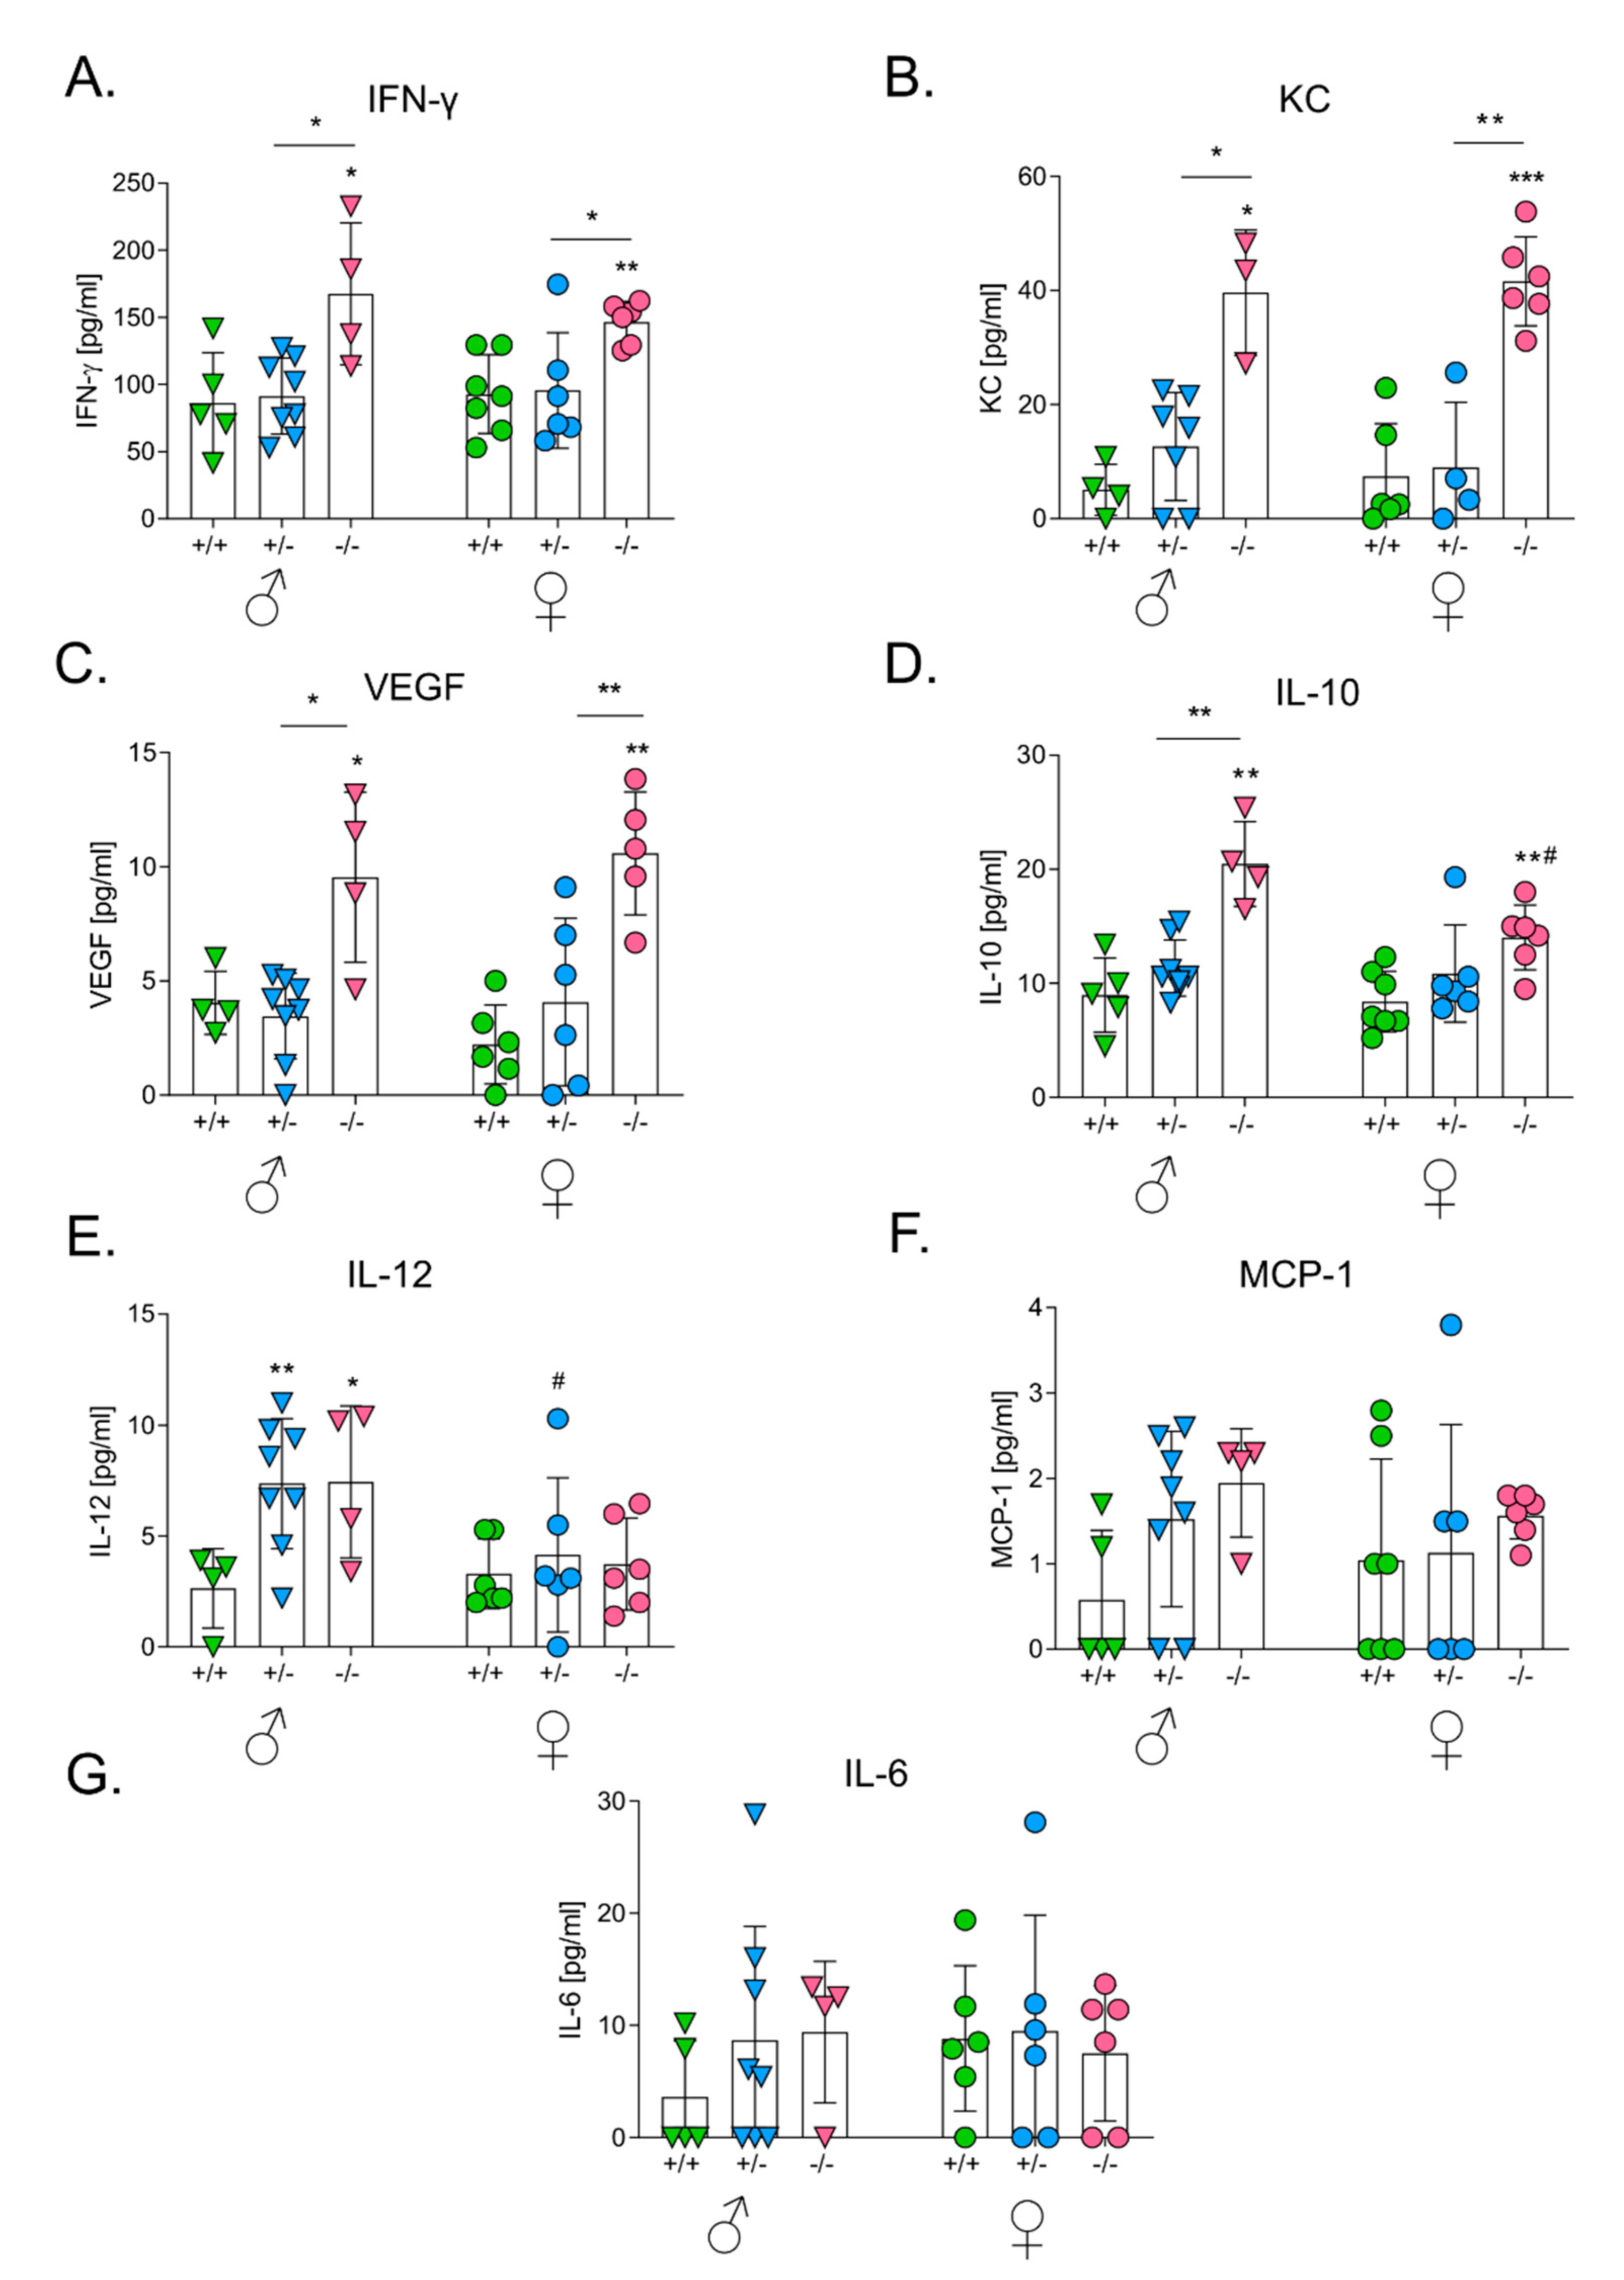
3.6. HO-1 Expression in Mice Influences Levels of Serum Cytokines after the Intravenous Inoculation of Melanoma
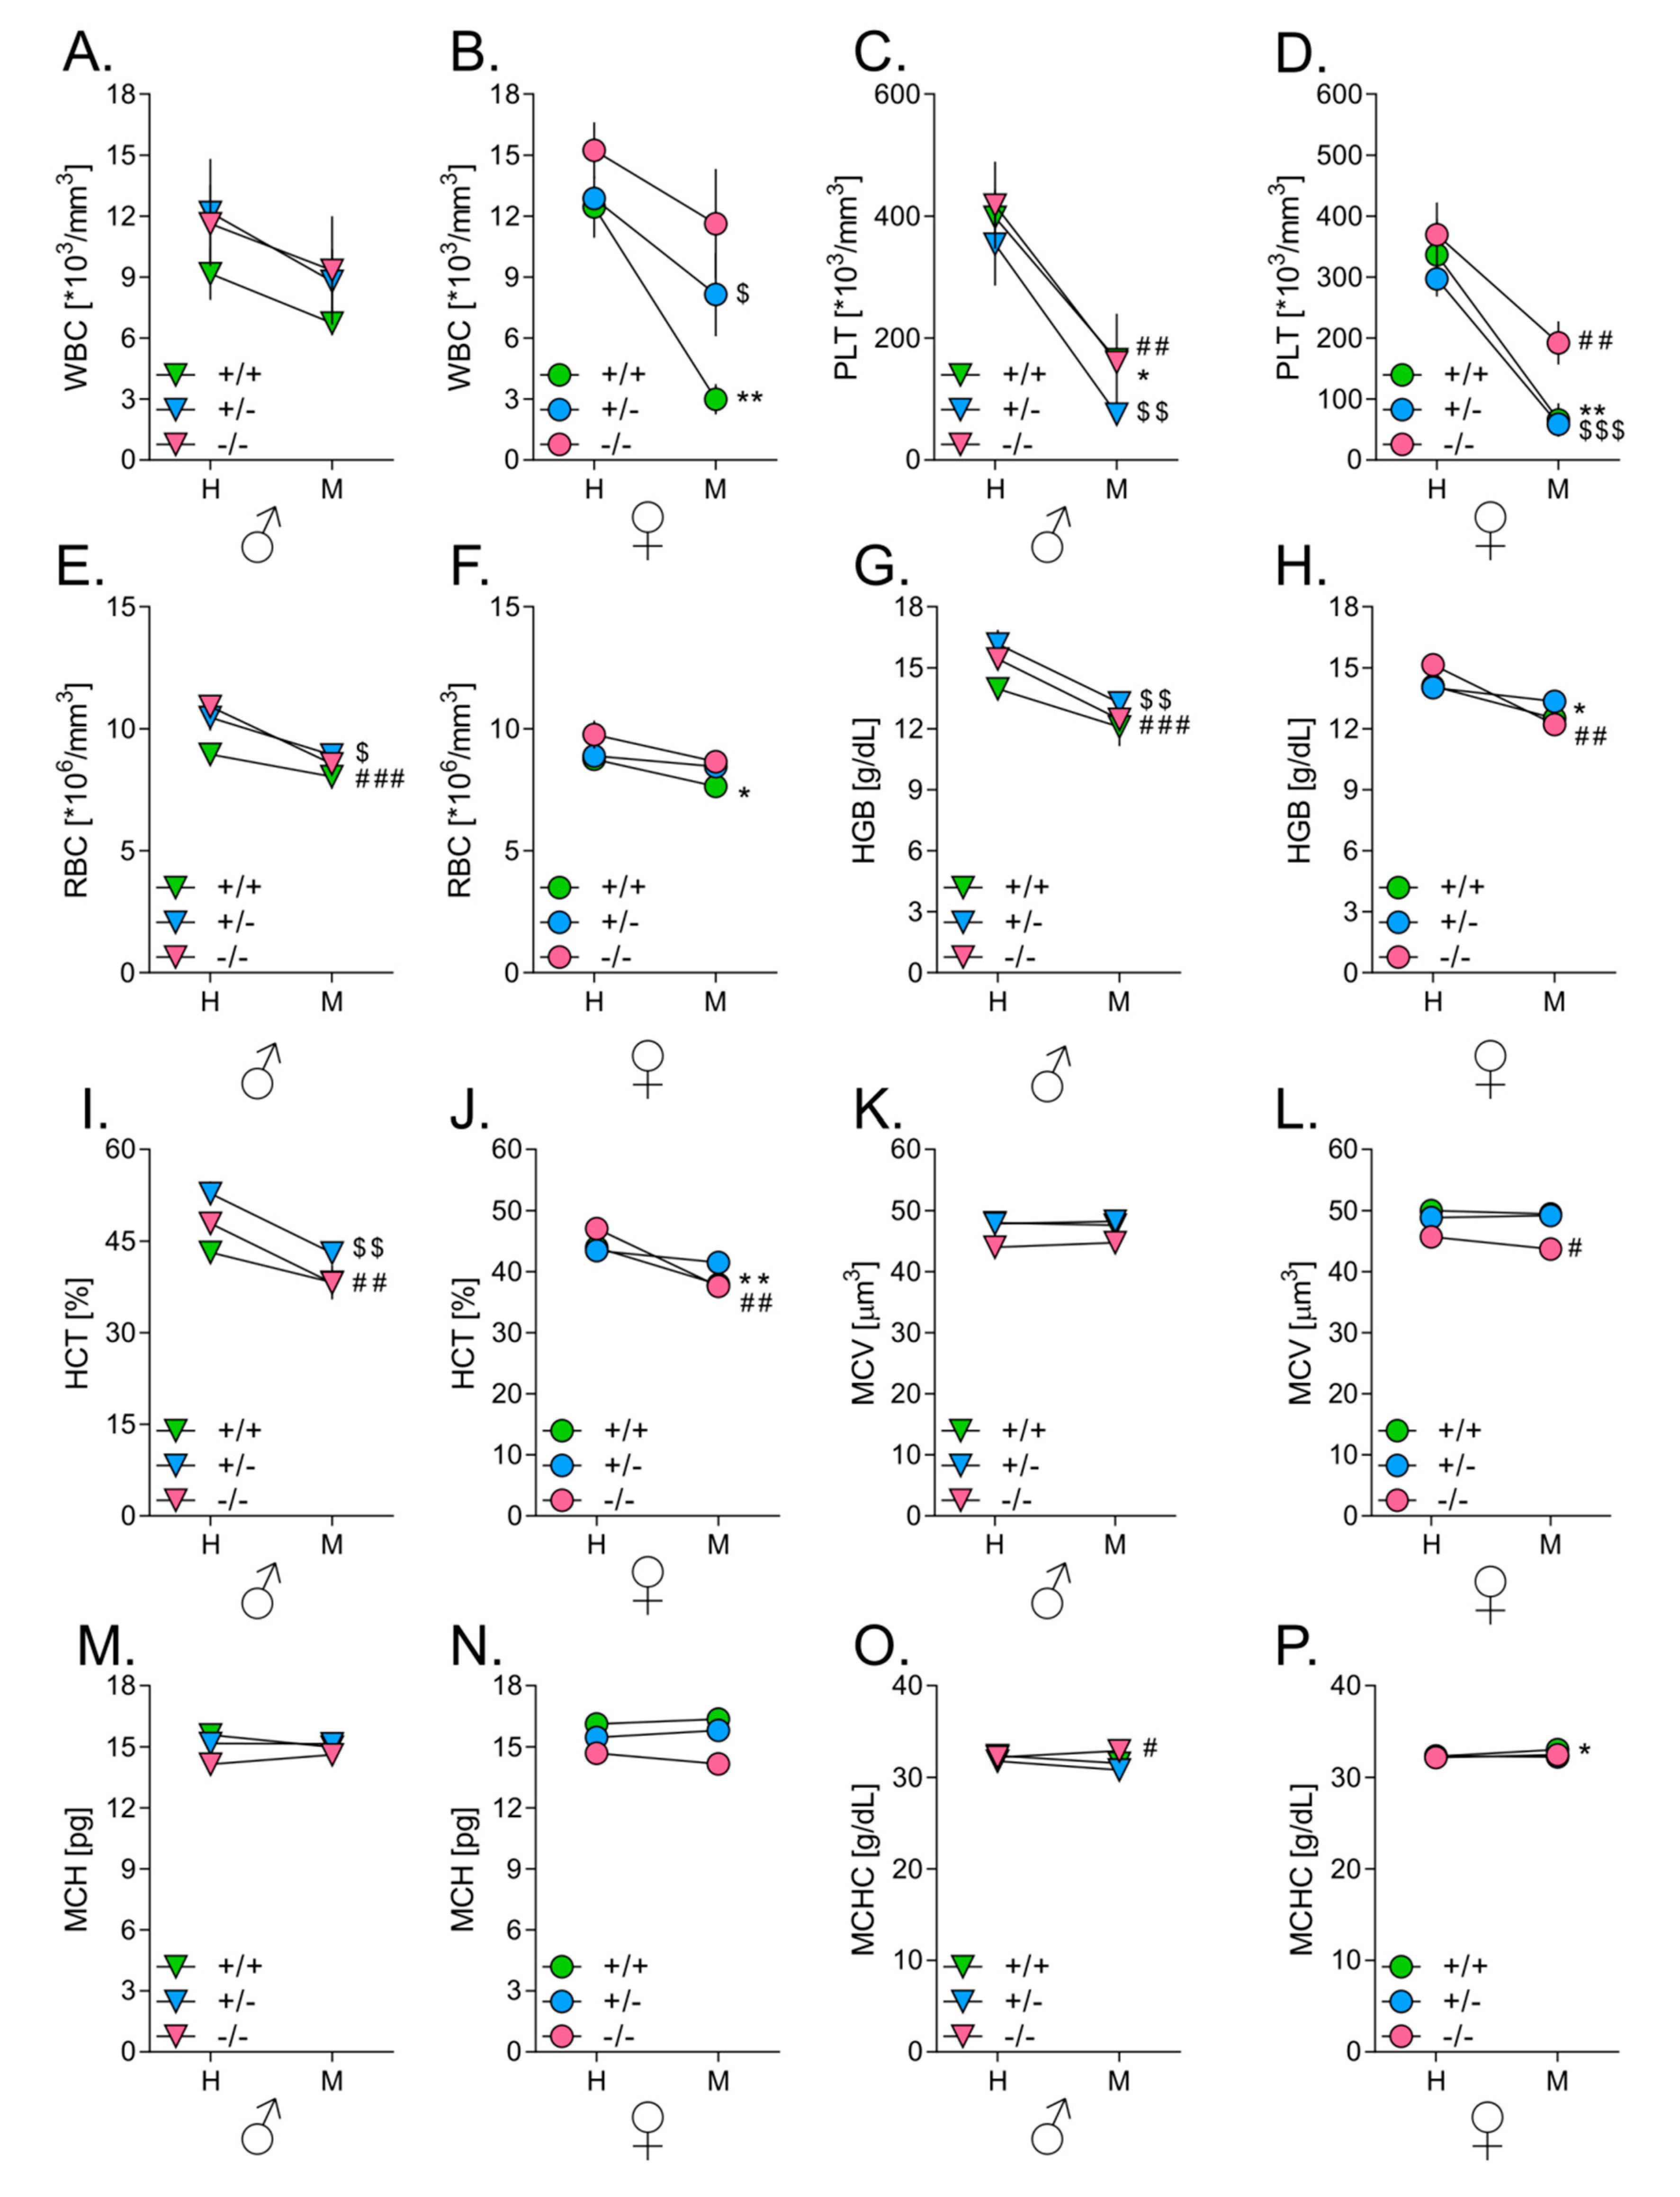
3.7. Melanoma Growth in Lungs Affects Hematological Parameters in Mice
4. Discussion
5. Conclusions
Supplementary Materials
Author Contributions
Funding
Acknowledgments
Conflicts of Interest
References
- Jozkowicz, A.; Was, H.; Dulak, J. Heme oxygenase-1 in tumors: Is it a false friend? Antioxid. Redox Signal. 2007, 9, 2099–2117. [Google Scholar] [CrossRef] [PubMed] [Green Version]
- Ryter, S.W.; Alam, J.; Choi, A.M. Heme oxygenase-1/carbon monoxide: From basic science to therapeutic applications. Physiol. Rev. 2006, 86, 583–650. [Google Scholar] [CrossRef] [PubMed]
- Loboda, A.; Jazwa, A.; Grochot-Przeczek, A.; Rutkowski, A.J.; Cisowski, J.; Agarwal, A.; Jozkowicz, A.; Dulak, J. Heme oxygenase-1 and the vascular bed: From molecular mechanisms to therapeutic opportunities. Antioxid. Redox Signal. 2008, 10, 1767–1812. [Google Scholar] [CrossRef] [PubMed]
- Torisu-Itakura, H.; Furue, M.; Kuwano, M.; Ono, M. Co-expression of thymidine phosphorylase and heme oxygenase-1 in macrophages in human malignant vertical growth melanomas. Jpn. J. Cancer Res. 2000, 91, 906–910. [Google Scholar] [CrossRef]
- Goodman, A.I.; Choudhury, M.; da Silva, J.L.; Schwartzman, M.L.; Abraham, N.G. Overexpression of the heme oxygenase gene in renal cell carcinoma. Proc. Soc. Exp. Biol. Med. 1997, 214, 54–61. [Google Scholar] [CrossRef] [PubMed]
- Maines, M.D.; Abrahamsson, P.A. Expression of heme oxygenase-1 (HSP32) in human prostate: Normal, hyperplastic, and tumor tissue distribution. Urology 1996, 47, 727–733. [Google Scholar] [CrossRef]
- Berberat, P.O.; Dambrauskas, Z.; Gulbinas, A.; Giese, T.; Giese, N.; Kunzli, B.; Autschbach, F.; Meuer, S.; Buchler, M.W.; Friess, H. Inhibition of heme oxygenase-1 increases responsiveness of pancreatic cancer cells to anticancer treatment. Clin. Cancer Res. 2005, 11, 3790–3798. [Google Scholar] [CrossRef] [Green Version]
- Nowis, D.; Legat, M.; Grzela, T.; Niderla, J.; Wilczek, E.; Wilczynski, G.M.; Glodkowska, E.; Mrowka, P.; Issat, T.; Dulak, J.; et al. Heme oxygenase-1 protects tumor cells against photodynamic therapy-mediated cytotoxicity. Oncogene 2006, 25, 3365–3374. [Google Scholar] [CrossRef] [Green Version]
- Kocanova, S.; Buytaert, E.; Matroule, J.Y.; Piette, J.; Golab, J.; de Witte, P.; Agostinis, P. Induction of heme-oxygenase 1 requires the p38MAPK and PI3K pathways and suppresses apoptotic cell death following hypericin-mediated photodynamic therapy. Apoptosis 2007, 12, 731–741. [Google Scholar] [CrossRef]
- Grimm, S.; Mvondo, D.; Grune, T.; Breusing, N. The outcome of 5-ALA-mediated photodynamic treatment in melanoma cells is influenced by vitamin C and heme oxygenase-1. Biofactors 2011, 37, 17–24. [Google Scholar] [CrossRef]
- Furfaro, A.L.; Ottonello, S.; Loi, G.; Cossu, I.; Piras, S.; Spagnolo, F.; Queirolo, P.; Marinari, U.M.; Moretta, L.; Pronzato, M.A.; et al. HO-1 downregulation favors BRAF(V600) melanoma cell death induced by Vemurafenib/PLX4032 and increases NK recognition. Int. J. Cancer 2019, 46, 1950–1962. [Google Scholar] [CrossRef] [PubMed]
- Zhe, N.; Wang, J.; Chen, S.; Lin, X.; Chai, Q.; Zhang, Y.; Zhao, J.; Fang, Q. Heme oxygenase-1 plays a crucial role in chemoresistance in acute myeloid leukemia. Hematology 2015, 20, 384–391. [Google Scholar] [CrossRef] [PubMed]
- Furfaro, A.L.; Traverso, N.; Domenicotti, C.; Piras, S.; Moretta, L.; Marinari, U.M.; Pronzato, M.A.; Nitti, M. The Nrf2/HO-1 Axis in Cancer Cell Growth and Chemoresistance. Oxid. Med. Cell Longev. 2016, 2016, 1958174. [Google Scholar] [CrossRef] [PubMed] [Green Version]
- Furfaro, A.L.; Piras, S.; Passalacqua, M.; Domenicotti, C.; Parodi, A.; Fenoglio, D.; Pronzato, M.A.; Marinari, U.M.; Moretta, L.; Traverso, N.; et al. HO-1 up-regulation: A key point in high-risk neuroblastoma resistance to bortezomib. Biochim. Biophys. Acta 2014, 1842, 613–622. [Google Scholar] [CrossRef] [Green Version]
- Was, H.; Cichon, T.; Smolarczyk, R.; Rudnicka, D.; Stopa, M.; Chevalier, C.; Leger, J.J.; Lackowska, B.; Grochot, A.; Bojkowska, K.; et al. Overexpression of heme oxygenase-1 in murine melanoma: Increased proliferation and viability of tumor cells, decreased survival of mice. Am. J. Pathol. 2006, 169, 2181–2198. [Google Scholar] [CrossRef] [Green Version]
- Schatton, T.; Frank, M.H. Cancer stem cells and human malignant melanoma. Pigment Cell Melanoma Res. 2008, 21, 39–55. [Google Scholar] [CrossRef] [Green Version]
- Santiago-Walker, A.; Li, L.; Haass, N.K.; Herlyn, M. Melanocytes: From morphology to application. Ski. Pharmacol. Physiol. 2009, 22, 114–121. [Google Scholar] [CrossRef]
- Villanueva, J.; Herlyn, M. Melanoma and the tumor microenvironment. Curr. Oncol. Rep. 2008, 10, 439–446. [Google Scholar] [CrossRef] [Green Version]
- Taha, H.; Skrzypek, K.; Guevara, I.; Nigisch, A.; Mustafa, S.; Grochot-Przeczek, A.; Ferdek, P.; Was, H.; Kotlinowski, J.; Kozakowska, M.; et al. Role of heme oxygenase-1 in human endothelial cells: Lesson from the promoter allelic variants. Arterioscler. Thromb. Vasc. Biol. 2010, 30, 1634–1641. [Google Scholar] [CrossRef] [Green Version]
- Exner, M.; Schillinger, M.; Minar, E.; Mlekusch, W.; Schlerka, G.; Haumer, M.; Mannhalter, C.; Wagner, O. Heme oxygenase-1 gene promoter microsatellite polymorphism is associated with restenosis after percutaneous transluminal angioplasty. J. Endovasc. Ther. 2001, 8, 433–440. [Google Scholar] [CrossRef]
- Schillinger, M.; Exner, M.; Minar, E.; Mlekusch, W.; Mullner, M.; Mannhalter, C.; Bach, F.H.; Wagner, O. Heme oxygenase-1 genotype and restenosis after balloon angioplasty: A novel vascular protective factor. J. Am. Coll. Cardiol. 2004, 43, 950–957. [Google Scholar] [CrossRef] [PubMed] [Green Version]
- Kikuchi, A.; Yamaya, M.; Suzuki, S.; Yasuda, H.; Kubo, H.; Nakayama, K.; Handa, M.; Sasaki, T.; Shibahara, S.; Sekizawa, K.; et al. Association of susceptibility to the development of lung adenocarcinoma with the heme oxygenase-1 gene promoter polymorphism. Hum. Genet. 2005, 116, 354–360. [Google Scholar] [CrossRef] [PubMed]
- Lin, S.C.; Liu, C.J.; Yeh, W.I.; Lui, M.T.; Chang, K.W.; Chang, C.S. Functional polymorphism in NFKB1 promoter is related to the risks of oral squamous cell carcinoma occurring on older male areca (betel) chewers. Cancer Lett. 2006, 243, 47–54. [Google Scholar] [CrossRef] [PubMed]
- Was, H.; Sokolowska, M.; Sierpniowska, A.; Dominik, P.; Skrzypek, K.; Lackowska, B.; Pratnicki, A.; Grochot-Przeczek, A.; Taha, H.; Kotlinowski, J.; et al. Effects of heme oxygenase-1 on induction and development of chemically induced squamous cell carcinoma in mice. Free Radic. Biol. Med. 2011, 51, 1717–1726. [Google Scholar] [CrossRef] [Green Version]
- Jozkowicz, A.; Dulak, J. Effects of protoporphyrins on production of nitric oxide and expression of vascular endothelial growth factor in vascular smooth muscle cells and macrophages. Acta Biochim. Pol. 2003, 50, 69–79. [Google Scholar] [CrossRef] [Green Version]
- Reintgen, D.S.; Paull, D.E.; Seigler, H.F.; Cox, E.B.; McCarty, K.S., Jr. Sex related survival differences in instances of melanoma. Surg. Gynecol. Obstet. 1984, 159, 367–372. [Google Scholar]
- White, L.P. Studies on melanoma. II. Sex and survival in human melanoma. N. Engl. J. Med. 1959, 260, 789–797. [Google Scholar] [CrossRef]
- Kemeny, M.M.; Busch, E.; Stewart, A.K.; Menck, H.R. Superior survival of young women with malignant melanoma. Am. J. Surg. 1998, 175, 437–444; discussion 444–435. [Google Scholar] [CrossRef]
- Roh, M.R.; Eliades, P.; Gupta, S.; Grant-Kels, J.M.; Tsao, H. Cutaneous melanoma in women. Int. J. Womens Dermatol. 2017, 3, S11–S15. [Google Scholar] [CrossRef]
- Kanda, N.; Watanabe, S. 17beta-estradiol, progesterone, and dihydrotestosterone suppress the growth of human melanoma by inhibiting interleukin-8 production. J Investig. Dermatol. 2001, 117, 274–283. [Google Scholar] [CrossRef] [Green Version]
- de Giorgi, V.; Mavilia, C.; Massi, D.; Gozzini, A.; Aragona, P.; Tanini, A.; Sestini, S.; Paglierani, M.; Boddi, V.; Brandi, M.L.; et al. Estrogen receptor expression in cutaneous melanoma: A real-time reverse transcriptase-polymerase chain reaction and immunohistochemical study. Arch. Dermatol. 2009, 145, 30–36. [Google Scholar] [CrossRef] [PubMed] [Green Version]
- Schmidt, A.N.; Nanney, L.B.; Boyd, A.S.; King, L.E., Jr.; Ellis, D.L. Oestrogen receptor-beta expression in melanocytic lesions. Exp. Dermatol. 2006, 15, 971–980. [Google Scholar] [CrossRef] [PubMed]
- Cho, J.L.; Allanson, M.; Reeve, V.E. Oestrogen receptor-beta signalling protects against transplanted skin tumour growth in the mouse. Photochem. Photobiol. Sci. 2010, 9, 608–614. [Google Scholar] [CrossRef] [PubMed]
- Miyazaki, K. Novel approach for evaluation of estrogenic and anti-estrogenic activities of genistein and daidzein using B16 melanoma cells and dendricity assay. Pigment Cell Res. Spons. Eur. Soc. Pigment Cell Res. Int. Pigment Cell Soc. 2004, 17, 407–412. [Google Scholar] [CrossRef]
- Shih, I.M.; Speicher, D.; Hsu, M.Y.; Levine, E.; Herlyn, M. Melanoma cell-cell interactions are mediated through heterophilic Mel-CAM/ligand adhesion. Cancer Res. 1997, 57, 3835–3840. [Google Scholar]
- Sober, A.J.; Day, C.L., Jr.; Fitzpatrick, T.B.; Lew, R.A.; Kopf, A.W.; Mihm, M.C., Jr. Factors associated with death from melanoma from 2 to 5 years following diagnosis in clinical stage I patients. J. Investig. Dermatol. 1983, 80, 53s–55s. [Google Scholar] [CrossRef]
- Brocker, E.B.; Zwadlo, G.; Holzmann, B.; Macher, E.; Sorg, C. Inflammatory cell infiltrates in human melanoma at different stages of tumor progression. Int. J. Cancer 1988, 41, 562–567. [Google Scholar] [CrossRef]
- Kawakami, Y.; Suzuki, Y.; Shofuda, T.; Kiniwa, Y.; Inozume, T.; Dan, K.; Sakurai, T.; Fujita, T. T cell immune responses against melanoma and melanocytes in cancer and autoimmunity. Pigment Cell Res. 2000, 13 (Suppl. 8), 163–169. [Google Scholar] [CrossRef]
- Gabrilovich, D.I.; Ostrand-Rosenberg, S.; Bronte, V. Coordinated regulation of myeloid cells by tumours. Nat. Rev. Immunol. 2012, 12, 253–268. [Google Scholar] [CrossRef] [Green Version]
- Monu, N.R.; Frey, A.B. Myeloid-derived suppressor cells and anti-tumor T cells: A complex relationship. Immunol. Investig. 2012, 41, 595–613. [Google Scholar] [CrossRef] [Green Version]
- Poss, K.D.; Tonegawa, S. Reduced stress defense in heme oxygenase 1-deficient cells. Proc. Natl. Acad. Sci. USA 1997, 94, 10925–10930. [Google Scholar] [CrossRef] [PubMed] [Green Version]
- Kapturczak, M.H.; Wasserfall, C.; Brusko, T.; Campbell-Thompson, M.; Ellis, T.M.; Atkinson, M.A.; Agarwal, A. Heme oxygenase-1 modulates early inflammatory responses: Evidence from the heme oxygenase-1-deficient mouse. Am. J. Pathol. 2004, 165, 1045–1053. [Google Scholar] [CrossRef]
- Surcel, M.; Constantin, C.; Caruntu, C.; Zurac, S.; Neagu, M. Inflammatory Cytokine Pattern Is Sex-Dependent in Mouse Cutaneous Melanoma Experimental Model. J. Immunol. Res. 2017, 2017, 9212134. [Google Scholar] [CrossRef] [PubMed]
- Gao, J.; Shi, L.Z.; Zhao, H.; Chen, J.; Xiong, L.; He, Q.; Chen, T.; Roszik, J.; Bernatchez, C.; Woodman, S.E.; et al. Loss of IFN-gamma Pathway Genes in Tumor Cells as a Mechanism of Resistance to Anti-CTLA-4 Therapy. Cell 2016, 167, 397–404.e9. [Google Scholar] [CrossRef]
- Gomez-Lomeli, P.; Bravo-Cuellar, A.; Hernandez-Flores, G.; Jave-Suarez, L.F.; Aguilar-Lemarroy, A.; Lerma-Diaz, J.M.; Dominguez-Rodriguez, J.R.; Sanchez-Reyes, K.; Ortiz-Lazareno, P.C. Increase of IFN-gamma and TNF-alpha production in CD107a + NK-92 cells co-cultured with cervical cancer cell lines pre-treated with the HO-1 inhibitor. Cancer Cell Int. 2014, 14, 100. [Google Scholar] [CrossRef] [Green Version]
- Smyth, M.J.; Taniguchi, M.; Street, S.E. The anti-tumor activity of IL-12: Mechanisms of innate immunity that are model and dose dependent. J. Immunol. 2000, 165, 2665–2670. [Google Scholar] [CrossRef] [Green Version]
- Brunda, M.J.; Luistro, L.; Warrier, R.R.; Wright, R.B.; Hubbard, B.R.; Murphy, M.; Wolf, S.F.; Gately, M.K. Antitumor and antimetastatic activity of interleukin 12 against murine tumors. J. Exp. Med. 1993, 178, 1223–1230. [Google Scholar] [CrossRef]
- Chauveau, C.; Remy, S.; Royer, P.J.; Hill, M.; Tanguy-Royer, S.; Hubert, F.X.; Tesson, L.; Brion, R.; Beriou, G.; Gregoire, M.; et al. Heme oxygenase-1 expression inhibits dendritic cell maturation and proinflammatory function but conserves IL-10 expression. Blood 2005, 106, 1694–1702. [Google Scholar] [CrossRef] [Green Version]
- Wu, W.; Ma, D.; Wang, P.; Cao, L.; Lu, T.; Fang, Q.; Zhao, J.; Wang, J. Potential crosstalk of the interleukin-6-heme oxygenase-1-dependent mechanism involved in resistance to lenalidomide in multiple myeloma cells. FEBS J. 2016, 283, 834–849. [Google Scholar] [CrossRef]
- Laino, A.S.; Woods, D.; Vassallo, M.; Qian, X.; Tang, H.; Wind-Rotolo, M.; Weber, J. Serum interleukin-6 and C-reactive protein are associated with survival in melanoma patients receiving immune checkpoint inhibition. J. Immunother. Cancer 2020, 8. [Google Scholar] [CrossRef]
- Hoejberg, L.; Bastholt, L.; Johansen, J.S.; Christensen, I.J.; Gehl, J.; Schmidt, H. Serum interleukin-6 as a prognostic biomarker in patients with metastatic melanoma. Melanoma Res. 2012, 22, 287–293. [Google Scholar] [CrossRef] [PubMed]
- Mackiewicz, A.; Mackiewicz, J.; Wysocki, P.J.; Wiznerowicz, M.; Kapcinska, M.; Laciak, M.; Rose-John, S.; Izycki, D.; Burzykowski, T.; Karczewska-Dzionk, A. Long-term survival of high-risk melanoma patients immunized with a Hyper-IL-6-modified allogeneic whole-cell vaccine after complete resection. Expert. Opin. Investig. Drugs 2012, 21, 773–783. [Google Scholar] [CrossRef] [PubMed]
- Choi, B.M.; Pae, H.O.; Jeong, Y.R.; Kim, Y.M.; Chung, H.T. Critical role of heme oxygenase-1 in Foxp3-mediated immune suppression. Biochem. Biophys. Res. Commun. 2005, 327, 1066–1071. [Google Scholar] [CrossRef] [PubMed]
- George, J.F.; Braun, A.; Brusko, T.M.; Joseph, R.; Bolisetty, S.; Wasserfall, C.H.; Atkinson, M.A.; Agarwal, A.; Kapturczak, M.H. Suppression by CD4+CD25+ regulatory T cells is dependent on expression of heme oxygenase-1 in antigen-presenting cells. Am. J. Pathol. 2008, 173, 154–160. [Google Scholar] [CrossRef] [PubMed] [Green Version]
- Gray, C.P.; Franco, A.V.; Arosio, P.; Hersey, P. Immunosuppressive effects of melanoma-derived heavy-chain ferritin are dependent on stimulation of IL-10 production. Int. J. Cancer 2001, 92, 843–850. [Google Scholar] [CrossRef] [PubMed]
- Gray, C.P.; Arosio, P.; Hersey, P. Association of increased levels of heavy-chain ferritin with increased CD4+ CD25+ regulatory T-cell levels in patients with melanoma. Clin. Cancer Res. 2003, 9, 2551–2559. [Google Scholar] [PubMed]
- Becker, J.C.; Brocker, E.B. Lymphocyte-melanoma interaction: Role of surface molecules. Recent Results Cancer Res. Fortschr. Der Krebsforsch. 1995, 139, 205–214. [Google Scholar] [CrossRef]
- Vence, L.; Palucka, A.K.; Fay, J.W.; Ito, T.; Liu, Y.J.; Banchereau, J.; Ueno, H. Circulating tumor antigen-specific regulatory T cells in patients with metastatic melanoma. Proc. Natl. Acad. Sci. USA 2007, 104, 20884–20889. [Google Scholar] [CrossRef] [Green Version]
- Nitti, M.; Piras, S.; Marinari, U.M.; Moretta, L.; Pronzato, M.A.; Furfaro, A.L. HO-1 Induction in Cancer Progression: A Matter of Cell Adaptation. Antioxidants 2017, 6, 29. [Google Scholar] [CrossRef]
- Re, F.; Srinivasan, R.; Igarashi, T.; Marincola, F.; Childs, R. Green fluorescent protein expression in dendritic cells enhances their immunogenicity and elicits specific cytotoxic T-cell responses in humans. Exp. Hematol. 2004, 32, 210–217. [Google Scholar] [CrossRef]
- Liu, Q.; Wang, B.; Yin, Y.; Chen, G.; Wang, W.; Gao, X.; Wang, P.; Zhou, H. Overexpressions of HO-1/HO-1G143H in C57/B6J mice affect melanoma B16F10 lung metastases rather than change the survival rate of mice-bearing tumours. Exp. Biol. Med. 2013, 238, 696–704. [Google Scholar] [CrossRef] [PubMed]
- Bednarz, A.; Lipinski, P.; Starzynski, R.R.; Tomczyk, M.; Nowak, W.; Mucha, O.; Ogorek, M.; Pierzchala, O.; Jonczy, A.; Staron, R.; et al. Role of the kidneys in the redistribution of heme-derived iron during neonatal hemolysis in mice. Sci. Rep. 2019, 9, 11102. [Google Scholar] [CrossRef] [PubMed] [Green Version]
- Jozkowicz, A.; Huk, I.; Nigisch, A.; Weigel, G.; Dietrich, W.; Motterlini, R.; Dulak, J. Heme oxygenase and angiogenic activity of endothelial cells: Stimulation by carbon monoxide and inhibition by tin protoporphyrin-IX. Antioxid. Redox Signal. 2003, 5, 155–162. [Google Scholar] [CrossRef] [PubMed]
- Pittock, S.T.; Norby, S.M.; Grande, J.P.; Croatt, A.J.; Bren, G.D.; Badley, A.D.; Caplice, N.M.; Griffin, M.D.; Nath, K.A. MCP-1 is up-regulated in unstressed and stressed HO-1 knockout mice: Pathophysiologic correlates. Kidney Int. 2005, 68, 611–622. [Google Scholar] [CrossRef] [PubMed] [Green Version]
- Nakasone, Y.; Fujimoto, M.; Matsushita, T.; Hamaguchi, Y.; Huu, D.L.; Yanaba, M.; Sato, S.; Takehara, K.; Hasegawa, M. Host-derived MCP-1 and MIP-1alpha regulate protective anti-tumor immunity to localized and metastatic B16 melanoma. Am. J. Pathol. 2012, 180, 365–374. [Google Scholar] [CrossRef]


Publisher’s Note: MDPI stays neutral with regard to jurisdictional claims in published maps and institutional affiliations. |
© 2020 by the authors. Licensee MDPI, Basel, Switzerland. This article is an open access article distributed under the terms and conditions of the Creative Commons Attribution (CC BY) license (http://creativecommons.org/licenses/by/4.0/).
Share and Cite
Was, H.; Cichon, T.; Smolarczyk, R.; Lackowska, B.; Mazur-Bialy, A.; Mazur, M.; Szade, A.; Dominik, P.; Mazan, M.; Kotlinowski, J.; et al. Effect of Heme Oxygenase-1 on Melanoma Development in Mice—Role of Tumor-Infiltrating Immune Cells. Antioxidants 2020, 9, 1223. https://doi.org/10.3390/antiox9121223
Was H, Cichon T, Smolarczyk R, Lackowska B, Mazur-Bialy A, Mazur M, Szade A, Dominik P, Mazan M, Kotlinowski J, et al. Effect of Heme Oxygenase-1 on Melanoma Development in Mice—Role of Tumor-Infiltrating Immune Cells. Antioxidants. 2020; 9(12):1223. https://doi.org/10.3390/antiox9121223
Chicago/Turabian StyleWas, Halina, Tomasz Cichon, Ryszard Smolarczyk, Bozena Lackowska, Agnieszka Mazur-Bialy, Magdalena Mazur, Agata Szade, Pawel Dominik, Milena Mazan, Jerzy Kotlinowski, and et al. 2020. "Effect of Heme Oxygenase-1 on Melanoma Development in Mice—Role of Tumor-Infiltrating Immune Cells" Antioxidants 9, no. 12: 1223. https://doi.org/10.3390/antiox9121223