Preparation and Characterization of Corn Starch Bio-Active Edible Packaging Films Based on Zein Incorporated with Orange-Peel Oil


Abstract
:1. Introduction
2. Materials and Methods
2.1. Materials
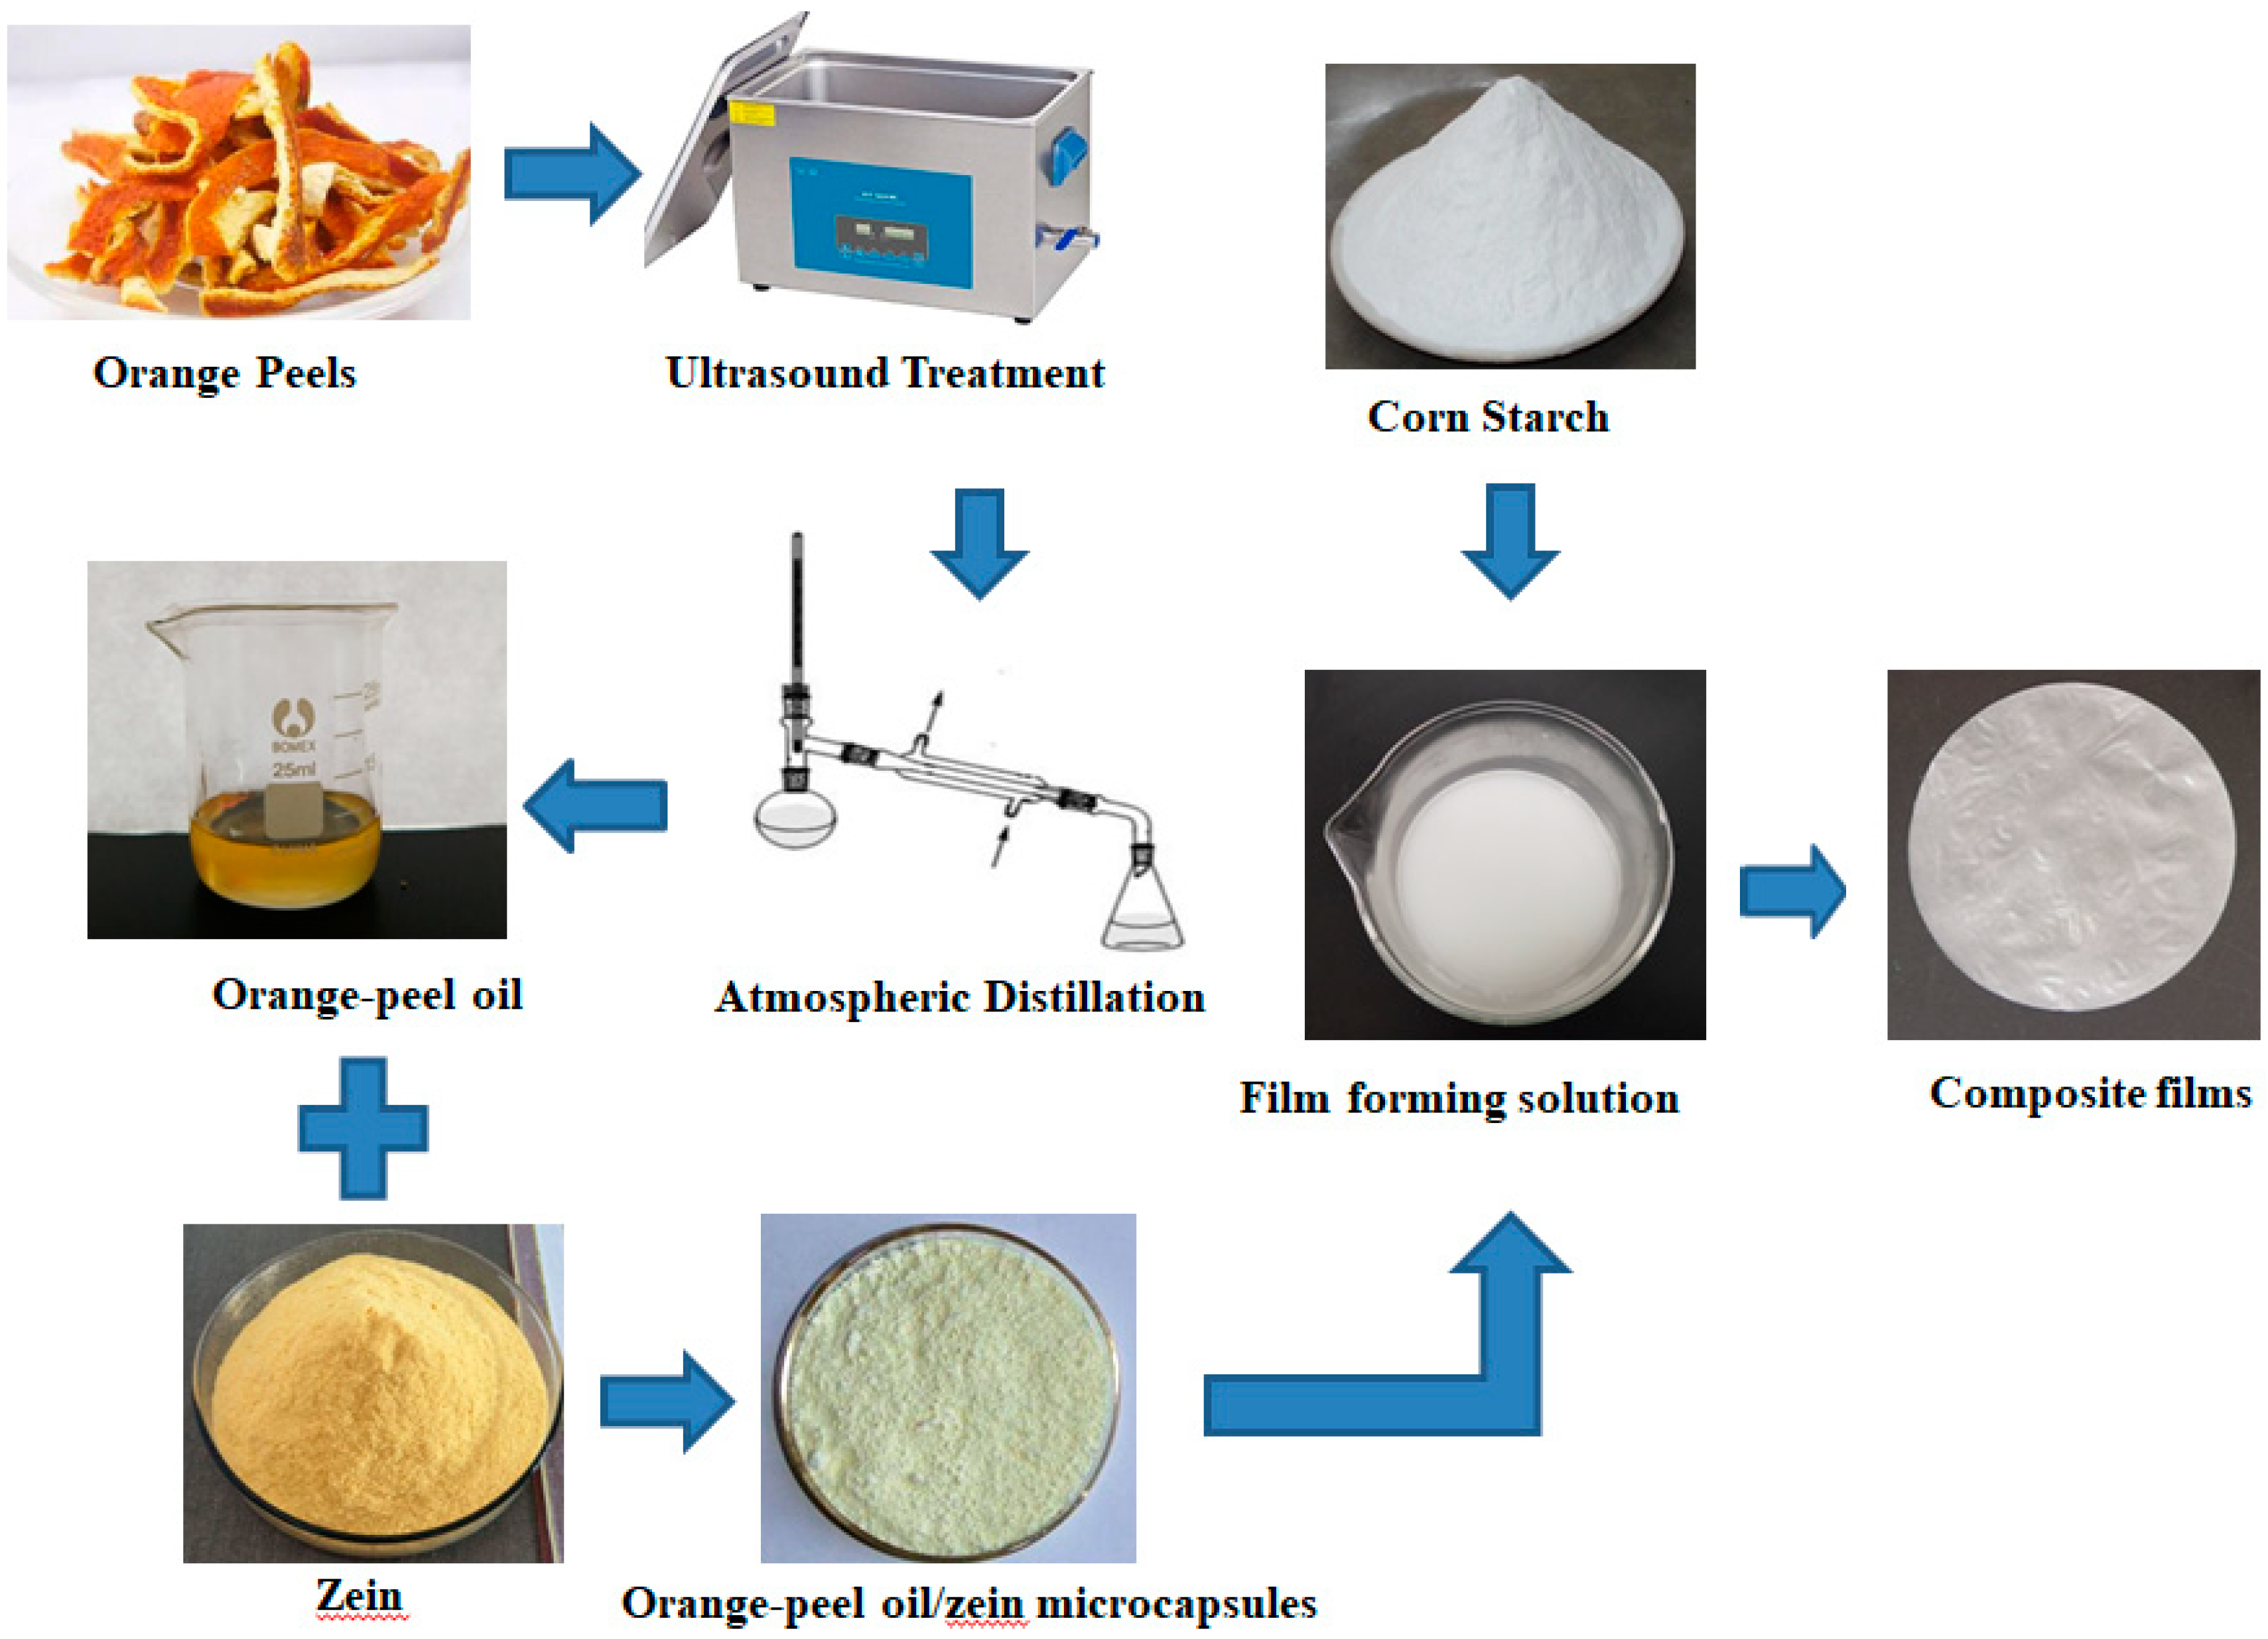
2.2. Ultrasound-Assisted Extraction of Orange-Peel Oil
2.3. Preparation of OZN
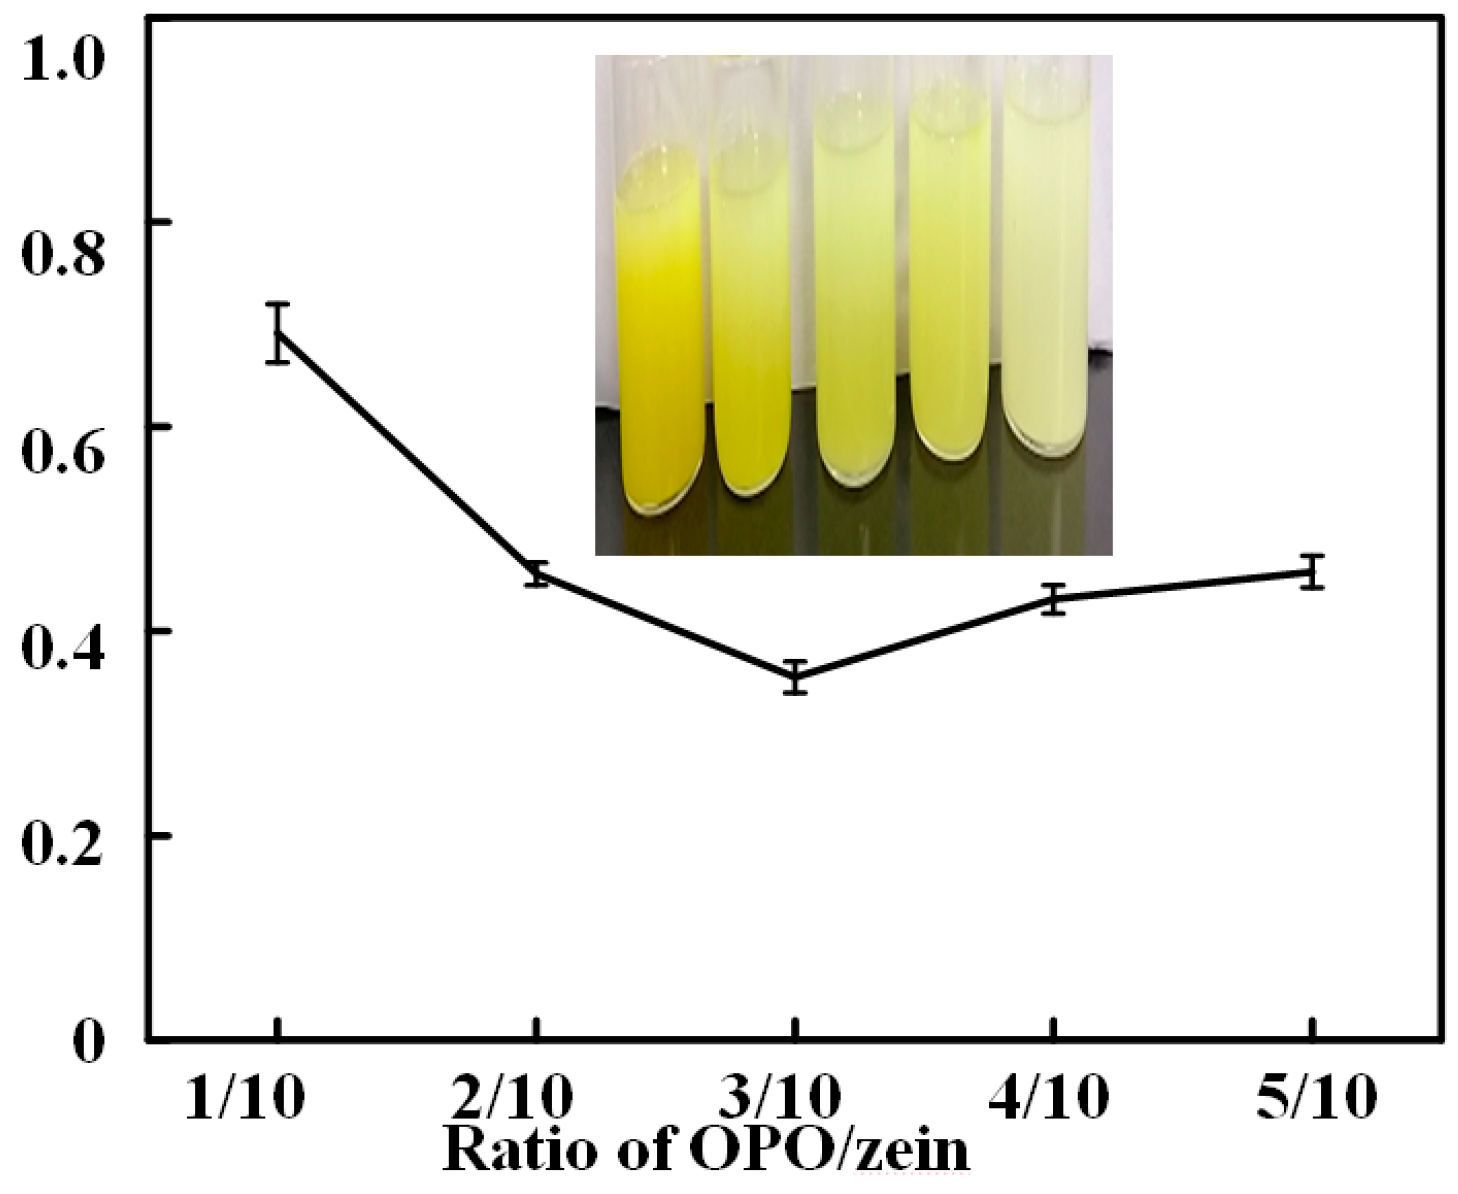
2.4. Turbidity Test
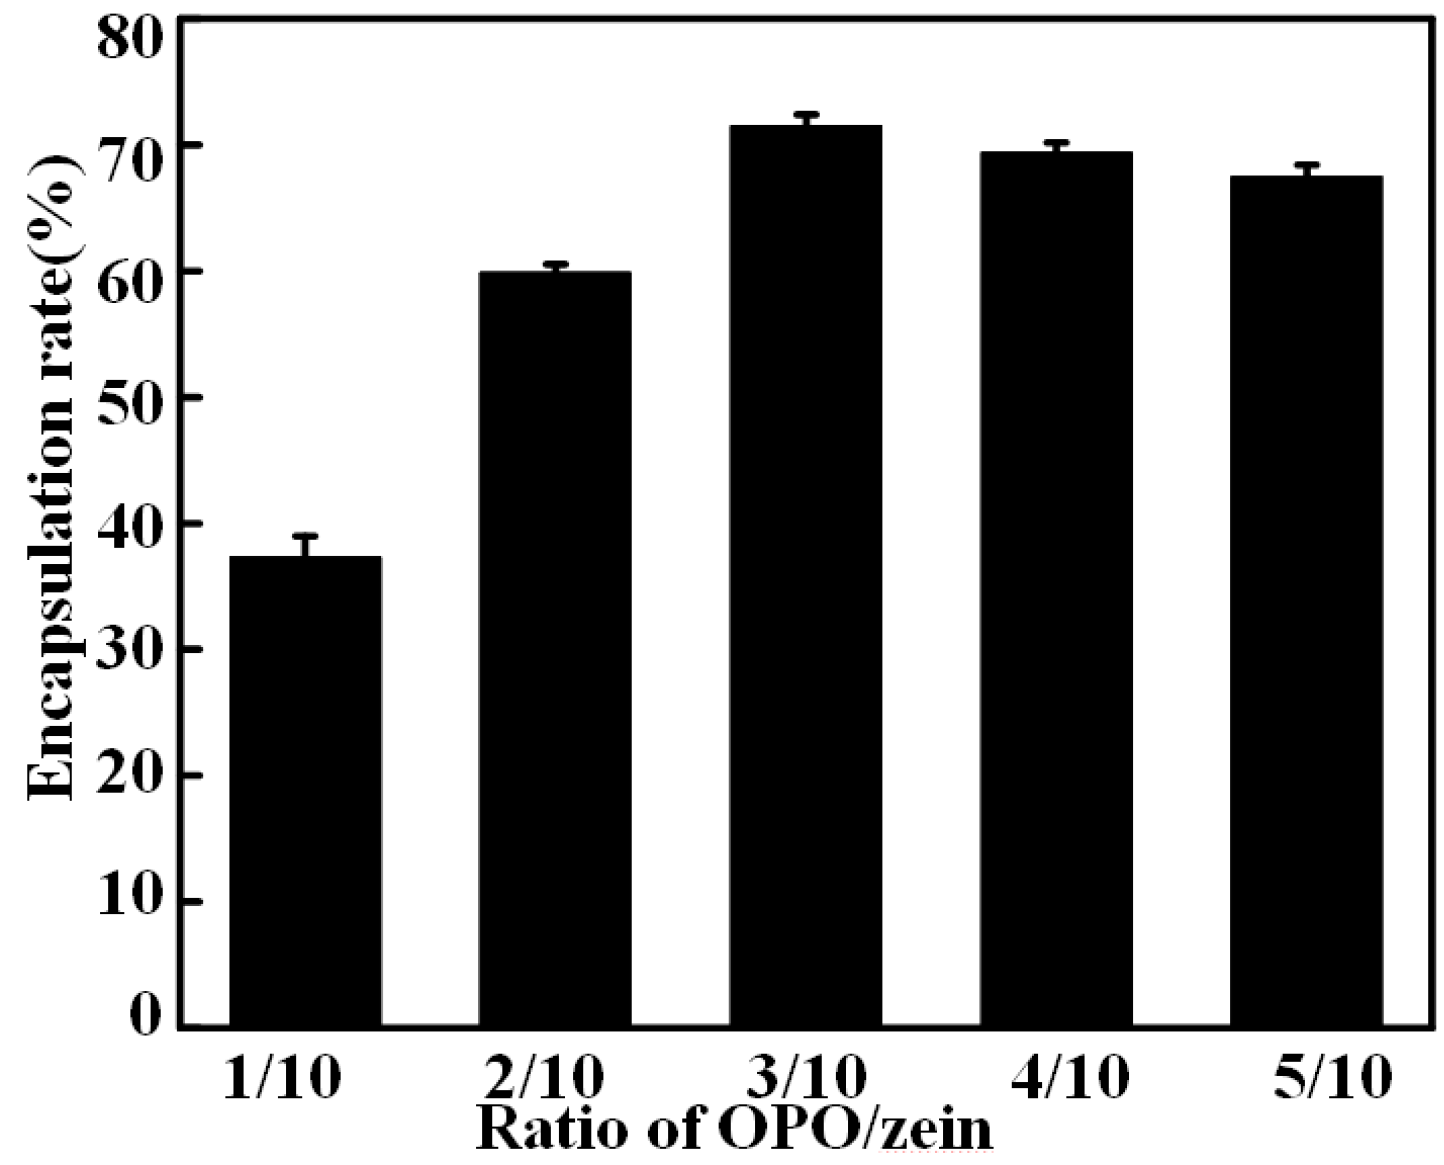
2.5. The Encapsulation Efficiency of OPO
2.6. Preparation of CS/OZN Composite Films
2.7. Film Thickness
2.8. Light Transmission and Color Properties
2.9. Oxygen and Water vapor Transmittance Test
2.10. Mechanical Performance Test
2.11. SEM Analysis
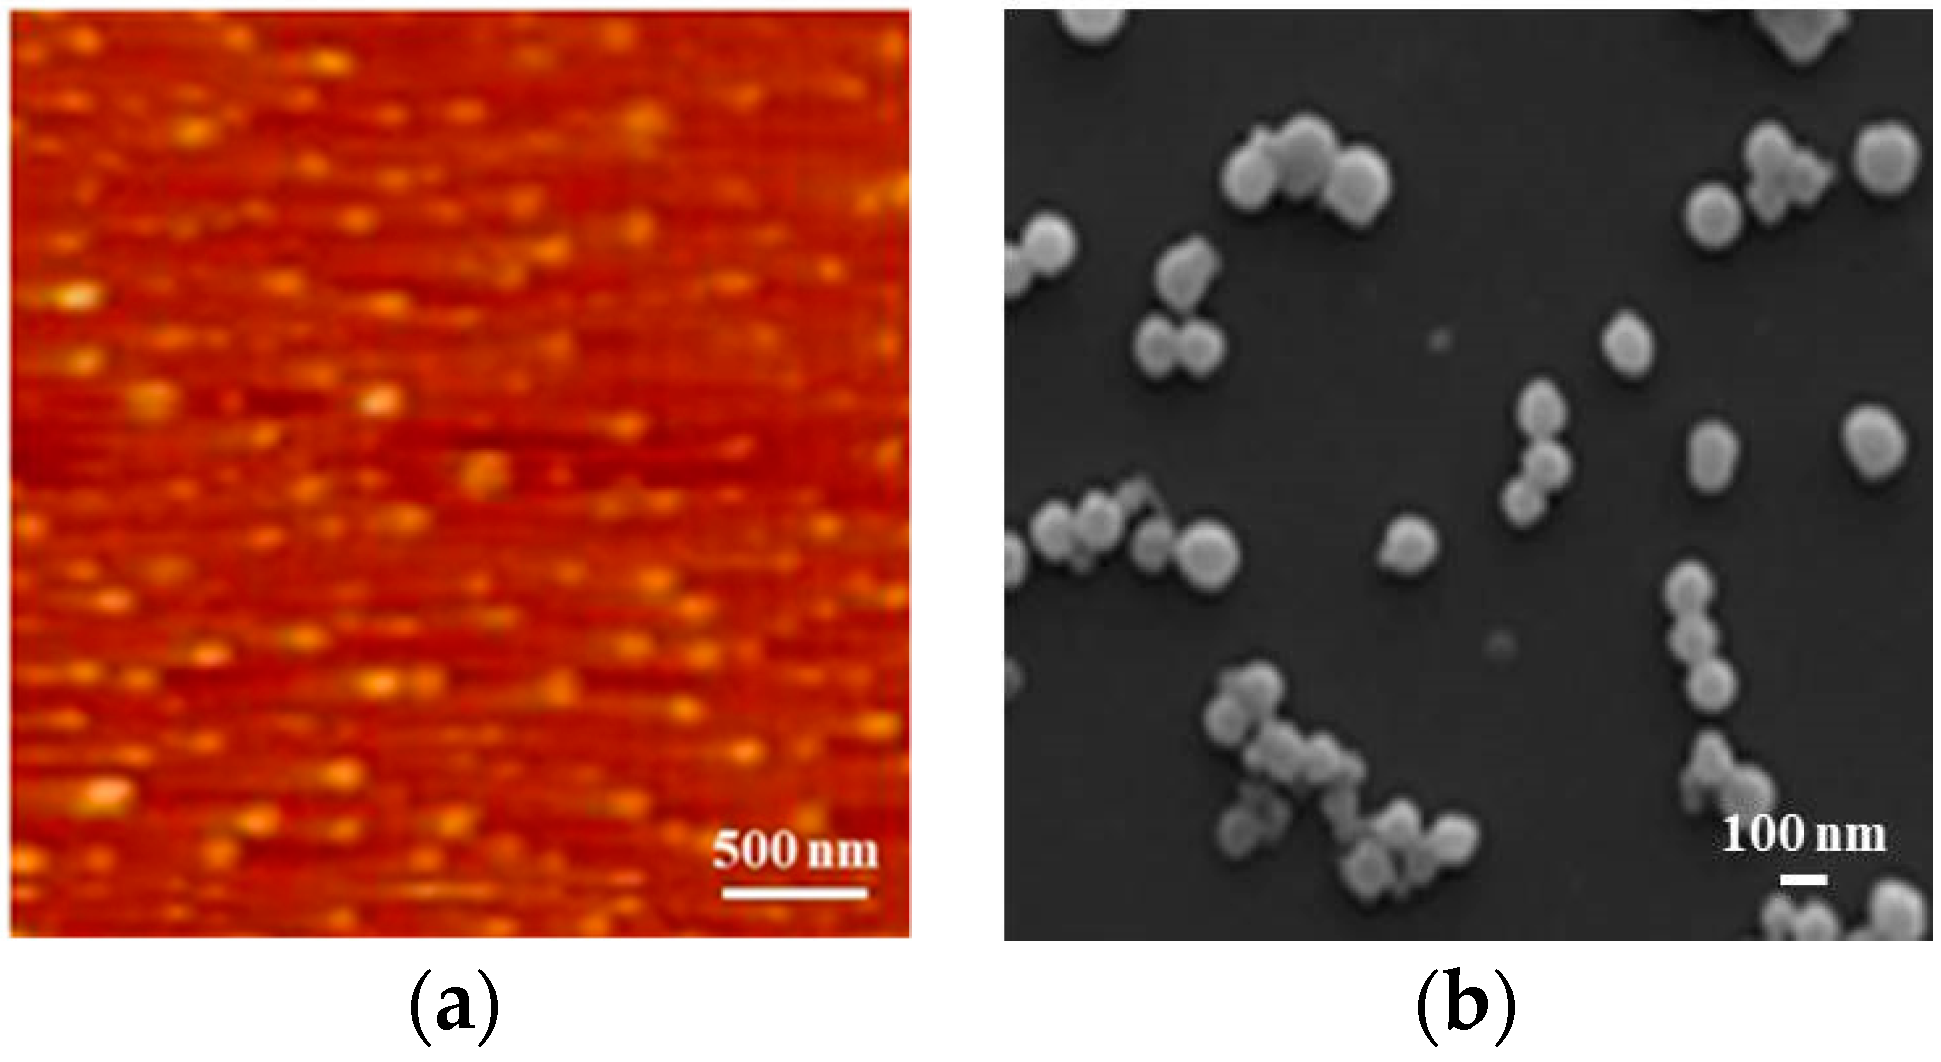
2.12. AFM Analysis
2.13. FTIR Analysis
2.14. Relative Release of OPO from CS/OZN Composite Films
2.15. DPPH Radical Scavenging Assay
2.16. Statistical Analysis
3. Results
3.1. Effect of Different Ultrasonic Processes on the Extraction of OPO
3.2. Encapsulation Rate and AFM and SEM of OZN
3.3. Turbidity Test
3.4. Light Transmission and Color Properties
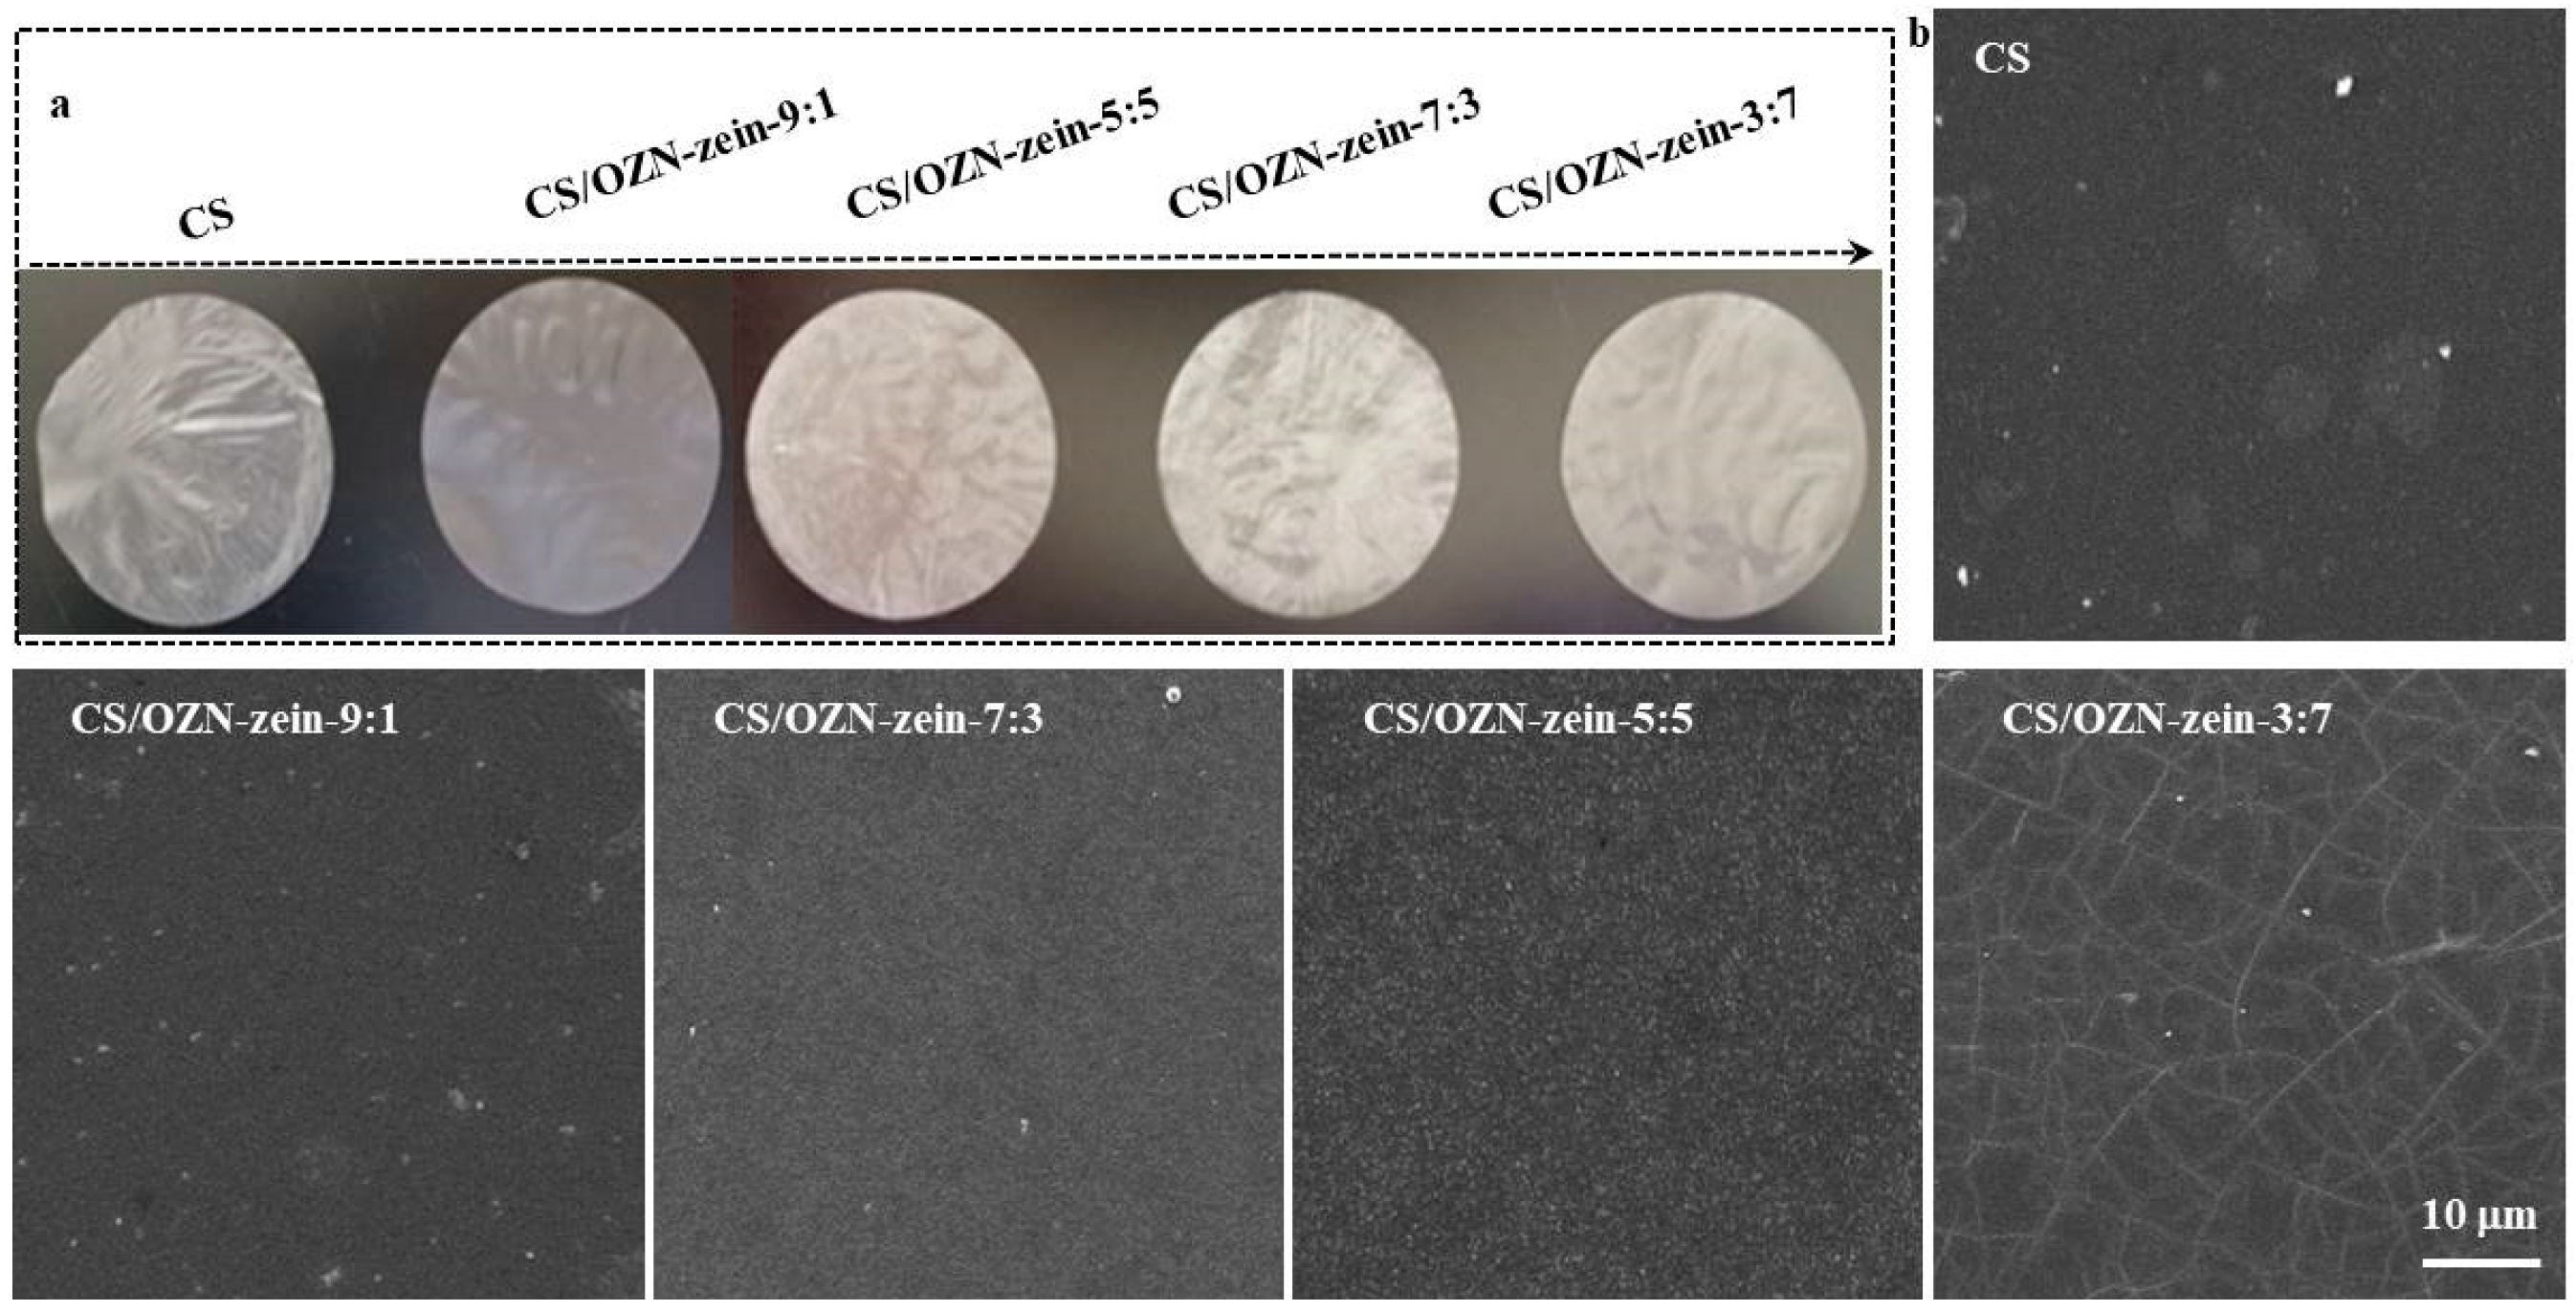
3.5. Properties of Varying CS/OZN Composite Films
3.6. SEM Analysis
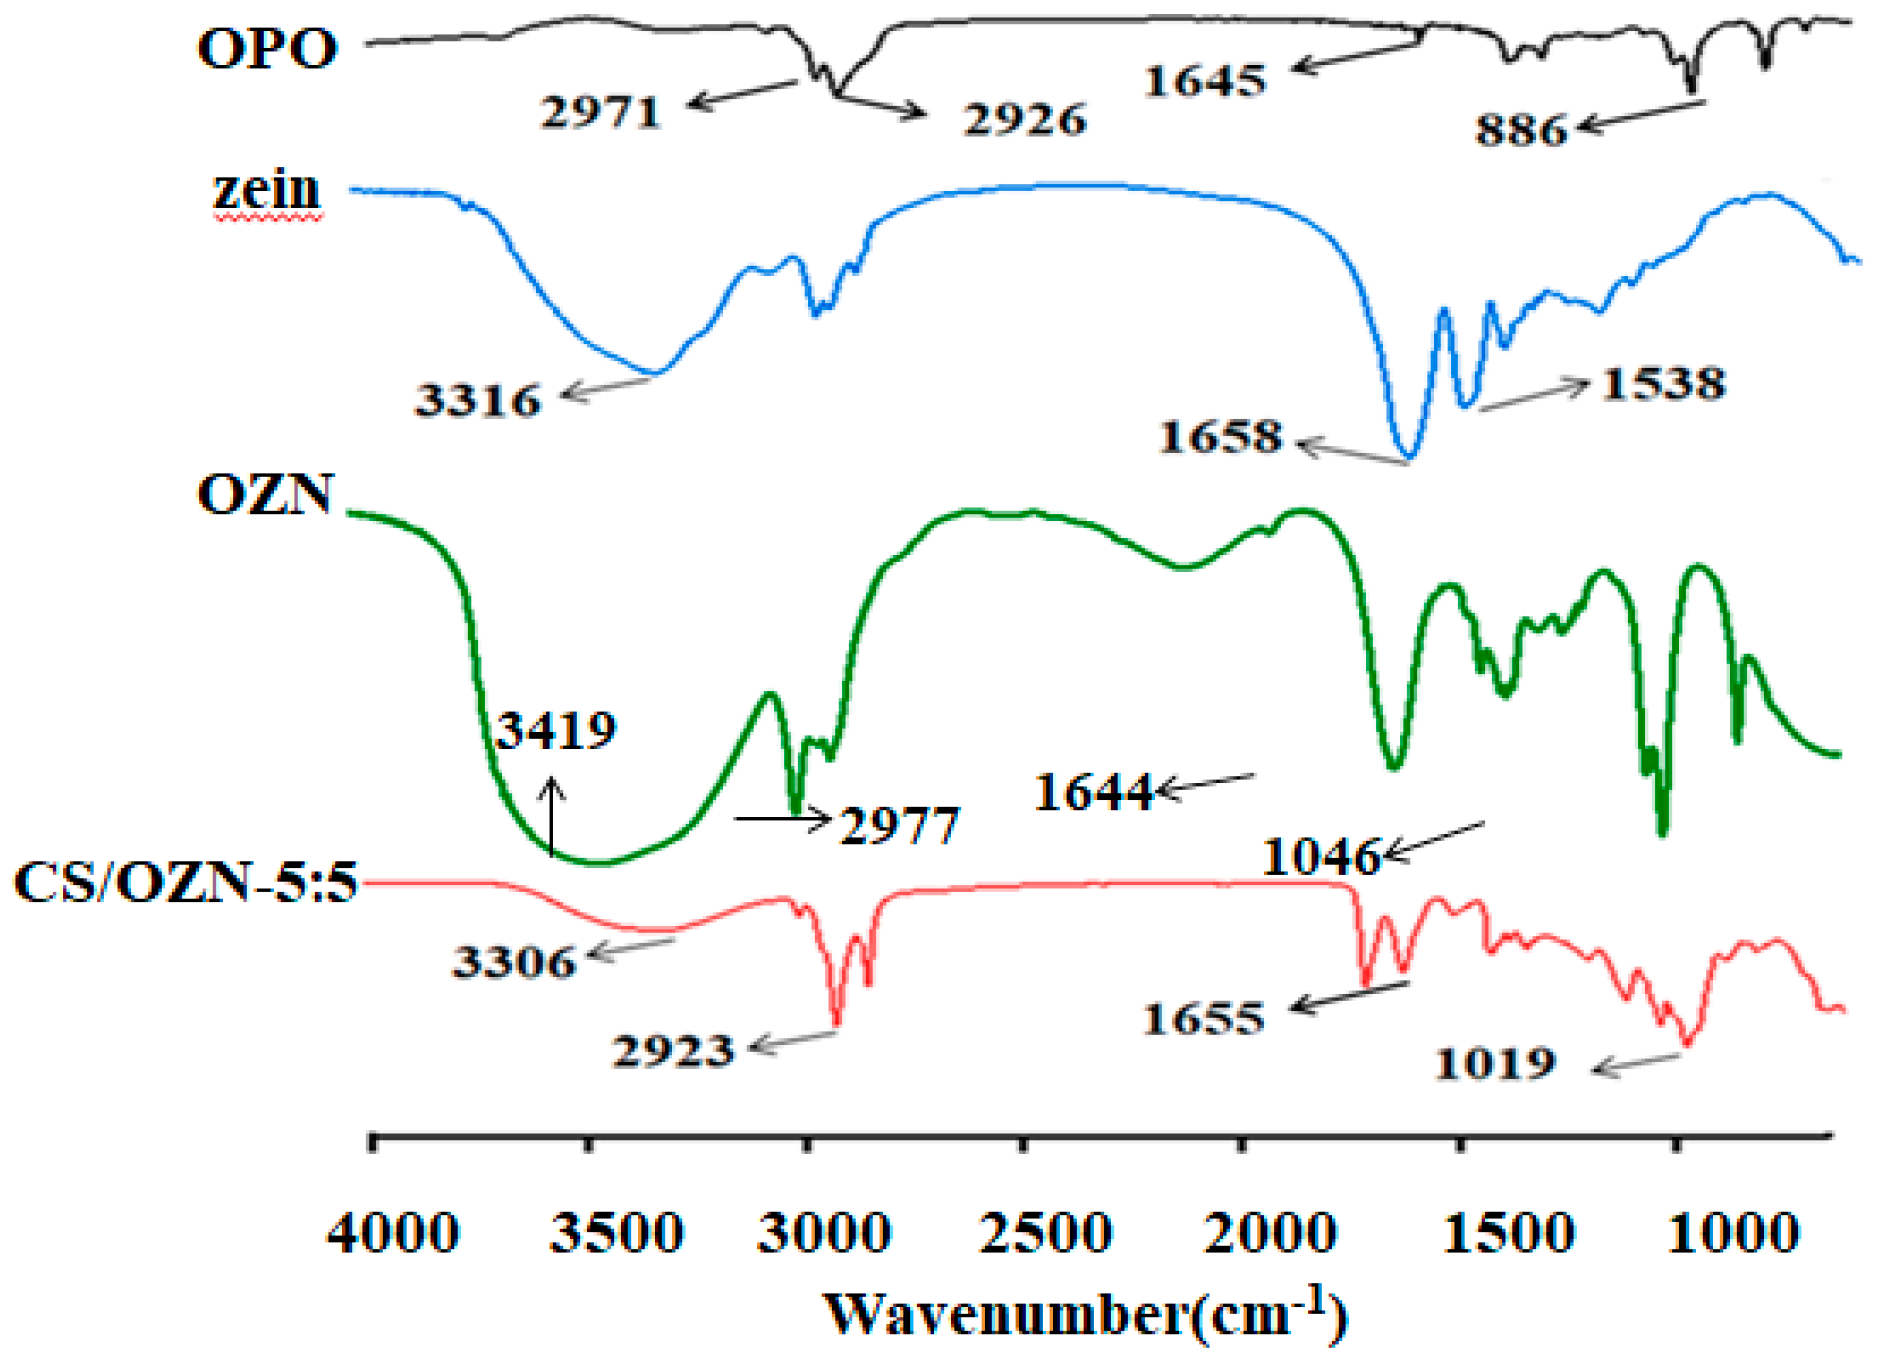
3.7. FTIR Analysis
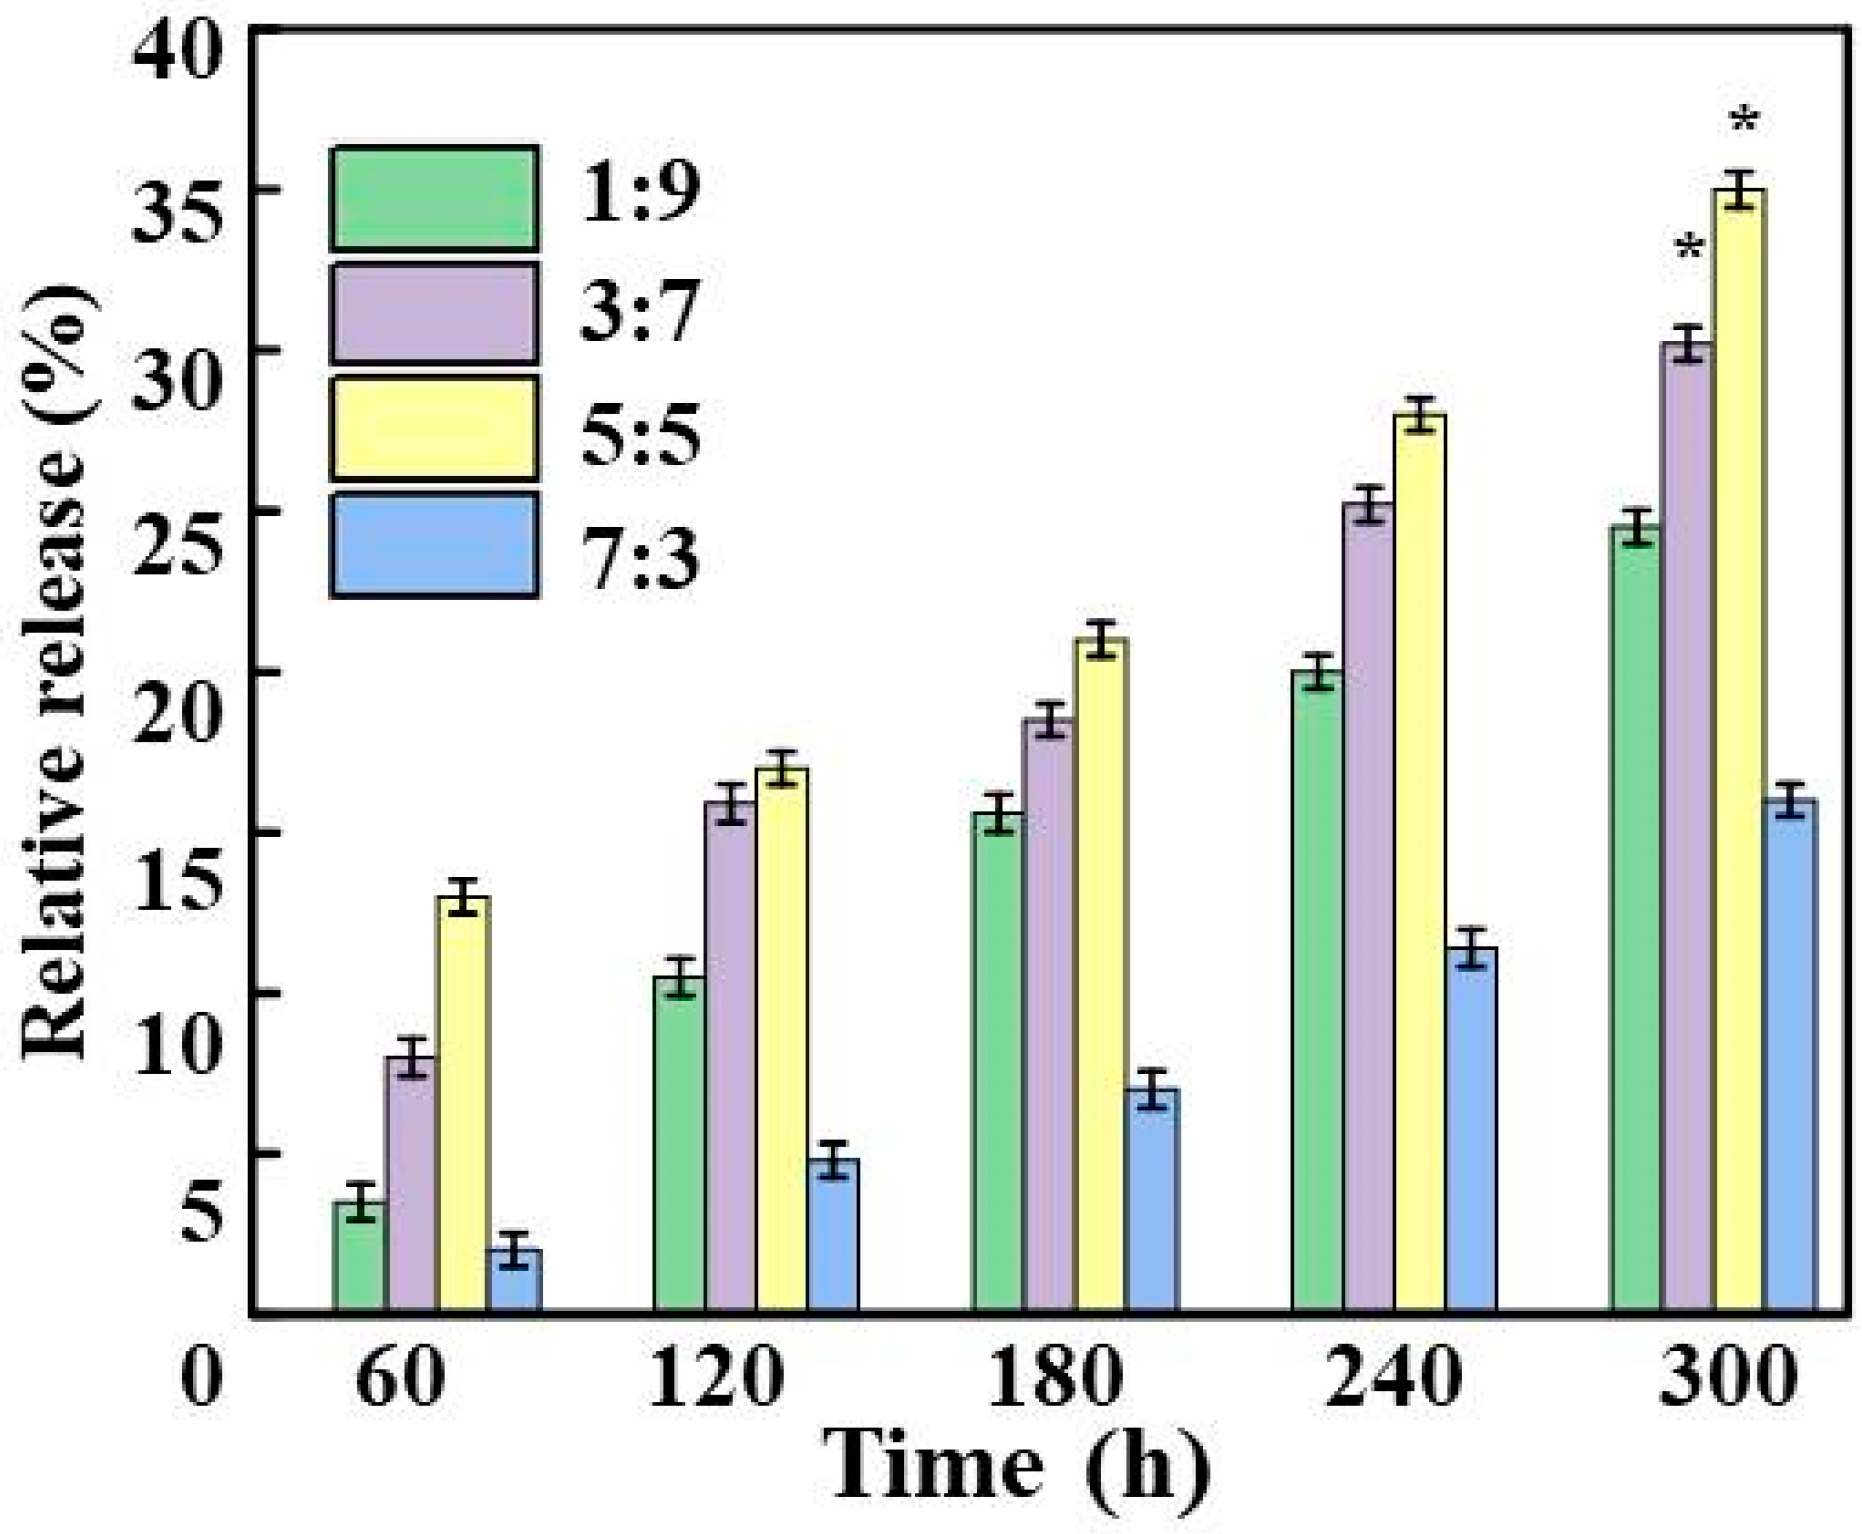
3.8. Relative Release of OPO from CS/OZN Composite Films
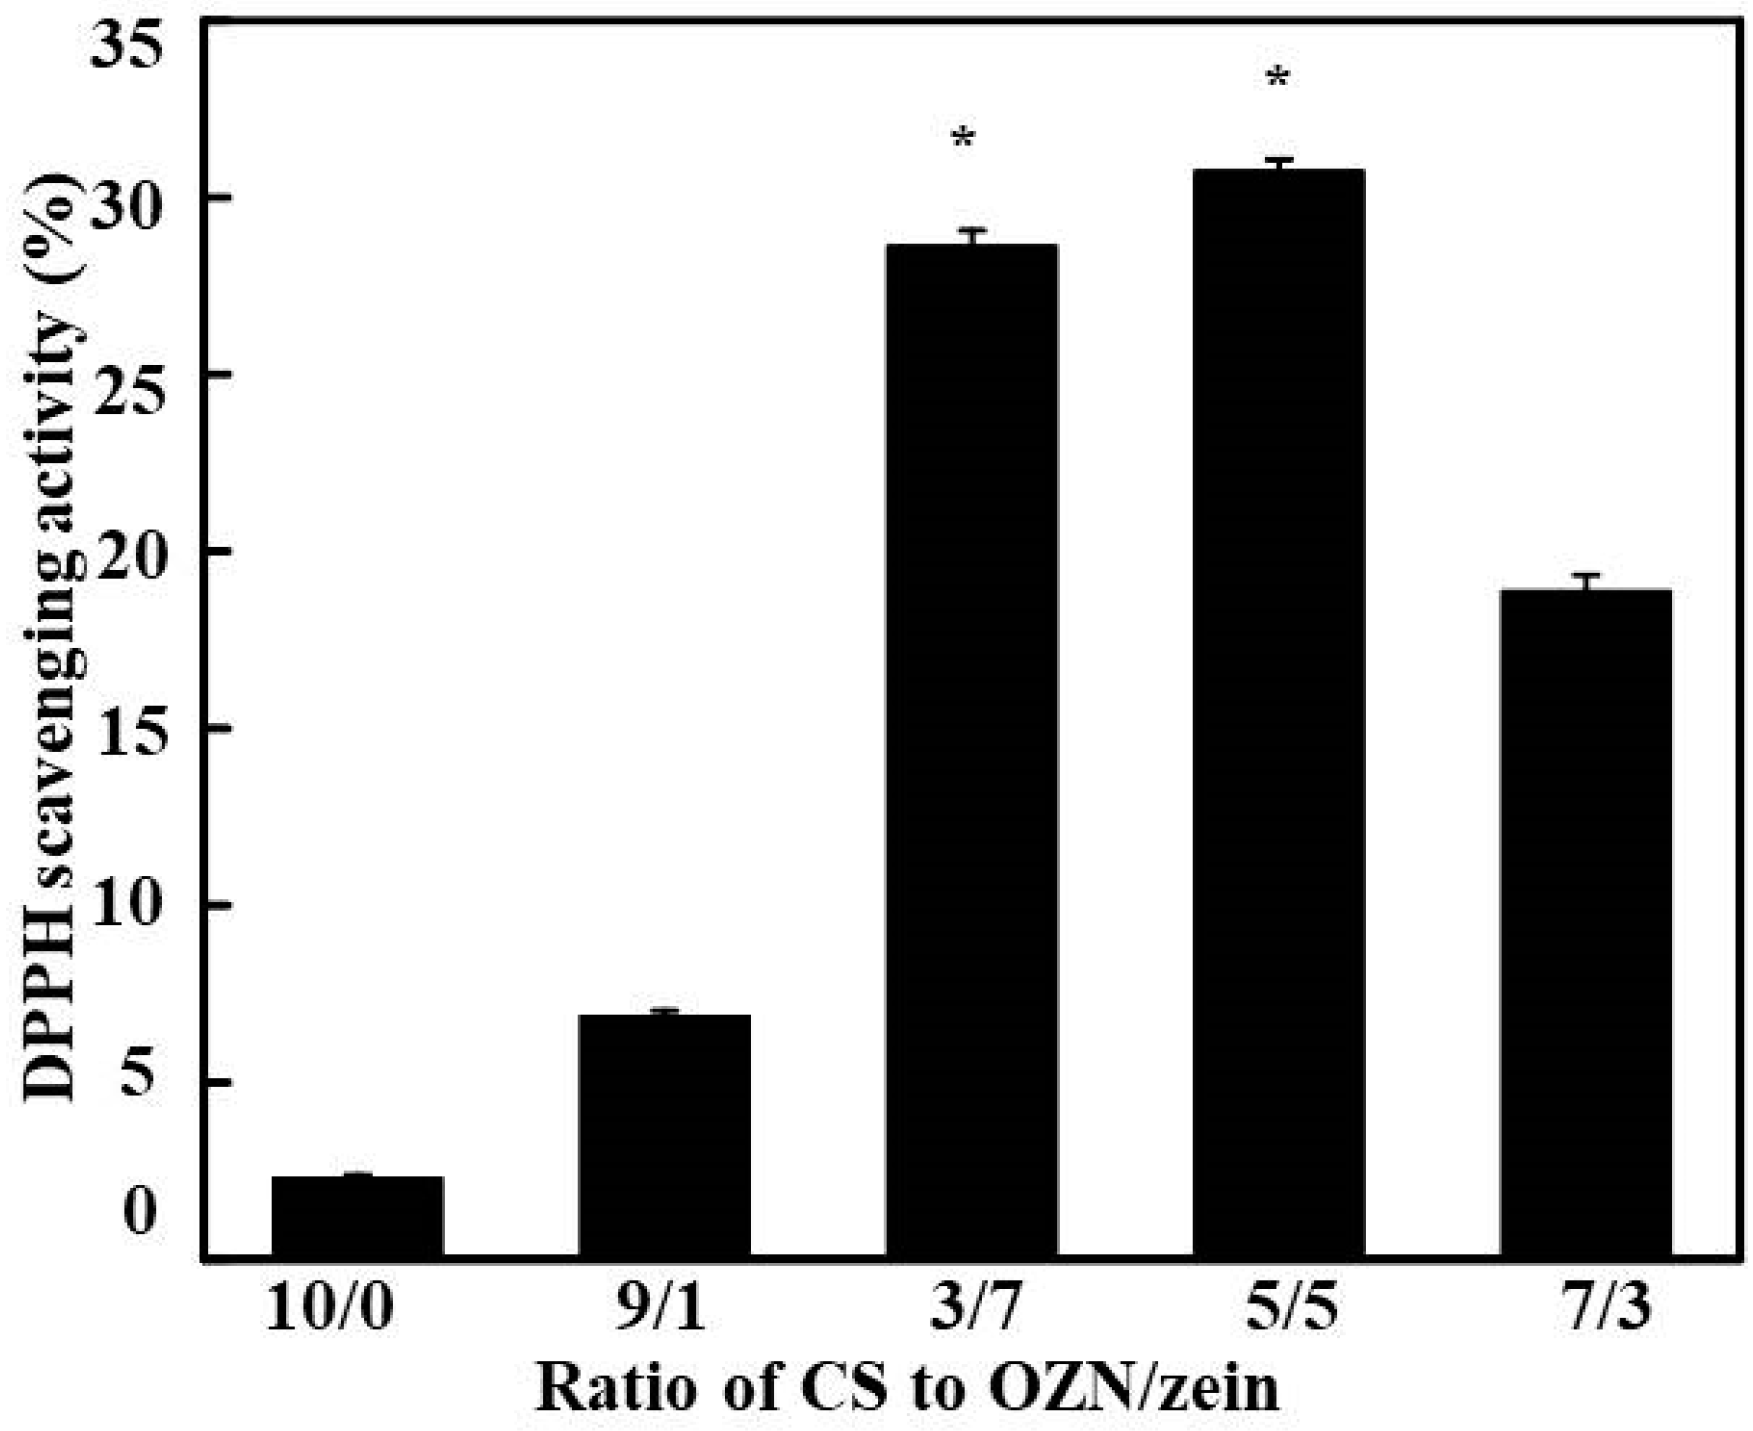
3.9. DPPH radical Scavenging Assay
4. Conclusions
Author Contributions
Funding
Conflicts of Interest
References
- Tavares, L.B.; Ito, N.M.; Salvadori, M.C.; Santos, D.J.D.; Rosa, D.S. PBAT/kraft lignin blend in flexible laminated food packaging: Peeling resistance and thermal degradability. Polym. Test. 2018, 67, 169–176. [Google Scholar] [CrossRef]
- Kowalczyk, D.; Baraniak, B. Effect of candelilla wax on functional properties of biopolymer emulsion films-a comparative study. Food Hydrocoll. 2014, 41, 195–209. [Google Scholar] [CrossRef]
- Pires, C.; Ramos, C.; Teixeira, B.; Batista, I.; Nunes, M.L.; Marques, A. Hake proteins edible films incorporated with essential oils: Physical. mechanical, antioxidant and antibacterial properties. Food Hydrocoll. 2013, 30, 224–231. [Google Scholar] [CrossRef]
- Gyarmati, B.; Szilágyiszilagyi, B.Á.; Szilágyi, A. Reversible interactions in self-healing and shape memory hydrogels. Eur. Polym. J. 2017, 93, 642–669. [Google Scholar] [CrossRef]
- Huang, H.; Wismeijer, D.; Hunziker, E.B.; Wu, G. The acute inflammatory response to absorbed collagen sponge is not enhanced by BMP-2. Int. J. Mol. Sci. 2017, 18, 498. [Google Scholar] [CrossRef] [PubMed]
- Lafarge, C.; Journaux, L.; Bonnotte, A.; Lherminier, J.; Lee, J.A.; Le Bail, P.; Cayot, N. Trapping of carvacrol by konjac glucomannan-potato starch gels: Stability from macroscopic to microscopic scale, using image processing. Food Hydrocoll. 2017, 66, 216–226. [Google Scholar] [CrossRef]
- Charles, A.L.; Cato, K.; Huang, T.C.; Chang, Y.H.; Ciou, J.Y.; Chang, J.S.; Lin, H.H. Functional properties of arrowroot starch in cassava and sweet potato composite starches. Food Hydrocoll. 2016, 53, 187–191. [Google Scholar] [CrossRef]
- Waterschoot, J.; Gomand, S.V.; Fierens, E.; Delcour, J.A. Production, structure, physicochemical and functional properties of maize, cassava, wheat, potato and rice starches. Starch-Starke 2015, 67, 14–29. [Google Scholar] [CrossRef]
- Zuo, Y.F.; Gu, J.Y.; Tan, H.Y.; Zhang, Y.H. Thermoplastic Starch Prepared with different plasticizers: Relation between degree of plasticization and properties. Mater. Sci. Ed. 2015, 30, 423–428. [Google Scholar] [CrossRef]
- Slavutsky, A.M.; Bertuzzi, M.A. Improvement of water barrier properties of starch films by lipid nanolamination. Food Packag. Shelf 2016, 7, 41–46. [Google Scholar] [CrossRef]
- Wikman, J.; Blennow, A.; Buléon, A.; Putaux, J.L.; Pérez, S.; Seetharaman, K.; Bertoft, E. Influence of amylopectin structure and degree of phosphorylation on the molecular composition of potato starch lintners. Biopolymers 2013, 101, 257–271. [Google Scholar] [CrossRef] [PubMed]
- Sukhija, S.; Singh, S.; Riar, C.S. Physicochemical, crystalline, morphological, pasting and thermal properties of modified lotus rhizome (Nelumbo nucifera), starch. Food Hydrocoll. 2016, 60, 50–58. [Google Scholar] [CrossRef]
- Khalid, S.; Yu, L.; Feng, M.; Meng, L.; Bai, Y.; Ali, A.; Liu, H.; Chen, L. Development and characterization of biodegradable antimicrobial packaging films based on polycaprolactone, starch and pomegranate rind hybrids. Food Packag. Shelf 2018, 18, 78–79. [Google Scholar] [CrossRef]
- Gerchman, D.; Bones, B.; Pereira, M.B.; Takimi, A.S. Thin film deposition by plasma polymerization using d-limonene as a renewable precursor. Prog. Org. Coat. 2019, 129, 133–139. [Google Scholar] [CrossRef]
- Filippidi, E.; Patel, A.R.; Bouwens, E.C.M.; Voudouris, P.; Velikov, K.P. All natural oil-filled microcapsules from water-insoluble proteins. Adv. Funct. Mater. 2014, 24, 5962–5968. [Google Scholar] [CrossRef]
- Chen, Y.; Shu, M.; Yao, X.; Wu, K.; Zhang, K.; He, Y.; Nishinari, K.; Phillips, G.O.; Yao, X.; Jiang, F. Effect of zein-based microencapsules on the release and oxidation of loaded limonene. Food Hydrocoll. 2018, 84, 330–336. [Google Scholar] [CrossRef]
- Esteban, J.; Ladero, M. Food waste as a source of value-added chemicals and materials: Abiorefinery perspective. Int. J. Food Sci. Technol. 2018, 53, 1–14. [Google Scholar] [CrossRef]
- Ozturk, B.; Winterburn, J.; Gonzalez-Miquel, M. Orange peel waste valorization through limonene extraction using bio-based solvents. Biochem. Eng. J. 2019, 151, 107298. [Google Scholar] [CrossRef]
- Su, J.; Guo, Q.; Mao, L.; Gao, Y.; Yuan, F. Effect of gum arabic on the storage stability and antibacterial ability of β-lactoglobulin stabilized D-D-limonene emulsion. Food Hydrocoll. 2018, 84, 75–83. [Google Scholar] [CrossRef]
- Lu, W.C.; Chiang, B.H.; Huang, D.W.; Li, P.H. Skin permeation of Dlimonene-based nanoemulsions as a transdermal carriers prepared by ultrasonic emulsification. Ultrason. Sonochem. 2014, 21, 826–832. [Google Scholar] [CrossRef]
- Abdel Aziz, M.S.; Salama, H.E.; Sabaa, M.W. Biobased alginate/castor oil edible films for active food packaging. LWT-Food Sci. Technol. 2018, 96, 455–460. [Google Scholar] [CrossRef]
- Dou, L.X.; Li, B.F.; Zhang, K.; Chu, X.; Hou, H. Physical properties and antioxidant activity of gelatin sodium alginate edible films with tea polyphenol. Int. J. Biol. Macromol. 2018, 118, 1377–1383. [Google Scholar] [CrossRef] [PubMed]
- Nouraddini, M.; Esmaiili, M.; Mohtarami, F. Development and characterization of edible films based on eggplant flour and corn starch. Int. J. Biol. Macromol. 2018, 120, 1639–1645. [Google Scholar] [CrossRef] [PubMed]
- Salgado, D.; Serment-Moreno, V.; Ulloa, P.A.; Velazquez, G.; Torres, J.A. Steady- and unsteady-state determination of the water vapor permeance of polyethylene film to estimate the moisture gain of packed dry mango. Food Bioprocess Technol. 2017, 10, 1792–1797. [Google Scholar] [CrossRef]
- Ramos, Ó.L.; Reinas, I.; Silva, S.; Fernandes, J.C.; Cerqueira, M.A. Effect of whey protein purity and glycerin content upon physical properties of edible films manufactured therefrom. Food Hydrocoll. 2013, 30, 110–122. [Google Scholar] [CrossRef]
- Hosseini, S.F.; Zandi, M.; Rezaei, M.; Farahmandghavi, F. Two-step method for encapsulation of oregano essential oil in chitosan nanoparticles: Preparation, characterization and in vitro release study. Carbohydr. Polym. 2013, 95, 50–56. [Google Scholar] [CrossRef] [PubMed]
- Maryam Adilah, Z.A.; Jamilah, B.; Nur Hanani, Z.A. Functional and antioxidant properties of protein-based films incorporated with mango kernel extract for active packaging. Food Hydrocoll. 2018, 74, 207–218. [Google Scholar] [CrossRef]
- Sicaire, A.-G.; Vian, M.; Fine, F.; Joffre, F.; Carré, P.; Tostain, S.; Chemat, F. Alternative bio-based solvents for extraction of fat and oils: Solubility prediction, global yield, extraction kinetics, chemical composition and cost of manufacturing. Int. J. Mol. Sci. 2015, 16, 8430–8453. [Google Scholar] [CrossRef] [PubMed]
- Okoli, C.U.; Kuttiyiel, K.A.; Cole, J.; McCutchen, J.; Tawfik, H.; Adzic, R.R.; Mahajan, D. Solvent effect in sonochemical synthesis of metal-alloy nanoparticles for use as electrocatalysts. Ultrason. Sonochem. 2018, 41, 427–434. [Google Scholar] [CrossRef] [PubMed]
- Wang, Z.J.; Xu, Y.M.; Gu, Y.T. Lithium niobate ultrasonic transducer design for enhanced oil recovery. Ultrason. Sonochem. 2015, 27, 171–177. [Google Scholar] [CrossRef]
- Saalbach, K.A.; Twiefel, J.; Wallaschek, J. Self-sensing cavitation detection in ultrasound-induced acoustic cavitation. Ultrason. Sonochem. 2018, 94, 401–410. [Google Scholar] [CrossRef] [PubMed]
- Naveena, B.; Armshaw, P.; Tony Pembroke, J. Ultrasonic intensification as a tool for enhanced microbial biofuel yields. Biotechnol. Biofuels 2015, 8, 140. [Google Scholar] [CrossRef] [PubMed]
- Zhang, H.; Wang, H.; Luo, X.; Leung, D.Y.C.; Pang, Q.S.; Xu, H.; Zhang, L.; Xuan, J. Toward a mechanistic understanding of microfluidic droplet-based extraction and separation of lanthanides. Chem. Eng. J. 2019, 356, 673–679. [Google Scholar] [CrossRef]
- Filippidi, E.; Patel, A.R.; Bouwens, E.C.M.; Voudouris, P.; Velikov, K.P. Microcapsules: All-natural oil-filled microcapsules from water-insoluble proteins. Adv. Funct. Mater. 2015, 24, 6084. [Google Scholar] [CrossRef]
- Navarchian, A.H.; Najafipoor, N.; Ahangaran, F. Surface-modified poly (methyl methacrylate) microcapsules containing linseed oil for application in self-healing epoxy-based coatings. Prog. Org. Coat. 2019, 132, 288–297. [Google Scholar] [CrossRef]
- Mirhosseini, H.; Tan, C.P.; Hamid, N.S.A.; Yusof, S. Optimization of the contents of Arabic gum, xanthan gum and orange oil affecting turbidity, average particle size, polydispersity index and density in orange beverage emulsion. Food Hydrocoll. 2008, 22, 1212–1223. [Google Scholar] [CrossRef]
- Kesmez, O.; Akarsu, E.; Camurlu, H.E.; Yavuz, E.; Akarsu, M.; Arpac, E. Preparation and characterization of multilayer anti-reflective coatings via sol-gel process. Ceram. Int. 2018, 44, 3183–3188. [Google Scholar] [CrossRef]
- Ahmad, M.; Hani, N.M.; Nirmal, N.P.; Faziala, F.F.; Mohtard, N.F.; Romlia, S.R. Optical and thermo-mechanical properties of composite films based on fish gelatin/rice flour fabricated by casting technique. Prog. Org. Coat. 2015, 84, 115–127. [Google Scholar] [CrossRef]
- Liu, J.; Liu, S.; Wu, Q.; Gu, Y.; Kan, J.; Jin, C. Effect of protocatechuic acid incorporation on the physical, mechanical, structural and antioxidant properties of chitosan film. Food Hydrocoll. 2017, 73, 90–100. [Google Scholar] [CrossRef]
- Introzzi, L.; Fuentes-Alventosa, J.M.; Cozzolino, C.A.; Trabattoni, S.; Tavazzi, S.; Bianchi, C.L.; Schiraldi, A.; Piergiovanni, L.; Farris, S. “Wetting enhancer” pullulan coating for antifog packaging applications. ACS Appl. Mater. Interfaces 2012, 4, 3692–3700. [Google Scholar] [CrossRef]
- Arrieta, M.P.; López, J.; Ferrándiz, S.; Peltzer, M.A. Characterization of PLA–limonene blends for food packaging applications. Polym. Test. 2013, 32, 760–768. [Google Scholar] [CrossRef]
- Borah, P.P.; Das, P.; Badwaik, L.S. Ultrasound treated potato peel and sweet lime pomace based biopolymer film development. Ultrason. Sonochem. 2017, 36, 11–19. [Google Scholar] [CrossRef] [PubMed]
- Barone, J.R.; Medynets, M. Thermally processed levan polymers. Carbohydr. Polym. 2007, 69, 554–561. [Google Scholar] [CrossRef]
- Lancaster, A.; Keswani, M.K. Integrated circuit packaging review with an emphasis on 3D packaging. Integration 2018, 60, 204–212. [Google Scholar] [CrossRef]
- Cano, A.; Cháfer, M.; Chiralt, A.; Gonzalez-Martinez, C. Physical and antimicrobial properties of starch-PVA blend films as affected by the incorporation of natural antimicrobial agents. Foods 2016, 5, 3. [Google Scholar] [CrossRef] [PubMed]
- Pan, H.W.; Li, Z.L.; Yang, J.; Li, X.; Ai, X.; Hao, Y.P.; Zhang, H.L.; Dong, L.S. The effect of MDI on the structure and mechanical properties of poly (lactic acid) and poly (butylene adipate-co-butylene terephthalate) blends. RSC Adv. 2018, 8, 4610–4623. [Google Scholar] [CrossRef]
- Ribeirosantos, R.; Andrade, M.; Sanchessilva, A. Application of encapsulated essential oils as antimicrobial agents in food packaging. Curr. Opin. Food Sci. 2017, 14, 78–84. [Google Scholar] [CrossRef]
- Vahedikia, N.; Garavand, F.; Tajeddin, B.; Cacciotti, I.; Jafari, S.M.; Omidi, T.; Zahedi, Z. Biodegradable zein film composites reinforced with chitosan nanoparticles and cinnamon essential oil: Physical, mechanical, structural and antimicrobial attributes. Colloid. Surf. B 2019, 177, 25–32. [Google Scholar] [CrossRef]
- Huo, W.; Wei, D.; Zhu, W.; Li, Z.; Jiang, Y. High-elongation zein films for flexible packaging by synergistic plasticization: Preparation, structure and properties. J. Cereal Sci. 2018, 79, 354–361. [Google Scholar] [CrossRef]
- Dai, L.; Li, R.; Wei, Y.; Sun, C.; Mao, L.; Gao, Y. Fabrication of zein and rhamnolipid complex nanoparticles to enhance the stability and in vitro release of curcumin. Food Hydrocoll. 2018, 77, 617–628. [Google Scholar] [CrossRef]
- Abdelrazek, E.M.; Elashmawi, I.S.; Labeeb, S. Chitosan filler effects on the experimental characterization, spectroscopic investigation and thermal studies of PVA/PVP blend films. Phys. B 2010, 405, 2021–2027. [Google Scholar] [CrossRef]
- Ke, J.X.; Xiao, L.Y.; Yu, G.X.; Wu, H.J.; Shen, G.H.; Zhang, Z.Q. The study of diffusion kinetics of cinnamaldehyde from corn starch-based film into food simulant and physical properties of antibacterial polymer film. Int. J. Biol. Macromol. 2018, 125, 642–650. [Google Scholar] [CrossRef] [PubMed]
- Gupta, S.; Rahini, R.L. Electrochemical synthesis and characterization of amorphous hydrogenated carbon (a-C:H) using acetonitrile as electrolyte. Electrochim. Acta 2017, 258, 1–8. [Google Scholar] [CrossRef]
- Li, H.; Wang, D.F.; Liu, C.Z.; Zhu, J.X.; Fan, M.H.; Sun, X.; Wang, T.; Xu, Y.; Cao, Y.P. Fabrication of stable zein nanoparticles coated with soluble soybean polysaccharide for encapsulation of quercetin. Food Hydrocoll. 2019, 87, 342–351. [Google Scholar] [CrossRef]
- Rezaeinia, H.; Ghorani, B.; Emadzadeh, B.; Tucker, N. Electrohydrodynamic atomization of Balangu (Lallemantia royleana) seed gum for the fast-release of Mentha longifolia L. essential oil: Characterization of nano-capsules and modeling the kinetics of release. Food Hydrocoll. 2019, 93, 374–385. [Google Scholar] [CrossRef]
- Flores-Villaseñor, S.E.; Peralta-Rodríguez, R.D.; Ramirez-Contreras, J.C.; Cortes-Mazatán, G.Y.; Estrada-Ramírez, A.N. Biocompatible microemulsions for the nanoencapsulation of essential oils and nutraceuticals. Encapsulations 2016, 2, 503–558. [Google Scholar] [CrossRef]
- Bai, C.; Zhang, S.; Huang, L.; Wang, H.; Wang, W.; Ye, Q. Starch-based hydrogel loading with carbendazim for controlled-release and water absorption. Carbohydr. Polym. 2015, 125, 376–383. [Google Scholar] [CrossRef]
- Bier, M.C.J.; Medeiros, A.B.P.; de Oliveira, J.S.; Côcco, L.C.; da Luz Costa, J.; de Carvalho, J.C.; Soccol, C.R. Liquefied gas extraction: A new method for the recovery of terpenoids from agroindustrial and forest wastes. J. Supercrit. Fluids 2016, 110, 97–102. [Google Scholar] [CrossRef]
- Bier, M.C.J.; Medeiros, A.B.P.; Kimpe, N.D.; Soccol, C.R. Evaluation of antioxidant activity of the fermented product from the biotransformation of R-(+)-limonene in solid-state fermentation of orange waste by Diaporthe sp. Biotechnol. Res. Innov. 2019, 32, 9. [Google Scholar] [CrossRef]


| Level | Factor | ||
|---|---|---|---|
| Ultrasonic Power (W) | Ultrasonic Time (min) | Orange Peels/Ethyl Acetate Solution | |
| 1 | 80 | 30 | 1:6 |
| 2 | 90 | 40 | 1:8 |
| 3 | 100 | 50 | 1:10 |
| Serial Number | Ultrasonic Power (W) | Time (min) | Orange Peels/Ethyl Acetate Solution (g/mL) | Viscosity (MPa/s) | Yield of OPO (%) |
|---|---|---|---|---|---|
| 1 | 80 | 30 | 1:6 | 5.79 ± 0.41 a | 1.76 ± 0.45 a |
| 2 | 80 | 30 | 1:8 | 9.23 ± 0.72 b | 2.32 ± 0.78 b |
| 3 | 80 | 30 | 1:10 | 8.44 ± 0.62 b | 1.88 ± 0.53 a |
| 4 | 80 | 40 | 1:6 | 6.32 ± 0.56 a | 1.85 ± 0.52 a |
| 5 | 80 | 40 | 1:8 | 10.18 ± 0.84 b | 2.56 ± 0.84 c |
| 6 | 80 | 40 | 1:10 | 9.06 ± 0.69 b | 2.02 ± 0.63 d |
| 7 | 80 | 50 | 1:6 | 6.33 ± 0.57 a | 1.80 ± 0.50 a |
| 8 | 80 | 50 | 1:8 | 9.88 ± 0.82 b | 2.41 ± 0.74 b |
| 9 | 80 | 50 | 1:10 | 8.59 ± 0.64 b | 1.98 ± 0.60 a |
| 10 | 90 | 30 | 1:6 | 6.12 ± 0.52 a | 1.82 ± 0.51 a |
| 11 | 90 | 30 | 1:8 | 10.09 ± 0.82 b | 2.44 ± 0.75 b |
| 12 | 90 | 30 | 1:10 | 8.47 ± 0.63 b | 1.95 ± 0.59 a |
| 13 | 90 | 40 | 1:6 | 6.21 ± 0.53 a | 1.90 ± 0.56 a |
| 14 | 90 | 40 | 1:8 | 10.92 ± 0.88 b | 2.78 ± 0.86 d |
| 15 | 90 | 40 | 1:10 | 9.12 ± 0.71 b | 2.32 ± 0.70 b |
| 16 | 90 | 50 | 1:6 | 6.18 ± 0.53 a | 1.85 ± 0.82 a |
| 17 | 90 | 50 | 1:8 | 10.49 ± 0.82 b | 2.63 ± 0.80 d |
| 18 | 90 | 50 | 1:10 | 9.68 ± 0.79 b | 2.26 ± 0.89 b |
| 19 | 100 | 30 | 1:6 | 5.99 ± 0.49 a | 1.79 ± 0.50 a |
| 20 | 100 | 30 | 1:8 | 9.62 ± 0.77 b | 2.32 ± 0.70 b |
| 21 | 100 | 30 | 1:10 | 8.52 ± 0.65 b | 1.92 ± 0.58 a |
| 22 | 100 | 40 | 1:6 | 6.16 ± 0.52 a | 1.85 ± 0.52 a |
| 23 | 100 | 40 | 1:8 | 9.79 ± 0.80 b | 2.55 ± 0.76 b |
| 24 | 100 | 40 | 1:10 | 9.35 ± 0.78 b | 2.14 ± 0.67 b |
| 25 | 100 | 50 | 1:6 | 6.04 ± 0.51 a | 1.81 ± 0.50 a |
| 26 | 100 | 50 | 1:8 | 9.68 ± 0.79 b | 2.43 ± 0.75 b |
| 27 | 100 | 50 | 1:10 | 8.76 ± 0.68 b | 2.09 ± 0.65 d |
| CS:OZN (w/w) | Light Transmission (%) | L* | a* | b* | ΔE |
|---|---|---|---|---|---|
| 10:0 | 93.07 ± 1.32 b | 92.42 ± 1.12 a | −1.06 ± 0.27 a | 1.74 ± 0.28 a | ------ |
| 9:1 | 89.54 ± 1.22 a | 90.21 ± 1.01 b | −0.20 ± 0.12 c | 1.07 ± 0.27 c | 1.44 ± 0.23 a |
| 7:3 | 88.42 ± 1.19 a | 89.19 ± 0.96 a | −0.17 ± 0.11 b | 1.29 ± 0.33 b | 1.36 ± 0.19 b |
| 5:5 | 87.29 ± 1.12 b | 88.02 ± 0.89 c | −1.19 ± 0.32 b | 2.10 ± 0.43 a | 2.02 ± 0.46 c |
| 3:7 | 86.37 ± 1.08 a | 86.19 ± 0.77 a | −0.79 ± 0.22 a | 2.51 ± 0.52 a | 2.35 ± 0.53 a |
| CS:OZN (w/w) | Thickness (mm) | TS (MPa) | EAB (%) | OP × 10−14 (cm3/m s Pa) | WVP (×10−11g/m s Pa) |
|---|---|---|---|---|---|
| 10:0 | 0.122 ± 0.024 a | 9.42 ± 1.06 a | 25.50 ± 2.15 a | 2.78 ± 0.81 a | 6.62 ± 1.06 a |
| 9:1 | 0.154 ± 0.052 b | 10.21 ± 1.34 b | 26.48 ± 2.36 a | 2.30 ± 0.72 b | 4.45 ± 0.90 b |
| 7:3 | 0.142 ± 0.044 b | 12.19 ± 1.98 c | 29.14 ± 2.49 b | 1.91 ± 0.69 c | 3.78 ± 0.82 c |
| 5:5 | 0.137 ± 0.036 a | 12.19 ± 1.97 c | 30.91 ± 2.52 d | 1.80 ± 0.61 c | 3.02 ± 0.74 c |
| 3:7 | 0.129 ± 0.026 a | 10.12 ± 1.32 b | 35.65 ± 2.99 e | 1.79 ± 0.60 c | 2.15 ± 0.58 d |
© 2019 by the authors. Licensee MDPI, Basel, Switzerland. This article is an open access article distributed under the terms and conditions of the Creative Commons Attribution (CC BY) license (http://creativecommons.org/licenses/by/4.0/).
Share and Cite
Wang, Y.; Zhang, R.; Ahmed, S.; Qin, W.; Liu, Y. Preparation and Characterization of Corn Starch Bio-Active Edible Packaging Films Based on Zein Incorporated with Orange-Peel Oil. Antioxidants 2019, 8, 391. https://doi.org/10.3390/antiox8090391
Wang Y, Zhang R, Ahmed S, Qin W, Liu Y. Preparation and Characterization of Corn Starch Bio-Active Edible Packaging Films Based on Zein Incorporated with Orange-Peel Oil. Antioxidants. 2019; 8(9):391. https://doi.org/10.3390/antiox8090391
Chicago/Turabian StyleWang, Yue, Rong Zhang, Saeed Ahmed, Wen Qin, and Yaowen Liu. 2019. "Preparation and Characterization of Corn Starch Bio-Active Edible Packaging Films Based on Zein Incorporated with Orange-Peel Oil" Antioxidants 8, no. 9: 391. https://doi.org/10.3390/antiox8090391