Impact of Intravenous Iron on Oxidative Stress and Mitochondrial Function in Experimental Chronic Kidney Disease


Abstract
:1. Introduction
2. Materials and Methods
2.1. Induction of Experimental Uraemic Model
2.2. Model Characterisation
2.3. Mitochondrial Function
2.4. Oxidative Stress
2.5. Transmission Electron Microscopy
2.6. Statistical Analysis
3. Results
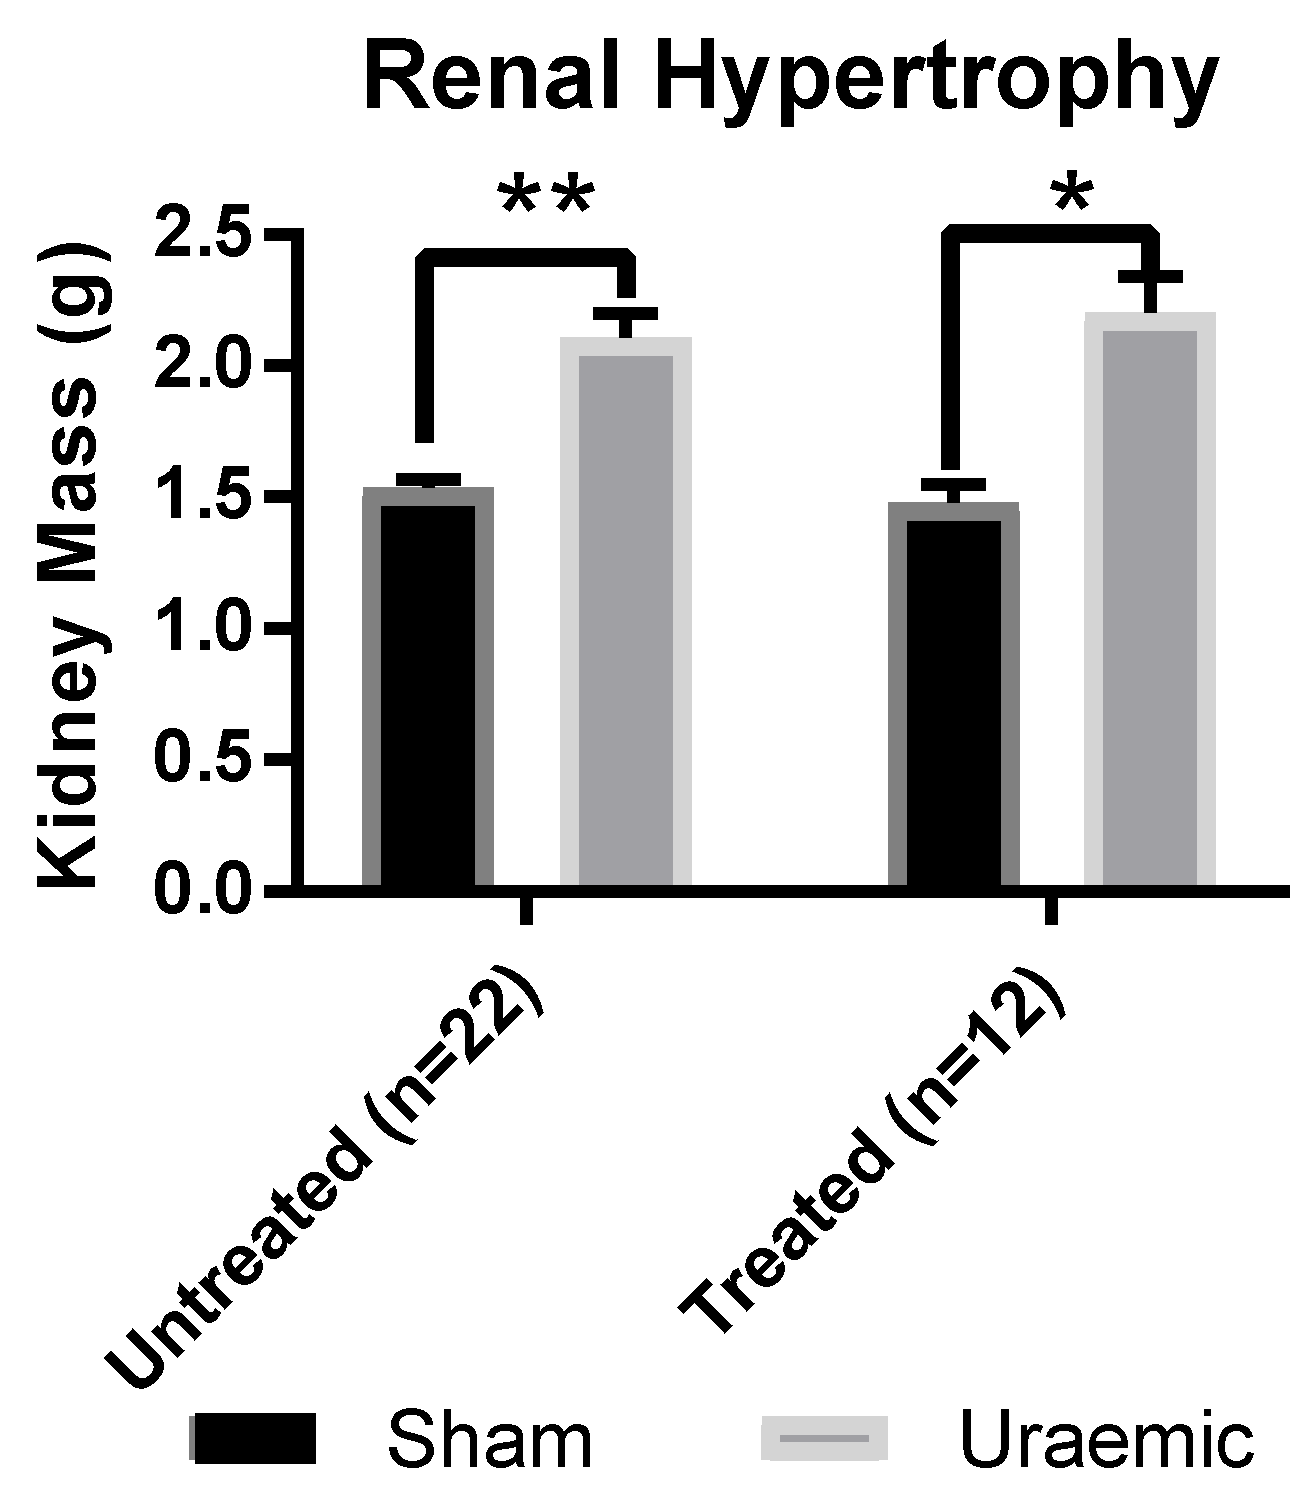
3.1. Renal Function
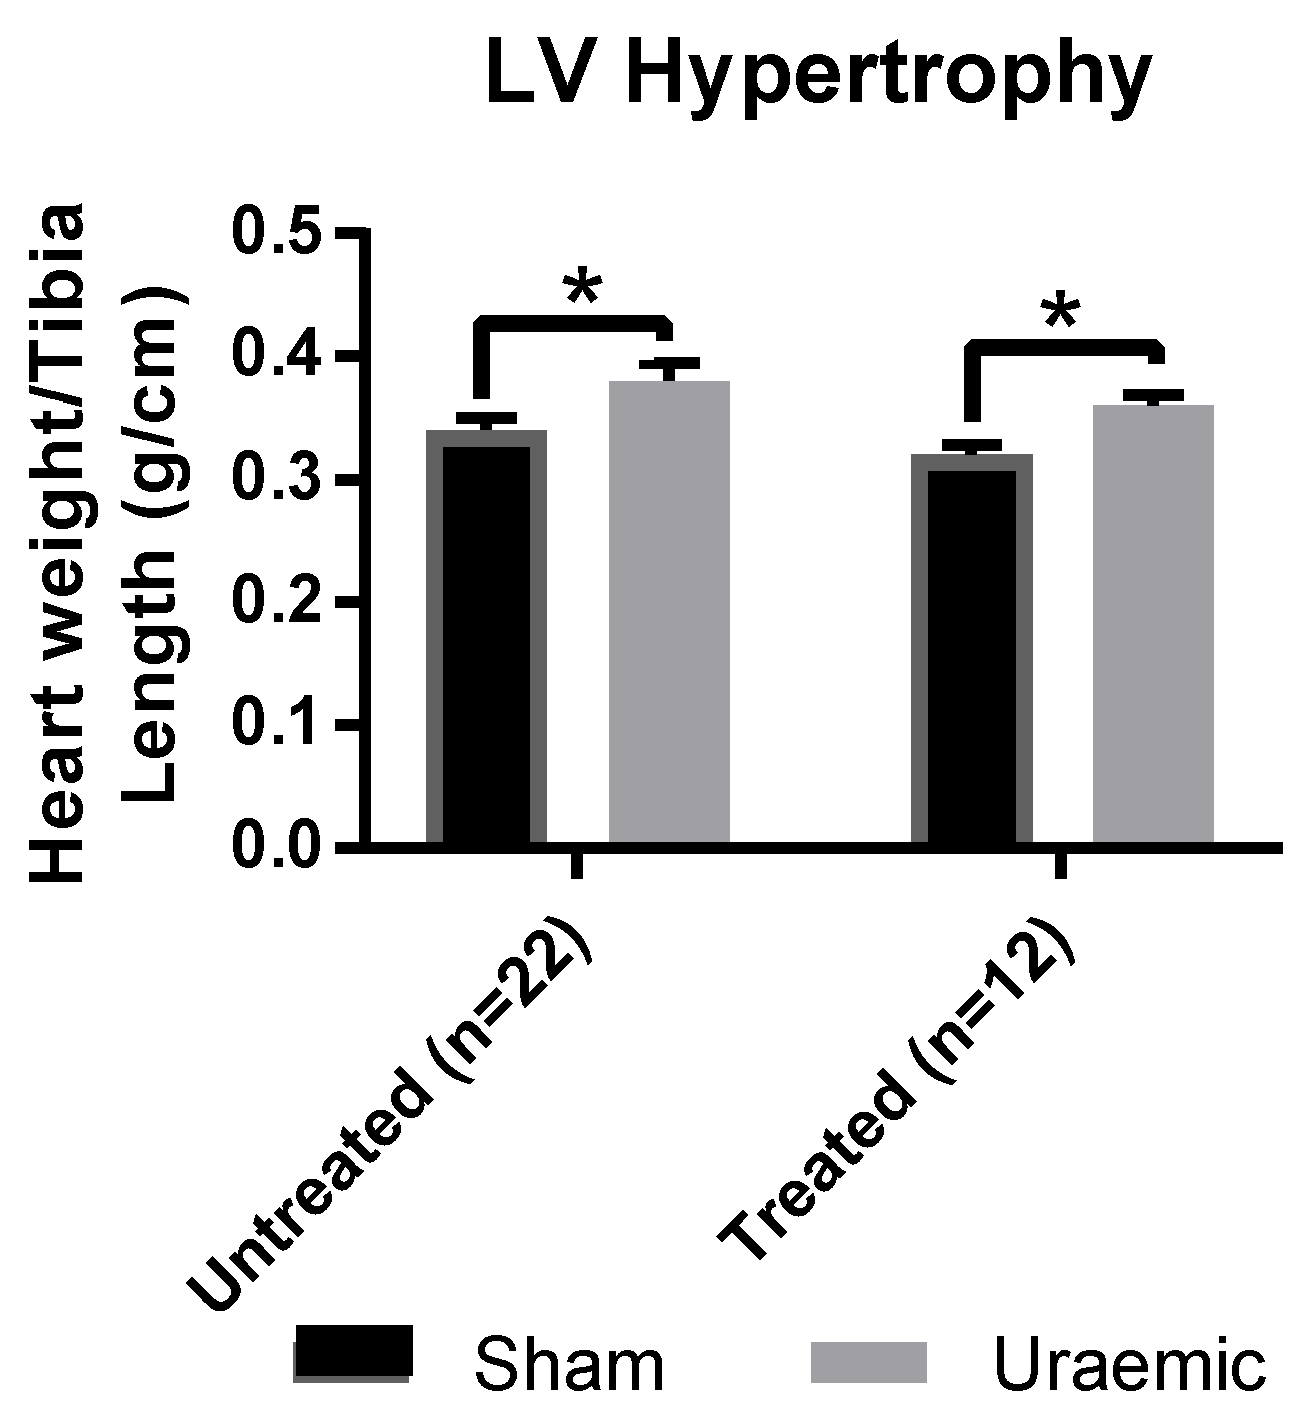
3.2. Left Ventricular (LV) Hypertrophy
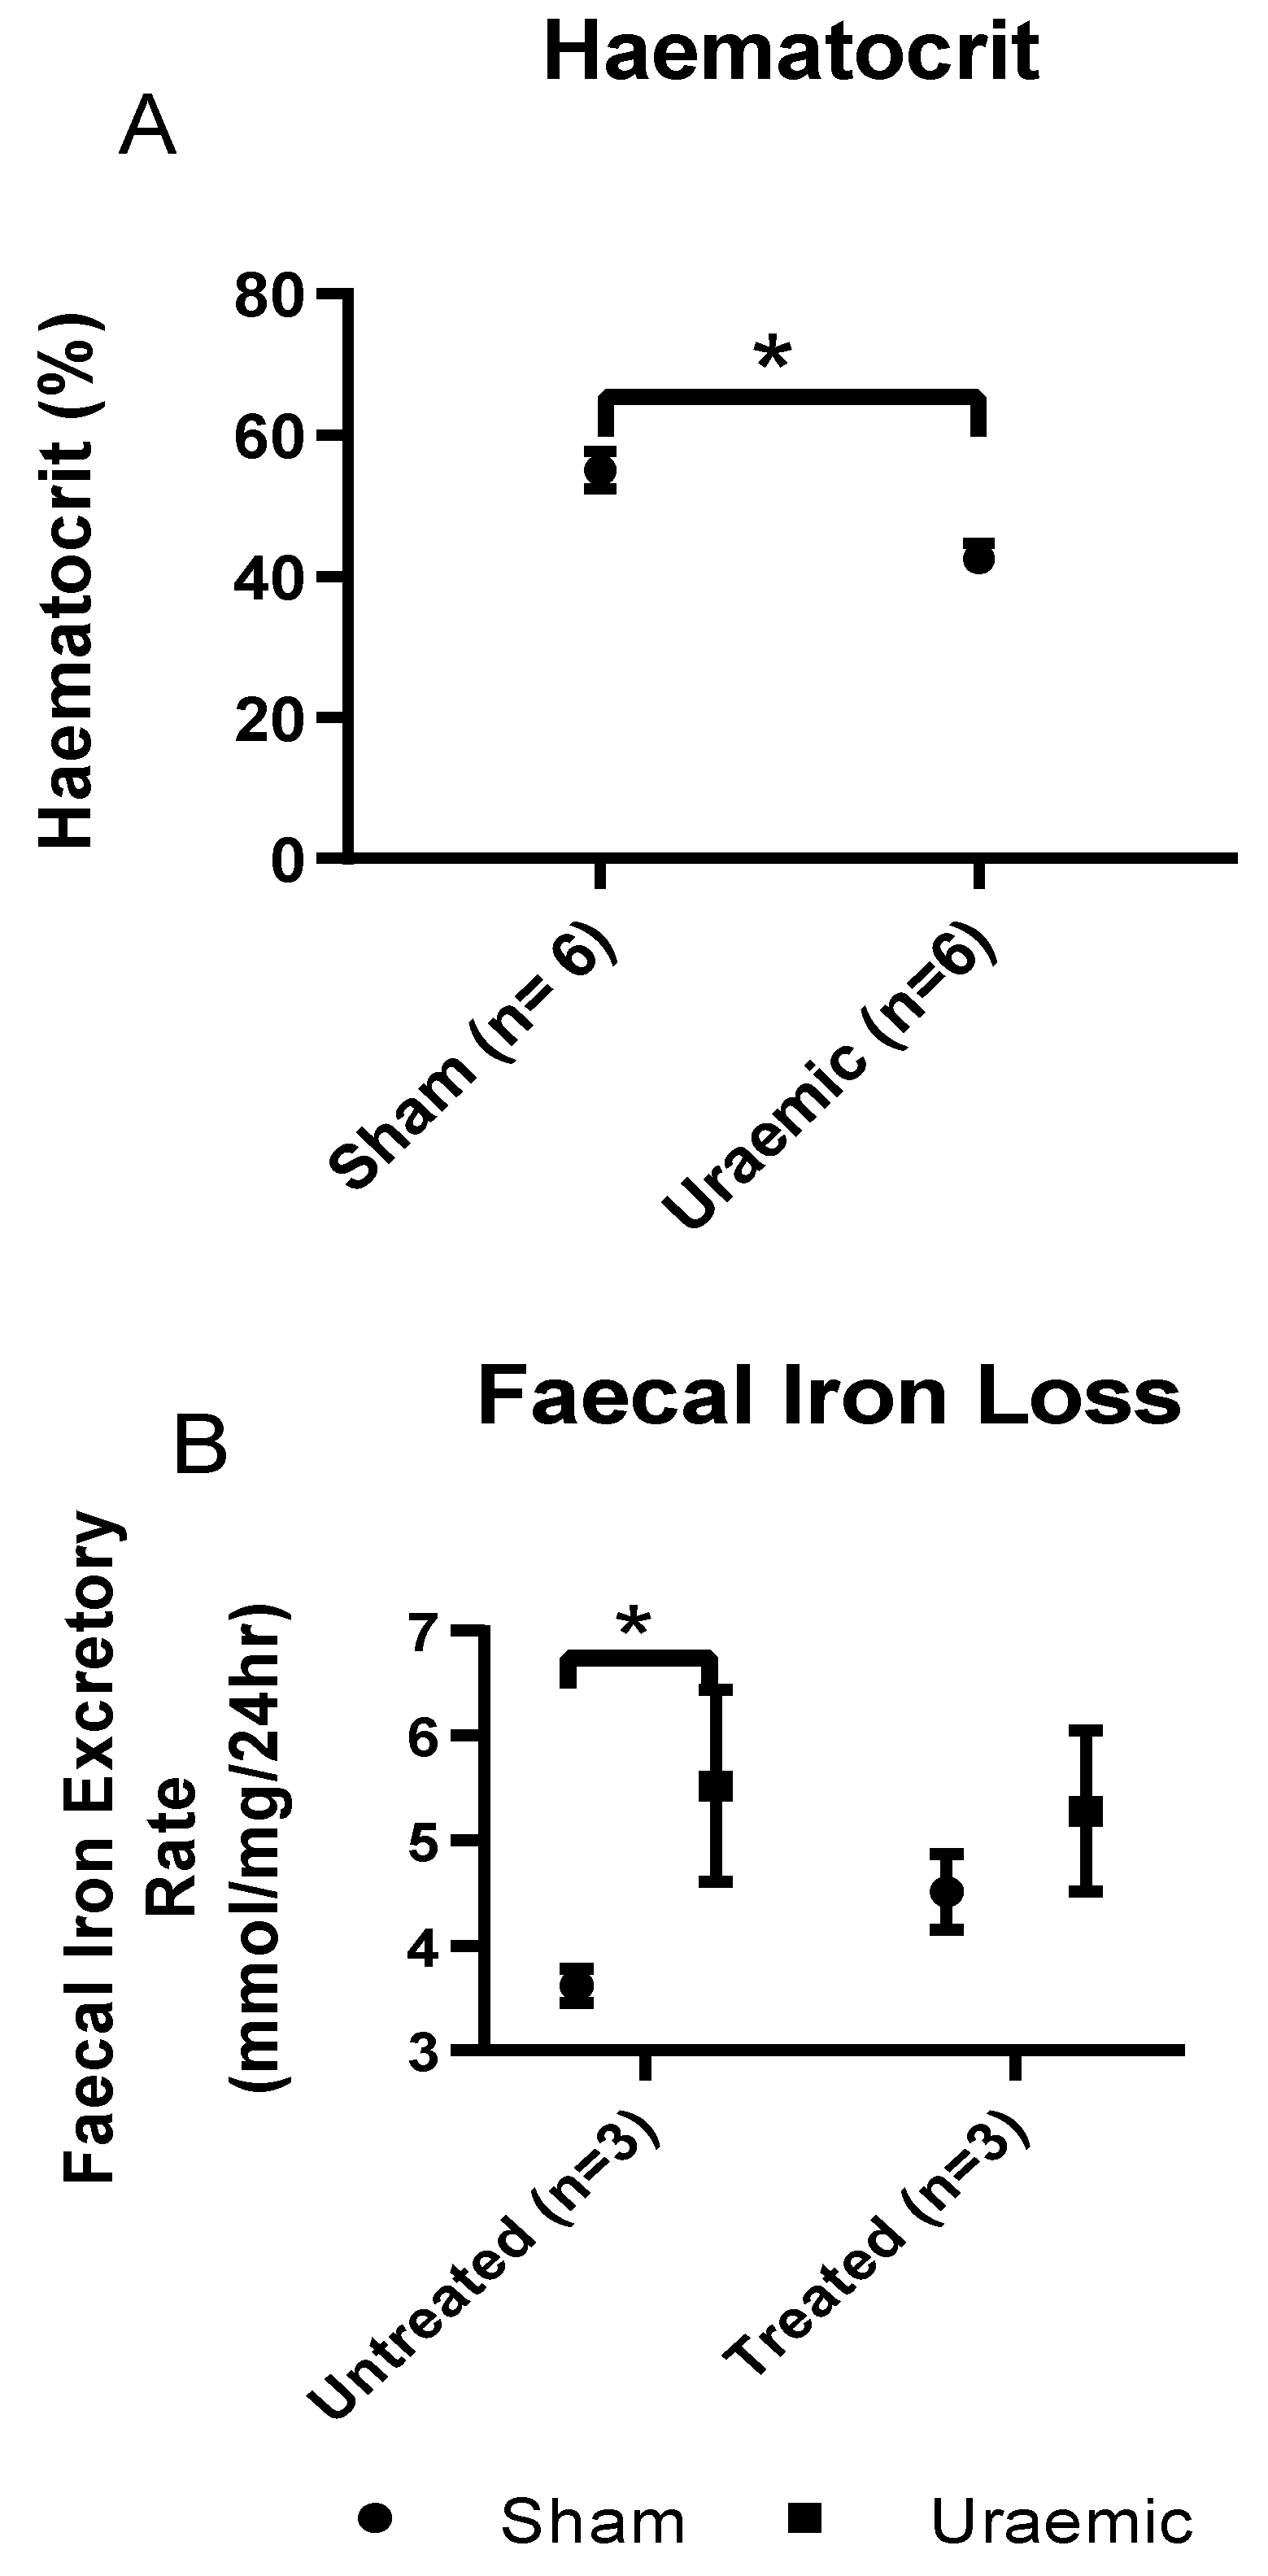
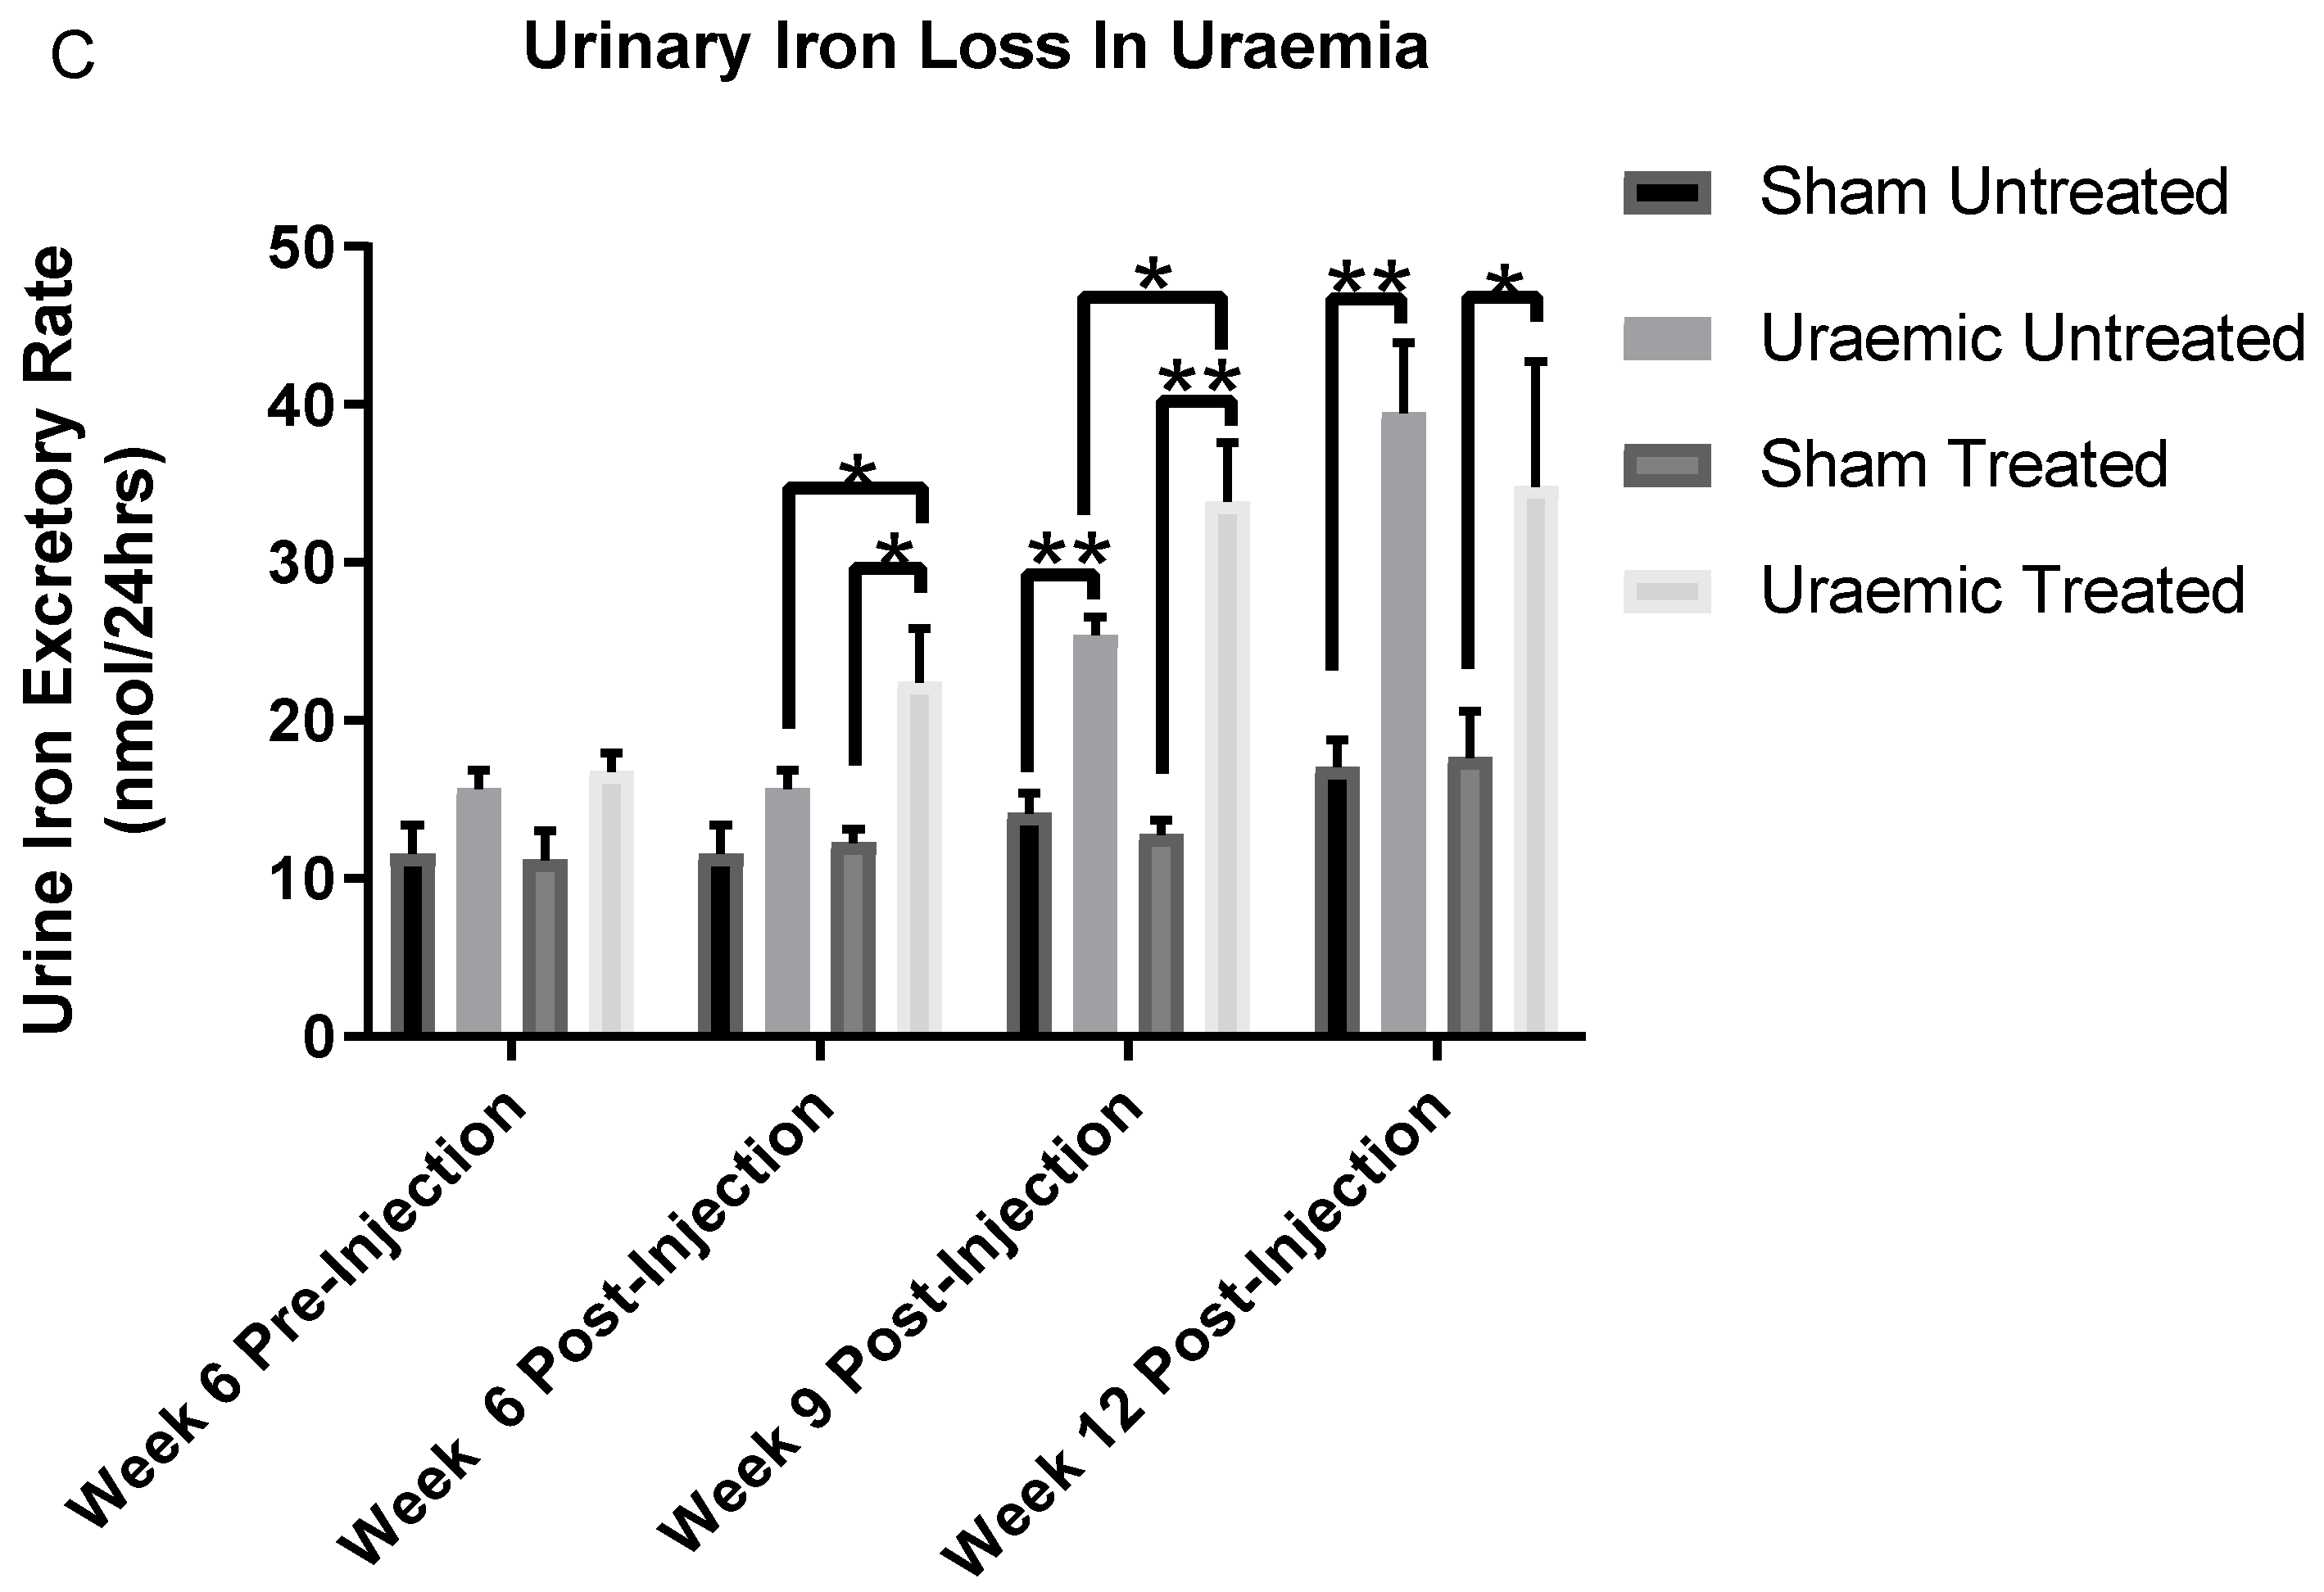
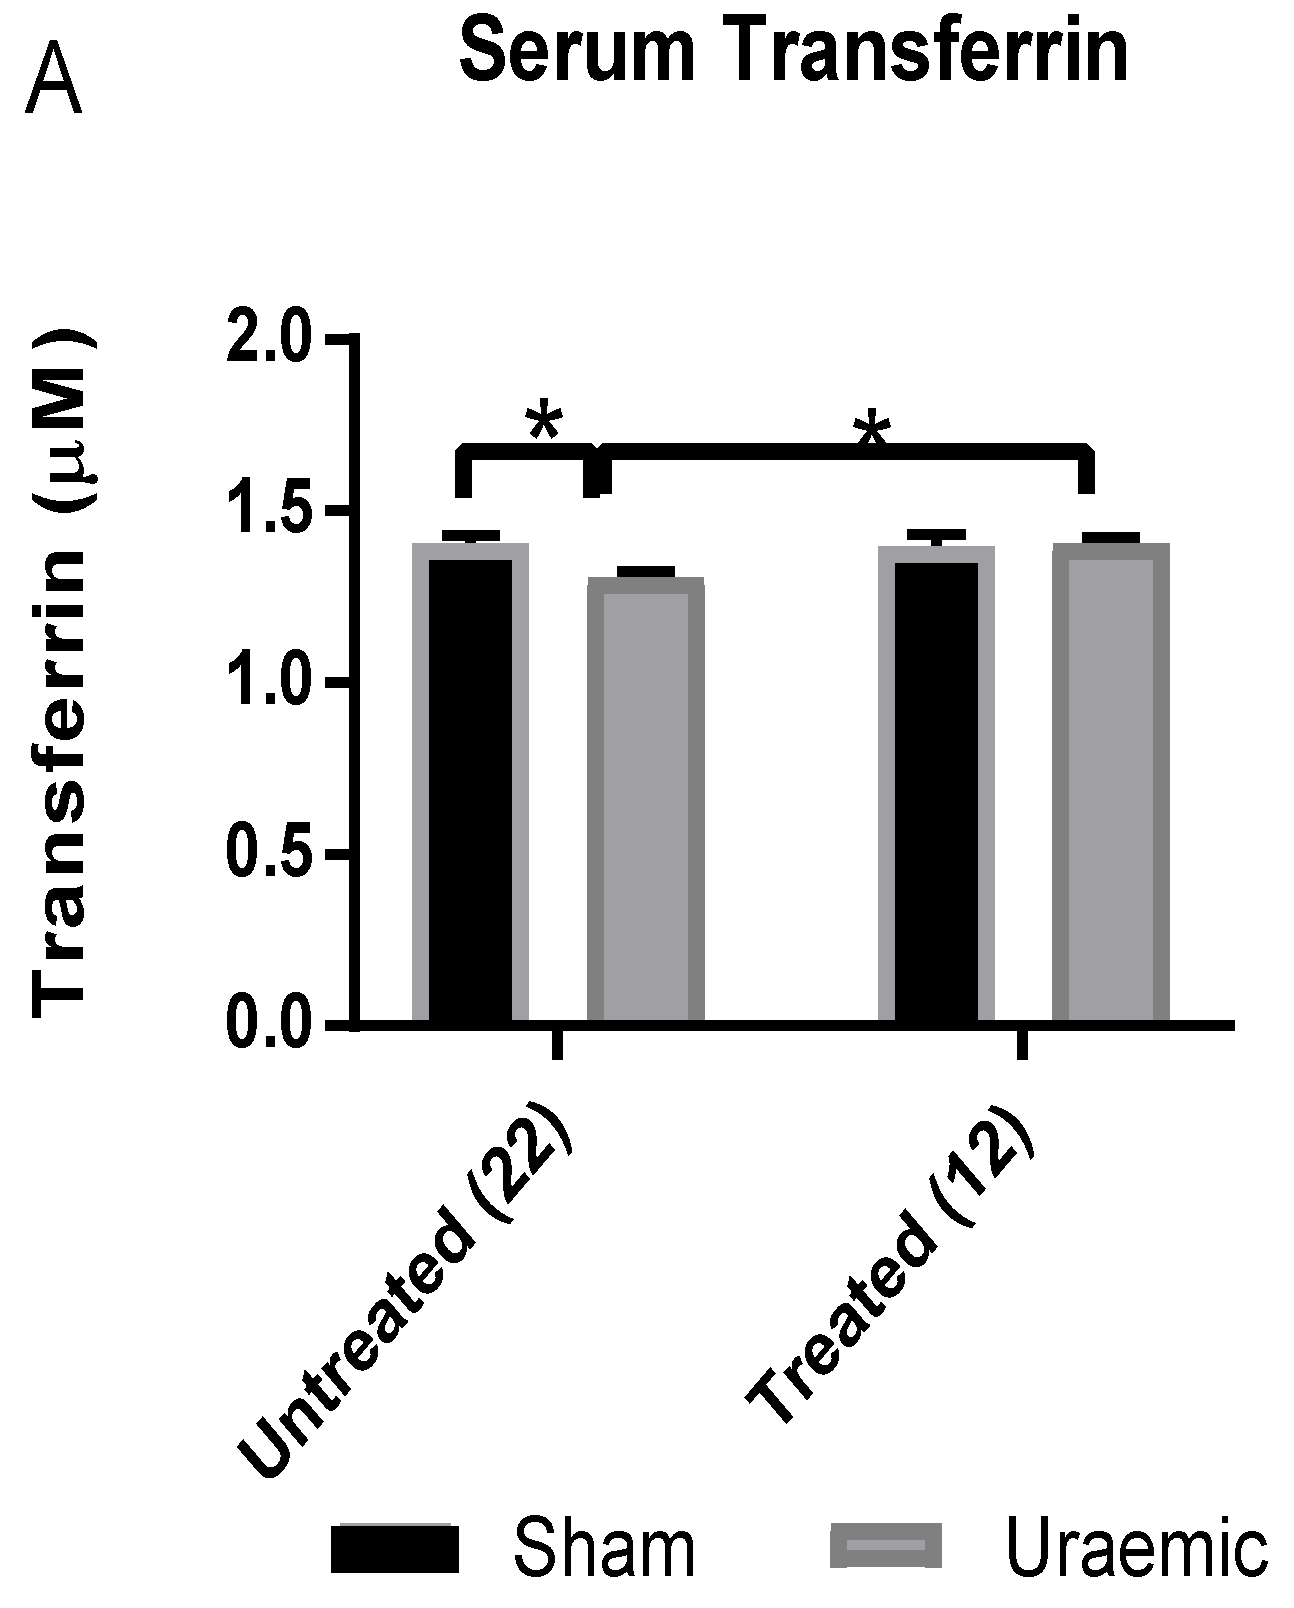
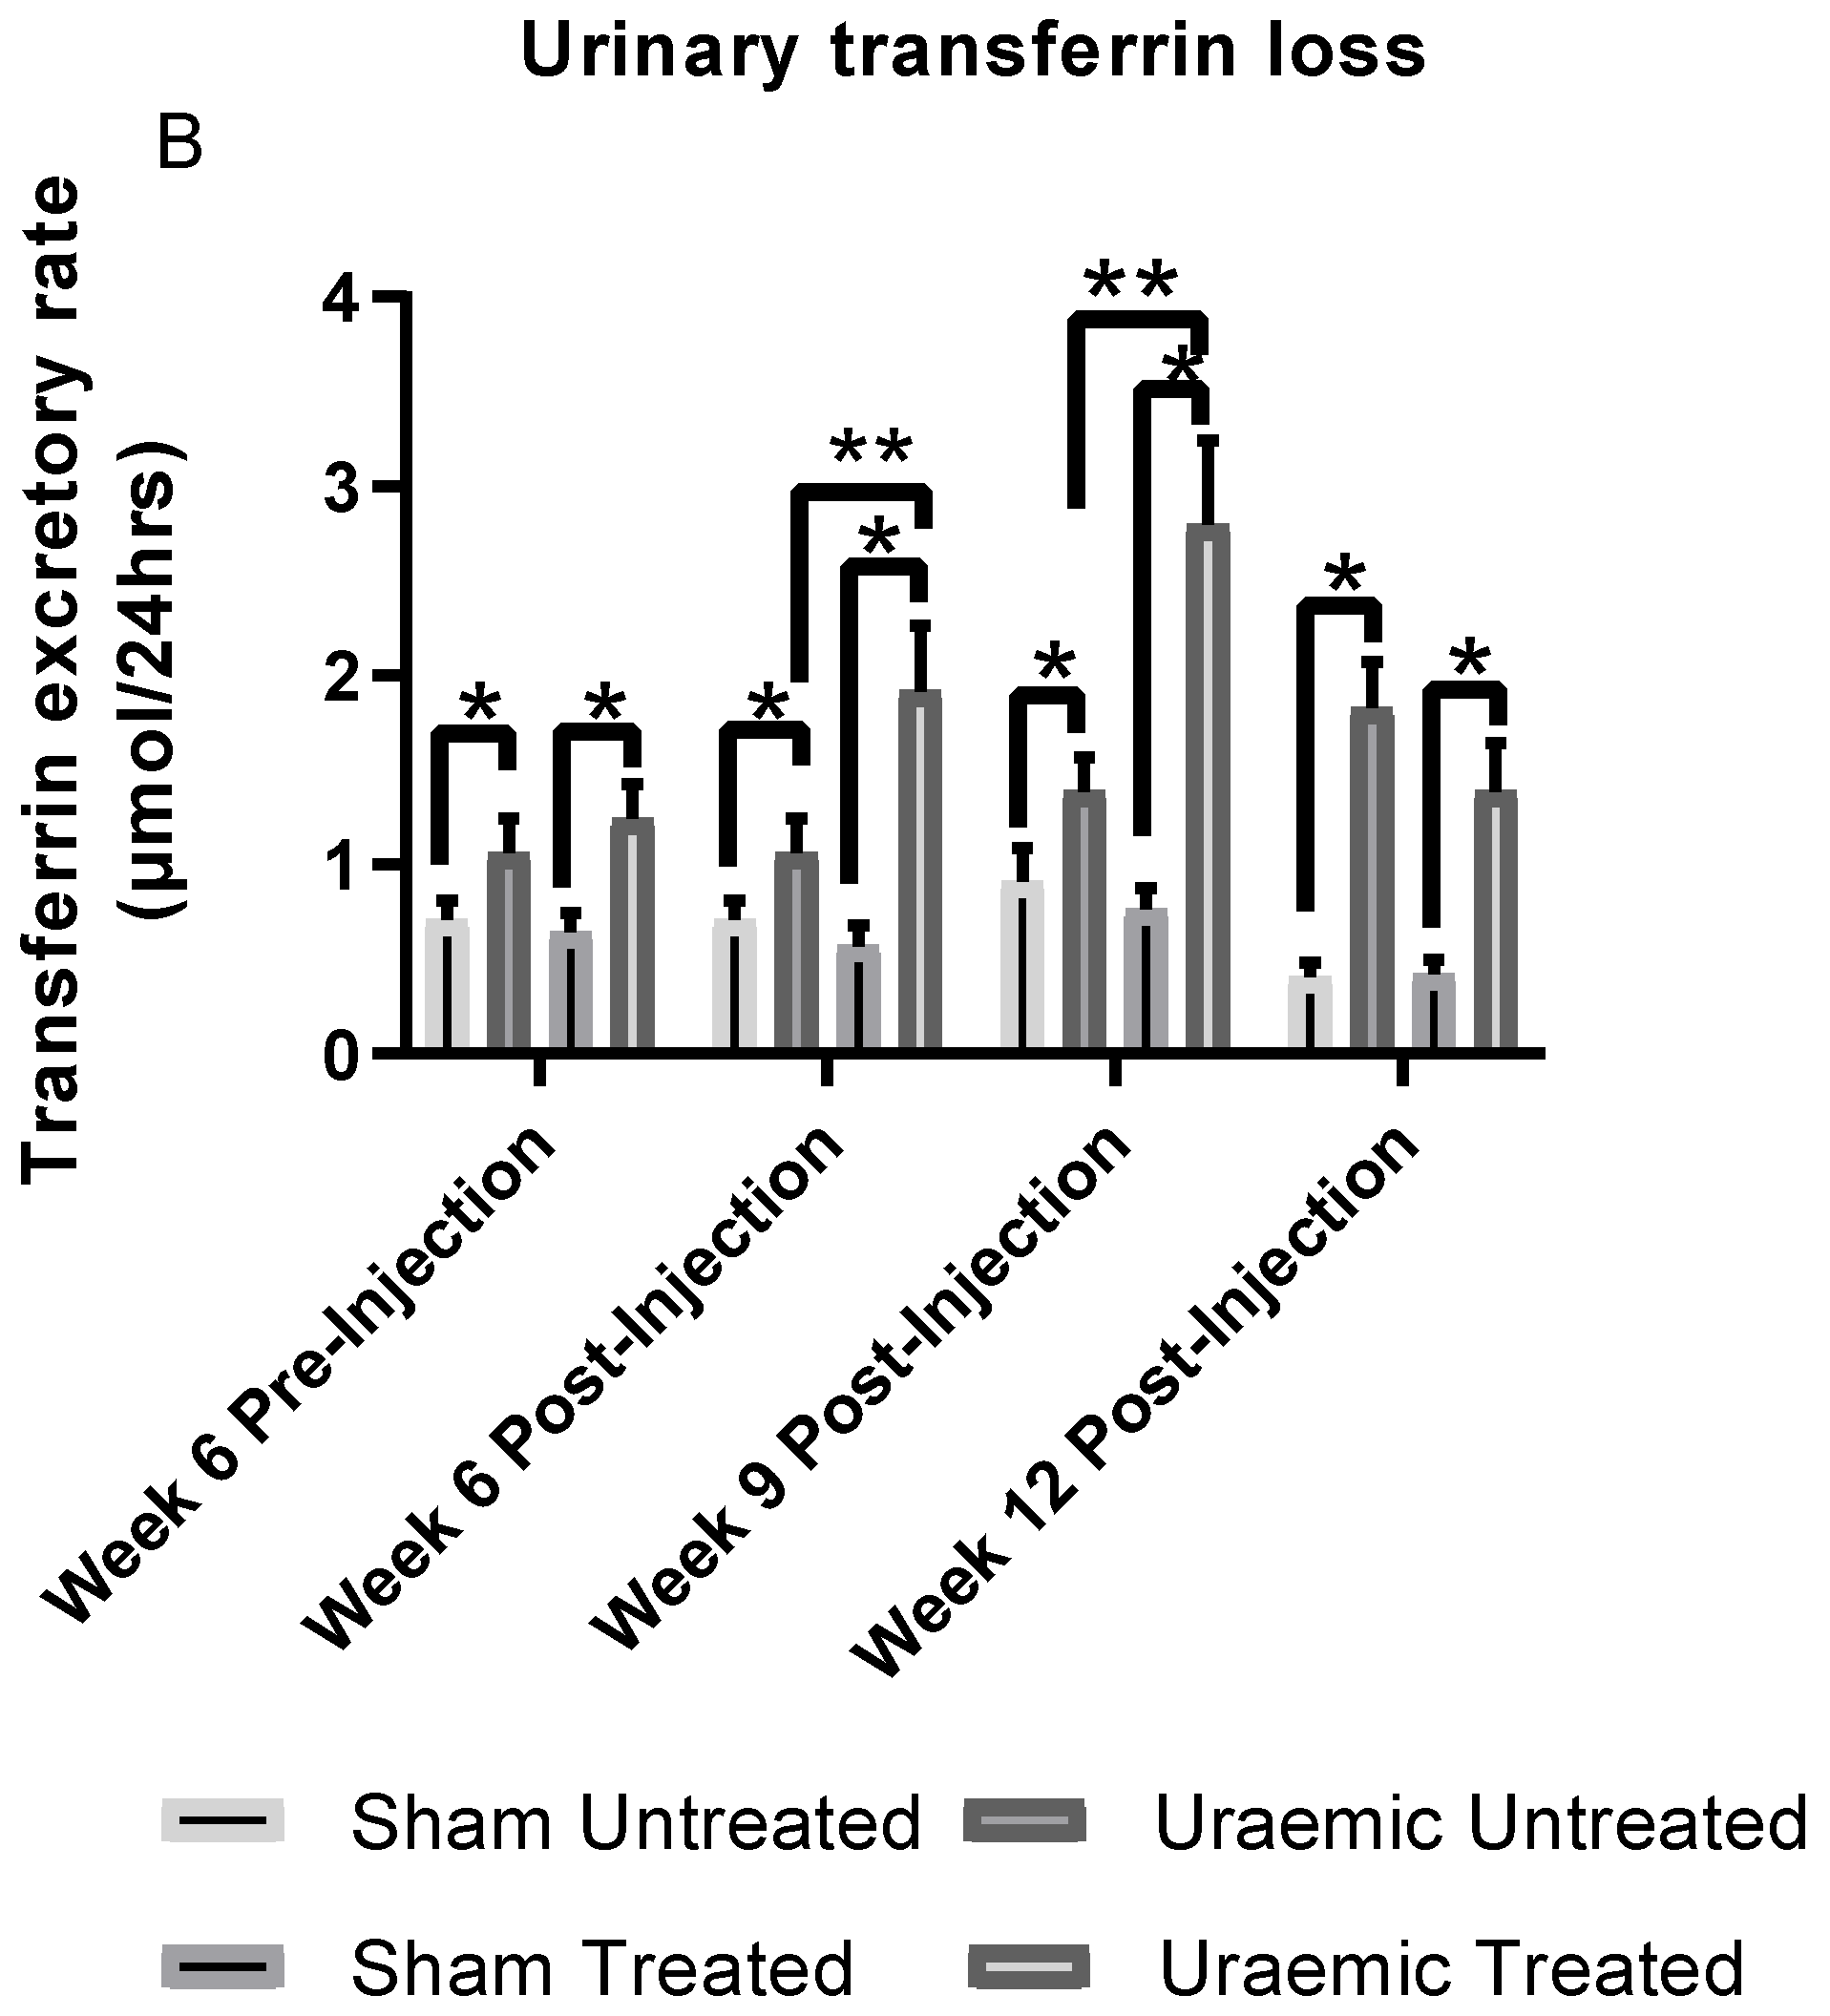
3.3. Anaemia and Iron Status
3.4. Impact of Iron Therapy
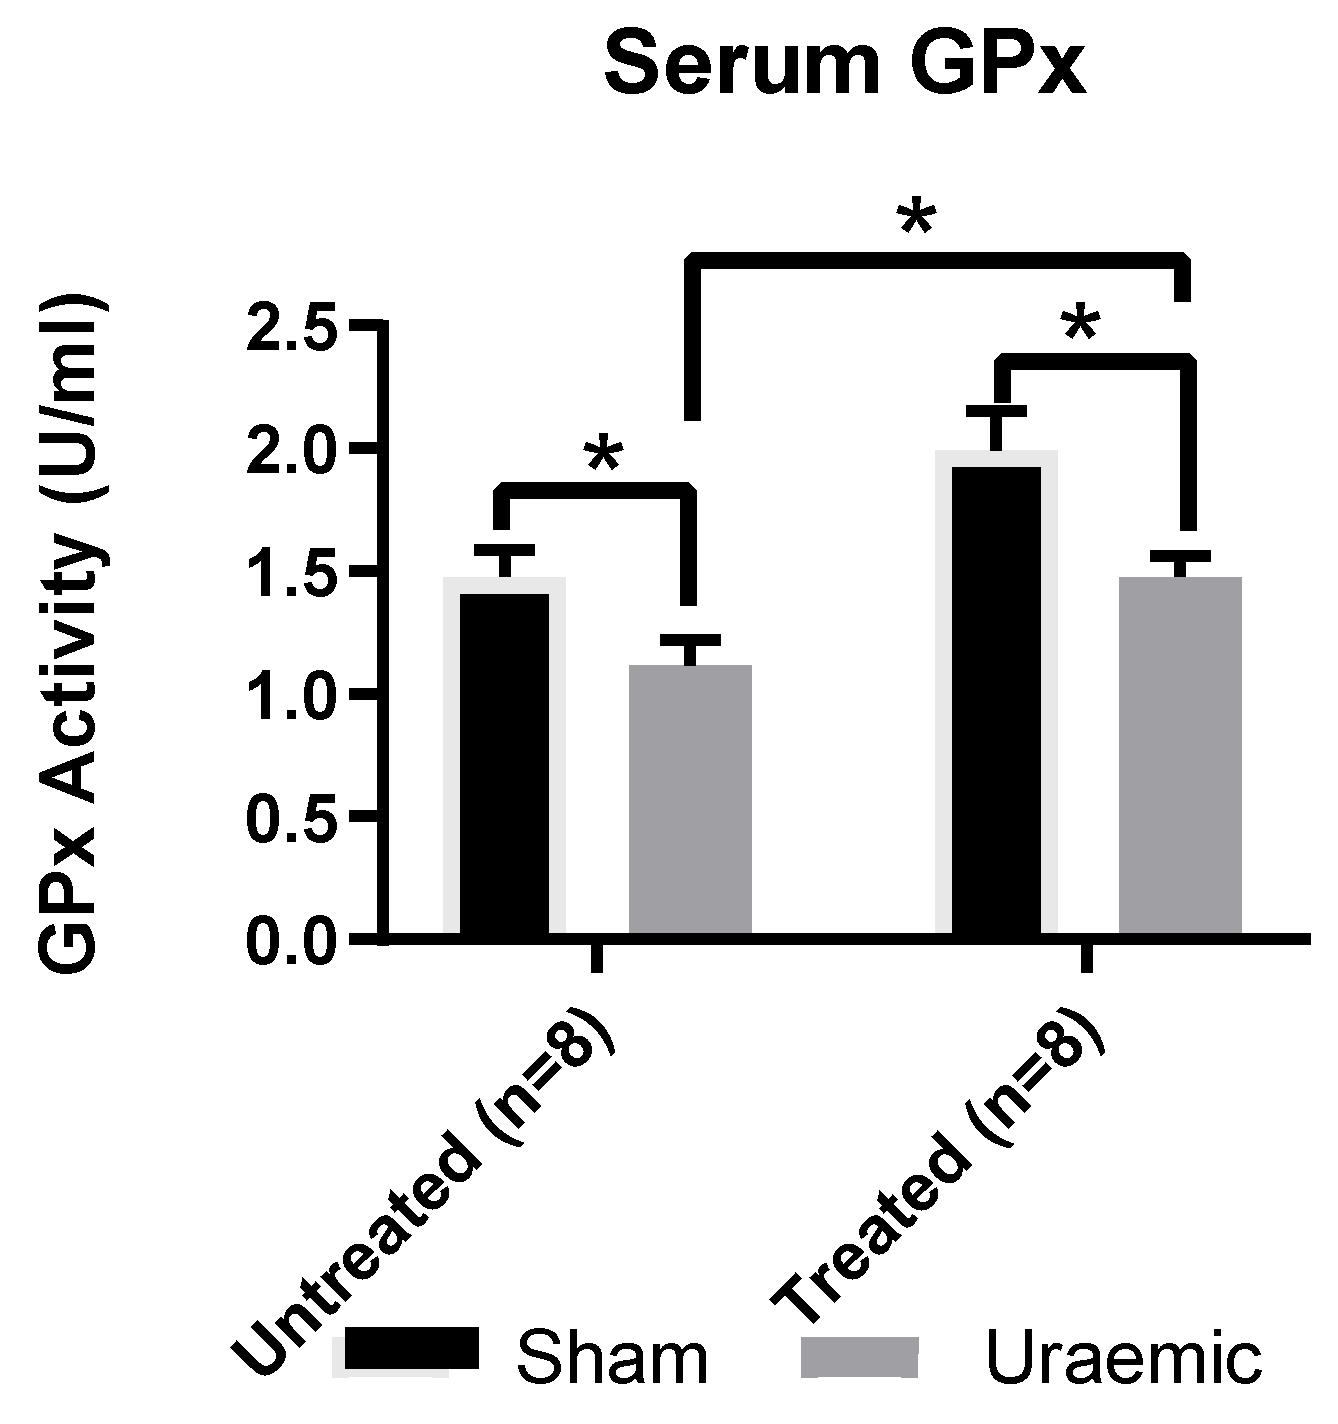
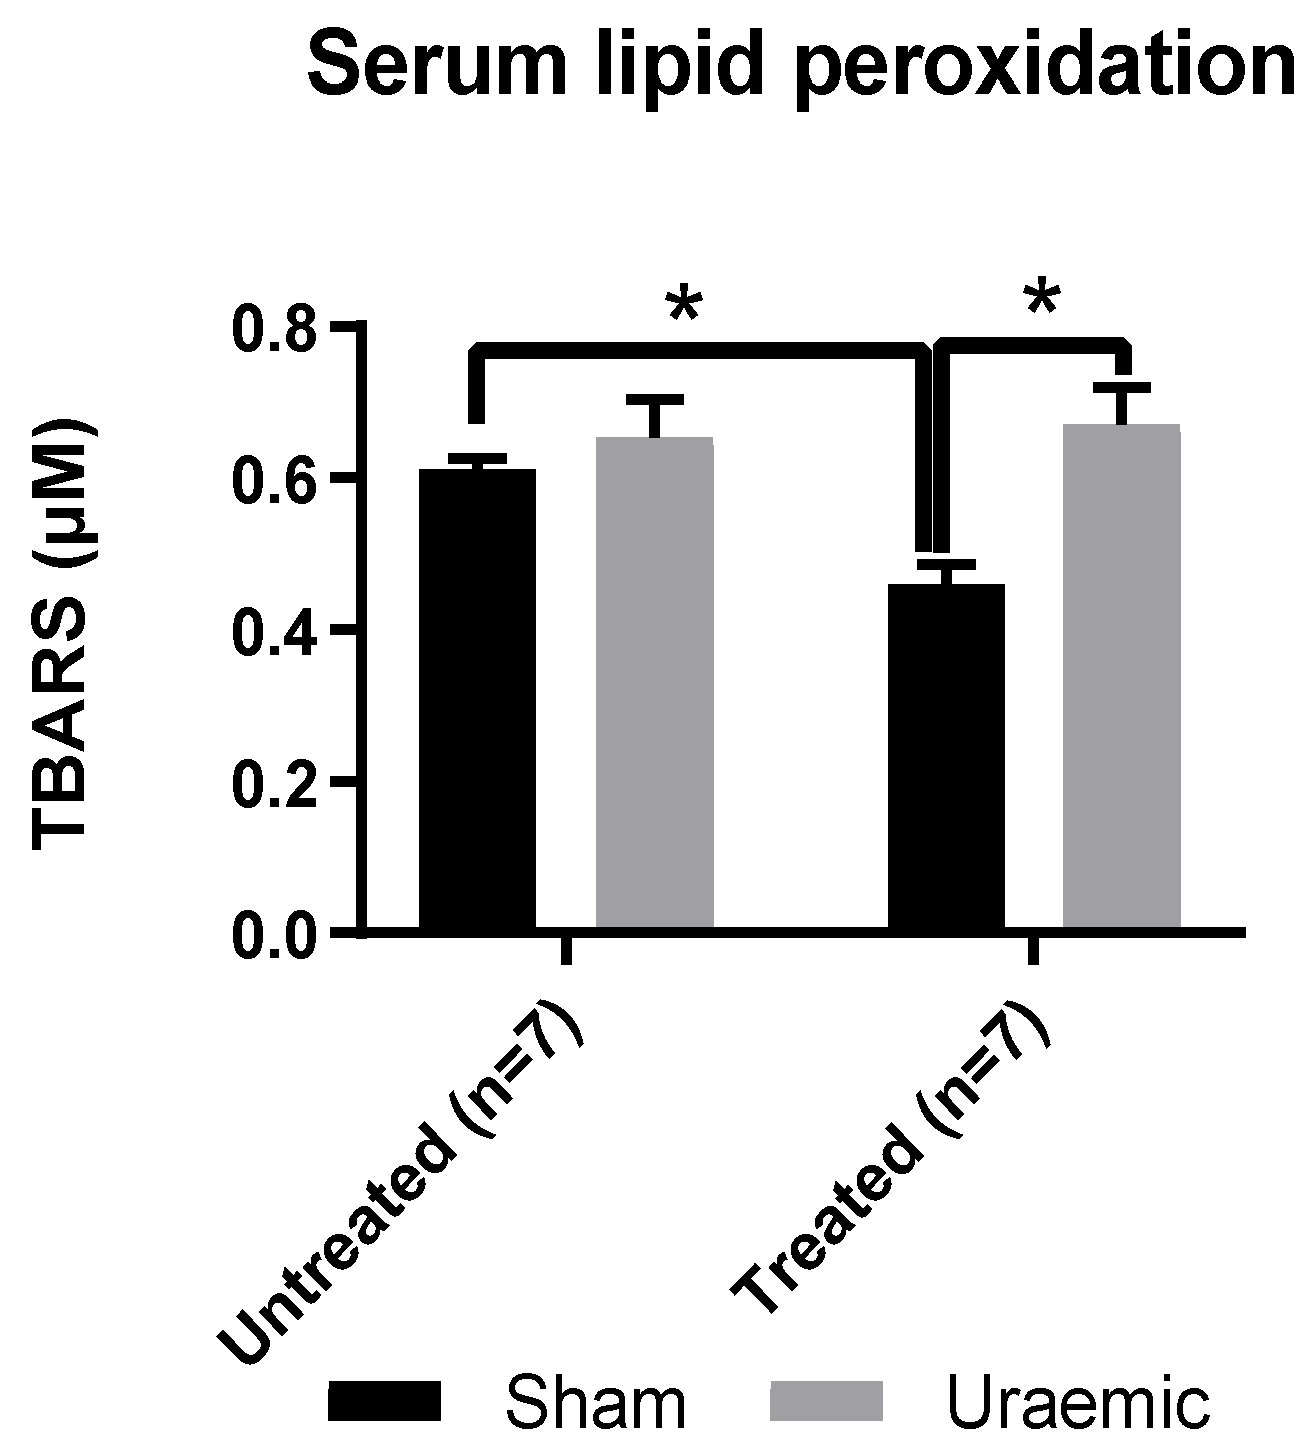
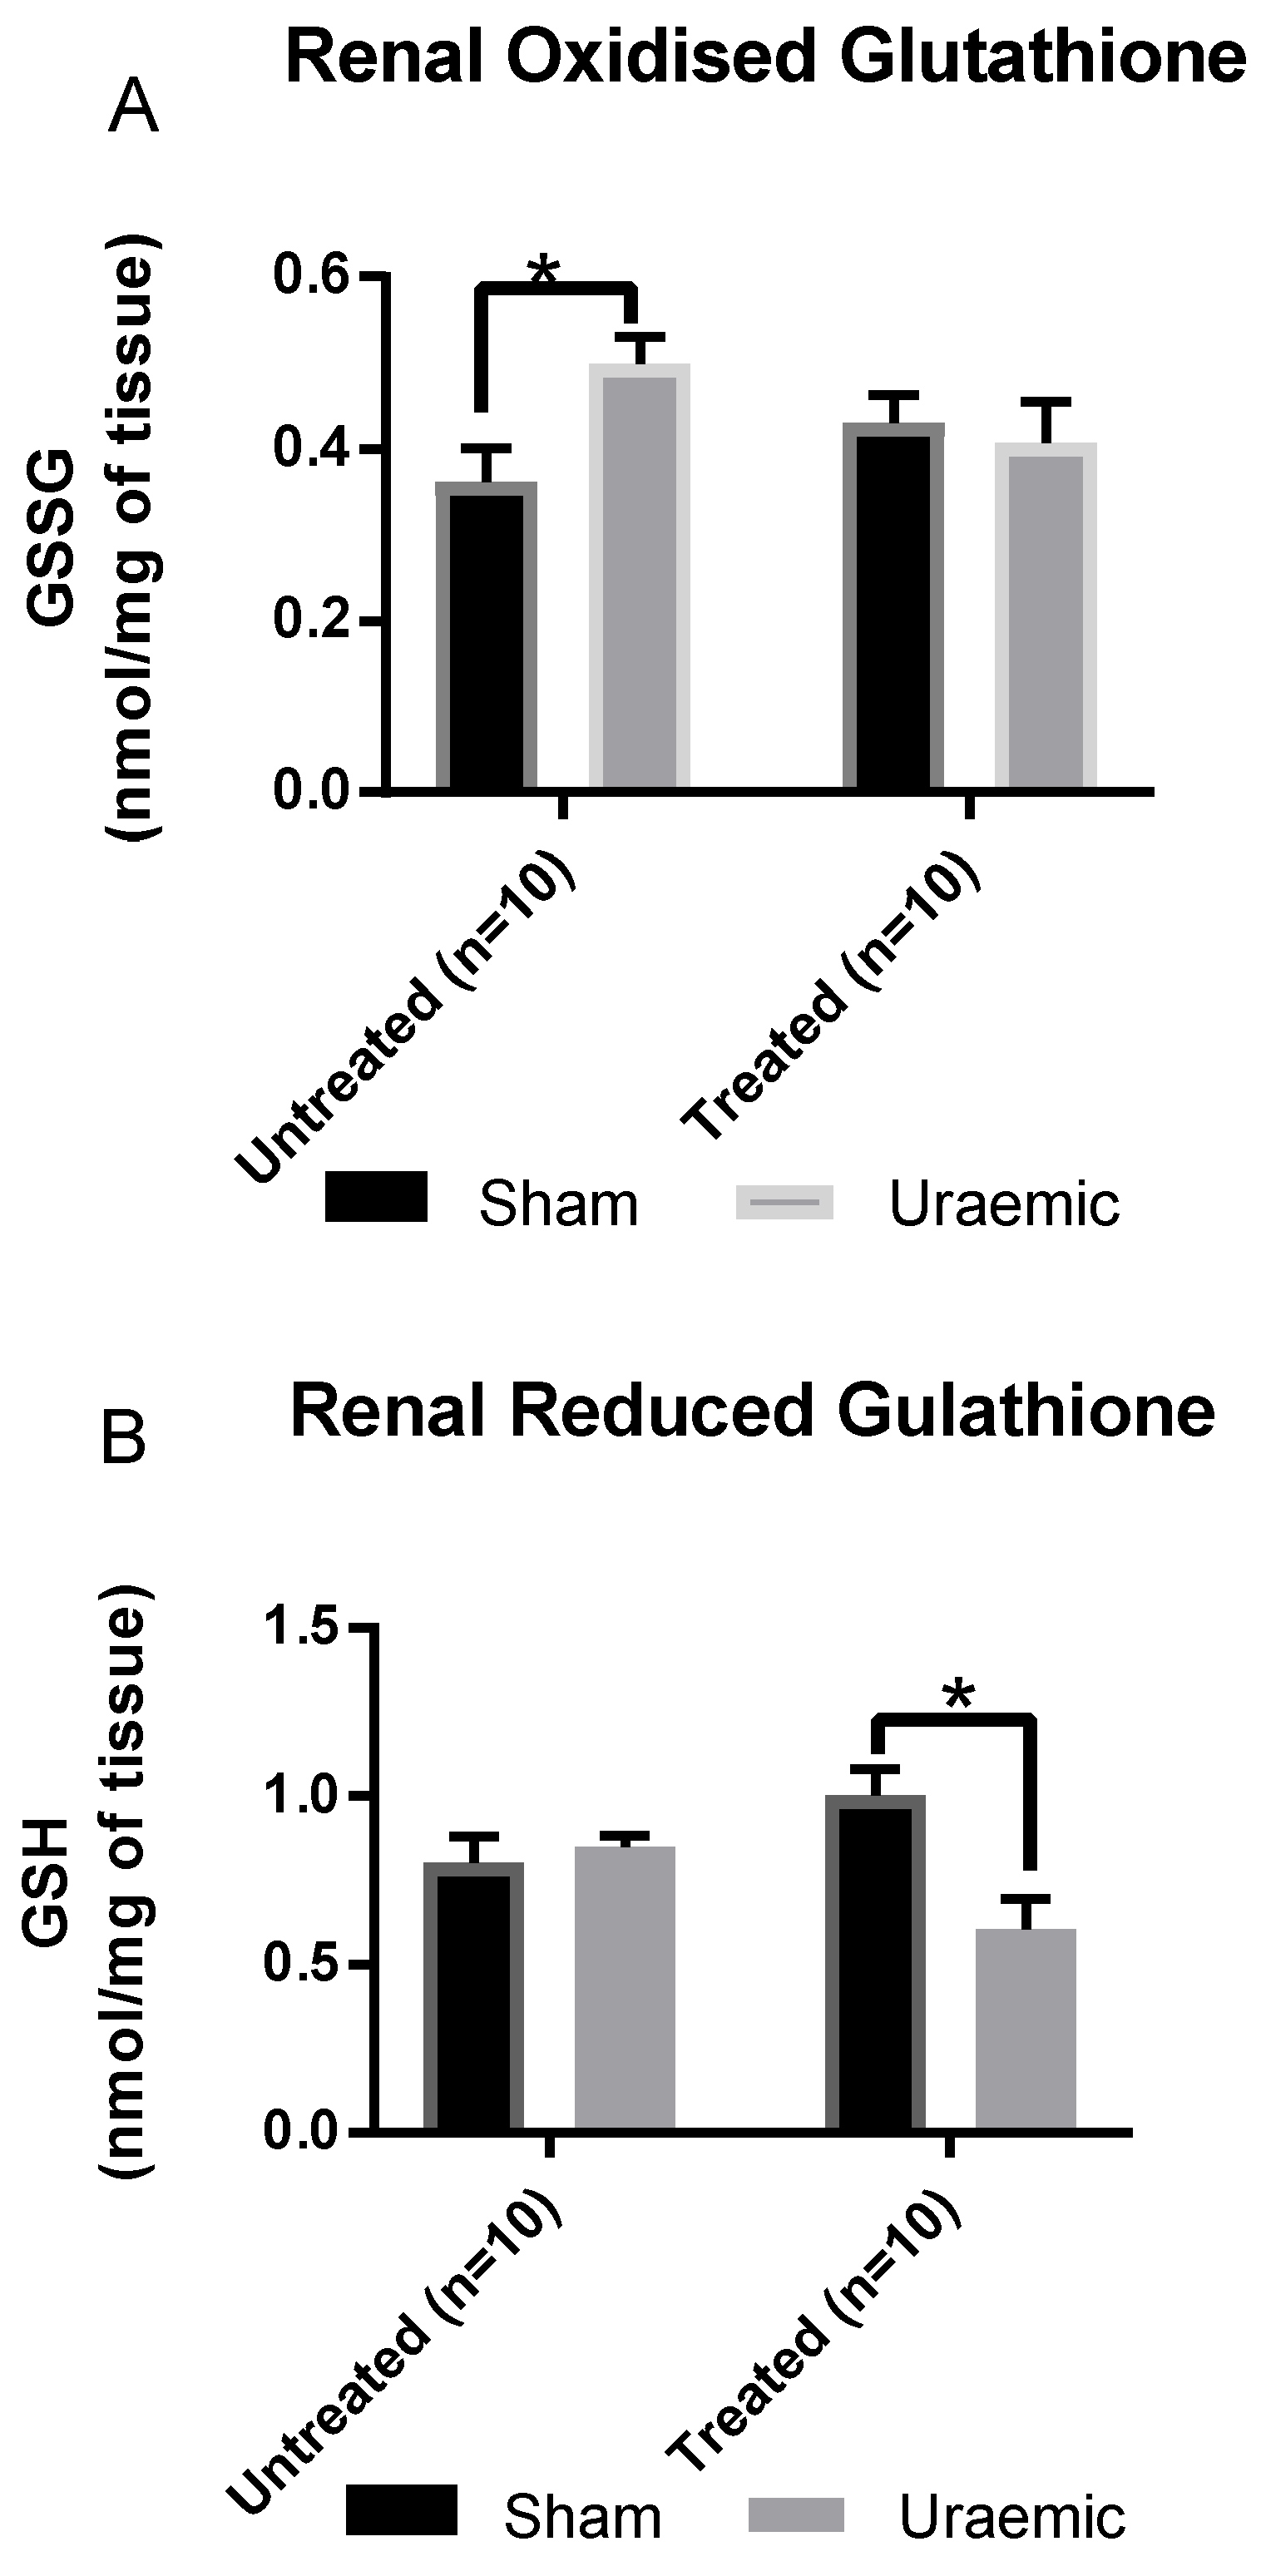
3.5. Systemic and Renal Oxidative Stress
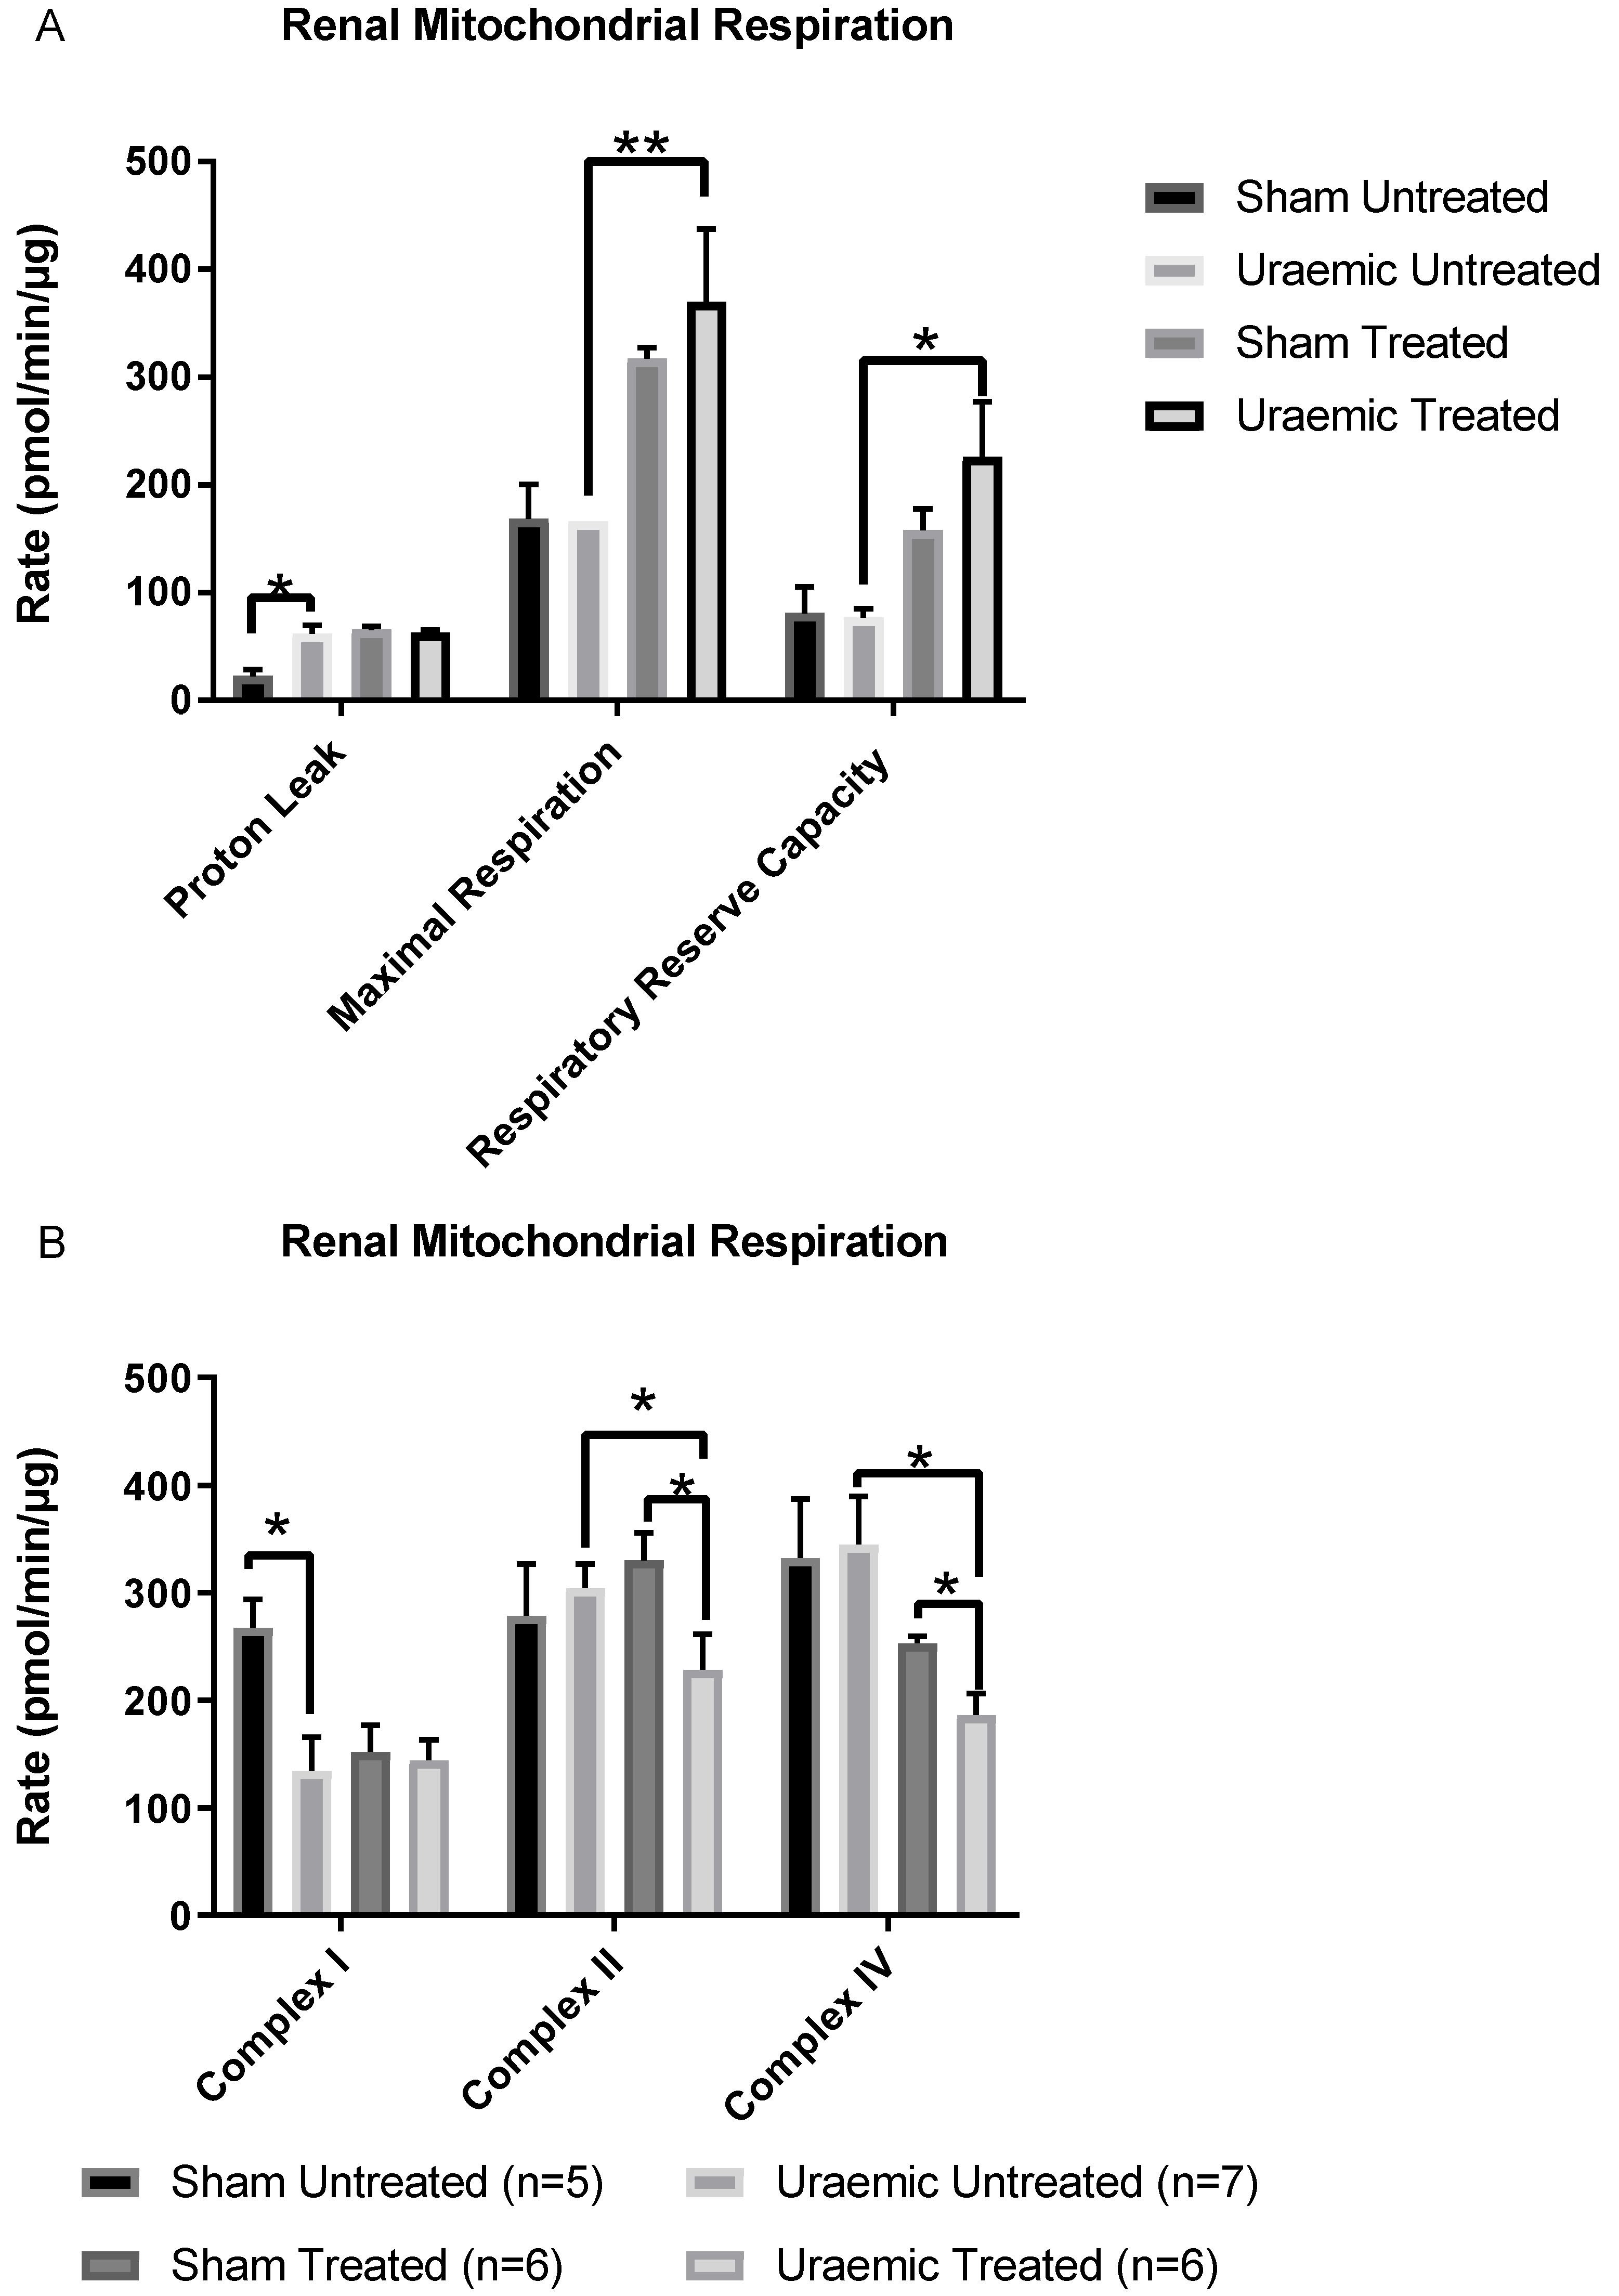
3.6. Renal Mitochondrial Function
4. Discussion
4.1. Induction of Uraemia and Impact of Iron Therapy
4.2. Anaemia in Uraemia and the Effect of Iron
4.3. Oxidative Stress
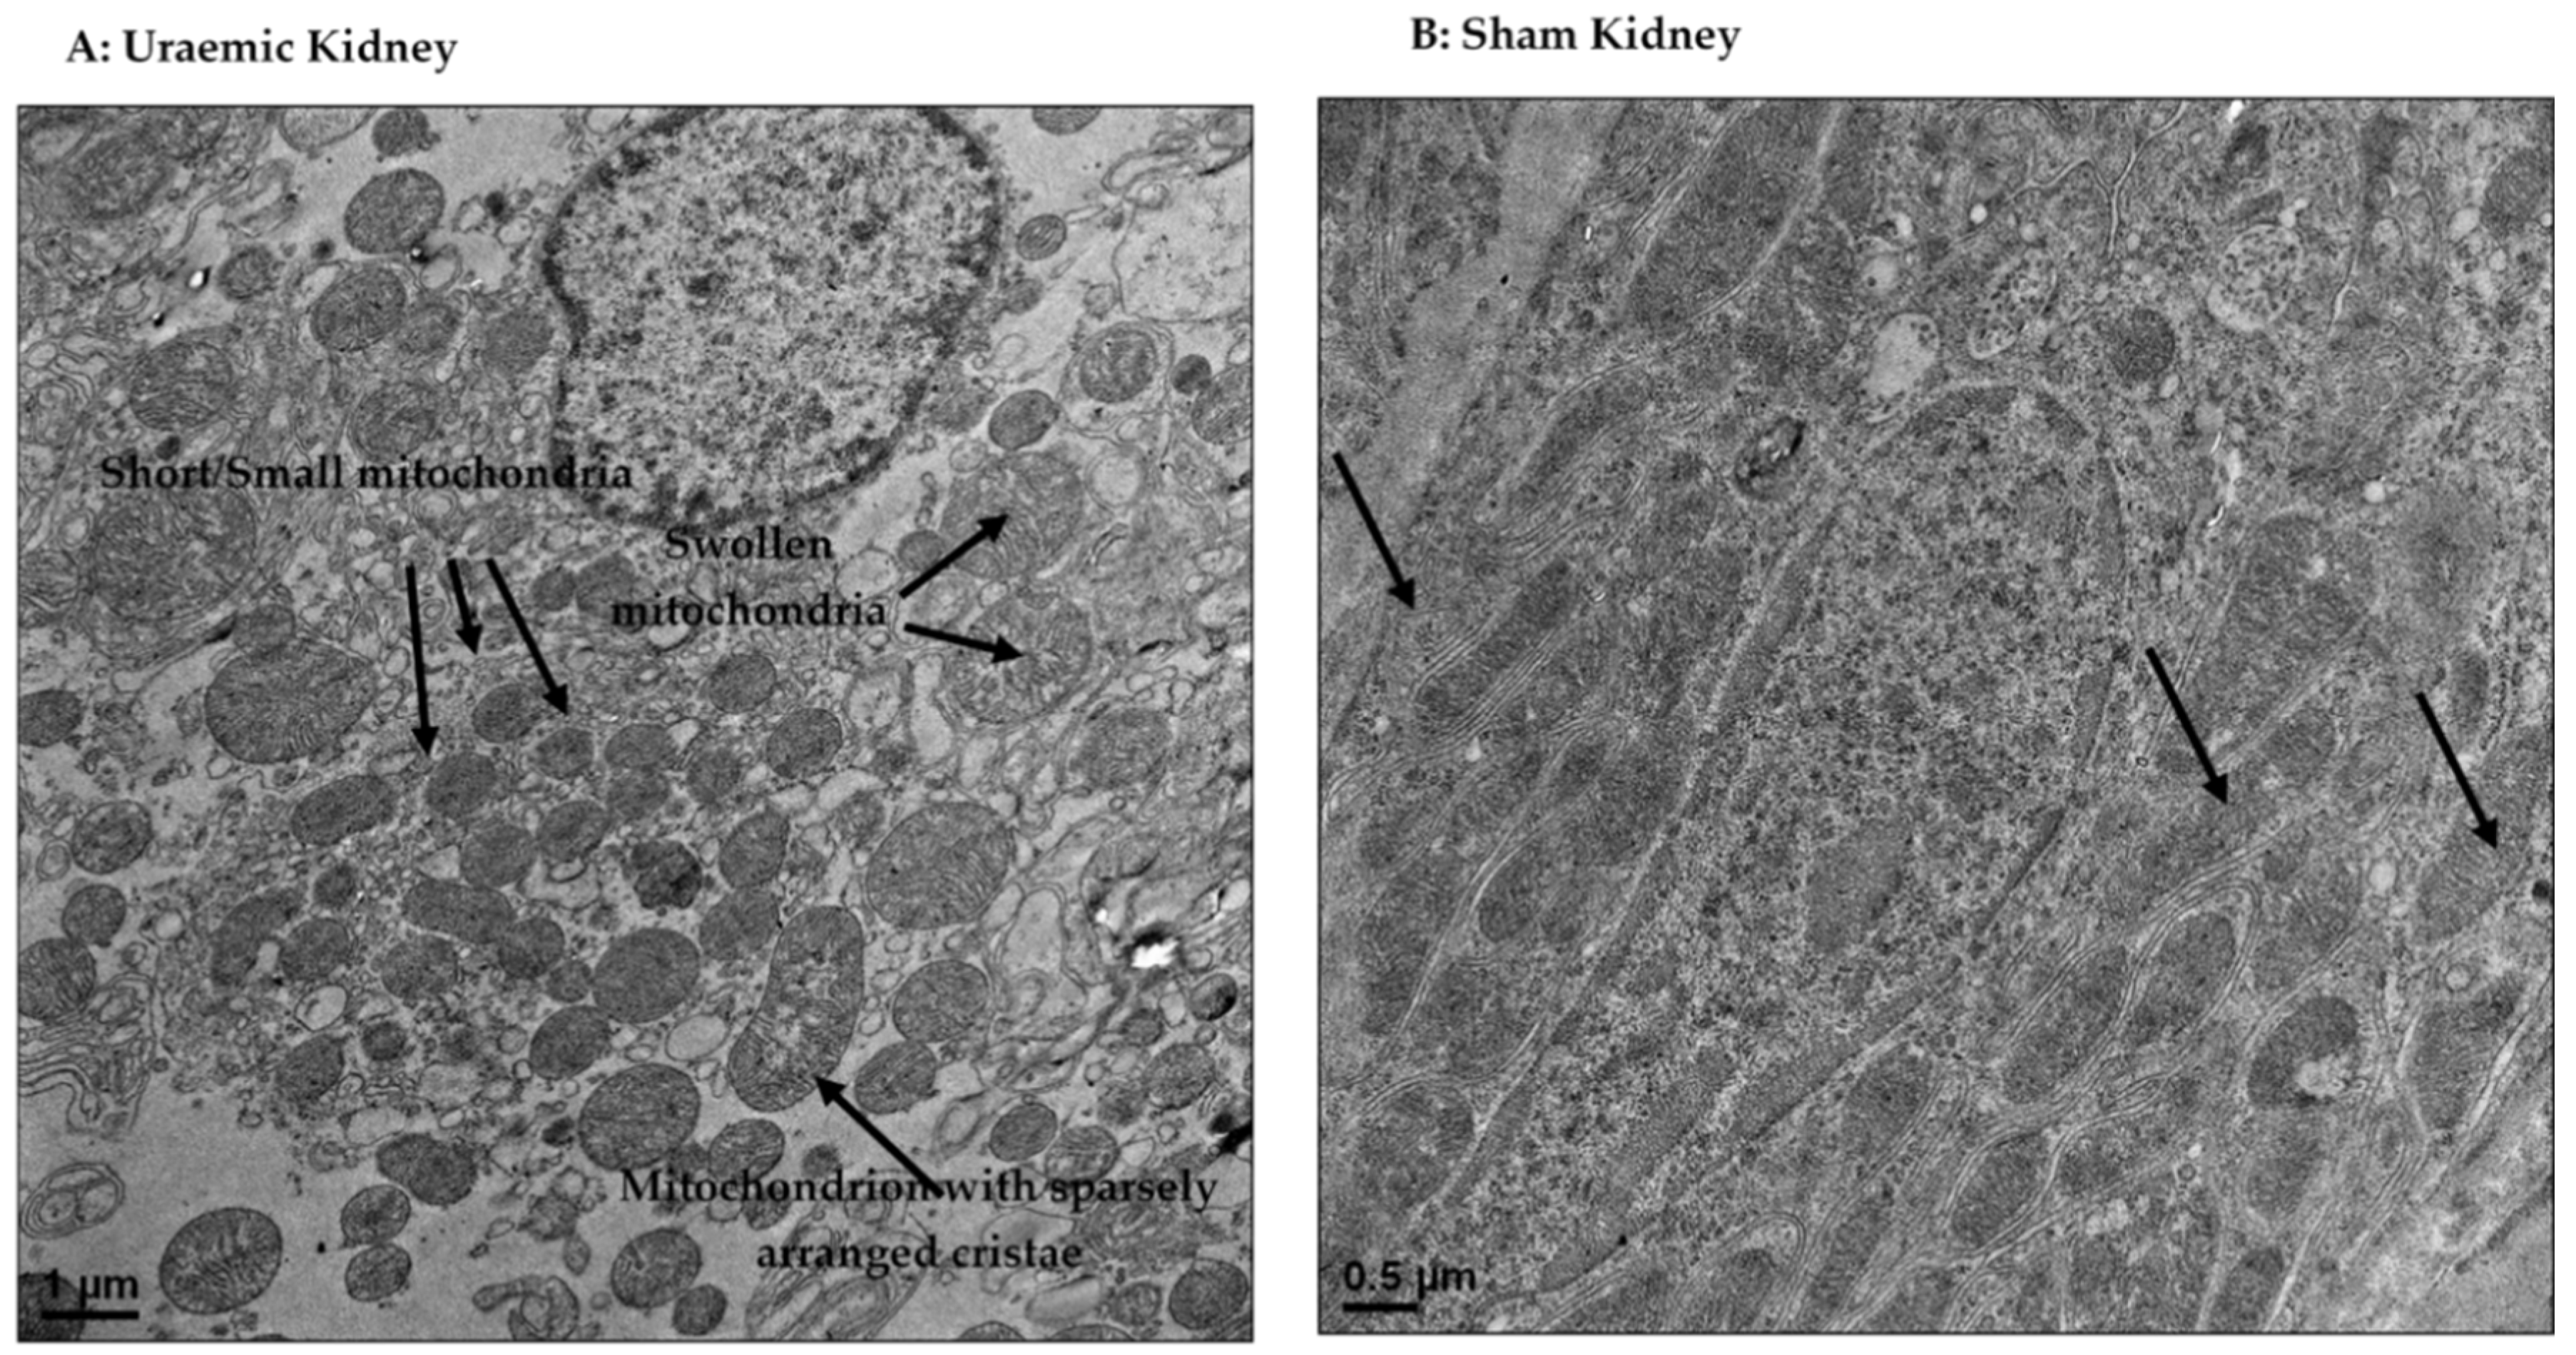
4.4. Mitochondrial Dysfunction
5. Conclusions
Author Contributions
Funding
Acknowledgments
Conflicts of Interest
References
- Mehdi, U.; Toto, R.D. Anemia, Diabetes, and Chronic Kidney Disease. Diabetes Care 2009, 32, 1320–1326. [Google Scholar] [CrossRef] [PubMed] [Green Version]
- Kovesdy, C.; Trivedi, B.; Kalantar-Zadeh, K.; Anderson, J. Association of anemia with outcomes in men with moderate and severe chronic kidney disease. Kidney Int. 2006, 69, 560–564. [Google Scholar] [CrossRef] [PubMed] [Green Version]
- Regidor, D.L.; Kopple, J.D.; Kovesdy, C.P.; Kilpatrick, R.D.; McAllister, C.J.; Aronovitz, J.; Greenland, S.; Kalantar-Zadeh, K. Associations between Changes in Hemoglobin and Administered Erythropoiesis-Stimulating Agent and Survival in Hemodialysis Patients. J. Am. Soc. Nephrol. 2006, 17, 1181–1191. [Google Scholar] [CrossRef] [PubMed]
- Bhandari, S. Beyond efficacy and safety-the need for convenient and cost-effective iron therapy in health care. NDT Plus 2011, 4, i14–i19. [Google Scholar] [CrossRef]
- Nuhu, F.; Bhandari, S. Oxidative Stress and Cardiovascular Complications in Chronic Kidney Disease, the Impact of Anaemia. Pharmaceuticals 2018, 11, 103. [Google Scholar] [CrossRef]
- Horowitz, M.P.; Greenamyre, J.T. Mitochondrial Iron Metabolism and Its Role in Neurodegeneration. J. Alzheimer’s Dis. 2010, 20, S551–S568. [Google Scholar] [CrossRef] [Green Version]
- Urrutia, P.J.; Mena, N.P.; Núñez, M.T. The interplay between iron accumulation, mitochondrial dysfunction, and inflammation during the execution step of neurodegenerative disorders. Front. Pharmacol. 2014, 5, 38. [Google Scholar] [CrossRef] [Green Version]
- Abeti, R.; Parkinson, M.H.; Hargreaves, I.P.; Angelova, P.R.; Sandi, C.; Pook, M.A.; Giunti, P.; Abramov, A.Y. Mitochondrial energy imbalance and lipid peroxidation cause cell death in Friedreich’s ataxia’. Cell Death Dis. 2016, 7, e2237. [Google Scholar] [CrossRef]
- Vaubel, R.A.; Isaya, G. Iron-Sulfur Cluster Synthesis, Iron Homeostasis and Oxidative Stress in Friedreich Ataxia. Mol Cell Neurosci 2013, 55, 50–61. [Google Scholar] [CrossRef]
- Wong, H.-S.; Dighe, P.A.; Mezera, V.; Monternier, P.-A.; Brand, M.D. Production of superoxide and hydrogen peroxide from specific mitochondrial sites under different bioenergetics conditions. J. Biol. Chem. 2017, 292, 16804–16809. [Google Scholar] [CrossRef]
- Hall, A.; Unwin, R.; Hanna, M.; Duchen, M.; Duchen, M. Renal function and mitochondrial cytopathy (MC): More questions than answers? QJM: Int. J. Med. 2008, 101, 755–766. [Google Scholar] [CrossRef] [PubMed]
- Kiffel, J.; Rahimzada, Y.; Trachtman, H. Focal segmental glomerulosclerosis and chronic kidney disease in pediatric patients. Adv. Chronic. Kidney Dis. 2011, 18, 332–338. [Google Scholar] [CrossRef] [PubMed]
- Liu, J.; Xie, J.; Zhang, X.; Tong, J.; Hao, X.; Ren, H.; Wang, W.; Chen, N. Serum C3 and Renal Outcome in Patients with Primary Focal Segmental Glomerulosclerosis. Sci. Rep. 2017, 7, 4095. [Google Scholar] [CrossRef] [PubMed]
- Zhu, C.; Huang, S.; Yuan, Y.; Ding, G.; Chen, R.; Liu, B.; Yang, T.; Zhang, A. Mitochondrial dysfunction mediates aldosterone-induced podocyte damage: A therapeutic target of PPARγ. Am. J. Pathol. 2011, 178, 2020–2031. [Google Scholar] [CrossRef] [PubMed]
- Granata, S.; Gassa, A.D.; Tomei, P.; Lupo, A.; Zaza, G. Mitochondria: A new therapeutic target in chronic kidney disease. Nutr. Metab. 2015, 12, 49. [Google Scholar] [CrossRef] [PubMed]
- Cummings, B.S.; Parker, J.C.; Lash, L.H. Role of cytochrome P450 and glutathione S-transferase alpha in metabolism and cytotixicty of trichlorethylene in rat kidney. Biochem. Pharmacol. 2000, 59, 531–543. [Google Scholar] [CrossRef]
- Taylor, D.; Bhandari, S.; Seymour, A.-M.L. Mitochondrial dysfunction in uremic cardiomyopathy. Am. J. Physiol. Physiol. 2015, 308, F579–F587. [Google Scholar] [CrossRef]
- Szeto, H.H. Pharmacologic Approaches to Improve Mitochondrial Function in AKI and CKD. J. Am. Soc. Nephrol. 2017, 28, 2856–2865. [Google Scholar] [CrossRef]
- Bigelman, E.; Cohen, L.; Aharon-Hananel, G.; Levy, R.; Rozenbaum, Z.; Saada, A.; Keren, G.; Entin-Meer, M. Pathological presentation of cardiac mitochondria in a rat model for chronic kidney disease. PLoS ONE 2018, 13, e0198196. [Google Scholar] [CrossRef]
- Chen, J.-F.; Liu, H.; Ni, H.-F.; Lv, L.-L.; Zhang, M.-H.; Zhang, A.-H.; Tang, R.-N.; Chen, P.-S.; Liu, B.-C. Improved Mitochondrial Function Underlies the Protective Effect of Pirfenidone against Tubulointerstitial Fibrosis in 5/6 Nephrectomized Rats. PLoS ONE 2013, 8, 8–83593. [Google Scholar] [CrossRef]
- Hetzel, D.; Strauss, W.; Bernard, K.; Li, Z.; Urboniene, A.; Allen, L.F. A Phase III, randomized, open-label trial of ferumoxytol compared with iron sucrose for the treatment of iron deficiency anemia in patients with a history of unsatisfactory oral iron therapy. Am. J. Hematol. 2014, 89, 646–650. [Google Scholar] [CrossRef] [PubMed]
- MacDougall, I.C.; Strauss, W.E.; McLaughlin, J.; Li, Z.; Dellanna, F.; Hertel, J. A randomized comparison of ferumoxytol and iron sucrose for treating iron deficiency anemia in patients with CKD. Clin. J. Am. Soc. Nephrol. 2014, 9, 705–712. [Google Scholar] [CrossRef] [PubMed]
- Schiller, B.; Bhat, P.; Sharma, A. Safety and Effectiveness of Ferumoxytol in Hemodialysis Patients at 3 Dialysis Chains in the United States Over a 12-Month Period. Clin. Ther. 2014, 36, 70–83. [Google Scholar] [CrossRef] [PubMed]
- Rogers, G.W.; Brand, M.D.; Petrosyan, S.; Ashok, D.; Elorza, A.A.; Ferrick, D.A.; Murphy, A.N. High Throughput Microplate Respiratory Measurements Using Minimal Quantities Of Isolated Mitochondria. PLoS ONE 2011, 6, e21746. [Google Scholar] [CrossRef]
- Seljeskog, E.; Hervig, T.; Mansoor, M.A. A novel HPLC method for the measurement of thiobarbituric acid reactive substances (TBARS). A comparison with a commercially available kit. Clin. Biochem. 2006, 39, 947–954. [Google Scholar] [CrossRef]
- Kand’Ár, R.; Žáková, P.; Lotková, H.; Kučera, O.; Červinková, Z.; Královcová, P. Determination of reduced and oxidized glutathione in biological samples using liquid chromatography with fluorimetric detection. J. Pharm. Biomed. Anal. 2007, 43, 1382–1387. [Google Scholar] [CrossRef]
- Paglia, D.E.; Valentine, W.N. Studies on the quantitative and qualitative characterization of erythrocyte glutathione peroxidase. J. Lab. Clin. Med. 1967, 70, 158–169. [Google Scholar]
- Stacchiotti, A.; Favero, G.; Giugno, L.; Lavazza, A.; Reiter, R.J.; Rodella, L.F.; Rezzani, R. Mitochondrial and Metabolic Dysfunction in Renal Convoluted Tubules of Obese Mice: Protective Role of Melatonin. PLoS ONE 2014, 9, e111141. [Google Scholar] [CrossRef]
- Smith, K.; Semple, D.; Aksentijević, D.; Bhandari, S.; Seymour, A.M. Functional and metabolic adaptation in uraemic cardiomyopathy. Front. Biosci. 2010, E2, 1492–1501. [Google Scholar] [CrossRef] [Green Version]
- Smith, K.; Semple, D.; Bhandari, S.; Seymour, A.M. The cellular basis of uraemic cardiomyopathy—A role of erythropoietin? Eur. J. Heart Fail. 2009, 11, 732–738. [Google Scholar] [CrossRef]
- Wang, X.H.; Mitch, W.E. Mechanisms of muscle wasting in chronic kidney disease. Nat. Rev. Nephrol. 2014, 10, 504–516. [Google Scholar] [CrossRef] [PubMed] [Green Version]
- Reddy, V.; Bhandari, S.; Seymour, A.M. Myocardial function, energy provision, and carnitine deficiency in experimental uremia. J. Am. Soc. Nephrol. 2007, 18, 84–92. [Google Scholar] [CrossRef] [PubMed]
- Auerbach, M.; Macdougall, I.C. Safety of intravenous iron formulations: Facts and folklore. Blood Transfus 2014, 12, 296–300. [Google Scholar] [PubMed]
- Agarwal, R.; Leehey, D.J.; Olsen, S.M.; Dahl, N.V. Proteinuria Induced by Parenteral Iron in Chronic Kidney Disease—A Comparative Randomized Controlled Trial. Clin. J. Am. Soc. Nephrol. 2011, 6, 114–121. [Google Scholar] [CrossRef] [PubMed]
- Del Vecchio, L.; Longhi, S.; Locatelli, F. Safety concerns about intravenous iron therapy in patients with chronic kidney disease. Clin. Kid 2016, 9, 260–267. [Google Scholar] [CrossRef] [PubMed] [Green Version]
- Agarwal, R.; Rizkala, A.; Kaskas, M.; Minasian, R.; Trout, J. Iron sucrose causes greater proteinuria than ferric gluconate in non-dialysis chronic kidney disease. Kidney Int. 2007, 72, 638–642. [Google Scholar] [CrossRef] [Green Version]
- Besarab, A.; Levin, A. Defining a renal anemia management period. Am. J. Kidney Dis. 2000, 36, S13–S23. [Google Scholar] [CrossRef]
- Bhandari, S.; Pereira, D.I.A.; Chappell, H.F.; Drakesmith, H. Intravenous Irons: From Basic Science to Clinical Practice. Pharmaceuticals 2018, 11, 82. [Google Scholar] [CrossRef]
- Besarab, A.; Coyne, D.W. Iron supplementation to treat anemia in patients with chronic kidney disease. Nat. Rev. Nephrol. 2010, 6, 699–710. [Google Scholar] [CrossRef]
- Mace, T.A.R.; Syed, A.; Bhandari, S. Iron (III) isomaltoside 1000. Expert Rev. Hematol. 2013, 6, 239–246. [Google Scholar] [CrossRef]
- Bhandari, S.; Kalra, P.A.; Kothari, J.; Ambühl, P.M.; Christensen, J.H.; Essaian, A.M.; Thomsen, L.L.; MacDougall, I.C.; Coyne, D.W. A randomized, open-label trial of iron isomaltoside 1000 (Monofer®) compared with iron sucrose (Venofer®) as maintenance therapy in haemodialysis patients. Nephrol. Dial. Transplant. 2015, 30, 1577–1589. [Google Scholar] [CrossRef] [PubMed]
- Kalra, P.A.; Bhandari, S.; Agarwal, D.; Wirtz, G.; Klauser-Braun, R.; Thomsen, L.L.; Coyne, D.W. A randomized trial of iron isomaltoside 1000 versus oral iron in non-dialysis-dependent chronic kidney disease patients with anaemia. Nephrol. Dial. Transplant. 2016, 31, 646–655. [Google Scholar] [CrossRef] [PubMed]
- Ottenjann, M.; Weingart, C.; Arndt, G.; Kohn, B. Characterization of the Anemia of Inflammatory Disease in Cats with Abscesses, Pyothorax, or Fat Necrosis. J. Veter- Intern. Med. 2006, 20, 1143–1150. [Google Scholar] [CrossRef]
- Wessling-Resnick, M. Iron homeostasis and the inflammatory response. Annu. Rev. Nutr. 2010, 30, 105–122. [Google Scholar] [CrossRef]
- Alfrey, A.C.; Hammond, W.S. Renal iron handling in the nephrotic syndrome. Kidney Int. 1990, 37, 1409–1413. [Google Scholar] [CrossRef] [PubMed] [Green Version]
- Nemeth, E.; Rivera, S.; Gabayan, V.; Keller, C.; Taudorf, S.; Pedersen, B.K.; Ganz, T. IL-6 mediates hypoferremia of inflammation by inducing the synthesis of the iron regulatory hormone hepcidin. J. Clin. Investig. 2004, 113, 1271–1276. [Google Scholar] [CrossRef] [Green Version]
- Wrighting, D.M.; Andrews, N.C. Interleukin-6 induces hepcidin expression through STAT3. Blood 2006, 108, 3204–3209. [Google Scholar] [CrossRef]
- Pietrangelo, A.; Dierssen, U.; Valli, L.; Garuti, C.; Rump, A.; Corradini, E.; Ernst, M.; Klein, C.; Trautwein, C. STAT3 Is Required for IL-6-gp130–Dependent Activation of Hepcidin In Vivo. Gastroenterology 2007, 132, 294–300. [Google Scholar] [CrossRef]
- Falzacappa, M.V.; Vujic, S.M.; Kessler, R.; Stolte, J.; Hentze, M.W.; Muckenthaler, M.U. STAT3 mediates hepatic hepcidin expression and its inflammatory stimulation. Blood 2007, 109, 353–358. [Google Scholar] [CrossRef]
- Naigamwalla, D.Z.; Webb, J.A.; Giger, U. Iron deficiency anemia. Can. Vet. J. 2012, 53, 250–256. [Google Scholar]
- Silverberg, D.S.; Wexler, D.; Blum, M.; Wollman, Y.; Sheps, D.; Iaina, A.; Schwartz, D.; Keren, G. The Interaction between Heart Failure, Renal Failure and Anemia – The Cardio-Renal Anemia Syndrome. Blood Purif. 2004, 22, 277–284. [Google Scholar] [CrossRef] [PubMed]
- Schwenk, M.H. Ferumoxytol: A New Intravenous Iron Preparation for the Treatment of Iron Deficiency Anemia in Patients with Chronic Kidney Disease. Pharmacother. J. Hum. Pharmacol. Drug Ther. 2010, 30, 70–79. [Google Scholar] [CrossRef] [PubMed]
- Vadhan-Raj, S.; Strauss, W.; Ford, D.; Bernard, K.; Boccia, R.; Li, J. Allen LFEfficacy and safety of IV ferumoxytol for adults with iron deficiency anemia previously unresponsive to or unable to tolerate oral iron. Am. J. Hematol. 2014, 89, 7–12. [Google Scholar] [CrossRef] [PubMed]
- Ganz, T.; Nemeth, E. Hepcidin and iron homeostasis. Biochim. Biophys. Acta 2012, 1823, 1434–1443. [Google Scholar] [CrossRef] [Green Version]
- Ghoti, H.; Rachmilewitz, E.A.; Simon-Lopez, R.; Gaber, R.; Katzir, Z.; Konen, E.; Kushnir, T.; Girelli, D.; Campostrini, N.; Fibach, E.; et al. Evidence for tissue iron overload in long-term hemodialysis patients and the impact of withdrawing parenteral iron. Eur. J. Haematol. 2012, 89, 87–93. [Google Scholar] [CrossRef]
- Singh, A.; Patel, T.; Hertel, J.; Bernardo, M.; Kausz, A.; Brenner, L. Safety of Ferumoxytol in Patients with Anaemia and CKD. Am. J. Kidney Dis. 2008, 52, 907–915. [Google Scholar] [CrossRef]
- Romeu, M.; Nogues, R.; Marcas, L.; Sánchez-Martos, V.; Mulero, M.; Martinez-Vea, A.; Mallol, J.; Giralt, M. Evaluation of oxidative stress biomarkers in patients with chronic renal failure: A case control study. BMC Res. Notes 2010, 3, 20. [Google Scholar] [CrossRef]
- Caimi, G.; Carollo, C.; Hopps, E.; Montana, M.; Presti, R.L. Protein oxidation in chronic kidney disease. Clin. Hemorheol. Microcirc. 2013, 54, 409–413. [Google Scholar] [Green Version]
- Floccari, F.; Aloisi, C.; Crasci, E.; Sofi, T.; Campo, S.; Tripodo, D.; Criseo, M.; Frisina, N.; Buemi, M. Oxidative stress in uremia. Med. Res. Rev. 2005, 25, 473–486. [Google Scholar] [CrossRef]
- Witko-Sarsat, V.; Friedlander, M.; Khoa, T.N.; Capeillère-Blandin, C.; Nguyen, A.T.; Canteloup, S.; Dayer, J.M.; Jungers, P.; Drüeke, T.; Descamps-Latscha, B. Advanced oxidation protein products as novel mediators of inflammation and monocyte activation in chronic renal failure. J. Immunol. 1998, 161, 2524–2532. [Google Scholar]
- Kao, M.P.C.; Ang, D.S.C.; Pall, A.; Struthers, A.D. Oxidative stress in renal dysfunction: Mechanisms, clinical sequelae and therapeutic options. J. Hum. Hypertens 2010, 24, 1–8. [Google Scholar] [CrossRef] [PubMed]
- Ganguli, A.; Kohli, H.S.; Khullar, M.; Gupta, K.L.; Jha, V.; Sakhuja, V. Lipid Peroxidation Products Formation with Various Intravenous Iron Preparations in Chronic Kidney Disease. Ren. Fail. 2009, 31, 106–110. [Google Scholar] [CrossRef] [PubMed] [Green Version]
- Sağlam, F.; Cavdar, C.; Uysal, S.; Cavdar, Z.; Camsari, T. Effect of Intravenous Iron Sucrose on Oxidative Stress in Peritoneal Dialysis Patients. Ren. Fail. 2007, 29, 849–854. [Google Scholar] [CrossRef] [PubMed]
- Zager, R.A.; Johnson, A.C.; Hanson, S.Y.; Wasse, H. Parenteral iron formulations. A comparative toxicologic analysis and mechanisms of cell injury. Am. J. Kidney Dis. 2002, 40, 90–103. [Google Scholar] [CrossRef] [PubMed]
- Bailie, G.R.; Schuler, C.; Leggett, R.E.; Li, H.-D.; Patadia, H.; Levin, R. Oxidative effect of several intravenous iron complexes in the rat. BioMetals 2013, 26, 473–478. [Google Scholar] [CrossRef]
- Agarwal, R.; Vasavada, N.; Sachs, N.G.; Chase, S. Oxidative stress and renal injury with intravenous iron in patients with chronic kidney disease. Kidney Int. 2004, 65, 2279–2289. [Google Scholar] [CrossRef] [Green Version]
- Kuo, K.-L.; Hung, S.-C.; Lee, T.-S.; Tarng, D.-C. Iron Sucrose Accelerates Early Atherogenesis by Increasing Superoxide Production and Upregulating Adhesion Molecules in CKD. J. Am. Soc. Nephrol. 2014, 25, 2596–2606. [Google Scholar] [CrossRef] [Green Version]
- Boudina, S.; Sena, S.; Theobald, H.; Sheng, X.; Wright, J.J.; Hu, X.X.; Aziz, S.; Johnson, J.I.; Bugger, H.; Zaha, V.G.; et al. Mitochondrial Energetics in the Heart in Obesity-Related Diabetes: Direct Evidence for Increased Uncoupled Respiration and Activation of Uncoupling Proteins. Diabetes 2007, 56, 2457–2466. [Google Scholar] [CrossRef]
- Fink, B.D.; Herlein, J.A.; Almind, K.; Cinti, S.; Kahn, C.R.; Sivitz, W.I. Mitochondrial proton leak in obesity-resistant and obesity-prone mice. Am. J. Physiol. Integr. Comp. Physiol. 2007, 293, R1773–R1780. [Google Scholar] [CrossRef]
- Bhargava, P.; Schnellmann, R.G. Mitochondrial energetics in the kidney. Nat. Rev. Nephrol. 2017, 13, 629–646. [Google Scholar] [CrossRef]
- Che, R.; Yuan, Y.; Huang, S.; Zhang, A. Mitochondrial dysfunction in the pathophysiology of renal diseases. Am. J. Physiol. Physiol. 2014, 306, F367–F378. [Google Scholar] [CrossRef]
- Liu, S.; Soong, Y.; Seshan, S.V.; Szeto, H.H. Novel cardiolipin therapeutic protects endothelial mitochondria during renal ischemia and mitigates microvascular rarefaction, inflammation, and fibrosis. Am. J. Physiol. Physiol. 2014, 306, F970–F980. [Google Scholar] [CrossRef] [PubMed] [Green Version]
- Lan, R.; Geng, H.; Singha, P.K.; Saikumar, P.; Böttinger, E.P.; Weinberg, J.M.; Venkatachalam, M.A. Mitochondrial Pathology and Glycolytic Shift during Proximal Tubule Atrophy after Ischemic AKI. J. Am. Soc. Nephrol. 2016, 27, 3356–3367. [Google Scholar] [CrossRef] [PubMed]
- Ren, X.; Zou, L.; Zhang, X.; Branco, V.; Wang, J.; Carvalho, C.; Holmgren, A.; Lu, J. Redox Signaling Mediated by Thioredoxin and Glutathione Systems in the Central Nervous System. Antioxid. Redox Signal. 2017, 27, 989–1010. [Google Scholar] [CrossRef] [PubMed]
- Pope, S.; Land, J.M.; Heales, S.J. Oxidative stress and mitochondrial dysfunction in neurodegeneration: Cardiolipin a critical target? Biochim. Biophys. Acta 2008, 1777, 794–799. [Google Scholar] [CrossRef] [PubMed]
- Petrosillo, G.; Moro, N.; Ruggiero, F.M.; Paradies, G. Melatonin inhibits cardiolipin peroxidation in mitochondria and prevents the mitochondrial permeability transition and cytochrome c release. Free Radic. Boil. Med. 2009, 47, 969–974. [Google Scholar] [CrossRef] [PubMed]
- Brooks, C.; Wei, Q.; Cho, S.G.; Dong, Z.I. Regulation of mitochondrial dynamics in acute kidney injury in cell culture and rodent models. J. Clin. Investig. 2009, 119, 1275–1285. [Google Scholar] [CrossRef]
- Zhan, M.; Usman, I.M.; Sun, L.; Kanwar, Y.S. Disruption of renal tubular mitochondrial quality control by Myo-inositol oxygenase in diabetic kidney disease. J. Am. Soc. Nephrol. 2015, 26, 1304–1321. [Google Scholar] [CrossRef]
- Bayir, H.; Fadeel, B.; Palladino, M.J.; Witasp, E.; Kurnikov, I.V.; Tyurina, Y.Y.; Tyurin, V.A.; Amoscato, A.A.; Jiang, J.; Kochanek, P.M.; et al. Apoptotic interactions of cytochrome c: Redox flirting with anionic phospholipids within and outside of mitochondria. Biochim. Biophys. Acta 2006, 1757, 648–659. [Google Scholar] [CrossRef] [Green Version]


| Characterisation of Uraemic model in CKD at week 12 | ||||
|---|---|---|---|---|
| Untreated (n = 22) | Iron Treated (n = 12) | |||
| Sham | Uraemic | Sham | Uraemic | |
| Weight gain over 12 weeks (g) | 301.5 ± 11.5 | 301.0 ± 13.7 | 297.4 ± 14.6 | 303.3 ± 12.8 |
| Serum | ||||
| Creatinine (µM) | 38.43 ± 1.73 | 86.32 ± 4.09 * | 50.32 ± 1.65 | 76.11 ± 2.86 *ǂ |
| Urea (mM) | 10.81 ± 0.94 | 20.83 ± 1.60 * | 8.70 ± 0.31 | 20.68 ± 1.79 * |
| Total protein (g/dL) | 5.60 ± 0.14 | 5.13 ± 0.14 * | 6.67 ± 0.22 | 6.67 ± 0.08 ǂ |
| 24 h Urinary | (n = 9) | (n = 9) | (n = 5) | (n = 5) |
| Total Protein (g/L) | 1.44 ± 0.17 | 2.89 ± 0.31 * | 1.39 ± 0.11 | 2.97 ± 0.30 * |
| Creatinine (mM) | 17.02 ± 1.27 | 11.61 ± 1.08 * | 18.41 ± 3.74 | 9.21 ± 1.01 *ǂ |
| Total volume (mL) | 14.33 ± 1.75 | 23.75 ± 2.68 * | 16.40 ± 2.16 | 21.6 ± 2.86 * |
| GFR (ml/min/Kg body weight) | 7.86 ± 0.84 | 3.96 ± 1.03 * | 7.53 ± 0.97 | 3.22 ± 0.76 * |
| Anaemia Characterisation at week 12 | ||||
|---|---|---|---|---|
| Untreated (n = 22) | Iron Treated (n = 12) | |||
| Sham | Uraemic | Sham | Uraemic | |
| Serum | ||||
| TIBC (µM) | 29.46 ± 0.83 | 26.43 ± 0.72 * | 33.55 ± 1.16 | 29.09 ± 0.79 *ǂ |
| Ferritin (n = 8) (µM) | 0.12 ± 0.03 | 0.13 ± 0.03 | 0.12 ± 0.01 | 0.11 ± 0.03 |
| Iron (n = 11) (µM) | 46.38 ± 1.44 | 31.11 ± 1.80 * | 32.82 ± 0.97 | 28.89 ± 1.65 |
| Packed cell volume | 0.58 ± 0.02 | 0.50 ± 0.01 * | 0.57 ± 0.01 | 0.54 ± 0.03 |
| Tissue Iron (n = 7) (micromole/g of tissue) | ||||
| Liver stores | 2.91 ± 0.22 | 3.26 ± 0.18 | 3.57 ± 0.27 | 4.72 ± 0.20 |
| Liver (non-bound) | 0.34 ± 0.03 | 0.38 ± 0.02 | 0.34 ± 0.02 | 0.31 ± 0.00*ǂ |
| Kidney | 2.00 ± 0.27 | 1.90 ± 0.10 | 1.90 ± 0.08 | 2.77 ± 0.40 |
| Heart (×10−3) (total) | 1.57 ± 0.07 | 1.85 ± 0.18 | 1.40 ± 0.07 | 1.55 ± 0.07 |
| Heart (×10−3) (non-bound) | 0.30 ± 0.02 | 0.33 ± 0.02 | 0.26 ± 0.03 | 0.26 ± 0.02 ǂ |
© 2019 by the authors. Licensee MDPI, Basel, Switzerland. This article is an open access article distributed under the terms and conditions of the Creative Commons Attribution (CC BY) license (http://creativecommons.org/licenses/by/4.0/).
Share and Cite
Nuhu, F.; Seymour, A.-M.; Bhandari, S. Impact of Intravenous Iron on Oxidative Stress and Mitochondrial Function in Experimental Chronic Kidney Disease. Antioxidants 2019, 8, 498. https://doi.org/10.3390/antiox8100498
Nuhu F, Seymour A-M, Bhandari S. Impact of Intravenous Iron on Oxidative Stress and Mitochondrial Function in Experimental Chronic Kidney Disease. Antioxidants. 2019; 8(10):498. https://doi.org/10.3390/antiox8100498
Chicago/Turabian StyleNuhu, Faisal, Anne-Marie Seymour, and Sunil Bhandari. 2019. "Impact of Intravenous Iron on Oxidative Stress and Mitochondrial Function in Experimental Chronic Kidney Disease" Antioxidants 8, no. 10: 498. https://doi.org/10.3390/antiox8100498