Communication

Fatty Acids Predominantly Affect Anti-Hydroxyl Radical Activity and FRAP Value: The Case Study of Two Edible Mushrooms

1
Department of Biology and Ecology – DBE, Faculty of Sciences – PMF, University of Novi Sad, Trg Dositeja Obradovića 2, 21000 Novi Sad, Serbia
2
Institute of Physiology and Biochemistry, Faculty of Biology, University of Belgrade, Studentski trg 16, 11158 Belgrade, Serbia
3
Institute for Food Technology – FINS, Bulevar cara Lazara 1, 21000 Novi Sad, Serbia
4
Department of Chemistry, Biochemistry and Environmental Protection, Faculty of Sciences – PMF, University of Novi Sad, Trg Dositeja Obradovića 3, 21000 Novi Sad, Serbia
5
Department of Life Sciences, Institute for Multidisciplinary Research – IMSI, University of Belgrade, Kneza Višeslava 1, 11030 Belgrade, Serbia
*
Authors to whom correspondence should be addressed.
These two authors equally contributed to the performed study.
Antioxidants 2019, 8(10), 480; https://doi.org/10.3390/antiox8100480
Submission received: 1 September 2019 / Revised: 20 September 2019 / Accepted: 21 September 2019 / Published: 12 October 2019

Abstract

:
Compared to plants, nowadays mushrooms attract more attention as functional foods, due to a number of advantages in manipulating them. This study aimed to screen the chemical composition (fatty acids and phenolics) and antioxidant potential (OH•, 2,2-diphenyl-1-picrylhydrazyl (DPPH•) and ferric reducing ability of plasma (FRAP)) of two edible mushrooms, Coprinus comatus and Coprinellus truncorum, collected from nature and submerged cultivation. Partial least square regression analysis has pointed out the importance of some fatty acids—more precisely, unsaturated fatty acids (UFAs) followed by fatty acids possessing both short (C6:0 and C8:0) and long (C23:0 and C24:0) saturated chains—and phenolic compounds (such as protocatechuic acid, daidzein, p-hydroxybenzoic acid, genistein and vanillic acid) for promising anti-OH•, FRAP and anti-DPPH• activities, respectively. However, other fatty acids (C16:0, C18:0 and C18:3n3) along with the flavonol isorhamnetin are actually suspected to negatively affect (by acting pro-oxidative) the aforementioned parameters, respectively. Taken together, design of new food supplements targeting oxidative stress might be predominantly based on the various UFAs combinations (C18:2n6, C20:1, C20:2, C20:4n6, C22:2, C22:1n9, etc.), particularly if OH• is suspected to play an important role.

1. Introduction

Antioxidant activity (AO) is considered to be an important feature of edible mushrooms in the prevention of oxidative stress [1,2,3]. Their antioxidants may well contribute to maintaining their physiological balance by neutralisation of free radicals (with stress on reactive oxygen species), without toxic or mutagenic effects, as opposed to synthetic antioxidants [3,4]. Generally speaking, it is believed that phenolics are primarily responsible for AO [1,5,6]. These compounds may originate either from fruiting bodies (generative structures) or from mycelia and extracellular broth (i.e., from the filtrate of a submerged culture, vegetative structures) [7]. Submerged cultivation of macrofungi represents a biotechnological process for their growth under controlled conditions aiming to provide valuable biomass and extracellular metabolites [8]. The medium composition, pH, temperature and aeration are of crucial importance for expressing fungal biopotential in submerged cultivation [9]. Similarly, biopotential of the shoots from nature is affected by habitat and growth stage [1,10,11]. The edible mushrooms Coprinus comatus and Coprinellus truncorum are widely distributed in Asia, Europe and America. They are both considered as well-balanced nutraceuticals [7,12,13,14,15,16,17]. Thus, we aimed to screen the AO of their methanolic extracts under in vitro conditions, versus chemical composition (fatty acids and phenolics), using both shoots from nature (i.e., fruiting body (FB)) and submerged cultivation (cultured mycelium (M) and fermentation broth (filtrate F)).

2. Materials and Methods

2.1. Biological Material

Wild growing Coprinus comatus (O.F. Müll.) Pers. 1797 (Ph. Basidiomycota, Cl. Agaricomycetes, O. Agaricales, Fam. Agaricaceae) was sampled at meadow near Sremski Karlovci (town in Northern Serbia), while Coprinellus truncorum (Scop.) Redhead, Vilgalys & Moncalvo 2001 (Ph. Basidiomycota, Cl. Agaricomycetes, O. Agaricales, Fam. Psathyrellaceae) was collected at grassland in Novi Sad (town in Northern Serbia). The relevant voucher specimens (12-00704 and 12-00705 for C. comatus and C. truncorum, respectively) were deposited at the Herbarium of the Department of Biology and Ecology – DBE, Faculty of Sciences – PMF, University of Novi Sad. Finally, mycelia isolated from the FB of both species and cultivated at 26 °C, for 10 days, on Malt Agar (Torlak, Serbia), were deposited in the culture collection of the ProFungi Laboratory (Department of Biology and Ecology – DBE, Faculty of Sciences – PMF, University of Novi Sad).

2.2. Submerged Cultivation and Preparation of Extracts

After cultivation on Malt Agar, 5 plugs of isolated mycelia were transferred into 100 mL of fermentation broth that contained 5 g peptone, 35 g glucose, 5 g yeast extract, 1 g K2HPO4, 0.5 g MgSO4·7H2O and 0.05 g vitamin B, at pH 6.51. After incubation on a rotary shaker at 100 rpm, 26 °C, for 14 days (IKA KS 4000i control, Werke GmbH & Co.KG, Staufen, Germany), the biomass was filtrated (Fioroni Filter, AHLSTROM Group, Ingré, France). Afterwards, both the mycelia biomass and filtrate were lyophilised to dryness (CHRIST ALPHA 2-4 LDplus, Freeze Dryer, Martin Christ Gefriertrocknungsanalgen GmbH, Osterode am Harz, Germany). All extracts from the both species (FB, M and F) were prepared as previously described [1].

2.3. Determination of Antioxidant Activity

AO of the examined extracts was assessed by following in vitro spectrophotometric assays: anti-2,2-diphenyl-1-picrylhydrazyl (anti-DPPH) radical activity (DPPH assay), anti-hydroxyl (anti-OH) radical activity (OH assay) and ferric reducing ability of plasma (FRAP assay). All assays were performed in triplicate, while the results were expressed as the mean values ± standard deviations.

2.4. DPPH Assay

Anti-DPPH radical activity of the extracts was determined as previously described [18]. 2,2-Diphenyl-1-picrylhydrazyl (DPPH) was from Fluka Chemie (Fluka Chemie GmBH, Buchs, Switzerland). The reaction mixture contained 60 μL of 90 μM DPPH, 180 μL methanol and 10 μL of the relevant mushroom extract. After incubation (for 30 min in the dark, at room temperature), the absorption was measured at 515 nm (Multiscan, Thermo Scientific, Waltham, MA, USA). The results were expressed as IC50 values (μg/mL) obtained from the calculated RSC (Radical Scavenging Capacity) values, by following formula:
RSC (DPPH) (%) = (1 − Asample/Acontrol) × 100%
where Asample and Acontrol stand for the absorbance of the tested and control samples, respectively. A lower IC50 value corresponds to higher AO of the sample.

2.5. OH Assay

Anti-OH radical activity was determined according to a modified method of Halliwell and Gutteridge [19]. The reaction mixture contained 100 μL H2O2, 100 μL FeSO4, 100 μL 2-deoxyribose-D-ribose, 2.7 mL of phosphate buffer pH 7.4 and 10 μL of the each extract. After incubation (60 min at 37 °C), 0.2 mL of EDTA (ethylenediaminetetraacetic Acid) and 2 mL of TBA reagent (5.2 mL perchloric acid, 1.5 g thiobarbituric acid and 60 g of trichloroacetic acid) were added. Afterwards, the absorbance of a characteristic pink complex was measured at 532 nm. Finally, the results were expressed as IC50 values ± standard deviations (μg/mL).

2.6. FRAP Assay

Ferric reducing ability of plasma (FRAP) was evaluated by a spectrophotometric assay as previously described [20]. The reaction mixture contained 225 μL of FRAP reagent (10 mmol/L TPTZ solution in 40 mmol/L HCl, 0.02 mmol/L FeCl3·6H2O and acetate buffer (pH 3.6), in a ratio 10:1:1), 22.5 μL of distilled water and 10 μL of each extract. After 6 min of incubation, the absorbance was measured, while reduction potential was calculated as milligrams of ascorbic acid equivalents (AAE) per gram of dry weight (mg AAE/g d.w.), calculated according to the standard calibration curve of ascorbic acid solution.

2.7. Determination of Phenolic Compounds by HPLC-MS/MS Analysis

This chemical analysis was done applying the method of Orčić et al. [21]. All extracts were diluted with mobile phase solvents A (water) and B (methanol), premixed in 1:1 ratio, to obtain a final concentration of 2 mg/mL. Reference standards of the phenolic compounds were obtained from Sigma-Aldrich Chem (Steinheim, Germany), Fluka Chemie gmbh (Buchs, Switzerland) or from ChromaDex (ChromaDex Corp., Santa Ana, CA, USA). HPLC gradient grade methanol was purchased from J. T. Baker (Deventer, The Netherlands), and p.a. formic acid and DMSO from Merck (Darmstadt, Germany). A total of 15 working standards, ranging from 1.53 ng/mL to 2.50 × 10⁴ ng/mL, were prepared by serial 1:1 dilutions of the standard mixture with solvents A and B (1:1). Samples and standards were analysed using Agilent Technologies 1200 Series high-performance liquid chromatograph coupled with Agilent Technologies 6410A Triple Quad tandem mass spectrometer with electrospray ion source (Agilent Technologies, Inc., Santa Clara, CA, USA), and controlled by Agilent Technologies MassHunter Workstation software – Data Acquisition (ver. B.03.01, Agilent Technologies, Inc., Santa Clara, CA, USA). First, 5 µL were injected into the system. Afterwards, compounds were separated on Zorbax Eclipse XDB-C18 (50 mm × 4.6 mm, 1.8 µm, Agilent Technologies, Inc., Santa Clara, CA, USA) rapid resolution column held at 50 °C. Mobile phase was delivered at flow rate of 1 mL/min in gradient mode (0 min 30% B, 6 min 70% B, 9 min 100% B, 12 min 100% B, re-equilibration time 3 min). Eluted compounds were detected by ESI-MS, using the ion source parameters as follows: nebulisation gas (N2) pressure 40 psi, drying gas (N2) flow 9 L/min and temperature 350 °C, capillary voltage 4 kV, negative polarity. Data were acquired in dynamic MRM mode, using the optimised compound-specific parameters (retention time, precursor ion, product ion, fragmentor voltage, collision voltage) as reported by Orčić et al. [21]. For all the compounds, peak areas were determined using Agilent MassHunter Workstation software – Qualitative Analysis (ver. B.04.00, Agilent Technologies, Inc., Santa Clara, CA, USA). Briefly, calibration curves were plotted in the OriginLabs Origin Pro (ver. 8.0) software (Northampton, MA, USA). Limit of detection (LoD) was estimated as the lowest concentration resulting in well-defined peak [21].

2.8. GC-MS Identification and Quantification of Fatty Acids

This chemical analysis was also performed as previously described [22]. As a solvent, n-heptane was used, along with the evaporation in the nitrogen stream. The prepared samples were analysed on a GC Agilent 7890A system (Agilent Technologies, Santa Clara, CA, USA) equipped with a Flame Ionisation Detector (FID) and an auto-injecting liquid system on a capillary column of mixed silica (Supelco SP-2560 Capillary GC Column, 100 m × 0.25 mm, d = 0.20 μm, Merck KGaA, Darmstadt, Germany). The gas carrier was helium of purity of 99.9997%, at a flow rate of 1.5 mL/min and a pressure of 1.092 bar. The samples were injected in a column in split mode in the ratio 30:1. The applied temperatures ranged from 40 to 230 °C. Total time of analysis was 41.311 min. Fatty acid methyl ester peaks were identified by comparing retention times (RI) from RI samples of the Supelco 37 component fatty acid methyl ester mix standard as well as by the internal data obtained in the pre-assay of fatty acids in a GC with a mass detector. The obtained results were expressed as the mass of the individual fatty acid or group of fatty acids (g) in 100 g of fatty acids from the biological material.

2.9. Statistical Analysis

All measurements were performed in triplicate. The results were expressed as the mean values ± standard deviations. IC50 values were obtained by interpolation from a linear regression analysis using OriginLabs Origin Pro (ver. 8.0) software. One-way analysis of variance (ANOVA) with Tukey’s test was used to determine the statistically significant difference between the analysed extracts (p < 0.01). The strength of association between pairs of variables was measured with the Pearson product moment correlation at a 5% level of significance (p < 0.05). Partial Least Squares Regression (PLSR) was applied for multivariate analysis (XLSTAT statistical and data analysis solution, Addinsoft 2019, Boston, MA, USA).

3. Results and Discussion

3.1. Anti-DPPH Radical Activity

The submerged mushroom extracts of both species were more potent compared to FB extracts (Table 1). In comparison, C. comatus FB ethanolic extract exhibited much lower anti-DPPH radical activity (IC50 2.56 ± 0.31 mg/mL) [13]. The similar case is with the polysaccharide extract of C. comatus FB [23]. Furthermore, C. comatus FB methanolic extract originating from Lipovica Forest near Belgrade (Serbia) did show a neglected activity (IC50 3.76 ± 0.48 mg/mL) [14], compared to the one reported herein (IC50 172.74 ± 7.10 µg/mL) for C. comatus FB methanolic extract. Also, two submerged cultivated C. comatus mycelial isolates, namely C. comatus 906 and C. comatus 1021, exhibited by far lower activities (EC50 values 1.1 ± 0.2 and 2.2 ± 0.3 mg/mL, and 2.6 ± 0.4 and 3.5 ± 0.4 mg/mL for water and ethanolic extracts, respectively) [23], though both strains were cultivated practically under the same conditions as reported herein.

3.2. Anti-OH Radical Activity

C. truncorum FB extract, the sample displaying the most potent anti-OH radical activity, was followed by C. comatus FB extract (Table 1). In comparison, C. comatus FB extract (collected in China) had much lower activity (3.23 ± 0.28 mg/mL) [5].

3.3. FRAP Value

Once again FB extracts were more effective. The most profound FRAP value was recorded for C. comatus FB extract. A number of other mushroom species including Xylaria polymorpha (3.25 ± 0.04 mg AAE/g d.w.), Meripilus giganteus (10.45 ± 0.44 mg AAE/g d.w.) and Agrocybe aegerita (10.74 ± 0.09 mg AAE/g d.w.) exhibited lower FRAP values [1]. Generally speaking, differences in the antioxidant potential of different samples were clearly observed; some of the tested samples were actually proven to be more effective compared to the methanolic extracts of some previously analysed species [1,2,5,14,23].

3.4. HPLC-MS/MS Determination of Phenolic Compounds

Following HPLC-MS/MS procedure optimised for the quantification of 45 phenolics, 28 compounds were identified in the tested samples (Table 2). p-Hydroxybenzoic acid was the most abundant compound, followed by quinic acid. Both phenolics are known as good antioxidants, due to their reducing properties (depending on hydrogen or electron donors) and ability to stabilise the unpaired electron [24,25]. In addition to this, protocatechuic acid was also found in all the samples, with notably greater amount in the submerged extracts, with stress on C. comatus F extract. Both in vitro and in vivo designed studies have clearly pointed out that protocatechuic acid may be considered as effective antioxidant, even more potent than trolox, a synthetic vitamin E analog [26,27,28]. Furthermore, cinnamic acid was detected in the most of the extracts (except C. truncorum M extract). On the other hand, the isoflavonoids daidzein and genistein, also proven antioxidants [29,30,31], were detected only in the submerged cultures. Finally, vanillic acid, another antioxidant of natural origin [32,33], was identified only in the submerged extracts.

3.5. GC-MS Analysis

Gas Chromatography–Mass Spectrometry (GC-MS) was used to analyse the contents of fatty acids. A total of 28 fatty acids were identified in the screened extracts (Table 3). The content of total unsaturated fatty acids (UFAs), mono-unsaturated fatty acids (MUFAs), poly-unsaturated fatty acids (PUFAs) and saturated fatty acids (SFAs) revealed that UFAs were most abundant ones. The same fatty acids are recommended as high-quality ingredients of a healthy diet, inter alia, capable of decreasing blood lipids [13,16,17]. In the majority of the analysed samples (except C. truncorum F extract), linoleic acid (C18:2n6c) was the most common one. Additionally, oleic fatty acid (C18:1n9c) was present in all the samples.
These findings are in a good agreement with literature data [13,14,15,34,35]. However, no one has previously reported C. truncorum FB fatty acid profile, to the best of our knowledge. The aforementioned profile is somewhat similar to C. micaceus fatty acid profile [36].
Also, these are real pioneering data for the both mushrooms samples developed in the submerged cultivation. Furthermore, it’s noteworthy to mention that FB extracts contained more UFAs and PUFAs, compared to the rest of samples (Table 3). Thus far, UFA content has been linked with AO increase [37]. On the other hand, PUFAs have been claimed to modulate the activity of antioxidant enzymes. However, their AO cannot be easily predicted, since it doesn’t depend on the length of the carbon chain and/or degree of unsaturation [17].

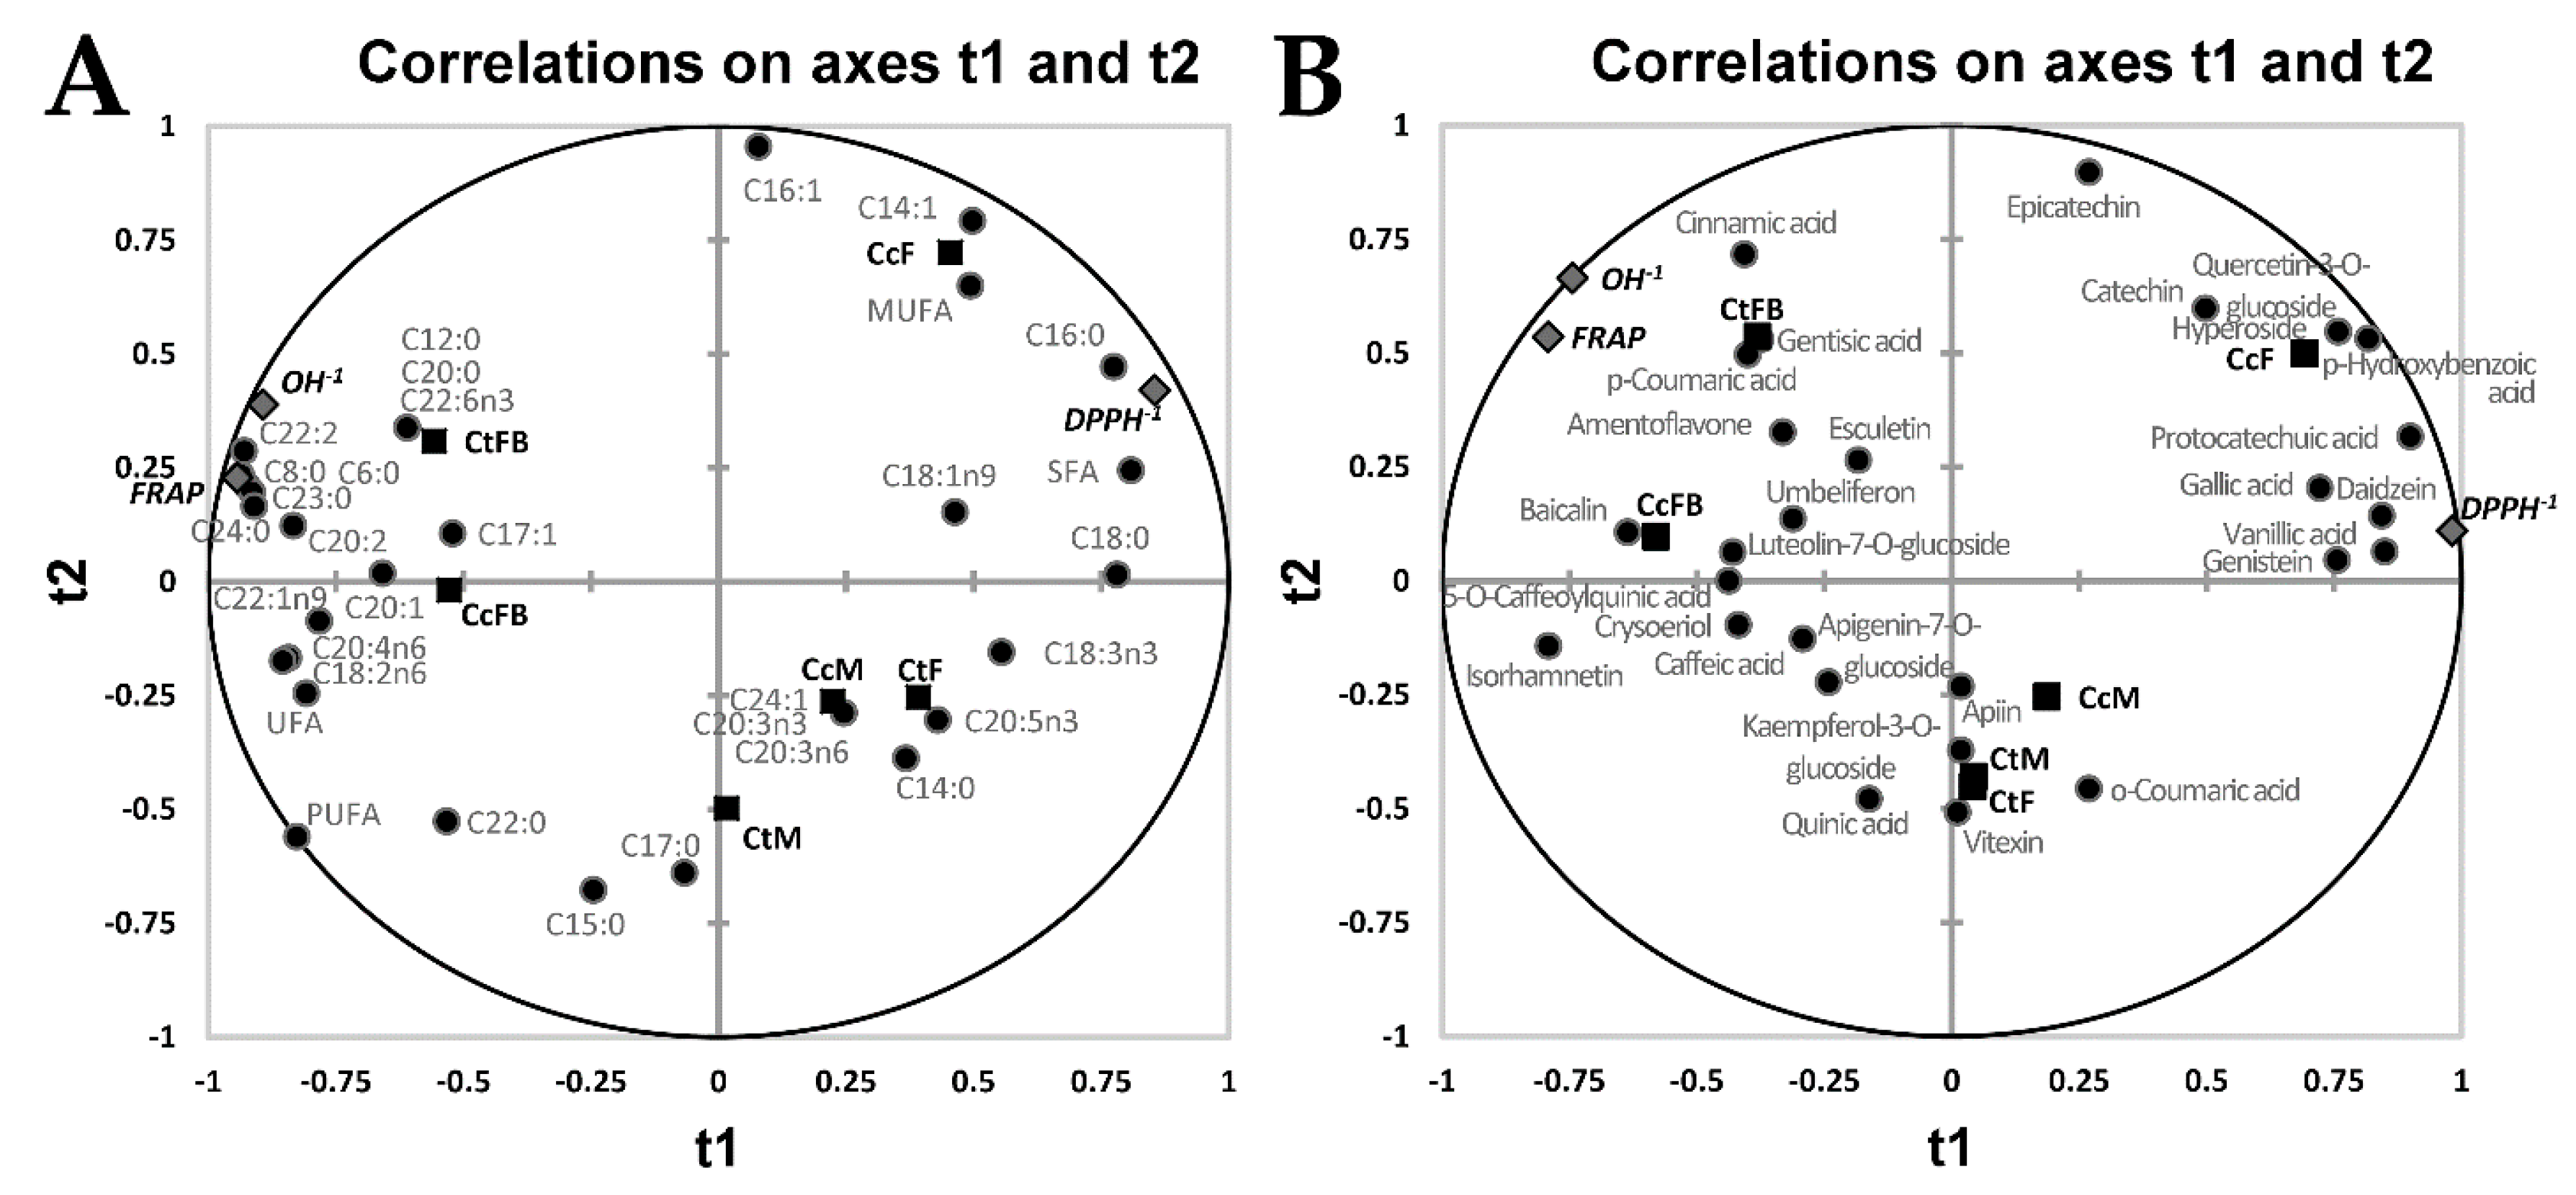
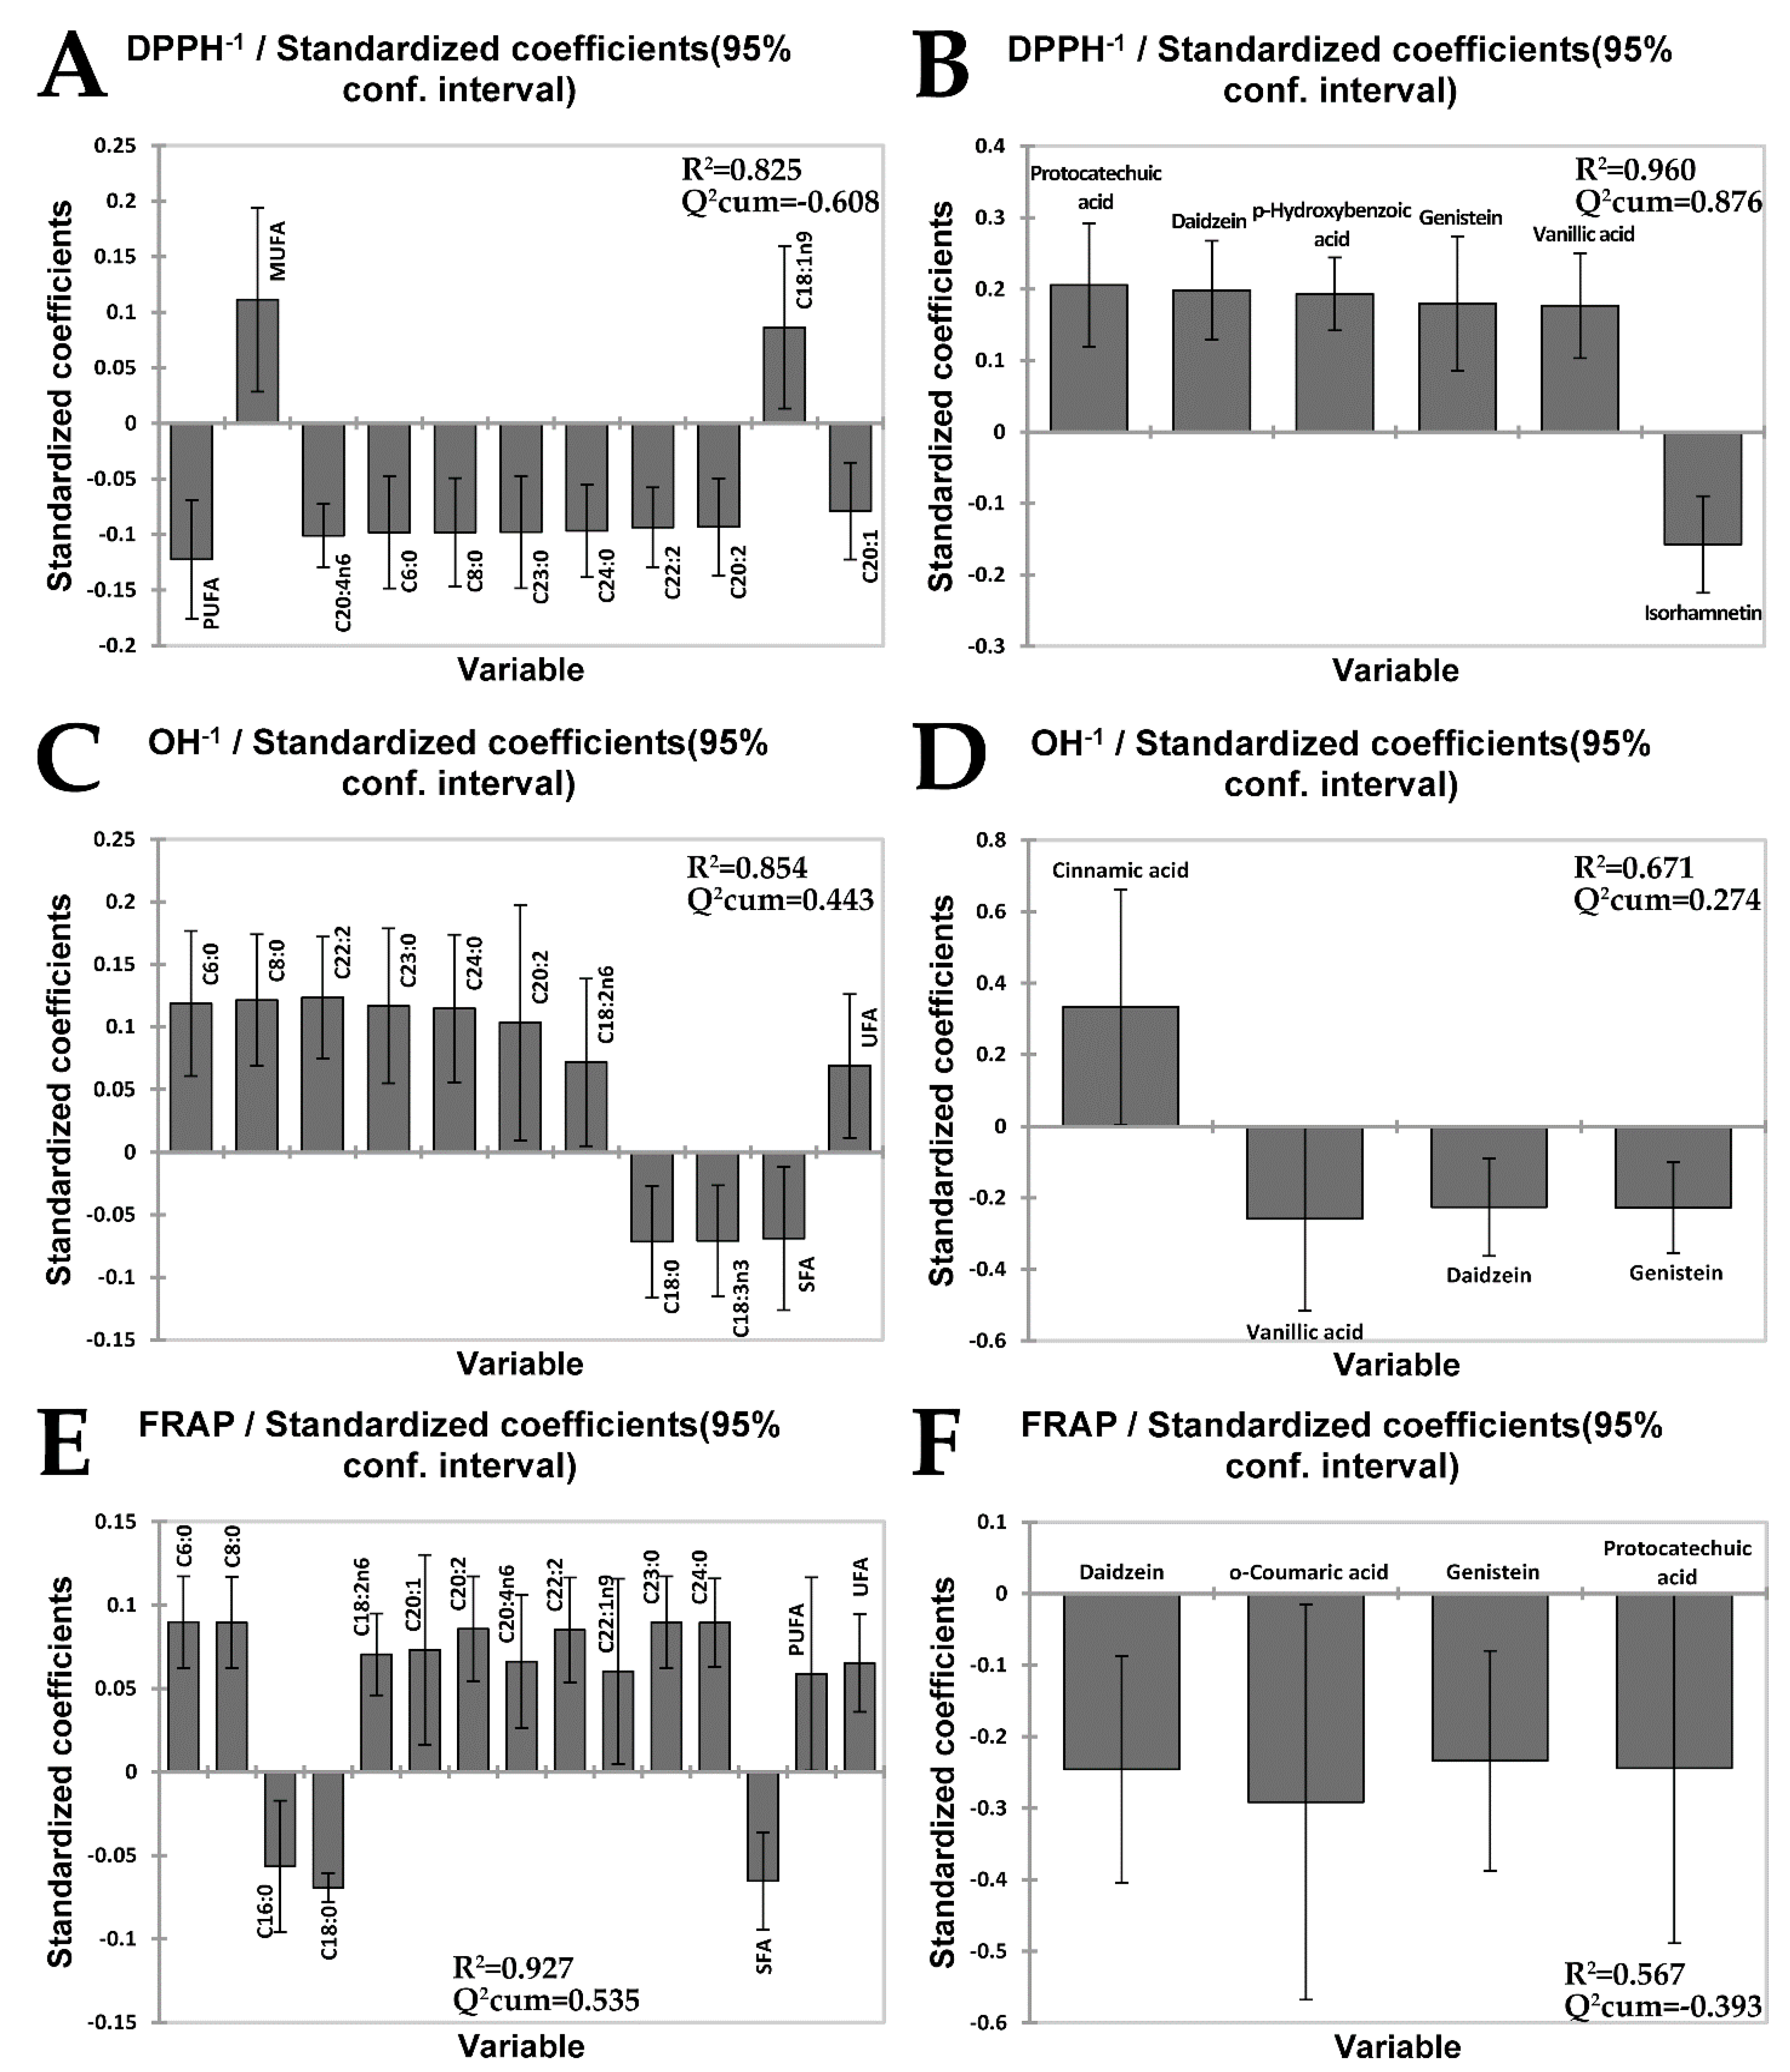
3.6. Partial Least Squares Regression (PLSR) Analysis

Partial least squares regression (PLSR) analysis was used to define the possible interrelationships between the chemical composition (based on their phenolic (Table 2) and fatty acid (Table 3) profiles) (independent variables, X) and AO activity (DPPH•, OH• and FRAP, dependent variables, Y; reciprocal values of IC50 for anti-DPPH and anti-OH radical activities, Table 1) of the analysed methanolic extracts. Firstly, PLSR was performed for all three AO measures, resulting in the correlation circles between the extracts, their fatty acid (Figure 1A) or phenolic (Figure 1B) profile and AO measures, with first two PLSR components (t1, t2). Although the global R2 between Y and (t1, t2) (which gives an upper bound of how well the model explains the data and predicts new observations) is slightly higher for the phenolic profile (0.962), compared to the fatty acid one (0.934), the quality of the former regression is lower since R2 resulting from the cross-validation (Q2cum), that defines the stability of the model and sets the lower bound of how well the model explains the data [38], is 0.389, compared to 0.686 for the fatty acid profile. Figure 1 shows that all dependent variables are located at the periphery of the correlation circle meaning that can be explained by the concentrations of fatty acid or phenolic compounds located either in their vicinity (e.g., C22:2 or cinnamic acid, in the case of OH•) exhibiting a positive (antioxidative) influence, or opposite to them (e.g., C18:3n3 or vanillic acid, in the case of OH•) displaying a negative (pro-oxidative) one.
Although the correlation circle is useful for gaining the overall picture, it actually doesn’t indicate (specify) which combination of fatty acid or phenolic compounds has statistically significant influence on the specific measure of AO activity of the analysed mushrooms extracts. In order to estimate this, a separate one-component PLSR model was built for each dependent variable. The models were then pruned until all variables with insignificant standardised regression coefficients (confidence intervals include 0) were deleted. Bar graphs of the regression coefficients for all three models are shown in Figure 2. Upwards and downwards pointing bars indicate positive (antioxidative) and negative (pro-oxidative) influences, respectively. Comparison of R2 and Q2cum values clearly pointed out that AO activity of the extracts measured by FRAP assay was much better explained by PLSR model based on their fatty acid profiles (Figure 2E, R2 = 0.927, Q2cum = 0.535) versus the phenolic ones (Figure 2F, R2 = 0.567, Q2cum = −0.393). Practically, entire variability (92.7%) in the AO activity of the extracts measured by FRAP assay can be explained by coordinated antioxidative potential of unsaturated fatty acids (UFAs) (C18:2n6, C20:1, C20:2, C20:4n6, C22:2 and C22:1n9) followed by short (C6:0 and C8:0) or long (C23:0 and C24:0) chain saturated fatty acids (SFAs). Since palmitic and stearic acids were by far most abundant SFAs, SFAs generally may be linked with pro-oxidative action, unlike UFAs and PUFAs (Figure 2E). Similarly to FRAP, anti-OH radical activity of the extracts is also much better explained by PLSR model based on their fatty acid profiles (Figure 2C, R2 = 0.854, Q2cum = 0.443), compared to the phenolic ones (Figure 2D, R2 = 0.671, Q2cum = 0.274). Such a trend is actually expected due to a strong correlation between FRAP and OH• values (R = 0.932, p = 0.007), that is confirmed by their close position at the correlation circle (Figure 1A), too. In fact, due to such a tight correlation, OH• PLSR model is essentially based on the identical fatty acids as FRAP PLSR model (Figure 2C). Contrary to FRAP and OH assays, the PLSR model based on the phenolic profiles of the extracts (Figure 2B, R2 = 0.960, Q2cum = 0.876) much better explains their anti-DPPH radical activity, compared to the model based on the fatty acid profiles (Figure 2A, R2 = 0.825, Q2cum = −0.608). Protocatechuic acid, daidzein, p-hydroxybenzoic acid, genistein and vanillic acid are phenolics suspected to primarily contribute to anti-DPPH radical activity, unlike the flavonol isorhamnetin that is, indeed, likely to display pro-oxidative activity (Figure 2B).

4. Conclusions

Taken together, submerged C. comatus F extract was most effective in neutralising DPPH radicals, while C. truncorum & C. comatus FB extracts were most effective in neutralising OH radicals. The aforementioned FB extracts also displayed potent FRAP values. According to PLSR analysis, fatty acid chemistry is suspected to predominantly affect anti-OH radical activity and FRAP value, while phenolic chemistry is likely to be the key one for the observed anti-DPPH radical activity. Consequently, design of new food supplements targeting OH radicals might be predominantly based on the various UFAs combinations (C18:2n6, C20:1, C20:2, C20:4n6, C22:2, C22:1n9, etc.)

Author Contributions

M.K., B.P. and M.Ž. designed this study, while K.A. performed most of the experimental work, kindly supported by A.N. and F.Š. K.S. was the key author responsible for statistics. M.K., K.A., B.P. and M.Ž. predominantly discussed the obtained data. Finally, K.A., M.K. and B.P. wrote this manuscript, while M.Ž. critically read it providing fruitful insights.

Funding

This work was kindly supported by the Ministry of Education, Science and Technological Development of the Republic of Serbia [Research Grants Nos. 173040, 172053, 172058, III 46001 and III43002].

Conflicts of Interest

No potential conflict of interest was reported by the authors.

References

  1. Karaman, M.; Stahl, M.; Vulić, J.; Vesić, M.; Canadanović-Brunet, J. Wild-growing lignicolous mushroom species as sources of novel agents with antioxidative and antibacterial potentials. Int. J. Food Sci. Nutr. 2014, 65, 311–319. [Google Scholar] [CrossRef] [PubMed]
  2. Janjušević, L.; Karaman, M.; Šibul, F.; Tommonaro, G.; Iodice, C.; Jakovljević, D.; Pejin, B. The lignicolous fngus Trametes versicolor (L.) Lloyd (1920): A promising natural source of antiradical and AChE inhibitory agents. J. Enzym. Inhib. Med. Chem. 2017, 32, 355–362. [Google Scholar] [CrossRef] [PubMed]
  3. Glumac, M.; Pejin, B.; Karaman, M.; Mojovic, M.; Matavulj, M. Lignicolous fungi hydrodistilled extracts may represent a promising source of natural phenolics. Nat. Prod. Res. 2017, 31, 104–107. [Google Scholar] [CrossRef] [PubMed]
  4. Karaman, M.; Tesanovic, K.; Gorjanovic, S.; Pastor, F.T.; Simonovic, M.; Glumac, M.; Pejin, B. Polarography as a technique of choice for the evaluation of total antioxidant activity: The case study of selected Coprinus comatus extracts and quinic acid, their antidiabetic ingredient. Nat. Prod. Res. 2019. [Google Scholar] [CrossRef]
  5. Li, B.; Lu, F.; Suo, X.; Nan, H.; Li, B. Antioxidant properties of cap and stipe from Coprinus comatus. Molecules 2010, 15, 1473–1486. [Google Scholar] [CrossRef]
  6. Akdemir, F.N.E.; Gülçin, I.; Karagöz, B.; Soslu, R. Quercetin protects rat skeletal muscle from ischemia reperfusion injury. J. Enzym. Inhib. Med. Chem. 2016, 31, 162–166. [Google Scholar] [CrossRef] [Green Version]
  7. Tešanović, K.; Pejin, B.; Šibul, F.; Matavulj, M.; Rašeta, M.; Janjušević, L.; Karaman, M. A comparative overview of antioxidative properties and phenolic profiles of different fungal origins: Fruiting bodies and submerged cultures of Coprinus comatus and Coprinellus truncorum. J. Food Sci. Technol. 2017, 54, 430–438. [Google Scholar] [CrossRef]
  8. Umeo, S.H.; Souza, G.P.N.; Rapachi, P.M.; Garcia, D.M.; Paccola-Meirelles, L.D.; Valle, J.S.; Linde, G.A. Screening of basidiomycetes in submerged cultivation based on antioxidant activity. Genet. Mol. Res. 2015, 14, 9907–9914. [Google Scholar] [CrossRef]
  9. Fazenda, M.L.; Seviour, R.; McNeil, B.; Harvey, L.M. Submerged culture fermentation of “higher fungi”: The Macrofungi. Adv. Appl. Microbiol. 2008, 63, 33–103. [Google Scholar]
  10. Mushtaq, M.Y.; Choi, Y.H.; Verpoorte, R.; Wilson, E.G. Extraction for metabolomics: Access to the metabolome. Phytochem. Anal. 2014, 25, 291–306. [Google Scholar] [CrossRef]
  11. González-Palma, I.; Escalona-Buendía, H.B.; Ponce-Alquicira, E.; Téllez-Téllez, M.; Gupta, V.K.; Díaz-Godínez, G.; Soriano-Santos, J. Evaluation of the antioxidant activity of aqueous and methanol extracts of Pleurotus ostreatus in different growth stages. Front. Microbiol. 2016, 7, 1099. [Google Scholar] [CrossRef] [PubMed]
  12. Dotan, N.; Wasser, S.P.; Mahajna, J. The culinary-medicinal mushroom Coprinus comatus as a natural antiandrogenic modulator. Integr. Cancer Ther. 2011, 10, 148–159. [Google Scholar] [CrossRef] [PubMed]
  13. Vaz, J.A.; Barros, L.; Martins, A.; Santos-Buelga, C.; Vasconcelos, M.H.; Ferreira, I.C.F.R. Chemical composition of wild edible mushrooms and antioxidant properties of their water soluble polysaccharidic and ethanolic fractions. Food Chem. 2011, 126, 610–616. [Google Scholar] [CrossRef] [Green Version]
  14. Stojković, D.; Reis, F.; Barros, L.; Glamočija, J.; Ćirić, A.; Griensven, L.; Soković, M.; Ferreira, I. Nutrients and non-nutrients composition and bioactivity of wild and cultivated Coprinus comatus (O. F. M Müll.) Pers. Food Chem. Toxicol. 2013, 59, 289–296. [Google Scholar]
  15. Badalyan, M.S. Fatty acid composition of different collections of Coprinoid mushrooms (Agaricomycetes) and their nutritional and medicinal values. Int. J. Med. Mushrooms 2016, 18, 883–893. [Google Scholar] [CrossRef]
  16. Lima, A.R.S.L.; Alves, M.A.T.; Zani, L.C.; Pimenta, P.S.L.; Boaventura, D.M.A. Antioxidant and cytotoxic potential of fatty acid methyl esters from the seeds of Annona cornifolia A. St.-Hil. (Annonaceae). Food Res. Int. 2012, 48, 873–875. [Google Scholar] [CrossRef]
  17. Di Nunzio, M.; Valli, V.; Bordoni, A. PUFA and oxidative stress. Differential modulation of the cell response by DHA. Int. J. Food Sci. Nutr. 2016, 67, 834–843. [Google Scholar] [CrossRef]
  18. Espin, C.J.; Soler-Rivas, G.; Wichers, J.H. Characterization of the total free radical scavenger capacity of vegetable oils and oil fractions using 2,2-diphenyl-1-picrylhydrazyl radical. J. Agric. Food Chem. 2000, 48, 648–656. [Google Scholar] [CrossRef]
  19. Halliwell, B.; Gutteridge, J.M.C.; Aruoma, O.I. The deoxyribose method: A simple test tube assay for determination of rate constants for reaction of hydroxyl radical. Anal. Biochem. 1987, 165, 215–219. [Google Scholar] [CrossRef]
  20. Benzie, I.F.F.; Strain, J.J. Ferric reducing antioxidant power assay: Direct measure of total antioxidant activity of biological fluids and modified version for simultaneous measurement of total antioxidant power and ascorbic acid and concentration. Methods Enzym. 1999, 299, 15–17. [Google Scholar]
  21. Orčić, D.; Francišković, M.; Bekvalac, K.; Svirčev, E.; Beara, I.; Lesjak, M.; Mimica Dukic, N. Quantitative determination of plant phenolics in Urtica dioica extracts by high-performance liquid chromatography coupled with tandem mass spectrometric detection. Food Chem. 2014, 143, 48–53. [Google Scholar] [CrossRef] [PubMed]
  22. Milovanović, I.; Misan, A.; Sarić, B.; Kos, J.; Mandić, A.; Simeunovic, J.; Kovač, D. Evaluation of protein and lipid content and determination of fatty acid profile in selected species of cyanobacteria. In Proceedings of the 6th Proceedings of the Central European Congress on Food CEFood, Novi Sad, Serbia, 23–26 May 2012; Lević, J., Ed.; Institute of Food Technology Novi Sad, University of Novi Sad: Novi Sad, Serbia, 2012. [Google Scholar]
  23. Asatiani, M.; Elisashvili, V.; Wasser, S.; Reznick, A.; Eviatar, N. Free-radical scavenging activity of submerged mycelium extracts from higher basidiomycetes mushrooms. Biosci. Biotechnol. Biochem. 2007, 71, 3090–3092. [Google Scholar] [CrossRef] [PubMed]
  24. Rice Evans, C.A.; Miller, N.J.; Paganga, G. Antioxidant properties of phenolic compounds. Trends Plant Sci. 1997, 2, 152–159. [Google Scholar] [CrossRef]
  25. Pero, R.W.; Lund, H.; Leanderson, T. Antioxidant metabolism induced by quinic acid. Increased urinary excretion of tryptophan and nicotinamide. Phytother. Res. 2009, 23, 335–346. [Google Scholar] [CrossRef] [PubMed]
  26. Li, X.; Wang, X.; Chen, D.; Chen, S. Antioxidant activity and mechanism of protocatechuic acid in vitro. FFHD 2011, 7, 232–244. [Google Scholar]
  27. Semaming, Y.; Pannengpetch, P.; Chattipakorn, C.S.; Chattipakorn, N. Pharmacological properties of protocatechuic acid and its potential roles as complementary medicine. eCAM 2015, 2015, 593902. [Google Scholar] [CrossRef]
  28. Kim, M.Y.; Seguin, P.; Ahn, J.K.; Kim, J.J.; Chun, S.C.; Kim, E.H.; Seo, S.H.; Kang, E.Y.; Kim, S.L.; Park, Y.J.; et al. Phenolic compound concentration and antioxidant activities of edible and medicinal mushrooms from Korea. J. Agric. Food Chem. 2008, 56, 7265–7270. [Google Scholar] [CrossRef]
  29. Foti, P.; Erba, D.; Riso, P.; Spadafranca, A.; Criscuoli, F.; Testolin, G. Comparison between daidzein and genistein antioxidant activity in primary and cancer lymphocytes. Arch. Biochem. Biophys. 2005, 433, 421–427. [Google Scholar] [CrossRef]
  30. Rüfer, C.E.; Kulling, S.E. Antioxidant activity of isoflavones and their major metabolites using different in vitro assays. J. Agric. Food Chem. 2006, 54, 2926–2931. [Google Scholar] [CrossRef]
  31. Dornstauder, E.; Jisa, E.; Unterrieder, I.; Krenn, L.; Kubelka, W.; Jungbauer, A. Estrogenic activity of two standardized red clover extracts (Menoflavon®) intended for large scale use in hormone replacement therapy. J. Steroid Biochem. Mol. Biol. 2001, 78, 67–75. [Google Scholar] [CrossRef]
  32. Tai, A.; Sawano, T.; Ito, H. Antioxidative properties of vanillic acid esters in multiple antioxidant assays. Biosci. Biotechnol. Biochem. 2012, 76, 314–318. [Google Scholar] [CrossRef] [PubMed]
  33. Kumar, S.; Prahalathan, P.; Raja, B. Antihypertensive and antioxidant potential of vanillic acid, a phenolic compound in L-NAME-induced hypertensive rats: A dose-dependence study. Redox. Rep. 2011, 16, 208–215. [Google Scholar] [CrossRef] [PubMed]
  34. Yilmaz, N.; Solmaz, M.; Turkekul, I.; Elmastas, M. Fatty acid composition in some wild edible mushrooms growing in the middle Black Sea region of Turkey. Food Chem. 2006, 99, 168–174. [Google Scholar] [CrossRef]
  35. Ergonul, P.G.; Ergonul, B.; Kalyoncu, F.; Akata, I. Fatty acid compositions of five wild edible mushroom species collected from Turkey. Int. J. Pharm. 2012, 8, 463–466. [Google Scholar] [CrossRef]
  36. Shoeb, M.; Mondal, P.; Kylin, H.; Nahara, N. Chemical and biological activity of mushrooms naturally occurring in Bangladesh. Asian J. Pharmacogn. 2017, 1, 42–51. [Google Scholar]
  37. Huang, H.L.; Wang, B.G. Antioxidant capacity and lipophilic content of seaweeds collected from the Qingdao coastline. J. Agric. Food Chem. 2004, 52, 4993–4997. [Google Scholar] [CrossRef]
  38. Wold, S.; Sjostrom, M.; Eriksson, L. PLS-regression: A basic tool of chemometrics. Chemom. Intell. Lab. Syst. 2001, 58, 109–130. [Google Scholar] [CrossRef]
Figure 1. Partial least squares regression (PLSR) analysis for antioxidant potential. (A) Correlations between the AO activity of all extracts and their fatty acid profiles; (B) Correlations between the AO activity of all extracts and their phenolic profiles; (t1, t2)—first two PLSR components.
Antioxidants 08 00480 g001
Figure 2. A separate one-component PLSR model for each dependent variable. The variation in the AO activity of the extracts in regard to fatty acid and phenolic profiles estimated by DPPH (A,B), OH (C,D) and FRAP (E,F) assays.
Antioxidants 08 00480 g002
Table 1. Antioxidant activity of the methanolic extracts of the mushrooms Coprinus comatus and Coprinellus truncorum. FB—Fruiting Body; M—Mycelium; F—Filtrate; DPPH—DPPH assay; OH—OH assay; FRAP—FRAP assay; AAE—ascorbic acid equivalents.
ExtractsDPPH (IC50) (μg/mL)OH (IC50) (μg/mL)FRAP (mg AAE g d.w.)
C. comatus
FB172.74 ± 7.10 f6.65 ± 1.99 a81.05 ± 5.91 a
M33.99 ± 5.48 b55.80 ± 12.13 d27.28 ± 2.58 c
F22.34 ± 4.32 а24.50 ± 13.70 b27.17 ± 2.63 c
C. truncorum
FB96.66 ± 5.79 e5.62 ± 1.21 a68.26 ± 2.71 b
M54.98 ± 1.79 d69.06 ± 19.11 e29.92 ± 2.50 c
F46.25 ± 4.38 c41.90 ± 2.30 c14.01 ± 2.03 d
a,b,c,d,e,f Significant differences between extracts were determined by Tukey HSD test at p < 0.01. In each column different letters mean significant differences (Tukey, HSD, ANOVA). The difference is related both to the analysed species and samples (FB, M and F extracts). Bold values stand for the most promising biological activities.
Table 2. The content of phenolic compounds in the analysed samples (µg/g).
ClassCompoundExtracts
CcFB MeOHCcM MeOHCcF MeOHCtFB MeOHCtM MeOHCtF MeOH
FlavonesCrysoeriol0.1680.131n.d.n.d.n.d.n.d.
Vitexin0.1950.572n.d.n.d.n.d.0.300
Apigenin-7-O-glucoside0.4370.4240.1830.1200.1120.255
Luteolin-7-O-glucoside0.3620.1620.1680.1030.1030.168
Apiinn.d.0.340n.d.0.170n.d.0.170
Baicalin3.96n.d.n.d.n.d.n.d.n.d.
FlavonolsIsorhamnetin3.902.842.252.692.692.77
Kaempferol-3-O-glucoside0.4370.4540.229n.d.0.1400.281
Hyperosiden.d.n.d.0.106n.d.n.d.n.d.
Quercetin-3-O-glucosiden.d.n.d.0.128n.d.n.d.n.d.
FlavanolsCatechinn.d.6.7912.713.14.716.61
Epicatechinn.d.n.d.8.708.70n.d.n.d.
BiflavonoidsAmentoflavone0.294n.d.0.118n.d.n.d.n.d.
IsoflavonoidsDaidzeinn.d.38.743.1n.d.2.949.01
Genisteinn.d.22.618.1n.d.1.643.48
Hydroxybenzoic acidsp-Hydroxybenzoic acid11.22977521455.2088.4
Protocatechuic acid1.7125.065.33.764.8720.6
Vanillic acidn.d.23.442.2n.d.29.1n.d.
Gallic acidn.d.n.d.7.93n.d.5.46n.d.
Gentisic acidn.d.0.264n.d.1.09n.d.n.d.
Hydroxycinnamic acidsCinnamic acid29.728.224.366.8n.d.19.4
p-Coumaric acid2.363.442.9240.61.2811.3
o-Coumaric acidn.d.n.d.0.384n.d.0.2621.44
Caffeic acid0.6640.6640.6641.881.811.39
CoumarinsEsculetinn.d.0.481n.d.0.511n.d.n.d.
Umbelliferonen.d.n.d.n.d.1.040.936n.d.
Cyclohexanecarboxylic acidsQuinic acid13237.35.7710458087.7
Chlorogenic acids5-O-Caffeoylquinic acid2.170.6410.481n.d.n.d.0.641
Total 189.55489.38987.73389.56641.25253.91
a not detected—peak not observed, the content is lower than the LOD; CcFB—C. comatus fruiting body; CcM—C. comatus mycelia; CcF—C. comatus filtrate; CtFB—C. truncorum fruiting body; CtM—C. truncorum mycelia; CtF—C. truncorum filtrate; MeOH—methanolic extract. Bold values highlight the importance of the relevant contents.
Table 3. The content of fatty acid compounds in the analysed samples (relative %).
Fatty Acid Carbon NumbersCommon Names (Acid)C. comatus FBC. truncorum FBC. comatus MC. comatus FC. truncorum MC. truncorum F
%
C6:0Caproic0.210.16n.d.n.d.n.d.n.d.
C8:0Caprylic0.090.08n.d.n.d.n.d.n.d.
C12:0Lauricn.d.0.05n.d.n.d.n.d.n.d.
C14:0Myristic0.400.170.24n.d.0.423.04
C14:1Myristoleicn.d.n.d.n.d.12.52n.d.n.d.
C15:0Pentadecanoic0.310.170.50n.d.0.59n.d.
C16:0Palmitic13.3212.3913.5428.5816.1522.85
C16:1Palmitoleic0.832.040.523.740.36n.d.
C17:0Heptadecanoic0.110.090.36n.d.0.30n.d.
C17:1Heptadecanoic (cis-10)0.110.460.35n.d.n.d.n.d.
C18:0Stearic0.780.922.736.702.6611.55
C18:1n9cOleic4.329.0820.2813.627.216.55
C18:2n6cLinoleic74.1970.0951.4132.5969.9516.94
C20:0Arachidicn.d.0.05n.d.n.d.n.d.n.d.
C20:1Gondoic2.110.24n.d.n.d.n.d.n.d.
C18:3n3α-Linolenic n.d0.156.782.240.641.75
C20:2Eicosadienoic0.470.20n.d.n.d.n.d.n.d.
C22:0Behenic0.250.260.35n.d.0.35n.d.
C20:3n6Dihomo-gamma-linolenicn.d.n.d.0.64n.d.n.d.n.d.
C22:1n9Erucic0.080.150.10n.d.0.06n.d.
C20:3n3Eicosatrienoicn.d.n.d.0.12n.d.n.d.n.d.
C20:4n6Arachidonic0.080.09n.d.n.d.0.09n.d.
C23:0Tricosylic0.100.07n.d.n.d.n.d.n.d.
C22:2Docosadienoic1.321.75n.d.n.d.n.d.n.d.
C24:0Lignoceric0.730.500.09n.d.n.d.n.d.
C20:5n3Eicosapentaenoic0.200.751.21n.d.1.2137.31
C24:1Nervonicn.d.n.d.0.79n.d.n.d.n.d.
C22:6n3Docosahexaenoicn.d.0.08n.d.n.d.n.d.n.d.
SFA 16.2914.9217.8035.2920.4837.44
MUFA 7.4611.9722.0329.887.636.55
PUFA 76.2573.1160.1634.8371.8956.01
UFA 83.7185.0882.2064.7179.5262.56
UFA—unsaturated fatty acid; MUFA—mono-unsaturated fatty acids; PUFA—poly-unsaturated fatty acids, SFA—saturated fatty acids, n.d.—not detected. Bold values highlight the importance of the relevant contents.

